a regional refinement for finite element mesh...
TRANSCRIPT

Proceedings
BEST PRACTICES: SYNCHRONIZING THE
CORPORATE CULTURE WITH THE SPIRIT OF INNOVATION, SUSTAINABILITY, AND
GOOD GOVERNANCE
The Metropole Hotel Phuket, 25th - 27th July 2019
Editors: Eddy Madiono Sutanto, Halimin Herjanto,
Jashim Khan, Jati Kusuma Ali, Evan Lau, Annie Stephanie Banikema,
John Francis Diaz
Published: Institute for Research and Community Outreach
PETRA PRESS Petra Christian University
Surabaya

Proceedings
Scientific Committee: Chairman : Assoc. Prof. Dr. Drs. Eddy Madiono Sutanto, M.Sc. (Indonesia) Member : Asst. Prof. Halimin Herjanto, Ph.D. (USA) Assoc. Prof. Annie Stephanie Banikema, Ph.D. (France) Prof. Pável Reyes Mercado, Ph.D. (Mexico) Assoc. Prof. Jashim Khan, Ph.D. (UK) Assoc. Prof. Jati Kasuma Ali, Ph.D. (Malaysia) Assoc. Prof. Evan Lau, Ph.D. (Malaysia) Prof. Richard Von Llewelyn, Ph.D. (USA) Prof. Dr. Hitesh Shukla (India) Prof. Christantius Dwiatmadja, S.E., M.E., Ph.D. (Indonesia) Prof. Dr. Sri Wahjuni Astuti, S.E., M.Si. (Indonesia) Sony Kusumasondjaja, Ph.D. (Indonesia) Dr. Elia Ardyan, S.E., MBA (Indonesia) Dr. Dody Hapsoro, MSPA, MBA. Ak. (Indonesia) Assoc. Prof. John Francis Diaz, Ph.D. (Taiwan) Joint Organizing Committee: Conference Chair I : Asst. Prof. Dr. Hiran Prasarnkarn (Phuket Rajabhat University, Thailand) Conference Chair II : Assoc. Prof. Dr. Drs. Eddy Madiono Sutanto, M.Sc. (Petra Christian Uni-
versity, Indonesia) Secretary : Dr. Anusara Sawangchai (Phuket Rajabhat University, Thailand) Treasurer : Dr. Nattawut Sittichai (Phuket Rajabhat University, Thailand) Marketing Communication : Asst. Prof. Dr. Noppadol Chanrawang (Phuket Rajabhat University, Thailand) Programs : Mr. Nimit Soonsan (Phuket Rajabhat University, Thailand) Dr. Chidchanok Anantamongkolkul (Phuket Rajabhat University, Thailand) Dr.Nattawut Sittichai (Phuket Rajabhat University, Thailand) Accommodation : Mr. Phipop Somwetee, Mr. Teerapan Sangunwang (Phuket Rajabhat
University, Thailand) Documentation : Asst. Prof. Dr.Jiraporn Prasarnkarn (Phuket Rajabhat University, Thailand) Transportation : Mr. Nitiphong Tonnum, Ms. Pannawadee Kittiudomrat (Phuket Rajabhat
University, Thailand) Registration : Asst. Prof. Wanida Hancharoen, Ms. Pimpika Poonsawat (Phuket Rajabhat
University, Thailand) Ms. Teeraporn Bamrungphol (Phuket Rajabhat University, Thailand) Sponsorship : Dr. Boonsuppa Tanthai (Phuket Rajabhat University, Thailand)
Published:
Institute for Research and Community Outreach
PETRA PRESSPetra Christian University
Jl. Siwalankerto 121-131, Surabaya 60236, Indonesia
Phone: (031) 2983111, 2983139
ISBN 978-602-5446-15-3
PREFACE
Transformation into digitalization has taken over all aspects of business in year 2019. Success in converting
to transformation requires careful co-operation, planning and participation. Over the years, we have seen a
change in a role of traditional leadership workplace. Innovation and sustainability are becoming the driving
engines for corporations to strive in the more complex globalized market. As businesses are moving across
national and cultural borders, good corporate governance is then playing an important role to ensure the
sustainability of the business.
With this current situation, The Business Management Program of Petra Christian University cooperation
with The Business Management Program of Phuket Rajabhat University conducts the third international
conference on management and entrepreneurship (the 3rd i-CoME) to address the issues on innovation,
sustainability, and governance. This conference is made possible with the support of Jurnal Manajemen dan
Kewirausahaan (Journal of Management & Entrepreneurship), an accredited scientific journal, and several
other accredited journals. The conference will present six keynote speakers from six different countries such
as USA, UK-China, Mexico, and India.
This conference is also calling for research articles and papers from scholars, researchers, and students from
all over the world. There are six sub-themes with various topics covering on management and
entrepreneurship that are ready to be explored and discussed. The conference will be a forum where fellow
academics share experiences, exchange knowledge, work hand-in-hand, utilize a new technology, and find
managerial solutions for a better business world. The detailed information is available in the i-CoME 2019
website: i-come.petra.ac.id.
Indonesia, August 9, 2019
Editor

iv
v
TABLE OF CONTENTS
PREFACE iii
CONTENTS v
LIST OF PAPERS
THE PRESENT CONDITIONS OF THE SMES IN THE ANDAMAN TRIANGLE CLUSTER
SOUTHERN OF THAILAND
Anusara Sawangchai, Hiran Prasarnkarn, Noppadol Chanrawang, Wanida Hancharoen, Phipop
Somwaythee 1–7
THE EFFECTS OF PRIVILEGE FUNDS ON PUBLIC WELFARE AND POVERTY IN
SPECIAL DISTRICT OF YOGYAKARTA
Rudy Badrudin, Baniady Gennody Pronosokodewo 8–19
ADVERTISING KIDAL TEMPLE AS A TOURISM SITE IN THE DISTRICT OF MALANG
THROUGH THE CREATION OF HAND PAINTED BATIK OF GARUDEYA STORY
Lisa Sidyawati 20–29
ENHANCING MICRO-ENTREPRENEURS’ BUSINESS ACTIVITIES VIA SMART MOBILE
DEVICES: A CASE STUDY OF PHUKET
Vinyu Veerayangkur 30–39
FACTORS THAT INFLUENCE MINORITY ENTREPRENEURS IN DEVELOPING A BUSINESS
Mutia Tri Satya, Abdul Fidayan 40–51
MORATORIUM OF SACRED TEMPLE AREA AS A TOURIST ATTRACTION
Putri Kusuma Sanjiwani, Luh Putu Kerti Pujani 52–60
EMPIRICAL STUDY OF RISK-TAKING ABILITY FACTOR OF STUDENTS’ ENTREPRENEUR-
SHIP INTENTION
Tusshar Mahajan 61–65
BUSINESS FAILURE OF FAMILY BUSINESS: A CASE IN MINING INDUSTRY INDONESIA ITS
IMPLICATIONS FOR FUTURE BUSINESS SUCCESS
Liliana Dewi, Eko Budi Santoso, Kazia Laturette I Gusti Bagus Yosia Wiryakusuma 66–70
A NEW MODEL OF CUSTOMER HELPING BEHAVIOR
Erin McGuinness, Halimin Herjanto, Alexandra Chilicki 71–75
THE INFLUENCE OF KNOWLEDGE, ATTITUDE AND FINANCIAL BEHAVIOR ON PERSONAL
FINANCIAL MANAGEMENT AMONG THE GOVERNMENT EMPLOYEES AT TWO HEALTH
CENTERS
Caecilia Wahyu Estining Rahayu, Christina Heti Tri Rahmawati 76–84
THE COCOON AND SHALLOT FOR BEAUTY: INNOVATION OF THAI WISDOM IN
COMMUNITY PRODUCT DEVELOPMENT THE SUFFICIENCY ECONOMY PHILOSOPHY
Theerakan Pokaew, Supatanachai Pokaew 85–91
TRI NING DANU SUSTAINABLE TOURISM DESTINATION MODEL IN BEDUGUL TOURISM
AREA, BALI
I Nyoman Sunarta, I Nyoman Sukma Arida, I Made Adikampana, Saptono Nugroho, Ni Made Sofia Wijaya 92–97
GASTRONOMY TOURISM IN UBUD
Putu Sucita Yanthy, Ni Nyoman Sri Aryanti 98–104
ANALYSIS THE IMPACT OF CAPITAL STRUCTURE AND PROFITABILITY ON DIVIDEND
POLICY: CASE STUDY OF MANUFACTURING FIRM IN INDONESIA
Miswanto Miswanto, Fajar Ardy Prasetyo 105–113

vi
FINANCING OF WORKING CAPITAL REQUIREMENTS AND PROFITABILITY OF THE
INDONESIAN COMPANIES IN BASIC INDUSTRY AND CHEMICALS SECTOR
Lukas Purwoto 114–121
RETAIL COMPANY PERFORMANCE IN INDONESIA BASED ON FINANCIAL RATIO
ANALYSIS: WARREN BUFFETT’S PERSPECTIVE
Ima Kristina Yulita, Caecilia Wahyu Estining Rahayu 122–131
THE EFFECT OF ERP PRACTICE, SCM PRACTICE, TO PRODUCTION PERFORMANCE WITH IT
INFRASTRUCTURE AS A MODERATING
Zeplin Jiwa Husada Tarigan, Hotlan Siagian, Widjojo Suprapto, Sautma Ronni Basana 132–138
THE EFFECT OF ENTERPRISE RESOURCE PLANNING ON COMPETITIVE ADVANTAGE
THROUGH SUPPLIER RELATIONSHIP MANAGEMENT
Hotlan Siagian, Zeplin Jiwa Husada Tarigan
136–145
WHAT WE KNOW AND WHAT WE NEED TO KNOW ON PUBLIC PROCUREMENT OF
INNOVATIONS: A RESEARCH AGENDA
Pável Reyes-Mercado 146–151
EARNINGS QUALITY AND IPO UNDERPRICING IN INDONESIA
Billy Purnawan, Stevanus Pangestu 152–157
1
3rd International Conference on Management & Entrepreneurship (3rd i-CoME) ISBN 978-602-5446-15-3
Phuket, 25th – 27th July 2019
THE PRESENT CONDITIONS OF THE SMES IN THE ANDAMAN
TRIANGLE CLUSTER SOUTHERN OF THAILAND
Anusara Sawangchai
1, Hiran Prasarnkarn
2, Noppadol Chanrawang
3, Wanida Hancharoen
4,
Phipop Somwaythee5
1,2,3,4,5 Entrepreneurship Program, Faculty of Management Science, Phuket Rajabhat University
Email: [email protected]; [email protected]
4;
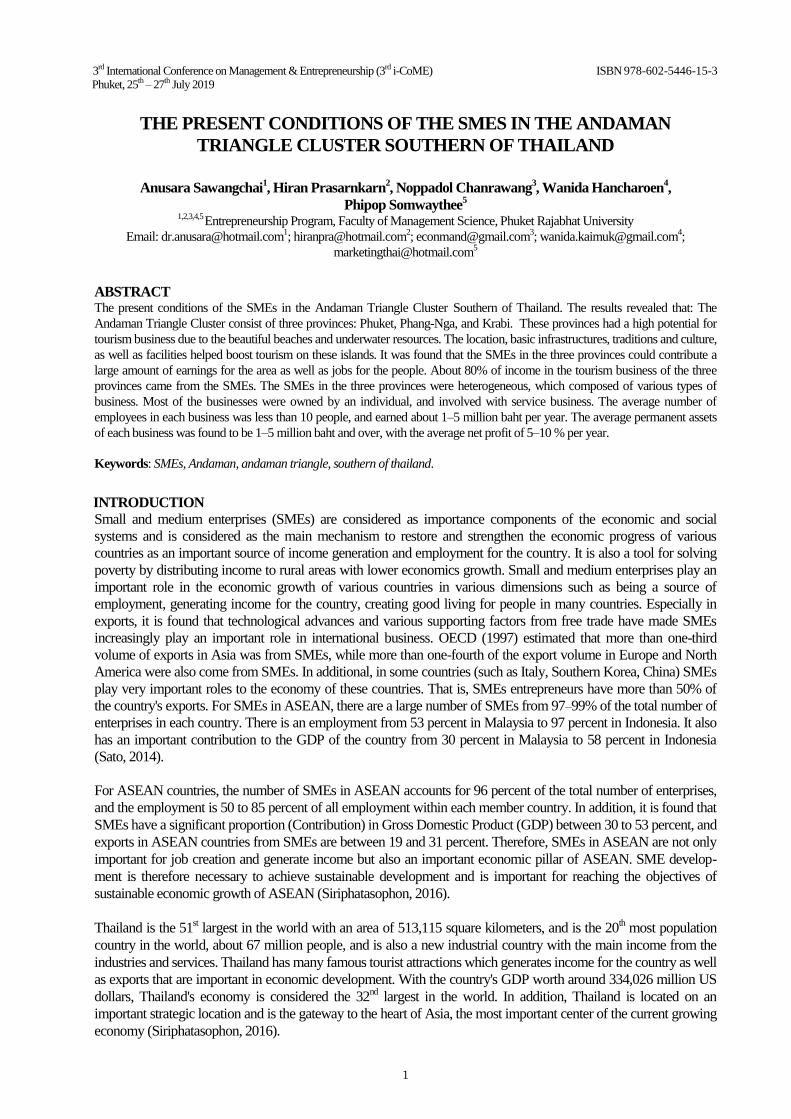
ABSTRACT The present conditions of the SMEs in the Andaman Triangle Cluster Southern of Thailand. The results revealed that: The
Andaman Triangle Cluster consist of three provinces: Phuket, Phang-Nga, and Krabi. These provinces had a high potential for
tourism business due to the beautiful beaches and underwater resources. The location, basic infrastructures, traditions and culture,
as well as facilities helped boost tourism on these islands. It was found that the SMEs in the three provinces could contribute a
large amount of earnings for the area as well as jobs for the people. About 80% of income in the tourism business of the three
provinces came from the SMEs. The SMEs in the three provinces were heterogeneous, which composed of various types of
business. Most of the businesses were owned by an individual, and involved with service business. The average number of
employees in each business was less than 10 people, and earned about 1–5 million baht per year. The average permanent assets
of each business was found to be 1–5 million baht and over, with the average net profit of 5–10 % per year.
Keywords: SMEs, Andaman, andaman triangle, southern of thailand.
INTRODUCTION Small and medium enterprises (SMEs) are considered as importance components of the economic and social
systems and is considered as the main mechanism to restore and strengthen the economic progress of various
countries as an important source of income generation and employment for the country. It is also a tool for solving
poverty by distributing income to rural areas with lower economics growth. Small and medium enterprises play an
important role in the economic growth of various countries in various dimensions such as being a source of
employment, generating income for the country, creating good living for people in many countries. Especially in
exports, it is found that technological advances and various supporting factors from free trade have made SMEs
increasingly play an important role in international business. OECD (1997) estimated that more than one-third
volume of exports in Asia was from SMEs, while more than one-fourth of the export volume in Europe and North
America were also come from SMEs. In additional, in some countries (such as Italy, Southern Korea, China) SMEs
play very important roles to the economy of these countries. That is, SMEs entrepreneurs have more than 50% of
the country's exports. For SMEs in ASEAN, there are a large number of SMEs from 97–99% of the total number of
enterprises in each country. There is an employment from 53 percent in Malaysia to 97 percent in Indonesia. It also
has an important contribution to the GDP of the country from 30 percent in Malaysia to 58 percent in Indonesia
(Sato, 2014).
For ASEAN countries, the number of SMEs in ASEAN accounts for 96 percent of the total number of enterprises,
and the employment is 50 to 85 percent of all employment within each member country. In addition, it is found that
SMEs have a significant proportion (Contribution) in Gross Domestic Product (GDP) between 30 to 53 percent, and
exports in ASEAN countries from SMEs are between 19 and 31 percent. Therefore, SMEs in ASEAN are not only
important for job creation and generate income but also an important economic pillar of ASEAN. SME develop-
ment is therefore necessary to achieve sustainable development and is important for reaching the objectives of
sustainable economic growth of ASEAN (Siriphatasophon, 2016).
Thailand is the 51st largest in the world with an area of 513,115 square kilometers, and is the 20
th most population
country in the world, about 67 million people, and is also a new industrial country with the main income from the
industries and services. Thailand has many famous tourist attractions which generates income for the country as well
as exports that are important in economic development. With the country's GDP worth around 334,026 million US
dollars, Thailand's economy is considered the 32nd
largest in the world. In addition, Thailand is located on an
important strategic location and is the gateway to the heart of Asia, the most important center of the current growing
economy (Siriphatasophon, 2016).

Anusara S., Hiran P., Noppadol C., Wanida H., and Phipop S.
2
The importance of SMEs makes the government agencies of many countries, including Thailand, determine various
measures to promote and support in many ways to improve its weaknesses, including setting up a specialized unit to
set policies and specific promotion plans in the same ways like other ASEAN member countries which is to focus
on pushing for SMEs to have more potential and competitiveness. The agencies that are responsible for promoting
and supporting small and medium enterprises in Thailand are the Office of Small and Medium Enterprises
Promotion (OSMEP). The main task of OSMEP is to set the policies and the potential development plan of SMEs
entrepreneurs. Therefore, OSMEP has developed the 3rd SMEs promotion plan (2012–2016). In this development of
the plan, there was a consideration of linking with the relevant plans, such as the 11th National Economic and Social
Development Plan (2012–2016), strategic plans of various ministries as well as provincial development plans.
(Office of Small and Medium Enterprises Promotion, 2015)
When analyzing the environment and potential of Thai SMEs, it is found that the strengths of Thai SMEs are having
artistic skills and service mind. If Thai wisdom is able to apply in products and services, it will enhance Thai
products to be more prominent. However, the potential development of Thai enterprises in the past often faced with
low ability to access capital, resulting in less use of modern technology and lack of research and development. In
addition, Thai SMEs still have weaknesses in other areas such as traditional management, foreign language
communication which is still limited to many groups and enterprises that still lack communication with government
agencies due to the establishment of an unauthorized organizations. Recognizing such weaknesses, many govern-
ment agencies in Thailand try to promote and support in various areas such as finance, marketing, administration
and the introduction of new innovations and improvements of government agencies’ operation to be more concise
and agile (OSMEP, 2014).
An important motive that makes a lot of people enter into small and medium enterprises (SMEs) is a low difficulty
in the establishment of small and medium enterprises (SMEs), independent operation, flexible management and
lower operating costs than large enterprises. The operation of small and medium enterprises (SMEs), whether in the
form of a single owner, partnership or company, all have the same investment goal which is profit from investments.
However, there are many entrepreneurs who do not success as targeted in the current economy. Many businesses
lack liquidity, working capital, or receiving reduced profits resulting in the termination of workers partly due to the
lack of strength in provincial businesses. 90 percent of the failures of small and medium enterprises (SMEs) come
from the lack of business management skills or ability, etc. (Rumakom, 1997). Therefore, the promotion and
development of small and medium enterprises (SMEs) is therefore a matter that the concerned agencies should pay
great attention to help businesses to succeed.
The southern part of Thailand is another place that has a variety of tourist attractions, and they are also quality tourist
attractions in both natural attractions and cultural attractions and other tourist attractions. Especially in the Andaman
Triangle, it consists of three provinces, namely Phuket, Phang-Nga, and Krabi. They are provinces with major,
world-famous tourist selling point of the country. It can be seen that the importance of the Andaman Triangle
Province is that it is a group of provinces with tourism potential, full of tourism resources as a tourist attraction that
generates income for Thailand and creating a lot of jobs for the people. From the growth of tourism, it results in the
increasing number of small and medium enterprises, and the business managements are varied in different charac-
teristics and management methods according to the basis of entrepreneurs. Different business operations often en-
counter different problems, therefore, the study of the status of small and medium enterprises in the Andaman
Triangle must focus on developing SMEs and expanding the results.
LITERATURE REVIEW
Key Characteristics of Small and Medium Enterprises (SMEs)
Department of Industrial Promotion, Ministry of Industry (2002), has defined the characteristics of small and
medium enterprises (SMEs) which have two defining criteria, which is, to define from the advance value of fixed
assets and the number of employments for each type of business. The criteria for classifying small and medium
enterprises (SMEs) of the Ministry of Industry are defined as follows:

The Present Conditions of the SMES in the Andaman Triangle Cluster Southern, pp. 1–7
3
Table 1
Criteria for Classifying Small and Medium Enterprises (SMEs) of the Ministry of Industry
Establishment Fixed Asset Value Number of Employments
Medium Business Small Business Medium Business Small Businesses
Production Up to 200 million baht Up to 50 million baht Up to 200 people up to 50
Trading Wholesale Retail Up to 100 million baht
Up to 60 million baht
Up to 50 million baht
Up to 30 million baht
Up to 50 people,
Up to 30 people,
Up to 25 people,
Up to 15 people
Services Up to 200 million
baht,
Up to 50 million baht, Up to 200 people, Up to 50 people
Source: Department of Industrial Promotion, Ministry of Industry, 2002.
Characteristics of small and medium enterprises (SMEs).
Any occupation is different depending on the nature of the process. The small and medium enterprises (SMEs) have
the following features that should be known (Manjaiarn, 2014):
1. Easy accessing to the business because of low funds and facilities for business establishment. If the problem of
loss occurs during the operation, the recovery is easier than a large business.
2. Flexibility in management. Entrepreneurs can control the business thoroughly and closely.
3. Business operations, regardless the business is the manufacturing, distribution or service provision, are highly
flexible, in line with the production and trade era that requires fast response as well as the production and trade
that focus on a variety of forms or services rather than focusing on quantity.
4. Able to create specific expertise to achieve efficiency.
Problems of Small and Medium Enterprises in Thailand.
Problems and obstacles occur in every type of business operation that may hinder the progress of the business and
undermine the encouragement of entrepreneurs. They may occur from all directions both from the external environ-
ment that affects the business and the potential limitations of the business itself. Many small and medium business
entrepreneurs in Thailand face many problems. The problems that are often encountered can be summarized as
follows (Srisom, 2000).
Marketing problems. Small and medium enterprises are most likely to meet the needs of local markets or domestic
market but they still lack the knowledge and ability in other marketing especially the international market. At the
same time, the ease of transportation as well as trade liberalization makes large enterprises and foreign products
come to compete with local or country’s products produced by small and medium-sized enterprises. Shortage of
funds. Small and medium enterprises often face problems in requesting loans from financial institutions to invest or
expand investments or as working capital. This is because there is no systematic accounting and lack of loan
guarantee causing them to rely on informal loan and have to pay high interest rates. Labor issues. Workers working
in small and medium enterprises have high turnover problems, that is, when they are more skilled, they will move
out to work in a large factory with better systems and rewards, therefore, resulting in uneven quality of labor and
discrete development affecting the production efficiency and product quality.
Production technology problems. In general, small and medium enterprises often use uncomplicated manufacturing
techniques because of low investment and the employees lack basic knowledge that supports modern academic
techniques. It leads to a lack in development of product models as well as developing good quality standards. Mana-
gement limitations. Small and medium enterprises often lack knowledge in management or system administration.
They often rely on the experience of learning from mistakes and on family members or relatives for helping hands.
In this type of administration, despite the advantages of thorough care if the business is not large, but when the
business begins to expand, if the management is not improved to be systematic, it will cause problems. Accessing
government promotion. A large number of small and medium enterprises are often informal establishments, such as
production at home, row house factories without factory registration, commercial registration or trade registration.
These enterprises or factories often close themselves from using government services. Even businesses or factories
that are registered correctly, often do not want to interfere with government agencies due to their incorrect behavior
in tax payment, environmental preservation, and safety provision as determined in law. In addition, it is the same in
investment promotion. Although the government has reduced investment and employment conditions or has moti-
vated small and medium enterprises to propose for more investment promotion, however, from the research data, it
is found that only 8.1% of small and medium enterprises have the opportunity to receive government investment
promotion.

Anusara S., Hiran P., Noppadol C., Wanida H., and Phipop S.
4
Service limitations, development promotion of public and private organizations. Promotion and development of
small and medium enterprises in the past were carried out by relevant government and private agencies such as the
Department of Industrial Promotion, Department of Skill Development, Department of Export Promotion, Office of
the Board of Investment, Industrial Finance Corporation of Thailand as well as various trade and industry associa-
tions. However, because of the small and medium sized industries are many and scattered throughout the country
together with the limitations of such agencies, such as in terms of personnel, budget, number of branch offices in the
region, the support provisions in various areas are not be able to respond thoroughly and adequately. Limitation of
information awareness. Due to various problems and limitations above, small and medium enterprises generally
have weaknesses in receiving news on various aspects, such as government policies and measures, marketing infor-
mation, etc.
Review of basic knowledge about small and medium enterprises (SMEs). It can be concluded that the criteria that must be used to determine which business is a small business is that the business must not have a very high sales volume, have a small number of employees, use low budget and the owner must manage the business by himself which is consistent with the criteria for the division of small and medium enterprises (SMEs) of the Ministry of Industry, that is, it is determined from the advanced value of fixed assets and the number of employment. The Ministry of Industry has also divided the types of small and medium enterprises into four categories: production, service, wholesale and retail. The distinctive characteristics of this type of business are it can easily enter into the business, flexibility in management, high flexibility, respond quickly to customer needs and can create specific expertise to achieve efficiency. The problems that are often found in small and medium enterprises (SMEs) in Thailand include marketing problems, shortage of funds, labor issues production technology problems, management limitations, government promotion access, service limitations and limitation of information awareness etc. By this knowledge, the researcher will use it as a guideline for creating questions and use as a guideline for observing the characteristics of each business that is the main data provider for research to analyze data and summarize research results.
RESEARCH METHOD 1. Population in research: entrepreneurs or representatives of small and medium enterprises (SMEs) who have
registered their legal entity with the Provincial Commercial Office until 2013 and still continue their operation until present. The total population in area of operations in the Andaman Triangle Province is 20,981 persons (Office of Small and Medium Enterprises Promotion, 2014). After using the technique of sampling and calcu-lated according to the formulas 559 people are selected as samples for the research (Krejcie & Morgan, 1970).
2. Research tools: Using the collection of the tool quality development by presenting to four tool examination experts to examine the content validity of the tool.
3. Collecting two types of data, namely, document research and questionnaire collection. The data collection period is during May 2014–August 2016.
4. Analysis of using ready-made programs using basic statistics including percentage, mean, standard deviation.
DISCUSSION The study results showed that the state enterprises ministry of small and medium enterprises (SMEs) in the Andaman Triangle Provinces (Phuket, Phang-Nga, and Krabi) which are the provinces in the southern region with high potential in the tourism industry, well known and popular for tourists from all over the world for a long time. Considering the number of small and medium enterprises in Andaman Triangle Province which is registered as a juristic person, it is found that in 2013, there were 20,981 small and medium enterprises (SMEs) who are legal entities, accounting for 3.06 percent of the number of legal enterprises across the country.
It consist of 20,636 small enterprises (SE), accounting for 3.01 percent of the total number of enterprises in the jurisdiction in the whole country, or 98.35 percent of the number of small and medium enterprises that are legal entities in the Andaman Triangle, and 345 medium-sized enterprises (ME), representing 0.05% of the total number of enterprises that are juristic persons in the whole country, or 1.64% of the number of small and medium enter-prises that are legal entities in the Andaman Triangle provinces.
Medium and small enterprises in the Andaman Triangle take important parts in creating jobs and generating revenue for the province. Each year, more than 80% of the income from tourists can be made from tourism in the Southern region and almost 80 percent of the income from foreign tourists is considered an important economy of the country.
The Present Conditions of the SMES in the Andaman Triangle Cluster Southern, pp. 1–7
5
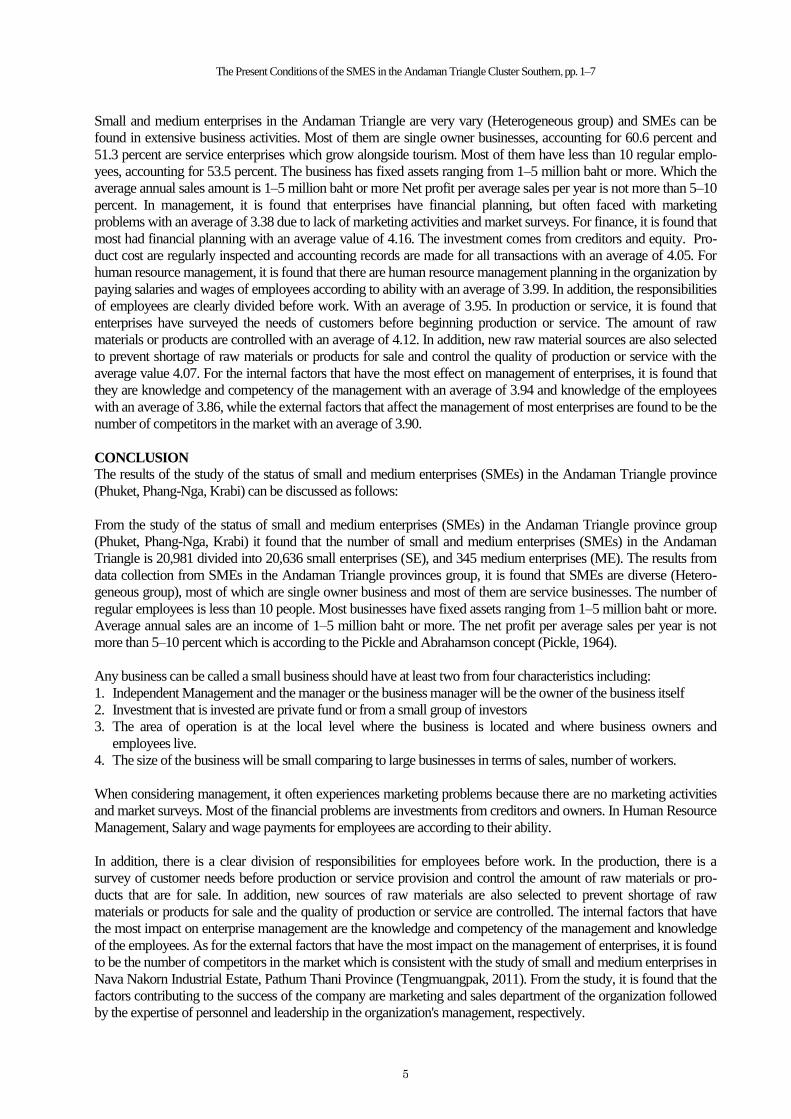
Small and medium enterprises in the Andaman Triangle are very vary (Heterogeneous group) and SMEs can be
found in extensive business activities. Most of them are single owner businesses, accounting for 60.6 percent and
51.3 percent are service enterprises which grow alongside tourism. Most of them have less than 10 regular emplo-
yees, accounting for 53.5 percent. The business has fixed assets ranging from 1–5 million baht or more. Which the
average annual sales amount is 1–5 million baht or more Net profit per average sales per year is not more than 5–10
percent. In management, it is found that enterprises have financial planning, but often faced with marketing
problems with an average of 3.38 due to lack of marketing activities and market surveys. For finance, it is found that
most had financial planning with an average value of 4.16. The investment comes from creditors and equity. Pro-
duct cost are regularly inspected and accounting records are made for all transactions with an average of 4.05. For
human resource management, it is found that there are human resource management planning in the organization by
paying salaries and wages of employees according to ability with an average of 3.99. In addition, the responsibilities
of employees are clearly divided before work. With an average of 3.95. In production or service, it is found that
enterprises have surveyed the needs of customers before beginning production or service. The amount of raw
materials or products are controlled with an average of 4.12. In addition, new raw material sources are also selected
to prevent shortage of raw materials or products for sale and control the quality of production or service with the
average value 4.07. For the internal factors that have the most effect on management of enterprises, it is found that
they are knowledge and competency of the management with an average of 3.94 and knowledge of the employees
with an average of 3.86, while the external factors that affect the management of most enterprises are found to be the
number of competitors in the market with an average of 3.90.
CONCLUSION
The results of the study of the status of small and medium enterprises (SMEs) in the Andaman Triangle province
(Phuket, Phang-Nga, Krabi) can be discussed as follows:
From the study of the status of small and medium enterprises (SMEs) in the Andaman Triangle province group
(Phuket, Phang-Nga, Krabi) it found that the number of small and medium enterprises (SMEs) in the Andaman
Triangle is 20,981 divided into 20,636 small enterprises (SE), and 345 medium enterprises (ME). The results from
data collection from SMEs in the Andaman Triangle provinces group, it is found that SMEs are diverse (Hetero-
geneous group), most of which are single owner business and most of them are service businesses. The number of
regular employees is less than 10 people. Most businesses have fixed assets ranging from 1–5 million baht or more.
Average annual sales are an income of 1–5 million baht or more. The net profit per average sales per year is not
more than 5–10 percent which is according to the Pickle and Abrahamson concept (Pickle, 1964).
Any business can be called a small business should have at least two from four characteristics including:
1. Independent Management and the manager or the business manager will be the owner of the business itself
2. Investment that is invested are private fund or from a small group of investors
3. The area of operation is at the local level where the business is located and where business owners and
employees live.
4. The size of the business will be small comparing to large businesses in terms of sales, number of workers.
When considering management, it often experiences marketing problems because there are no marketing activities
and market surveys. Most of the financial problems are investments from creditors and owners. In Human Resource
Management, Salary and wage payments for employees are according to their ability.
In addition, there is a clear division of responsibilities for employees before work. In the production, there is a
survey of customer needs before production or service provision and control the amount of raw materials or pro-
ducts that are for sale. In addition, new sources of raw materials are also selected to prevent shortage of raw
materials or products for sale and the quality of production or service are controlled. The internal factors that have
the most impact on enterprise management are the knowledge and competency of the management and knowledge
of the employees. As for the external factors that have the most impact on the management of enterprises, it is found
to be the number of competitors in the market which is consistent with the study of small and medium enterprises in
Nava Nakorn Industrial Estate, Pathum Thani Province (Tengmuangpak, 2011). From the study, it is found that the
factors contributing to the success of the company are marketing and sales department of the organization followed
by the expertise of personnel and leadership in the organization's management, respectively.
Anusara S., Hiran P., Noppadol C., Wanida H., and Phipop S.
6
Therefore, the small and medium enterprises of the Andaman Triangle Group have a management system that face
the problems that affects the success of the business. Those problem are knowledge, ability of the executive or the
owner of the business and the knowledge and competency of the employee.
Suggestions
Suggestions from research for the development of small and medium enterprises in the Andaman Triangle Province,
it is found that the following actions should be taken.
Suggestions for practice
1. Entrepreneurs should integrate knowledge in science, technology and innovation, research and product develop-
ment including continuous production improvement to extend the traditional industries to industrial groups, crea-
ting value that responds to the future of the world in the future.
2. The products should be studied and developed to be in accordance with the variety needs of the market including
creating a unique identity or bringing Thai wisdom into the production and / or services.
3. The service sector and the creative economy industry group should be linked together.
4. Preparation should be arranged to support changes in climate and to be environmentally friendly.
Policy suggestions
1. The development of production processes should be promoted and supported for entrepreneurs to be able to rely
on themselves.
2. The use of innovation should be promoted to emphasize to create features for Thai products.
3. The integration of domestic business network (Cluster) should be promoted
4. Entrepreneurs should be encouraged to choose to use domestic raw materials and to adjust raw materials to be
consistent with the production process by creating interdependence within the entrepreneur group to reduce the
import of raw materials.
Suggestions for further research
1. The comparative research should be conducted between the status of small and medium enterprises in the
Andaman Triangle and developed countries with similar geographic and economic areas to be used as guidelines
for the improvement and development of medium and small enterprises in the Andaman Triangle Provinces.
2. Operation research should be conducted about combining the industry group or cluster to improve the partici-
pation in problem solving and share real benefits.
3. The results from research should be used to develop a strategic plan to develop SMEs starting from SMEs in any
province and expand the results.
Policy Recommendations
1. Local organizations should play a role in laying down rules and regulating the balance between resource users
and local people, such as tourist attractions.
2. The government should address domestic political problems and security issues by giving confidence to both
investors and tourists
3. Government support should be integrated seriously by clearing data and policy and getting easy access.
4. It should promote cultural heritage in order for older generation to gain knowledge and create value for
businesses in the community and SMEs.
Limitations in research
1. This research was affected by the data obtained from the questionnaire. The general manager is 54.3%. Only
29.0% of the respondents were surveyed. It is believed that the research could be used as a strategic proposal for
the purpose of the research.
2. Organizing forum comment of stakeholders who are attending the forum is still lacking with interest from the
management of each agency. Some are merely delegates to those who do not have the authority to make policy
decisions. Criticism is not clear in the policy either.

The Present Conditions of the SMES in the Andaman Triangle Cluster Southern, pp. 1–7
7
REFERENCES
Department of Industrial Promotion Ministry of Industry. (2002). Industrial ministerial regulations re: Determination
of number of employment and employment of small and medium enterprises. Retrieved from
http://www.ratchakitcha.soc.go.th/DATA/PDF/00102303.PDF.
Krejcie, R. V., & Morgan, D. W. (1970). Determining sample size for research activities. Educational and Psycho-
logical Measurement, 30, 607–610.
Manjaiarn, R. (2014). Small business operations. Bangkok: Saengchan Printing.
Office of Small and Medium Enterprises Promotion (OSMEP). (2015). Office of small and medium enterprises
promotion: Definition of SMEs. Retrieved from http:// www.sme.go.th/Pages/Define.aspx.
Organisation for Economic Co-operation and Development (OECD). (1997). Globalization and small and medium
enterprises (SMEs). Paris, France: Organization for Economic Co-operation and Development.
Pickle, H. B. (1964). Personality and success: An evaluation of personnel characteristics of successful small
business managers. United States: Small Business Administration - Small Business Research Series.
Rumakom, P. (1997). Small business administration. 5th Edition. Bangkok: Physics Center.
Sato, Y. (2014). Development of small and medium enterprises in the ASEAN economies. Retrieved from
http://www.jcie.org/japan/j/pdf/pub/publst/1451/9_sato.pd.
Siriphatasophon, S. (2016). Competitive capacity and readiness of thai small and médiums enterprises for entering
the ASEAN economic community. Journal of the Association of Researchers, 21(1), 9–33.
Srisom, A. (2000). Strategies for creating SMEs. Bangkok: Nari Info.
Tengmuangpak, C. (2011). Administrative factors affecting the success of small and medium enterprises in Nava
Nakorn Industrial Estate Pathum Thani. Thesis. Eastern Asia University.
8
3rd International Conference on Management & Entrepreneurship (3rd i-CoME) ISBN 978-602-5446-15-3
Phuket, 25th – 27th July 2019
THE EFFECTS OF PRIVILEGE FUNDS ON PUBLIC WELFARE
AND POVERTY IN SPECIAL DISTRICT OF YOGYAKARTA
Rudy Badrudin
1, Baniady Gennody Pronosokodewo
2
12YKPN School of Business, Yogyakarta, Indonesia
Email: [email protected]; [email protected]
2
ABSTRACT
The objective of study is to analyze the effect of Privilege Funds on public welfare and poverty in Special District of Yogyakarta
based on data from 2014 to 2016. This study uses intervening variables, namely capital expenditure and economic growth.
Special District of Yogyakarta is chosen because it is the only province in Indonesia that receives Privilege Funds as a source of
Regional Government Budget. The analytical method used is based on Partial Least Square which follows the structural equation
model for testing hypothesis (α = 5%). The findings of study are privileged fund has a negative effect on capital expenditure but
has a positive effect on economic growth, capital expenditure has a positive effect on economic growth, economic growth has a
positive effect on public welfare but has a negative effect on poverty in Special District of Yogyakarta.
Keywords: Privilege funds, capital expenditure, growth, welfare, poverty.
INTRODUCTION
The current regional autonomy has been regulated based on Law Number 23 Year 2014. Special District of
Yogyakarta (DIY) as an area that uses the system of monarchy, but Sri Sultan Hamangkubuwono IX and Sri
Pakualam VIII do "Ijab Qabul" which states to merge into one of the territory of Republic Indonesia on September
5, 1945.
According to Law Number 13 Year 2012, Privilege Funds aims to maintain cultural heritage, preserve and create
prosperity for the people of Yogyakarta. This Privilege Funds is used to cover five areas of affairs: the governor's
and governor's vice governor's procedures, institutional sector, culture sector, land affairs sector, and spatial
planning.
Sakir and Mutiarin (2016) stated that the implementation of the privilege budget policy is (1) the priority of the more
dominant Privilege Funds for cultural affairs specifically in 2013 is 91.89%, 2014 is 71.62%, and in 2015 is
76.87%; (2) the quality of Privilege Funds expenditures that are not maximized from 2013 to 2015, in 2013 the
budget absorption is 23.58%, 2014 is 64.88% and 2015 is 20.06%; (3) the interest of Privilege Funds does not have
clear identification of output and outcome, so as not yet describe the development of Privilege Funds; (4) the
perception of the stakeholder of privilege between the central government, Kasultanan, Pakualaman, the political
elite, the community and the unequal owners of capital; (5) since 2013 until 2015, the impact of the Privilege Funds
would not be enjoyed by the community maximally; in 2014, the highest DIY poverty rate in Java is 14.55%.
Privilege Funds is allocated for direct expenditure in preserving DIY privilege particularly in the field of culture.
During the period 2013–2015, the culture sector is the area with the largest budget. To improve the public welfare
and reduce the poverty rate of districts in DIY, the budgeted Privilege Funds should be allocated to capital
expenditure with a greater percentage compared to personnel expenditure and goods and services expenditure.
Increased capital expenditures may have an impact on increasing public welfare and reducing poverty. If capital
expenditures are used for development enhancement and improvements to public facilities such as schools, health
centers, libraries, employment, it can increase public welfare and reducing poverty.
This study analyzes the effect of Privilege Funds on public welfare and poverty in Special District of Yogyakarta
based on data from 2014 to 2016.

The Effects of Privilege Funds on Public Welfare and Poverty, pp. 8–19
9
This research is important because research on Privilege Funds only exists in Special District of Yogyakarta which
not much has been done, especially the effect on public welfare and poverty by using variables of economic growth
and capital expenditure as an intervening variable.
LITERATURE REVIEW AND HYPOTHESIS
Agency Theory
Panda and Leepsa (2017) describe agency relations as contracts between principals and agents to carry out several
services on their behalf that involve delegation as decision-making authority to agents. Agency theory is a theory
that links principal relations with agents derived from economic, sociological and organizational theories. The
relationship between principals and agents results in information asymmetry, because agents who are authorized by
the principal have more information than principals.
Relating to this research agency theory is based on asymmetric decentralization between regions that receive
Privilege Funds with regions that do not receive Privilege Funds, so that regions such as DIY that receive Privilege
Funds get additional transfers from the central government. The additional transfer should be able to increase capital
expenditure and economic growth so that it can improve the public welfare and reducing poverty if the use of these
funds is efficient and effective.
The agency relationships in this study occurred between the central government with local governments, local
governments with budget users, and budget users with the power of budget users. The central government as a
principal provides Privilege Funds to local governments with the aim of preserving privilege and improving the
public welfare in DIY.
Local governments have a role as a principal who gives Privilege Funds budget to budget users to implement
privilege. However, budget users can also be a principal who give authority to use the Privilege Funds budget to the
budget user proxy to spend the Privilege Funds budget.
In order that the use of the Privilege Funds does not deviate from its objectives, The Development Planning Agency
at Sub-National Level is designated as a monitoring and evaluation function and the formation of the Privilege
Funds Special Committee by the DIY Regional House of People's Representatives (DPRD DIY) for monitoring the
implementation of the Privilege Funds.
Fiscal Decentralization
The fiscal decentralization aims to encourage the independence of regional governments in managing their
governance. The granting of regional autonomy is no longer merely carrying out instructions from the center, but
really has the freedom to increase creativity in developing regional potency and it is hoped that the local government
will be more independent, reduce dependence on the central government and be able to increase public trust.
Local governments in carrying out their duties and authorities must make a plan of income and expenditure for a
particular year called the Regional Income and Expenditure Budget. However, regional revenues cannot fully to
finance development. Therefore, the transfer of funds from the center becomes a source of revenue to support
development.
According to Law Number 23 of 2014, the provision of financial resources in the form of transfer revenues, namely
the Balancing Fund; Special Autonomy Fund for Nanggroe Aceh Darussalam, Papua and West Papua; Privilege
Funds for DIY; and Village Funds.
According to Agustinus (2015), fiscal decentralization can be effective because there are three components, there
are (1) the existence of autonomy and adequacy in revenue (revenue autonomy and adequacy); (2) autonomy in
expenditure autonomy; the existence of privilege for borrowing privilege.

Rudy B. and Baniady G. P.
10
According to Law Number 13 of 2012, the government provides funding in the framework of organizing the affairs
of DIY privilege in the form of Privilege Funds which are allocated for and managed by the DIY regional
government which allocates and distributes them through the transfer mechanism to the regions.
According to the Minister of Finance Regulation Number 124 /PMK.07/2015, privileges funds are funds originating
from the Indonesian Budget allocated to fund privilege authority and are part of funds transfer to the area (Adam,
Pattaling, Sumai, & Obei, 2019).
Capital Expenditure
According to Statement of Indonesian Government Accounting Standards Number 2 concerning Budget
Realization Report, capital expenditure includes spending on land, buildings and buildings, equipment, and
intangible assets. Shopping accounting is prepared in addition to fulfilling accountability in accordance with
provisions, can also be developed for control purposes for management.
According to Asiri et al. (2016) and de Vita and Kyaw (2009), capital expenditures in general are allocated to build
infrastructure which is further expected to increase the economy and stimulate the private sector to invest.
Capital expenditure will be allocated to fund development activities and this activity will lead to demand for goods
and services (Badrudin, 2017). Privilege Funds was transferred by the central government will be spent in
accordance with programs and activities.
Budget users who are responsible for the use of Privilege Funds for shopping, namely the Government
Administration Bureau as Budget User for the procedures for the position of Governor and Deputy Governor;
Organization Bureau as Budget User in field organizational; Department of Culture as Budget User in the field of
culture; and the Office of Land Sector and Planology as Budget Users in the field of land sector and planology.
Economic Growth
Local governments need to pay attention to economic growth as an instrument in encouraging economic
development so that in the end they can achieve effective poverty reduction goals and improve public welfare. With
the existence of economic growth, it is expected that the income of the public as the owner of the factor of
production will also increase.
Suwandi and Warokka (2013) stated that rapid economic growth must sacrifice (trade off) equitable distribution of
income, rapid growth occurs when the share received by the owner of capital is greater than the share received by
the owner of the workforce to increase savings for investment and growth with distribution emphasizes increasing
productivity and foreign investment to increase national.
According to Suwandi and Warokka (2013), economic growth was achieved by three factors, namely the increase
in stable inventory, technological development, and the efficient and effective use of technology.
According to Badrudin and Kuncorojati (2017), economic growth is one measure of the success of economic in an
area. One form of the success of economic is the development of infrastructure and facilities that support the
activities of local governments.
Economic growth is the change in Gross Regional Domestic Product (GRDP) per year which is expressed in
percent units. Therefore, to calculate the economic growth rate of a region must know the value of its GRDP.
According to Pananrangi (2012), it is very important that GRDP growth continues to increase every year so that
economic progress will occur and will eventually be reflected in real terms in community income.
The Effects of Privilege Funds on Public Welfare and Poverty, pp. 8–19
11
Public Welfare and Poverty
Economic growth should provide direct benefits for increasing income. Increased income will increase the
allocation of household expenditure for nutritious food and education, thus increasing the quality of life of the
public. Public welfare shows a measure of development outcomes in achieving a better life.
The goal of national development is to realize a just and prosperous society. A just and prosperous society is the
condition of society that is achieved with the concept and process of inclusive development. Inclusive economic
development is economic development that is capable of realizing economic growth (pro growth) accompanied by
pro jobs (employment), pro poor (reducing poverty), and pro equity (equal distribution of income), pro enviroment
(not damaging the environment).
This means that development is oriented towards achieving certain economic growth rates while still considering
employment by reducing the number of open unemployment, reducing the ratio of the poor, reducing the ratio of
gini, and environmentally oriented development (Badrudin, 2017).
Poverty is a problem for every nation whose handling is carried out by fulfilling the basic rights of the community
through inclusive development. Poverty is indeed a problem for every country, both developed and developing
countries. The conditions of poverty are at least caused by low levels of education, low quality of health, limited
employment, difficult and isolated demographic conditions and political instability.
According to Sumaryoto (2016), the core problem of poverty lies in the so-called poverty trap which consists of
poverty itself, isolation, vulnerability, and powerlessness. The United Nations Development Program (UNDP)
defines poverty as a condition of income shortages and economic difficulties. However, poverty is also seen as a
situation where there is a lack of access to education, health, and influence the political process and other factors that
are important to society.
Larasati (2016) examined the implementation of the periodic Privilege Funds at the Legal Bureau of DIY
Secretariat. The results show that the Privilege Funds in the Legal Bureau of DIY Secretariat has been implemented
well even though the realization of the funds has not been fully optimal.
Nuriyatman (2016) examines the implementation of decentralization in DIY based on Act Number 13 of 2012
concerning specialties of Special District of Yogyakarta.
The results show that there are still technical constraints in the absorption of the budget, namely in terms of transfer
of Privilege Funds.
According to Kartika (2016), there are four constraints in managing Privilege Funds, namely the limited time to
implement, the details of the meaning of the privatization, the tightness of regular government activities, and the
limited number of human resources.
However, the government has five efforts in order to optimize the Privilege Funds, namely limiting tasks and
functions, preparing plans early, preparing proposed details of regulation, adjusting proxy for budget users, and
applying for adjustments to the session or terms.
According to Fadlan (2016), there are various indicators of Privilege Funds needs assessment, so that they do not
harm the central government as the giver, and or the DIY government as the recipient. Privilege Funds for DIY does
not conflict with the constitution, because the granting of privilege status by the central government must be
followed by additional fiscal decentralization.
According to Pradhani (2016), the absence of rules governing all cultural affairs in DIY is a matter of privilege, but
indirectly with the funding of programs and activities of all cultural affairs with Privilege Funds, except routine

Rudy B. and Baniady G. P.
12
expenditure, shows that cultural affairs in DIY after the enactment of Law Number 13 of 2012 concerning the
Privilege of the Special District of Yogyakarta is a matter of privilege.
According to Sakir and Mutiarin (2016), not all stakeholders understand that privilege programs are basically also
part of the Regional Development Program, unpreparedness and concern from Budget Users and Budget Users
Proxy related to the procurement of products, especially for districts.
So far, this is considered a risky activity for the procurement committee as well as officials who make commitments,
lack of human resources as executors and financial management of Privilege Funds, program planning, activities
and budgets do not reflect the needs and capacities of Budget Users and Budget Users Proxy of each budget
authority privileges, and the participation of Special District of Yogyakarta public in the implementation of privilege
authority has not been involved since the beginning of the formulation of programs, activities, and budgeting.
HYPOTHESIS DEVELOPMENT
Privilege Funds consists of five fields of authority, that is the fields of culture, institutional fields, fields of
procedures for filling positions, land and spatial planning. Privilege Funds allocated to the fields of institutional,
cultural, land and spatial planning, during the 2014–2016 period experienced a significant increase. Privilege Funds
should be used to provide more public facilities related to spatial planning, land, culture and institutions.
The higher the Privilege Funds given by the central government, the higher the capital expenditure of the regional
government, because the DIY regional government gets an additional budget to spend in order to carry out the
privilege and public welfare.
Sakir and Mutiarin (2016), Larasati (2016), and Nuriyatman (2016) stated that the absorption of Privilege Funds
was not optimal because of constraints to the absorption of Privilege Funds, such as lack of human resources as
implementers and management Privilege Funds and the details of the meaning of the Privilege have not been
detailed.
Hypothesis 1: Privilege Funds has a positive effect on capital expenditure in districts in DIY.
Economic growth is one measure of the success of economic in an area. One form of economic development is the
development of infrastructure and facilities and infrastructure that support the activities of local governments.
Privilege Funds will be allocated to fund five areas of privilege authority, Privilege Funds become a new source of
income for DIY development, especially in the five privilege authority matters. This will have an impact on
development that increases the product, especially in the field of culture to improve the tourism sector. An increase
in the tourism sector which is the leading revenue can increase economic growth in districts in DIY.
Sakir and Mutiarin (2016) state that Privilege Funds are less than optimal in increasing economic growth because
the translation of the meaning of Privatization according to the details has not been detailed.
According to Kartika (2016), although the absorption of Privilege Funds is less than optimal, the government has
five efforts in order to optimize the Privilege Funds, namely limiting tasks and functions, preparing plans early,
drafting details of Perdais, adjusting KPA, and applying for adjustments to the session or terms.
According to Fadlan (2016), granting privilege to DIY can increase economic growth due to the provision of
privilege followed by additional in the form of Privilege Funds.
Hypothesis 2: Privilege Funds has a positive effect on economic growth in districts in DIY.
Capital expenditure will be allocated to fund development activities. The development can be in the form of land;
inventory and machinery; buildings and buildings; roads, irrigation and networks; and other public facilities so as to
facilitate community accessibility in daily activities and to support community economic activities.
The Effects of Privilege Funds on Public Welfare and Poverty, pp. 8–19
13
If the public's economic activities are not supported by the local government, economic growth will not increase.
According to Pananrangi (2012), it is very important that GRDP growth continues to increase every year so that
economic progress will occur and will eventually be reflected in real terms. The increasing in capital expenditure
will increase economic growth.
According to Badrudin and Kuncorojati (2017), an increase in capital expenditure can have an impact on
development that increases the production of goods and services, so that economic growth can increase.
Meanwhile, according to Asiri et al. (2016) and de Vita and Kyaw (2009), capital expenditures in general are
allocated to build infrastructure which is further expected to increase the economy and stimulate the private sector to
invest.
The allocation of capital expenditure that is used for development and improvement of infrastructure and public
facilities can increase investment in the form of assets and fresh funds. The increasing of investment can improve
the quality of public services.
Hypothesis 3: Capital expenditure has a positive effect on economic growth in districts in DIY.
The increasing economic growth also provides direct benefits to increase income. The increasing income will
increase the allocation of household spending for nutritious food and education, so as to improve life. The level of
economic growth of a country shows the level of prosperity of public. In addition to national income is also the most
commonly for measuring public welfare.
Sirag, Nor, Abdullah, and Karimi (2016) stated that development and economic growth must produce improve-
ments in the real form of community welfare by focusing on improving living standards, education and health. If
economic growth is good, then the level of community income will also increase.
The increase in income that occurs increases the life needs of a better community, this shows that the level of
community development is increasing.
Badrudin and Kuncorojati (2017) has a different statement, the higher economic growth actually decreases the
public welfare, because economic growth only focuses on exclusive development.
Hypothesis 4: Economic growth has a positive effect on public welfare in districts in DIY.
Economic growth can also illustrate the increase in economic activity which is then expected to reduce poverty. The
GRDP per per capita growth is considered more reflective of the changing conditions of public's economy or
progress of the level of public welfare.
According to Pananrangi (2012), it is very important that GRDP growth continues to increase every year so that
economic progress occurs describes people's income. The meaning of increasing in economic growth is income of
the owner of the factors of production will also increase, so as to reduce to poverty.
Badrudin and Kuncorojati (2017) stated that the higher of economic growth the higher of poverty rate. The
increasing number of poverty due to economic growth is not accompanied by development and improvement of
public facilities for the poor.
Hasan and Zikriah (2010) stated that the increase in GRDP gives an impact on poverty. The increase in GRDP
indicates the ease of the public to carry out economic and social activities.
Hypothesis 5: Economic growth has a negative effect on poverty in districts in DIY.

Rudy B. and Baniady G. P.
14
RESEARCH METHOD
The population that will be the object of this research is the realization of Privilege Funds in five fields as a whole
from the Field of Culture, Land Sector, Planology, Institutional Fields and Procedures for Filling Governors and
Deputy Governors and budgets in districts in DIY during 2014–2016.
The sampling in this study uses purposive sampling method. Data sources of this research are 1) Data Realization of
Regional Income and Expenditure Budget on district in districts in DIY and Privilege Funds Performance Reports
during the 2014–2016.
The data obtained is the realization of Privilege Funds and capital expenditure of Regional Government Budget in
districts in DIY; 2) Data on economic growth in districts in DIY during the 2014–2016; and 3) Data on public
welfare in this research was measured using Human Development Index (HDI) and data on poverty was measured
using poverty ratio during the 2014–2016.
The analysis model uses the Partial Least Square (PLS) which to obtain latent variable values for predictive
purposes with the analysis model are inner model, outer model, and weight relation estimates the case value of the
latent variable.
FINDINGS
Privilege Funds have the lowest realization value of Rp.4,125,771,950 in Sleman Regency in 2014, the highest
realized value of Rp.493,501,137,133 in the City of Yogyakarta in 2016, and the average realization value in 2014–
2016 was Rp85,418,234. 747.
The capital expenditure variable has the lowest realization value of Rp.127,289,721,491 in Gunungkidul Regency in
2014, the highest realized value was Rp.426,782,827,409 in Sleman Regency in 2016, and the average realized
value in 2014–2016 was Rp.274,054,113.593.
The variable of economic growth has the lowest growth rate of 4.54% in Gunungkidul Regency in 2014, the highest
growth rate of 5.30% in Sleman Regency in 2014, and the average growth rate in 2014–2016 of 4.97%.
Based on Table 1, it appears that the HDI has the lowest value of 67.03 in Gunungkidul Regency in 2014, the
highest value of 85.32 in the City of Yogyakarta in 2016, and the average value of 76.54. Poverty Ratio has the
lowest value of 7.70% in Yogyakarta City in 2016, the highest value is 21.73% in Gunungkidul Regency in 2015,
and the average value is 14.40%.
Table 1
Descriptive Statistics
Variable Minimum Maximum Mean Standard
Deviation
Privilege Funds (Rp) 4,125,771,950 493,501,137,133 85,418,234,747 159,032,101,004
Capital Expenditure (Rp) 127,289,721,491 426,782,827,409 274,054,113,593 78,842,307,599
Economic Growth 4.54 5.30 4.97 0.23
Human Development Index
(HDI) 76.44 85.32 77.31 0.86
Poverty Ratio (%) 13.10 15.03 14.40 0.90
Based on Table 1, the lowest realization of Privilege Funds in Sleman regency actually has the highest realized
capital expenditure value and has the highest GRDP growth rate in DIY.
The Effects of Privilege Funds on Public Welfare and Poverty, pp. 8–19
15
In contrast, the highest realized value of the Privilege Funds, namely the City of Yogyakarta, has a lower realized
capital expenditure and GRDP growth rate than the Sleman district.
Thus it can be said that the increase in Privilege Funds may not necessarily increase the realization of Regional
Government expenditure. The increase in districts capital expenditure of Regional Income and Expenditure Budget
in DIY was caused by an increase in the Balancing Fund and Village Funds.
Evaluation of Goodness of Fit Model to Outer Model
Indicator weight value for Human Development Index and Poverty Ratio is significant or less than 5%. This shows
the measurement model to test the construct in order to know the ability of the instrument to measure what should
be measured using indicator weight is significant.
Human Development Index as an indicator to measure public welfare variable and Poverty Ratio as an indicator to
measure poverty variable is indicated by the results of the outer weight whose results show <0.001.
The variables in this study have indicator weight values for all variables, namely the exogenous variable of Fund
Privilege, intervening endogenous variable of capital expenditure, economic growth, endogenous variable of public
welfare as measured by HDI and poverty as measured by PR of significance value <0.001.
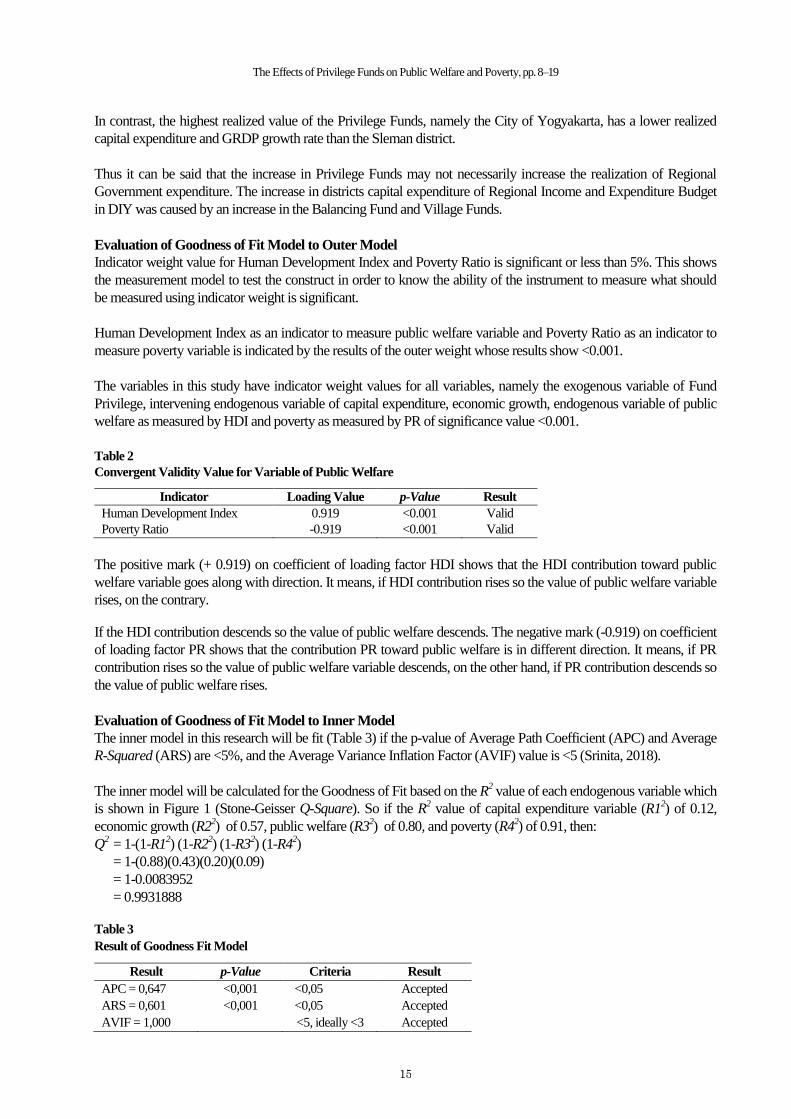
Table 2
Convergent Validity Value for Variable of Public Welfare
Indicator Loading Value p-Value Result
Human Development Index 0.919 <0.001 Valid
Poverty Ratio -0.919 <0.001 Valid
The positive mark (+ 0.919) on coefficient of loading factor HDI shows that the HDI contribution toward public
welfare variable goes along with direction. It means, if HDI contribution rises so the value of public welfare variable
rises, on the contrary.
If the HDI contribution descends so the value of public welfare descends. The negative mark (-0.919) on coefficient
of loading factor PR shows that the contribution PR toward public welfare is in different direction. It means, if PR
contribution rises so the value of public welfare variable descends, on the other hand, if PR contribution descends so
the value of public welfare rises.
Evaluation of Goodness of Fit Model to Inner Model
The inner model in this research will be fit (Table 3) if the p-value of Average Path Coefficient (APC) and Average
R-Squared (ARS) are <5%, and the Average Variance Inflation Factor (AVIF) value is <5 (Srinita, 2018).
The inner model will be calculated for the Goodness of Fit based on the R2 value of each endogenous variable which
is shown in Figure 1 (Stone-Geisser Q-Square). So if the R2 value of capital expenditure variable (R1
2) of 0.12,
economic growth (R22) of 0.57, public welfare (R3
2) of 0.80, and poverty (R4
2) of 0.91, then:
Q2
= 1-(1-R12) (1-R2
2) (1-R3
2) (1-R4
2)
= 1-(0.88)(0.43)(0.20)(0.09)
= 1-0.0083952
= 0.9931888
Table 3
Result of Goodness Fit Model
Result p-Value Criteria Result
APC = 0,647 <0,001 <0,05 Accepted
ARS = 0,601 <0,001 <0,05 Accepted
AVIF = 1,000 <5, ideally <3 Accepted
Rudy B. and Baniady G. P.
16
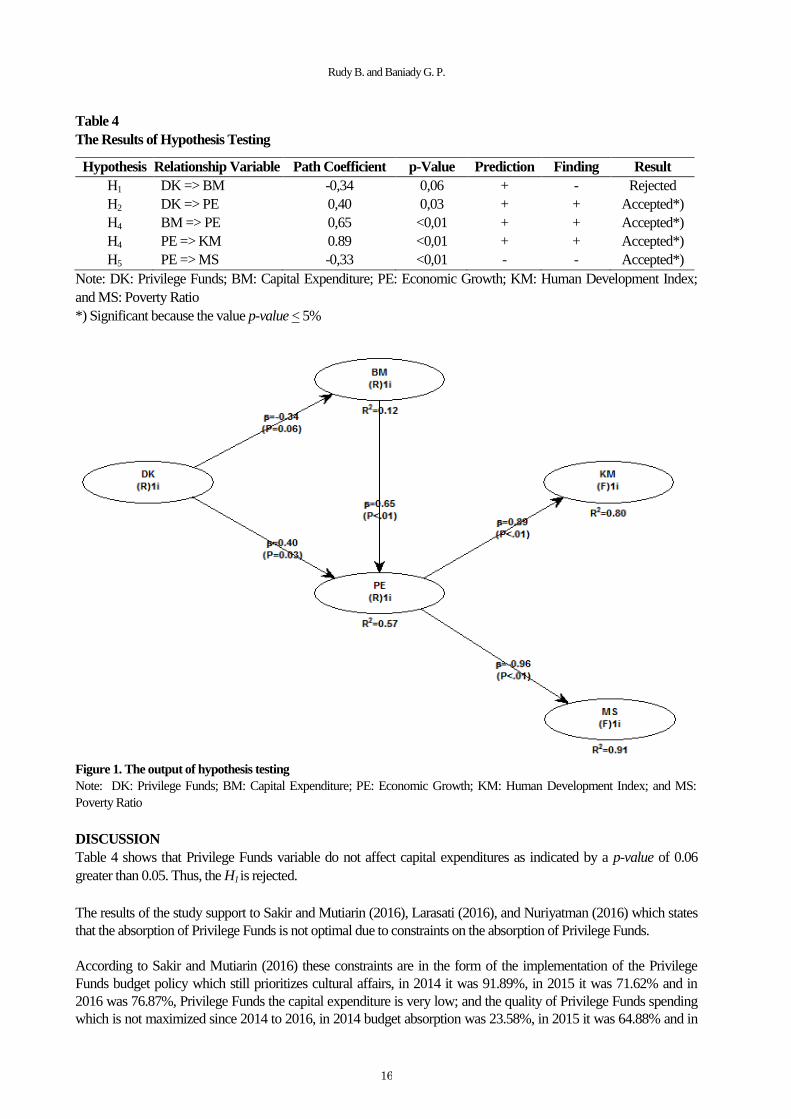
Table 4
The Results of Hypothesis Testing
Hypothesis Relationship Variable Path Coefficient p-Value Prediction Finding Result
H1 DK => BM -0,34 0,06 + - Rejected
H2 DK => PE 0,40 0,03 + + Accepted*)
H4 BM => PE 0,65 <0,01 + + Accepted*)
H4 PE => KM 0.89 <0,01 + + Accepted*)
H5 PE => MS -0,33 <0,01 - - Accepted*)
Note: DK: Privilege Funds; BM: Capital Expenditure; PE: Economic Growth; KM: Human Development Index;
and MS: Poverty Ratio
*) Significant because the value p-value < 5%
Figure 1. The output of hypothesis testing
Note: DK: Privilege Funds; BM: Capital Expenditure; PE: Economic Growth; KM: Human Development Index; and MS:
Poverty Ratio
DISCUSSION
Table 4 shows that Privilege Funds variable do not affect capital expenditures as indicated by a p-value of 0.06
greater than 0.05. Thus, the H1 is rejected.
The results of the study support to Sakir and Mutiarin (2016), Larasati (2016), and Nuriyatman (2016) which states
that the absorption of Privilege Funds is not optimal due to constraints on the absorption of Privilege Funds.
According to Sakir and Mutiarin (2016) these constraints are in the form of the implementation of the Privilege
Funds budget policy which still prioritizes cultural affairs, in 2014 it was 91.89%, in 2015 it was 71.62% and in
2016 was 76.87%, Privilege Funds the capital expenditure is very low; and the quality of Privilege Funds spending
which is not maximized since 2014 to 2016, in 2014 budget absorption was 23.58%, in 2015 it was 64.88% and in

The Effects of Privilege Funds on Public Welfare and Poverty, pp. 8–19
17
2016 it was 20.06% due to lack of human resources as executors and financial management Privilege Funds and not
yet detailed translation of meaning privilege according to the Privilege Funds Regulation.
Table 4 shows that Privilege Funds variable has a positive effect on economic growth as indicated by a p-value of
0.03 smaller than 0.05 and the path coefficient value of 0.40 which has a positive number. Thus, the H2 is accepted.
The results of the study not support to Sakir and Mutiarin (2016) which states that Privilege Funds have not been
optimal in increasing economic growth because not all stakeholders understand that Privilege Programs are
basically also part of the Development Program, uncertainty and concerns of Budget Users and Budget User Proxies
related to procurement of products, especially in districts.
The interests of the Privilege Funds do not yet have a clear identification of outputs and outcomes, so can not
describe the development of Privilege Funds, perceptions of stakeholders between the central government,
Kasultanan, Pakualaman, political elites, society and the owners of capital that are not the same, from 2014 to 2016
the impact of the Privilege Funds has not been enjoyed by the community to the fullest, in 2014 the DIY poverty
rate was the highest in Java, which was 14.55%.
The results of the study support to Kartika (2016) which states that although the absorption of Privilege Funds is less
than optimal, the government has five efforts to optimize the Funds Privilege, namely limiting tasks and functions,
preparing plans early, preparing proposals for details of Privilege Funds Regulations, adjusting Budget User Proxies,
and applying for adjustments the term, so that Privilege Funds allocations can increase economic growth.
The results of the study support to Fadlan (2016) which states that granting privileges to DIY can increase economic
growth due to the provision of privilege followed by additional fiscal decentralization in the form of Privileges
Funds. Thus the allocation of Privilege Funds can be optimized for economic growth in districts in DIY.
Table 4 shows that capital expenditure variable has a positive effect on economic growth as indicated by p-value
<0.01 less than 0.05 and path coefficient value of 0.65 which has a positive number. Thus, the H3 is accepted. The
results of the study support to Pananrangi (2012), Asiri et al. (2016), de Vita and Kyaw (2009), and Badrudin and
Kuncorojati (2017).
According to Pananrangi (2012), it is very important that GRDP growth continues to increase every year so that
economic progress will occur and will eventually be reflected in real terms. The increasing in capital expenditure
will increase economic growth.
According to Asiri et al. (2016) and de Vita and Kyaw (2009), capital expenditures in general are allocated to build
infrastructure which is further expected to increase the economy and stimulate the private sector to invest.
The allocation of capital expenditure for development infrastructure and public facilities can increase investment in
the form of assets and fresh funds. Increased investment is expected to improve public services. The development
infrastructure and public facilities can spur optimal economic growth.
Table 4 shows that economic growth variable has a positive effect on the public welfare as indicated by the p-value
<0.01 less than 0.05 and the path coefficient value of 0.89 which has a positive number. Thus, the H4 is accepted.
The result of the study not support to Badrudin and Kuncorojati (2017).
Table 1 shows the period after the use of Privilege Funds to improve public welfare as measured by the HDI
indicator. The increasing income will increase the allocation of household expenditure for nutritious food and
education, so as to improve life.
The result of the study support to Sirag et al. (2016) which stated that development and economic growth must
produce improvements in the real form of public welfare by focusing on improving living standards, education and
health. This means, the higher economic growth, the higher public welfare in districts in DIY.
Rudy B. and Baniady G. P.
18
Table 4 shows that economic growth variable has a negative effect on poverty as indicated by the p-value <0.01 less
than 0.05 and the path coefficient value of -0.96 which has a negative number. Thus, the H5 is accepted. This means
that the increasing economic growth will decrease the poverty rate in districts in DIY. The results of the study not
support to Badrudin and Kuncorojati (2017).
Table 1 shows the period after the use of Privilege Funds can reduce the probability rate as measured by the Poverty
Ratio. The results of the study support to Hasan and Zikriah (2010), which states that an increase in GRDP has an
impact on poverty, increasing GRDP indicates the ease of the public to carry out economic and social activities.
CONCLUSION
The Privilege Funds does not affect capital expenditure. This means, the higher Privilege Funds allocation has not
been able to increase capital expenditure in districts in DIY. The Privilege Funds has a positive effect on economic
growth. This means, if Privilege Funds allocation increase, economic growth in districts in DIY will increase.
The capital expenditure in DIY has a positive effect on economic growth. This means, if capital expenditure
increase, it can increase economic growth of districts in DIY, because capital expenditure is used for the
development infrastructure and public service facilities that can increase economic activity, thus spurring increasing
public income.
The economic growth has a positive effect on public welfare in districts in DIY. This means, if economic growth
increase, it can improve public welfare in districts in DIY. The economic growth has a negative effect on poverty in
districts in DIY. This means, if economic growth increase, poverty in districts in DIY will decrease.
REFERENCES
Adam, S., Pattaling, Sumai, S., & Obei, M. (2019). Inter-stakeholders communication in the implementation of
village fund programs: An experience in Gorontalo Province, Indonesia. Journal of Management and
Sustainability, 9(1),132–140.
Agustinus, J. (2015). Accountability perspective: Implementation and reporting on spending fund of Papua special
autonomy. Information Management and Business Review, 7(2), 79–86.
Asiri, A. A. A., Masinambow, V. A. J., & Wauran, P. C. (2016). Pengaruh belanja modal dan investasi swasta
terhadap kesejahteraan masyarakat melalui kesempatan kerja di Provinsi Sulawesi Utara Periode 2003–2013.
Jurnal Berkala Ilmiah Efisiensi, 16(3), 334–347.
Badrudin, R. (2017). Ekonomika otonomi daerah. Edisi Kedua. Yogyakarta: UPP-STIM YKPN.
Badrudin, R., & Kuncorojati, I. (2017). The effect of district own-source revenue and balance funds on public
welfare by capital expenditure and economic growth as an intervening variable in Special District of
Yogyakarta. Jurnal Manajemen dan Kewirausahaan, 19(1), 54–59.
de Vita, G., & Kyaw, K. S. (2009). Growth effects of fdi and portfolio investment flows to developing countries: A
disaggregated analysis by income levels. Applied Economics Letters, 16(3), 277–283.
Fadlan, H. (2016). Kebijakan mengenai ketidakpastian besaran prosentase dana keistimewaan bagi Daerah
Istimewa Yogyakarta. Skripsi. Yogyakarta: Universitas Gadjah Mada.
Hasan, T. I. B., & Zikriah. (2010). Pengaruh belanja modal pemerintah dan produk domestik bruto terhadap
penduduk miskin di Aceh. Jurnal SAINS Riset,1(3)18–26.
Kartika, D. (2016). Analisis kesiapan pengelolaan dana keistimewaan Daerah Istimewa Yogyakarta tahun
anggaran 2013. Skripsi. Yogyakarta: Universitas Gadjah Mada.
Larasati, H. N. (2016). Implementasi dana keistimewaan periode tahun 2013–2015 di Biro Hukum Sekretariat
Daerah Daerah Istimewa Yogyakarta (Setda DIY). Skripsi. Surakarta: Universitas Sebelas Maret.
Nuriyatman, E. (2016). Implementasi desentralisasi di Daerah Istimewa Yogyakarta (DIY) berdasarkan Undang
Undang nomor 13 tahun 2012 tentang keistimewaan Daerah Istimewa Yogyakarta. Jurnal Pasca Sarjana
Hukum, 4(2), 18–26.
Pananrangi, A. I. (2012). Pengaruh pertumbuhan ekonomi terhadap tingkat kemiskinan. Jurnal Plano Madani, 2(1),
29–38.
The Effects of Privilege Funds on Public Welfare and Poverty, pp. 8–19
19
Panda, B., & Leepsa, N. M. (2017). Agency theory: Review of theory and evidence on problems and perspectives.
Indian Journal of Corporate Governance, 10(1), 74–95.
Pradhani, S. I. (2016). Pengaturan pengelolaan keuangan urusan kebudayaan sebagai urusan pemerintahan
konkuren dan urusan keistimewaan di Daerah Istimewa Yogyakarta. Tesis. Yogyakarta: Universitas Gadjah
Mada.
Sakir & Mutiarin, D. (2015). Kebijakan anggaran dana keistimewaan Daerah Istimewa Yogyakarta. Jurnal Ilmu
Pemerintahan dan Kebijakan Publik, 2(3), 462–492.
Sirag, A., Nor, N. M., Abdullah, N. M. R., & Karimi, M. (2016). Does high public health expenditure slow down
economic growth? Journal of Applied Economic Sciences, 11, 1(39), 7–17.
Srinita. (2018). Factors affecting the food security and community welfare of farmer households in Sumatera,
Indonesia. World Journal of Science, Technology and Sustainable Development, 15(2), 200–212.
Sumaryoto. (2016). The influence of regional revenue on government investment and its implication to the regional
economic growth. Journal of Applied Economic Sciences, 11, 8(46), 1552–1568.
Suwandi, & Warokka, A. (2013). Fiscal decentralization and special local autonomy: Evidence from an emerging
market. Journal of Southeast Asian Research, 1–14.

20
3rd International Conference on Management & Entrepreneurship (3rd i-CoME) ISBN 978-602-5446-15-3
Phuket, 25th – 27th July 2019
ADVERTISING KIDAL TEMPLE AS A TOURISM SITE IN THE DISTRICT
OF MALANG THROUGH THE CREATION OF HAND PAINTED BATIK OF
GARUDEYA STORY
Lisa Sidyawati
Art and Design Department, Faculty of Letters, State University of Malang
Email: [email protected]
ABSTRACT Kidal Temple is one of many historical tourist attraction in the District of Malang. The Government opened this temple as an
educational tourist attraction which can be visited by everyone. However, only a small number are interested to visit this temple
anymore, concerned to learn reliefs passed down by ancestors as the way to preserve it. Visitors mainly are academicians who
come to carry out research. Not many people knows, this temple is the oldest temple in East Java. There is a relief of Garudeya
story which contains a high philosophical value which is a great character education. Considering this problem, the author would
like to advertise Kidal Temple as an educational tourist attraction through the creation of hand painted batik which uses Garudeya
story as the main inspiration. Through the creation of this hand painted batik and also the exhibition of the result, hopefully it
would promote Kidal Temple as well as the important relief on it. Thus, the next generation would be interested in it and
concerned to learn it as a way to preserve this artefact which was passed down by the ancestors.
Keywords: Advertising, tourism, kidal temple, hand painted batik, garudeya.
INTRODUCTION
The District of Malang is an area in Indonesia which has many tourist attraction with historical value such as
temples. There are 11 temples, because the area was the capital area of Singosari Kingdom. A temple which was the
oldest heritage of Singosari Kingdom in the District of Malang is Kidal Temple. It is located in Rejokidal Village,
Tumpang Region, District of Malang, particularly 20 km to the east of Malang City. The government of Malang
District established Kidal Temple as an educational tourist attraction and also a cultural tourist attraction which can
be accessed by anyone in the town. Culture tour includes tourism sites which are products of local cultural art, such
as local customs, religious rituals, social life order, and historical artefact (Atmojo, 2008). In this temple, there is a
relief called Garudeya. This relief tells a story of a garuda that freed its mother from slavery by fulfilling a request.
The request was to give holy water of Amerta to a dragon. As this relief conveys a philosophy about freedom from
slavery, hopefully people would refer to Kidal Temple as they apply and teach moral values which is embodied in
the story of Garudeya.
Kidal Temple as a tourist attraction in the District of Malang is supposed to have huge potential to bring on a
number of tourists, both domestic and international. This phenomenon surely would affect on the increasing of
locals’ income around Kidal Temple as well as regional income. Geographical factor of Malang District, that is
having a lot of artificial and natural tourism, only helps bringing tourists to visit Kidal Temple as they vacationing
number of tourist attraction in the area. The number of visitors in Kidal Temple should be increasing year by year,
since it is not only a family holiday venue, but also a media of education of Indonesia’s history.
In the contrary, only a few people visit Kidal Temple. Couples of academician come time to time to conduct
research related to this temple. It is supposed to be a wonderful holiday destination for families. Not only adults, but
also children and younger generations should learn and understand the Indonesian historical sequence of events as
well as its cultures. Thus hopefully by understanding it, it will spark up people’s sense of belonging upon the history
of our own history, and also people’s concern to reserve the treasured heritage.
Considering this problem, researcher is interested to advertise Kidal Temple as tourism destination through the
creation of hand painted batik about the story of Garudeya’s life. This hand painted batik would be used as an
educational media as well as advertisement of the temple in schools. It will also be exhibited publicly to tell the story
in a wider scale, thus people will be interested in the story of Garudeya which is on the wall of Kidal Temple.
Hopefully, more people will visit this temple, be it an easy holiday, or serious learning of reliefs on the temple’s
wall.

Advertising Kidal Temple as a Tourism Site in the District of Malang, pp. 20–29
21
LITERATURE REVIEW AND HYPOTHESIS
Kidal Temple Kidal Temple is located in Rejokidal Village, Tumpang Region, District of Malang. It is a Hindu temple of Singosari Kingdom and an oldest worship temple in East Java. Kidal Temple was built to honor King Anusapati in 1248 so that the King would have glory as Syiwa. Throughout the time, this temple had been restored couples times by Dutch Government and also Indonesian Government. Physical restoration had been done by Indonesian Government in 1986-1988 as a Project of Historical and Ancient Heritage Restoration and Maintenance in East Java (Turaeni, 2015).
The architecture of this temple possesses the characteristics of East Javanese temples. The material of this temple is andesite stones with vertical geometric dimension. The temple stands 10.8 meters long, 8.36 meters wide, and 12.26 meters tall. Outside the temple, there are piles of stone which stand as a barrier enclosing it. Meanwhile, inside there is a statue of God Shiva, 1.23 meters tall, which is in Royal Tripical Institute, Amsterdam at the moment. The temple’s body stands on a base (batur) which is 2 meters high. The base of this temple was made in stairs. On the left and right of the first step there is a low angular wall that enclose the sides of the step and some part in front of it. Sculptures of medallion lining up along with floral and tendrillar borders decorate the base on all sides. On the left and right side of every inner corner of the steps as well as each protruding angle, there is a sculpture of an animal that looks like a lion sitting down like a person which one hand is raised. These statues look like holding up the upper corner of protruding angle on the base of the temple (Sedyawati, 2010).
Above the entrance there is a head of Kala which observe and guarding the temple. The entrance of the temple is facing west, complimented by a chamber showing a decoration of Kalamakara (a head of Kala) upon the threshold. Its hand is in the position of threatening (mudra). On the sides of the door way, there is a small chamber along with a shape of roof which was used to put statue. Upon the thresholds of these chambers there are Kalamakara, too. The roof of Kidal Temple is in rectangular shape in three levels, narrowing up. Instead of pointed, the top of Kidal Temple roof is a rectangular space which is quite wide. The top of the roof is not complimented by ratna or statues, but pretty plain. The sides of each level is decorated by floral and tendrillar carvings (Turaeni, 2015).
Outside the temple, east, north and south sides, there are reliefs of a garuda head which tells the story of Garudeya. Garudeya is a story carved on the body of this temple. This relief is a mandate from King Anusapati in order to ruwat (a Javanese ritual) his mother, Kendedes. The myth of Garudeya is drawn in three panels on the foot of the temple. These three panels of Garudeya were carved on the pilaster of Kidal Temple. The pilaster is in a center sides of the temple’s base, particularly on the south, east and north sides. Dwi Cahyono, an archeologist, wrote in his personal account that Garudeya story is closely related to Samodramantana or Amretamantara stories. Amretamantara is an episode in the story of Adiparwa, which is the first part of Mahabrata series. The story tells about Viyasa family, especially genealogical story of Viyasa (Byasa) along with his two wives, Winata and Kadru, and their dramatic events surrounding their offspring. This story is one of Hindu mythologies, which contains a moral value about slavery freedom with Hindu temple in the background.
Relief Garudeya Garudeya relief tells a story of a feud between the descendants of Resi Viyasa (Byasa), which was a battle between a garuda bird (Winata’s offspring) and 100 dragons (Kadru’s offspring). According to the request of each wife who could not bear any child, Resi Viyasa gave them three eggs each to hatch. However, only one successfully hatched, it was an anthropomorphic creature: a half man and half bird, named Garudeya. Meanwhile, a hundred eggs owned by Kadru was hatched as snakes. This story is written in the second part of Adiparwa Scripture which also tells stories about Pandawa and Kurawa’s grandfather, Resi Viyasa, and also the birth and childhood of Bharata’s offspring (Zoetmulder, 1974).
The main point of this story is an effort to free Garudeya’s mother who was enslaved by the dragons and Kadru. This story basically delivers moral value of freeing ourselves from slavery (colonization) and grasping freedom (independence). Garudeya’s mother would be freed by Kadru and the dragons in the price of Amerta water which was obtained from the gods. Wisnu was willing to lend Amerta water in one condition: Garudeya must be his mount (Wardani, 2013). After receiving and handing Amerta water to the dragons, Garudeya asked the dragons to wash themselves first. As they clean themselves, Indra took Amerta water. The dragons were sad, and licked the grass on where Amerta water dripped. Thus, their tongues were sliced. Garudeya managed to free his mother and left the dragons as his mother was freed from their slavery. After that, Garudeya fulfill his promise to Wisnu to be his mount.

Njo A., Joyo S., and Venny L.
22
Relief of Garudeya story was carved on every sides of the temple’s foot. The drawing of the relief is as followed:
1. First panel in the south side of the temple: Garudeya is portrayed in the position of crouching down, his right leg
is bend and kneeled down. Above his head there are three dragons. The dragons are on a lotus flower. The
dragons’ tails are hanging down and held by Garudeya. This panel tells about Winata and Garudeya, who lived
as Kadru and 100 dragon-sons’ slave. Garudeya’s job was to babysit Kadru’s snake-sons. Winata and her son
was enslaved by Kadru family, because he was cheated and lost in the bet of guessing the color of Uchaiswara
horse which emerged from milky ocean (samodra/ksirarwana). Honoring the bet, the loser must be the slave of
the winner (Wardani, 2013).
2. Second panel in the east side of the temple: Garudeya is portrayed in the position of crouching down, his right
leg is bend and kneeled down. His right hand is holding a bunch of grass, and on his head there is Amerta water
in a jar (Kamandalu). Garudeya put his life in the line as he struggled to get Amerta water, Wisnu was almost
defeated. Eventually wisnu was willing to lend the water to Garudeya in one condition: Garudeya must be his
ride (Santiko, 2015).
3. Third panel in the north side of the temple: Garudeya is portrayed in the position of crouching down, his right leg
is bend and kneeled down. His right hand is raised and holding a round object. On his head, a woman sitting on a
lotus flower. Her left leg is folded in, while her right leg is hanging down and held by Garudeya’s right hand. On
her side, there are three dragons. Relief in this panel shows Garudeya was carrying his mother on his back and
flied from Kadru house, since they were freed (Cahyono, 2016).
Hand Painted Batik
Painting a batik or painting with wax is done spontaneously. Hand painted batik by experts is usually done by
drawing wax without prior sketches or outline on a cloth. Meanwhile, less expert painters may draw sketches or
outlines first on the cloth before tracing down using wax (Susanto, 1980). Newer designs of hand painted batik do
not follow existed traditional batik pattern, but depends entirely on the painters. In the case of giving names, batik
painters are free to give name each time they make new creations or designs of hand painted batik (Utoro, 1979).
Hand painted batik is batik with free pattern and motif and has no obligation, unlike traditional batik. The coloring
of hand painted batik is also free and various. Creations or designs using new way of coloring would generate colors
in dynamic and beautiful order, although it needs highly artistic imagination. The pictures in batik motif are drawn
by brushes of combination of brushes and canting (Soedjono, 1989).
RESEARCH METHOD
The making of hand painted batik of Garudeya story as a media of advertising Kidal Temple uses a method
composed by Gustami (2004), which steps are:
1. Exploration phase, a phase of exploring the source of ideas, data and reference collection, data processing The
result of the exploration or the analysis is used as the base for designing. In this step, the author did an
observation to examine people’s interest in visiting Kidal Temple. In addition to that, the author also observed
details of the relief which is the main attraction and characteristics of Kidal Temple. From those observations,
main idea and inspiration was perceived to make hand painted batik of Garudeya story. After that, the author
gathered data and information from humanists and reference books in relation to Garudeya story. Having most
of data and information, the author then processed, analyzed, and chose the idea that would be the base of design
making. Then, the author mapped out sequences of events from Garudeya story which will be visualized into a
hand painted batik.
2. Designing phase, a phase of visualizing the result of exploration or data analysis into some alternative sketch.
The author would choose a sketch from the options to be the main reference for any final design. This final
design (projection, fragments, details, or perspectives) will be referred in the materializing process. In this phase,
the authors made some alternative hand painted batik of Garudeya story designs, then discussed and chose a
design to be put in batik cloth.
3. Materialization phase, a phase of materializing the chosen design into a prototype, and made into perfection,
matching the idea. The model could be a miniature of the actual work. When the model is deemed as perfect,
then production process is conducted. This kind of process usually applies to the making of functional works. In
this phase, the authors made a hand drawn batik on a piece of cloth, started from sketching (nyorek), up to
coloring it.

Advertising Kidal Temple as a Tourism Site in the District of Malang, pp. 20–29
23
FINDINGS
The making process of this hand drawn batik of Garudeya, which adapts the concept of Kidal Temple’s relief, has
gone through art creation method by Gustami (2004) which are exploration stage, designing stage, and
materialization stage, eventually produced three works. The author classifies manifestations of this creation and
explains as following:
1. Ameŗtamanthana
Picture 1. Original structure of Garudeya carrying dragons on Kidal Temple
Picture 2. A design of hand painted batik, entitled Ameŗtamanthana
This design entitled Amertamanthana was drawn on a paper with a pencil. The object of this motif is inspired by
relief in first panel in Kidal Temple. In the relief Garudeya is portrayed in the position of crouching down, his right
leg is bend and kneeled down. Above his head there are three dragons. The dragons are on a lotus flower. The
dragons’ tails are hanging down and held by Garudeya. This panel tells about Winata and Garudeya, who lived as
Kadru and 100 dragon-sons’ slave. Garudeya’s job was to babysit Kadru’s snake-sons. Winata and her son was

Njo A., Joyo S., and Venny L.
24
enslaved by Kadru family, because he was cheated and lost in the bet of guessing the color of Uchaiswara horse
which emerged from milky ocean (samodra/ksirarwana). Honoring the bet, the loser must be the slave of the
winner.
2. The Battle in Finding Amerta Water
Picture 3. Original structure of the relief of Garudeya carrying Amerta Water in jar on Kidal Temple
Picture 4. A hand painted batik design, entitled the battle in finding Amerta Water
This design entitled The Battle in Finding Amerta Water was drawn on a paper with a pencil. The object of this
motif is inspired by relief in the second panel in Kidal Temple. In the relief Garudeya is portrayed in the position of
crouching down, his right leg is bend and kneeled down. His right hand is holding a bunch of grass, and on his head
there is Amerta water in a jar (Kamandalu). Garudeya put his life in the line as he struggled to get Amerta water,
Wisnu was almost defeated. Eventually wisnu was willing to lend the water to Garudeya in one condition:
Garudeya must be his ride.

Advertising Kidal Temple as a Tourism Site in the District of Malang, pp. 20–29
25
3. Garuda Wisnu Kencana
Picture 5. Original structure of a relief in which Garudeya carrying his mother on Kidal Temple
Picture 6. A hand painted batik design, entitled Garuda Wisnu Kencana
This design entitled Garuda Wisnu Kencana was drawn on a paper with a pencil. The object of this motif is inspired
by relief in the third panel in Kidal Temple. In this relief Garudeya is portrayed in the position of crouching down,
his right leg is bend and kneeled down. His right hand is raised and holding a round object. On his head, a woman
sitting on a lotus flower. Her left leg is folded in, while her right leg is hanging down and held by Garudeya’s right
hand. On her side, there are three dragons. Relief in this panel shows Garudeya was carrying his mother on his back
and flied from Kadru house, since they were freed. This relief is compared to the story of Garudeya from another
source. After handing Amerta water to the dragons, Garudeya asked the dragons to wash themselves first. As they

Njo A., Joyo S., and Venny L.
26
clean themselves, Indra took Amerta water. The dragons were sad, and licked the grass on where Amerta water
dripped. Thus, their tongues were sliced. Garudeya managed to free his mother and left the dragons as his mother
was freed from their slavery. After that, Garudeya fulfill his promise to Wisnu to be his mount.
DISCUSSION
This hand painted batik was created to help people easily understand Garudeya story, which is carved on a relief on
the Kidal Temple’s wall. Hopefully, since people understand the story on this hand painted batik, many more will
visit Kidal Temple and be interested to learn it. Thus, increasing the number of visitors in Kidal Temple. Type of
batik created by the author is hand painted batik using synthetic coloring. The author chose hand painted batik
because the mission of this creation is to promote Kidal Temple. So, the story of Garudeya can be clearly illustrated
and easily perceived by audience. It is quite different to handmade batik which employs highly enhanced processing
on the motifs, so that the motifs are hard to understand. In that case, people should have certain understanding to get
the meaning of its motifs. Hand painted batik is not restrained to certain pattern nor obliged to certain procedures,
thus it is easier to deliver meanings. Hand painted batik is a type of batik with various motifs and has no definite
pattern like handmade batik. Creations or designs using new way of coloring would generate colors in dynamic and
beautiful order, although it needs highly artistic imagination. The pictures in batik motif are drawn by brushes of
combination of brushes and canting (Soedjono, 1989). The result of Hand Painted Batik Creation using Garudeya
story on Kidal Temple is as following:
1. Hand painted Batik entitled Garuda Wisnu Kencana
Picture 7. A hand painted, entitled Garuda Wisnu Kencana
The first hand painted batik shows the surroundings in the middle of an ocean. The author visualizes ocean using
blue color combined with bright sky which represents burning spirit in a struggle. In this visualization there are
some figures, such as Garudeya, a dragon, a turtle, a flying horse, and Amerta water in a goblet. The author also
visualizes gods holding a dragon which tied a mountain in the middle of an ocean. This hand painted batik tells a
story of an act in which some gods along with Asura stired up an ocean to find Amerta water that was in the bottom
of the sea, as Winata and Kadru played quizzes. The mountain used to stir up the ocean was called Mount Mandara,
located in the Island of Sangkha (Sangkhadwipa). It was pulled out of the earth and used as a tool to stir the sea. A
Basuki dragon was used as a rope to turn the mountain. The dragon’s head was held by Asura, and the tail was held
by the gods. Under the mountain there was Akupa turtle, which was a foundation of the mountain, so that the
mountain was easy to turn, and was not sink.

Advertising Kidal Temple as a Tourism Site in the District of Malang, pp. 20–29
27
So, the ocean of Ksirarnawa was stirred up and from there came out Ardhacandra, Sri and Laksmi, Ucchaihsrawa’s
horse, Kostubha’s diamond, and finally Dhanwantari holding Swetakamandalu containing Amerta water. When the
gods, Asura and Daitya were resting, Wisnu shifted himself into a beautiful woman and took Kamandalu which
held Amerta water. This provoked war between gods which ended with gods’ winning. In Wisnuloka, the gods
drank Amerta water. Apparently amongst the gods there was a Danawa in disguise and he got to drink Amerta
water. His disguise was blown up by Chandra and Aditya. They told Wisnu, so he threw his cakra to Danawa. The
cakra hit Danawa on his neck. The body was dead, but his head was not. It was because as the cakra slice his throat,
Amerta water had reached his neck. Learning this turn of event, Daitya became angry, and on some occasion
Danawa’s head would swallow Candra and Aditya (Zoetmulder, 1974).
Meanwhile, the game or quiz between Garudeya’s mother, Winata, and Kadru, the mother of a hundred dragons,
also took place during this moment. Since Ksirarnawa Ocean was being stirred up, Uchaiswara horse would come
out of it. Winata guessed that Uchaiswara horse’s tail was white, but Kadru asked her sons to shoot out venom to
change the color of horse’s tail from white to black. Thus, Winata was lost and she became Kadru’s slave. Even
Garudeya who was not involved in the bet became her slave, too. In the illustration on batik motif, the author
depicted two parties, Garudeya on the right and dragons on the left. It can be interpreted as a condition of slavery
among people, such as imperialism and colonialism.
Picture 8. Hand painted batik, entitled the battle in finding Amerta Water
The second work tells a story of Garudeya’s effort to get Amerta water which was protected by Wisnu. The author
illustrates Garudeya in a battle position, surrounded by fire and clouds. It means in the fight Garudeya pour out his
power and strength in order to save his mother. In the hand painted batik, there is Amerta water in the middle of
whirling air of Wisnu’s cakra. It shows that Amerta water is a holy water guarded by the gods. Amerta water can
also mean eternal holy water (Zoetmulder, 1974). Freedom and immortality can only be apprehended if we talk
about jivan mokta, which is a characteristic of tantra religion about accelerating the process of moksa. It is a freedom
of all secular bonds to reach perfection, although the person is still alive (Santiko, 2015).
Considering his spirit to get Amerta water, in the battle between Wisnu and Garudeya, Wisnu was almost defeated.
Finally, Wisnu was willing to lend Amerta water, if only Garudeya wanted to be Wisnu’s mount. The main idea that
is illustrated in the batik is the fight grasping freedom from slavery.

Njo A., Joyo S., and Venny L.
28
In the third work, there are two storylines. The first is a story when Garudeya gave Amerta water to the dragons who
enslaved his mother. Garudeya is illustrated with his wings widespread and straightly stand to show his cautious
while facing the sly dragons. He must bring his mother out of Kadru and the dragons’ house. Meanwhile, two
dragons with open mouth is a visualization of the dragon’s desire to drink Amerta water soon. Amerta water from
Wisnu was handed to the dragons by Garudeya, then he told the dragons to clean themselves before drinking
Amerta water. At that moment, the water was taken by Indra. The dragons were sad, and licked the grass on where
Amerta water dripped. Thus, their tongues were sliced. Garudeya managed to free his mother and left the dragons as
his mother was freed from their slavery.
The second story is about flying Garudeya, along with Wisnu on his head. It is a visualization of Garudeya who
fulfilled his promise to Wisnu to be his ride. This story shows a dutiful son who fought vigorously to help his
mother, even Garudeya would do anything to free his mother. If this value is applied to the concept of nationalism,
we must be like Garudeya who defends his mother, in this case is our motherland, at all cost. Our ancestor had
applied this value as they drove out colony and gave Indonesia indepence. In the Javanese mythology Garudeya, as
a mount of Wisnu, blazed brightly, so most people would think him as Agni, God of Fire. Garudeya was considered
as the savior and used as a symbol of ever blazing spirit to fight.
3. Hand painted Batik entitled Garuda Wisnu Kencana
Picture 9. Hand painted batik, entitled Garuda Wisnu Kencana
CONCLUSION
The making of this hand painted batik is the author’s effort to help conserving Indonesian’s heritage which is Kidal
Temple by illustrating a story of Garudeya relief into a colorful and understandable batik motif. The privilege of
Garudeya relief in Kidal Temple is that it is the only story carved on Kidal Temple’s wall. It means Kidal Temple is
a temple which was made to tell the story of Garudeya. On other temples, the story of Garudeya is mingled with
other story as well.
By publishing this work in public, we hope common people know that Kidal Temple has its own stories and
interesting education philosophy. Apart from conserving a temple as a cultural heritage, the authors chose to make
this product to conserve batik as a Masterpieces of the Oral and the Intangible Heritage of Humanity, done by
UNESCO. Also, the authors want to introduce and pay attention to the philosophic value, which is an example of
human relation with God, in the temple’s relief and batik.

Advertising Kidal Temple as a Tourism Site in the District of Malang, pp. 20–29
29
REFERENCES
Atmojo, W. T. (2008). Pariwisata di Gianyar Bali dari wisata budaya sampai wisata wana. Jurnal Bahas, 69.
Cahyono, D. (2016). Kisah Garudeya Candi Kidal. Retrieved from https://www.jurnalmalang.com.
Gustami, S. P. (2004). Proses penciptaan seni kriya “untaian metodologis”. Tesis. Program Penciptaan Seni
Pascasarjana Institut Seni Indonesia Yogyakarta.
Santiko, H. (2015). Ragam hias ular-naga di tempat sakral periode Jawa Timur. AMERTA, Jurnal Penelitian dan
Pengembangan Arkeologi, 33(2), 85–96.
Sedyawati, E. (2010). Budaya Indonesia: Kajian arkeologi, seni, dan sejarah. Jakarta: Rajawali Pers.
Soedjono. (1989). Seri kreatif dan terampil batik lukis. Bandung: CV Remadja Karya.
Susanto, S. 1980. Seni kerajinan batik Indonesia. Jakarta: Balai Penelitian Batik dan Kerajinan, Lembaga Penelitian
dan Pendidikan Industri, Departement Perindustrian R.I.
Turaeni, N. N. T. (2015). Aplikasi adi parwa dalam relief situs Candi Kidal. Forum Arkeologi Volume, 28, (2), 131–
144.
Utoro, B. A. (1979). Pola-pola batik dan pewarnaan untuk SMK. Jakarta: Departemen Pendidikan dan Kebudaya-
an.
Wardani, Y. K. (2013). Makna simbolik relief Sudamala dan Garudeya di Candi Sukuh relevansinya dengan
pengembangan nilai-nilai karakter dalam pembelajaran IPS Sejarah. Skripsi. Fakultas Keguruan dan Ilmu
Pendidikan Universitas Sebelas Maret Surakarta.
Zoetmulder, P. J. (1974). Kalangwan: Sastra Jawa kuno selayang pandang. The Hague: Martinus Nijhoff.

30
3rd International Conference on Management & Entrepreneurship (3rd i-CoME) ISBN 978-602-5446-15-3
Phuket, 25th – 27th July 2019
ENHANCING MICRO-ENTREPRENEURS’ BUSINESS ACTIVITIES VIA
SMART MOBILE DEVICES: A CASE STUDY OF PHUKET
Vinyu Veerayangkur
Faculty of Management Science, Phuket Rajabhat University, Thailand,
Email: [email protected]
ABSTRACT Poor populations in developing countries receive tremendous benefits from using mobile phones in communication and business
activities. However, the debut of high-speed internet since 2010 transformed ordinary mobile phones into smartphones, which
became better devices for business, knowledge acquisition, communication, financial transactions, and so on. These develop-
ments seem to suggest that micro-entrepreneurs in developing countries should increase their use of smart mobile devices in the
future. Therefore, there is a crucial need to study environmental factors that enhance the use of smart mobile devices by Thai
micro-entrepreneurs. The population for the study was microbusiness operators in Muang district, Phuket, Thailand. 224 entre-
preneurs were chosen by purposive sampling at important trading sites during 2018. The instrument for the research was a
questionnaire which consisted of 23 variables divided into five independent factors (social, economic, data distribution, techno-
logy, and App platform) and a dependent factor (intention to use). Multiple regression analysis was used to analyze the collected
data. The results show a significant relationship between some environmental factors to the dependent factor. The results can
help academics and governments to understand micro-entrepreneurs’ hidden needs and to generate strategies enhancing micro-
entrepreneurs’ business activities toward Thailand’s 4.0 policy.
Keywords: Retailing, micro-entrepreneur, smartphone.
INTRODUCTION
There have been many movements to enhance online business. Internet communication technology is becoming a
channel of buying and selling goods and services for big business organizations. The development of application
software, mobile communication devices and the new generation of broadband cellular network technology has led
to a variety of B2C and C2C businesses. Consumer engagement of smart mobile devices is the key to business suc-
cess. On the other hand, smart mobile devices have also become instruments of learning, connection, and gateway
for limited budget entrepreneurs to learn and do businesses. These developments are in line with Thailand’s 4.0
policy. The government should encourage entrepreneurs and start-up businesses to seek more benefits from the
growing knowledge via online information.
During Thailand’s economic crisis in 1997, big businesses collapsed and the unemployment rate rose. The Thai go-
vernment has realized that most of small and medium enterprises (SME) have played a key role in strengthening
economic stability, creating new entrepreneurs, and generating income to the country. SME generates employment
at the grassroots level as well as providing the foundations of sustainable development (Niratorn, 2014). The
government has initiated several support programs and different financial resources to aid small and medium
enterprises and microbusinesses. In 2015, Bloomberg news agency (ASTV Manager Online, 2015) ranked Thailand
as the happiest economy from 15 economic zones worldwide. This survey used misery indicators (Misery index)
that affected consumers directly, including the inflation rate and the unemployment rate as measures of the econo-
mic health in each country. Later on, Thailand had the lowest misery index as a result of low inflation and low
unemployment from 2015 until 2018.
Bloomberg news agency (ASTV Manager Online, 2015) added an analysis from a spokesperson for the Bank of
Thailand who mentioned that the country's unemployment rate was low because the working age population, who
have no access to the labor market, can choose to enter the agricultural sector or develop their own business enter-
prise easily. For the latter, it can be said that their businesses can start out as a micro or small business easily with
low investment and appropriate qualifications. Being self-employed is perceived as a benefit by many in addition to
the financial side (Walker & Brown, 2004). Moreover, this easy startup may be due to a unique consumption
culture, Thailand’s way of life, and street business practices in Thailand. For example, consumers are used to buying
foods and other goods from businesses on the streets, but not on the public main roads. There has been little
government regulation, control, or law enforcement as there are low public health standards for street foods and
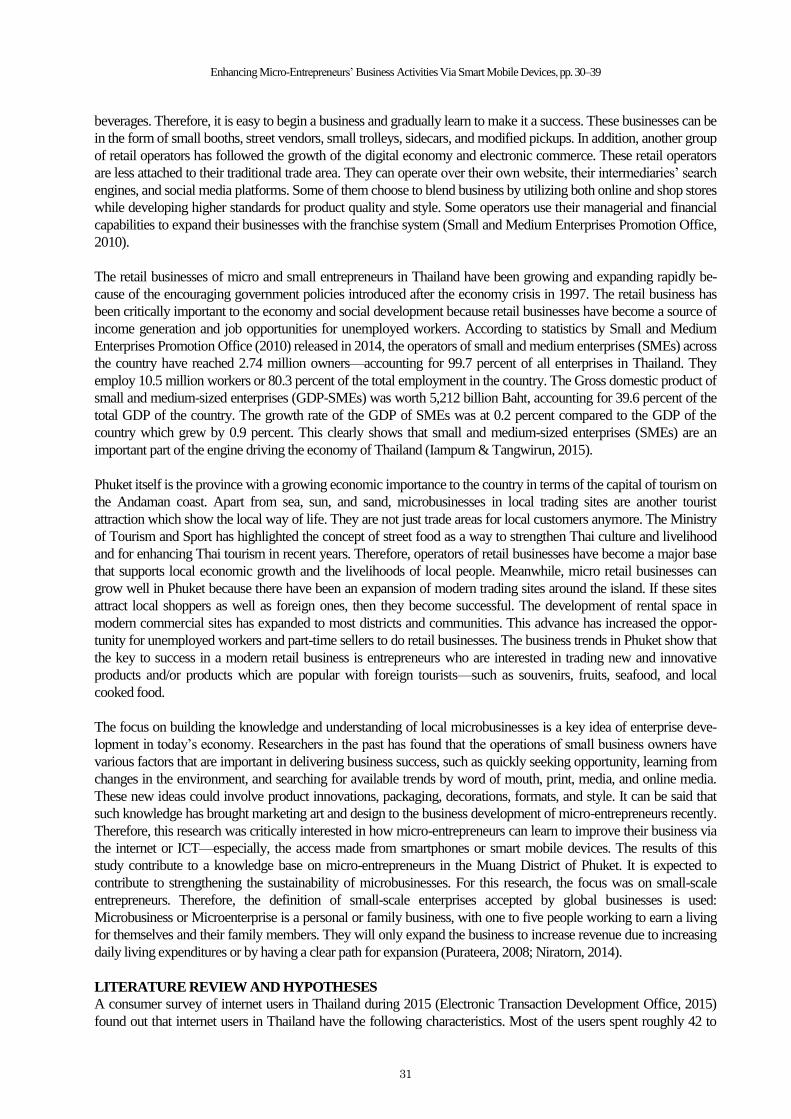
Enhancing Micro-Entrepreneurs’ Business Activities Via Smart Mobile Devices, pp. 30–39
31
beverages. Therefore, it is easy to begin a business and gradually learn to make it a success. These businesses can be
in the form of small booths, street vendors, small trolleys, sidecars, and modified pickups. In addition, another group
of retail operators has followed the growth of the digital economy and electronic commerce. These retail operators
are less attached to their traditional trade area. They can operate over their own website, their intermediaries’ search
engines, and social media platforms. Some of them choose to blend business by utilizing both online and shop stores
while developing higher standards for product quality and style. Some operators use their managerial and financial
capabilities to expand their businesses with the franchise system (Small and Medium Enterprises Promotion Office,
2010).
The retail businesses of micro and small entrepreneurs in Thailand have been growing and expanding rapidly be-
cause of the encouraging government policies introduced after the economy crisis in 1997. The retail business has
been critically important to the economy and social development because retail businesses have become a source of
income generation and job opportunities for unemployed workers. According to statistics by Small and Medium
Enterprises Promotion Office (2010) released in 2014, the operators of small and medium enterprises (SMEs) across
the country have reached 2.74 million owners—accounting for 99.7 percent of all enterprises in Thailand. They
employ 10.5 million workers or 80.3 percent of the total employment in the country. The Gross domestic product of
small and medium-sized enterprises (GDP-SMEs) was worth 5,212 billion Baht, accounting for 39.6 percent of the
total GDP of the country. The growth rate of the GDP of SMEs was at 0.2 percent compared to the GDP of the
country which grew by 0.9 percent. This clearly shows that small and medium-sized enterprises (SMEs) are an
important part of the engine driving the economy of Thailand (Iampum & Tangwirun, 2015).
Phuket itself is the province with a growing economic importance to the country in terms of the capital of tourism on
the Andaman coast. Apart from sea, sun, and sand, microbusinesses in local trading sites are another tourist
attraction which show the local way of life. They are not just trade areas for local customers anymore. The Ministry
of Tourism and Sport has highlighted the concept of street food as a way to strengthen Thai culture and livelihood
and for enhancing Thai tourism in recent years. Therefore, operators of retail businesses have become a major base
that supports local economic growth and the livelihoods of local people. Meanwhile, micro retail businesses can
grow well in Phuket because there have been an expansion of modern trading sites around the island. If these sites
attract local shoppers as well as foreign ones, then they become successful. The development of rental space in
modern commercial sites has expanded to most districts and communities. This advance has increased the oppor-
tunity for unemployed workers and part-time sellers to do retail businesses. The business trends in Phuket show that
the key to success in a modern retail business is entrepreneurs who are interested in trading new and innovative
products and/or products which are popular with foreign tourists—such as souvenirs, fruits, seafood, and local
cooked food.
The focus on building the knowledge and understanding of local microbusinesses is a key idea of enterprise deve-
lopment in today’s economy. Researchers in the past has found that the operations of small business owners have
various factors that are important in delivering business success, such as quickly seeking opportunity, learning from
changes in the environment, and searching for available trends by word of mouth, print, media, and online media.
These new ideas could involve product innovations, packaging, decorations, formats, and style. It can be said that
such knowledge has brought marketing art and design to the business development of micro-entrepreneurs recently.
Therefore, this research was critically interested in how micro-entrepreneurs can learn to improve their business via
the internet or ICT—especially, the access made from smartphones or smart mobile devices. The results of this
study contribute to a knowledge base on micro-entrepreneurs in the Muang District of Phuket. It is expected to
contribute to strengthening the sustainability of microbusinesses. For this research, the focus was on small-scale
entrepreneurs. Therefore, the definition of small-scale enterprises accepted by global businesses is used:
Microbusiness or Microenterprise is a personal or family business, with one to five people working to earn a living
for themselves and their family members. They will only expand the business to increase revenue due to increasing
daily living expenditures or by having a clear path for expansion (Purateera, 2008; Niratorn, 2014).
LITERATURE REVIEW AND HYPOTHESES
A consumer survey of internet users in Thailand during 2015 (Electronic Transaction Development Office, 2015)
found out that internet users in Thailand have the following characteristics. Most of the users spent roughly 42 to

Vinyu V.
32
76.9 hours per week on the internet, especially from Generation Y, while others spent roughly 54.2 hours per week
or roughly 7.7 hours per day. This survey suggested that Generation Y, who are part of the internet Era, have spent
much of their time on the internet and various social media networks. This indication confirmed the fact that
generation Y has a strong interest in various on-line communication and IT technology. They consumed the social
network media as part of their day-to-day life. Social network media has become a primary form of communication
among users. According to the National Statistical Office (2015), the generation who are between 15 to 24 years old
spent the highest usage fees for various benefits including entertainment, communication, information exchange,
electronic commerce, et cetera. According to Manager Online (2015), the young generation tends to follow social
trends and the lifestyle of their interest group. They like seeking for new things with heavy impact on the social
media network.
Smart mobile phones and their applications are one of the most important reasons why information and commu-
nication technology in the era of internet connection has become more and more popular and has become a part of
everyday life. Everyone, including public and private organizations, has been involved in the use of internet commu-
nication including public relations, marketing information, business operations, as well as teachers in academic
organizations. Smart phone equipment is innovative, high performance, low weight, and compact. So, it can be
carried anywhere. Internet accessibility devices have tended to shift from non-mobility type to be mobility-type,
especially via smartphones (both Android & IOS system). According to researchers, the advancement of technology
makes the availability and use of devices easier and more engaging for consumers. Consumers are increasingly
involved with the internet due to freedom of usage. Kim, Kim, and Wachter’s study aimed to explain the intentions
involved in device engagement as well as create a model explaining the relationship factors of the users’ motives,
the perceived value, and satisfaction which impact on the engagement intentions of mobile devices (Kim, Kim, &
Wachter, 2013). In addition to engagement, the technology, which comes with these mobile smart devices, is
important to business and marketing communications (Watson, McCarthy, & Rowley, 2013), such as spot-based
advertising via smartphones or the usage of QR Code Wine APP in the wine market, where information has a great
impact on the decision making of buyers (Higgins, Wolf, & Wolf, 2014). Moreover, regarding the technology trend,
research related to small business development has indicated that ICT plays an important role in entrepreneurship
development in business (Mali, 2015). But, the multiple barriers to using proper ICT systems, such as capital, low
level training, and inadequate operating capacity (Stansfield & Grant, 2003; Wolcott, Qureshi, & Kamal, 2007),
cause small business operators to access the ICT system via mobile phones as instruments for businesses, rather than
just communication devices (Matlala, Shambare, & Lebabo, 2014). Moreover, research by Rumanyika and Galan
(2015) states that there is a clear difference in capital growth between ordinary mobile phone users compared with
intelligent mobile users.
Therefore, this research would like to classify five environmental factors that can impact the intention of using
mobile devices in accessing the internet by micro-entrepreneurs as follows. First, on social aspects, the research
focuses on using the internet via smartphones in social activities, such as using mobile phones by family members
and friends for communicating on important occasions. Ramyakur’s (2018) study supports that online social net-
works create a huge demand for people who do not yet have intelligent mobile phones, entrepreneurs could spend a
lot of time in using the internet via smartphones to access social networks and communicate with close people.
Second, on economic aspects, micro-entrepreneurs could give importance to factors such as extra income with
increased convenience from online sales, affiliate communication in distribution channels, and cost reduction in
distribution channels for quality and style. Micro-entrepreneurs could use the smartphones to access the internet
more due to financial benefits in line with the results of Bovornkiratikajorn’s study (2017) on the trading of fashion
products in social media. The seller can easily enter the market due to low operating costs with an initial capital of
around 2,000 to 30,000 Baht (USD 60 to 1,000). By selling through social media, sellers do not need to have a
storefront or pay for the shop setting or the wages of the salesperson. This is even cheaper than selling e-Commerce
with a website because there is a cost to register a website domain name. There is also no profit sharing with
websites that are online shopping sites.
Third, on the information distribution aspect, the research focused on obtaining useful information for business
operations through sharing data, news, images, videos, and other content on the internet. Micro-entrepreneurs could

Enhancing Micro-Entrepreneurs’ Business Activities Via Smart Mobile Devices, pp. 30–39
33
use the smartphone to access the internet due to the variety of data in accordance with the study of Kidsom and
Vorlapanit (2015) on ―Willingness to Pay and Usage for High-speed Internet and Digital Economy Promotion of
the Local Administrative Unit: A Case Study of three Northern Provinces in Thailand‖. The results showed the use
of the internet in that target area as most of the sample used the internet to find information for work and for
watching professional training videos. There was a small number of sample groups that used the internet to find
market information and agricultural product prices or to seek knowledge in foreign languages. However, one ob-
vious benefit of using the Internet is that many people used it to find information about diseases, illnesses, as well as
the drugs use to treat diseases.
Fourth, on technological aspects, the research focuses on using smartphones to access the internet, such as system
speed, lower equipment prices, and government support for free Wi-Fi. Micro-entrepreneurs could use smartphones
to increasingly access the internet due to the development of stable system speeds in accordance with Ramyakur
(2018) who concluded that four factors, such as touch screen smartphones, high-speed internet, cost of using the
device, and online social network, are crucial to user engagement in Thailand. Furthermore, the results of Kidsom
and Vorlapanit’s study (2015) on ―Willingness to Pay and Usage for High-speed Internet and Digital Economy
Promotion of the Local Administrative Unit: A Case Study of three Northern Provinces in Thailand‖ found that the
average person would be able to pay an internet service fee in the range of USD 10 to 20 per month, with an average
monthly value of USD 15 per month. This study concluded that the sample group was willing to pay more when
they know they have a long wait to download data if they pay less.
Finally, on App platform aspects, the research focuses on the use of smartphones to access the internet, such as
business knowledge websites, online social networking, and communication networking. Micro-entrepreneurs use
the internet to access social networks online via smartphone due to the development of applications in various
platforms. Tarute, Nikou, and Gatautis (2017) add that the growing popularity of mobile technology and applica-
tions lead many companies to develop relations with consumers through a mobile application and suggest that
―design solutions and information quality will result in higher engagement leading to continuous usage of mobile
applications.‖ Applications should be convenient to use in order to communicate and create a business with others in
the online society.
Based on these previous studies, survey results, and trends, I am interested in studying the use of mobile phones in
accessing the internet by microbusiness operators in everyday life and the positive environmental factors that affect
the intention of usage. One benefit of this study is that it will improve our major understanding of mobile users,
allowing us to enhance the long term research, development, and planning of long term strategies for Thailand’s
Digital Economy detailed in the government’s ―Thailand 4.0‖ plan. Therefore, the research objectives are: 1) to
study the use of intelligent mobile devices by Microbusiness operators in Muang District, Phuket, and 2) to search
for a predictable relationship between enviromental factors and the intention to use smart mobile devices, such as
phones and tablets, to increase internet access. Therefore, the hypotheses are as follows:
Hypothesis testing
H1: There is a significant relationship between social factors and the intention to use smart mobile devices to access
the internet.
H2: There is a significant relationship between economic factors and the intention to use smart mobile devices to
access the internet.
H3: There is a significant relationship between data distribution factors and the intention to use smart mobile
devices to access the internet.
H4: There is a significant relationship between technology factors and the intention to use smart mobile devices to
access the internet.
H5: There is a significant relationship between App platform factors and the intention to use smart mobile devices
to access the internet.
Regarding Table 1, all Cronbach’s Alpha values for the six variables are higher than 0.6, therefore, all statements of
indicators are reliable measures of the variables.

Vinyu V.
34
Table 1
Operationalization of Variables
Variables Indicator Measurement Cronbach’s Alpha
Intention to use 1. willing to use smartphones in accessing the internet
continuously
2. willing to suggest friends and partners use smartphones to
access the internet
3. willing to learn more about how to use smartphones for
business
4. willing to pay more for higher technology on smart
mobile devices
5. spending more time in searching data via smartphone
6. searching data via smartphone more frequently
7. writing and sending data via smartphone more often
8. willing to pay more to access the internet
Likert scale 1–5
eight questions
0.950
Social factors
1. family members use smart phones
2. friends use smartphones
3. You follow the activities of family members and friends
via smartphone
Likert scale 1–5
three questions
0.91
Economic factors 1. earning more via online selling
2. business partners use social media for business
3. online transactions provide convenience and cost
reduction
Likert scale 1–5
three questions
0.912
Data distribution
factors
1. able to receive knowledge from videos on YouTube and
famous business blogs
2. able to read information and knowledge from business
websites
3. able to share business data in an online community
Likert scale 1–5
three questions
0.872
Technology factors 1. the speed of the internet increases the usage of online
social networks
2. cheaper price of mobile communication devices increase
the usage of online social networks
3. provincial authorities have increased open access to the
internet
Likert scale 1–5
three questions
0.865
App platform
factors
1. business knowledge websites (Thaifranshinecenter.com)
2. online social networks (Facebook, Instragram, YouTube)
3. online communication networks (Line, Msn, whatapp)
Likert scale 1–5
three questions
0.825
RESEARCH METHOD
Population and Sample
This explanatory study was intended to be a pilot quantitative study. The population of this study was roughly 500 to
700 business operators having businesses in several local markets in the area of Muang district, Phuket. The sample
size of 222 was calculated via the principle of Yamane (1967) with a confidence level of 95% and acceptable error
of 5%. Only entrepreneurs with a smartphone were selected purposively from the trading sites in the area of Muang
district. In case of mistakes and incomplete data, 250 sets of questionnaire were distributed to make sure the desired
number of 222 was reached.
Data Analysis
The methodology called for both descriptive analyses as well as inferential analysis, as detailed below. General/
demographic data included gender, age, education, length of business operation, type of access to the internet,
monthly expense for the internet, and mobile devices used to access the internet. The instrument for the research was
a questionnaire which consisted of 23 variables divided into five independent factors (social, economic, data distri-
bution, technology, and App platform) and a dependent factor (intention to use) as shown in Table 1. Analyzing data
about environmental factors which impact the use of smartphones to access the internet will involve descriptive
statistics, which include frequencies, percentages, means, and standard deviations.
For the interpretation of descriptive statistics, we will divide into five class internal, with equally interval (Bunnag,
1994):

Enhancing Micro-Entrepreneurs’ Business Activities Via Smart Mobile Devices, pp. 30–39
35
0.805
15
(C)Class
(R)Range(I)Interval
Below is the interpretation of each class interval, from Most to be Least as below:
Range: 4.21–5.00 indicated highest important
Range: 3.41–4.20 indicated highly important
Range: 2.61–3.40 indicated Fairly important
Range: 1.81–2.60 indicated Slightly important
Range: 1.00–1.80 indicated Least important
Inferential statistical analysis will involve the Pearson Product Moment Correlation Coefficient as well as Multiple
Regression Analysis.
FINDINGS
Data collection provided 224 completed sets of questionnaires. The findings of the data analysis of will be reported
descriptively first. Then the inferential analysis will be reported to answer the hypotheses later.
Table 2
Personal information of respondents
Category Characteristic Number in Sample Percentage Cumulative Percent
Gender Male 82 36.6 36.6
Female 142 63.4 100
Age Below 21 Years (not lower than 18) 5 2.2 2.2
21 to 30 Years 73 32.6 34.8
31 to 40 Years 79 35.3 70.1
More than 40 Years
(not higher than 65)
67 29.9 100
Education level Primary School 16 7.1 7.1
Early Secondary School 17 7.6 14.7
Late Secondary School 49 21.9 36.6
Undergraduate 22 9.8 46.4
Graduate 108 48.2 94.6
Postgraduate 12 5.4 100
Type of Access to internet Cellular network 120 53.6 53.6
Paid Wi-Fi network
Public free Wi-Fi
Home Wi-Fi
66
24
14
29.5
10.7
6.3
83.0
93.8
100
Length of business
operation
Less than 1 Year 35 15.6 15.6
1–3 Years 79 35.3 50.9
4–7 Years 53 23.7 74.6
More than 7 years 57 25.4 100
Monthly Expense for
Internet
Devices used to access the
internet
Less that USD 6
USD 6 to 13
USD 13.01 to 18
USD 18.01 to 24
More than USD 24
Smartphone
Laptop
Tablet
21
49
43
67
44
196
16
12
9.4
21.9
19.2
29.9
19.6
87.5
7.2
5.3
9.4
31.3
50.4
80.4
100
87.5
94.7
100
The research found that most of the sampled micro-entrepreneurs were female at 63.4.7 percent. Most of them were
in the age group of 21 to 30 years at 35.3 percent. Most of them were graduates at 48.2 percent. The length of the
business operations was mostly between 1 year and 3 years at 35.3 percent of the respondents. Most micro-entre-
preneurs used internet services via cellular systems of mobile phones at 53.6 percent of the respondents. The cost of
connecting to the internet is USD 18.01 to 24 for most, or 29.9 percent, of the respondents. The mobile device which
is most often used to access the internet is a smartphone at 87.5 percent of the respondents. In addition to the

Vinyu V.
36
personal information of the respondents, more than half of them originally lived in Phuket (53.1 percent of the
respondents). The size of the workforce in the business was at two to three persons for 47.3 percent of the respon-
dents. Investment expenses in the business were 5,000 to 10,000 Baht (USD 150 to 300) at 38.4 percent of the
respondents. The business category with the largest number of entrepreneurs is cooked food and drinks related busi-
nesses at 30.3% percent of the respondents. The most frequent number of times to read content using a mobile
device was between six to 10 times a day at 36.2 percent of the respondents. The average duration of reading con-
tent on a mobile device was 31 to 60 minutes, accounting for 25.4% of the respondents.
Table 3
The Means and Standard Deviations of Environmental Factors and the Intention to Access the Internet via Mobile
Devices Factor
Variable X Mean S.D. Importance level
Social factor (mso) 4.3155 .68413 highest
Economic factor (mec) 3.9122 .94478 high
Data distribution factor (mdd) 4.0045 .94623 high
Technology factor (mte) 4.1057 .82151 high
APP platform (map) 3.8824 .96298 high
Intention to use (Int, Y) 3.7974 .91077 high
Regarding the descriptive statistics presented in Table 3, the social factor is rated to be the highest in terms of
importance level to access the internet via mobile devices. The rest of the independent variables, plus the dependent
variable, are rated at a high level of importance.
Table 4
Correlations Coefficients between the Independent and the Dependent Variables
mso mdd mec mte map Int
mso Pearson Correlation 1 .502**
.587**
.604**
.514**
.538**
mdd Pearson Correlation 1 .657**
.676**
.699**
.631**
mec Pearson Correlation 1 .665**
.743**
.635**
mte Pearson Correlation 1 .695**
.639**
map Pearson Correlation 1 .664**
Int (Y) Pearson Correlation 1
**. Correlation is significant at the 0.01 level (2-tailed).
Correlation coefficients between the independent and the dependent variables were tested by using the Person's
Correlation Coefficient. These correlations were used to analyze the environmental factors relationship with the
intention of microbusiness entrepreneurs in Muang district, Phuket, to use mobile devices to access the internet.
Every independent variable had a positive relationship with the dependent variable that was significant at the 0.01
level (2-tailed, 0.538 – 0.664). So, all independent variables can be used to calculate the regression equation.
Table 5
Analysis of Variance (ANOVA) of the Environmental Factors Affecting the Intention of Using Mobile Communication
Devices to Access the Internet
Model Sum of Squares df Mean Square F Sig.
1 Regression 101.529 5 20.306 53.045 .000a
Residual 83.452 218 .383
Total 184.980 223
a. Predictors: (Constant), map, mso, mdd, mte, mec
b. Dependent Variable: Int
From Table 5, the results of variance analysis of multiple regression analysis confirmed that the independent
variables, including social factor, technological factor, data distribution factor, and App platform factors, affected the

Enhancing Micro-Entrepreneurs’ Business Activities Via Smart Mobile Devices, pp. 30–39
37
dependent variables on the intention of using mobile internet communication devices for business improvement.
The significant value of the equation was found to be at .000 within the statistically significant level at .01.
Table 6
Result of Multiple Regression Analysis
Model Unstandardized Coefficients Standardized Coefficients
t Sig. Collinearity Statistics
B Std. Error Beta Tolerance VIF
(Constant) .110 .273 .402 .688
mso .181 .080 .136 2.262 .025 .572 1.747
mdd .181 .067 .188 2.695 .008 .424 2.360
mec .135 .073 .140 1.852 .065 .364 2.743
mte .186 .081 .168 2.293 .023 .386 2.594
map .229 .074 .242 3.115 .002 .342 2.922
a. Dependent Variable: Int (Y)
R = 0.741 ; R2 = 0.549 ; F= 53.045 ; p-value = 0.000 < 0.01
From the Multiple Regression Analysis with the Enter method, it was found that the independent variables, or five
factors, had a fair relationship to the intention of using mobile devices to access the internet with R = 0.741. These
five variables can explain the overall effect on the intention of using a mobile internet communication device with a
54.90% forecast power, having a predicted error of 0.618. It was also found that not all environmental factors were
significant at the level of .000 (Sig = .000), which means that only four factors can predict the overall effect on the
intention of using mobile internet communication devices significantly. The best predictor variable is the App
platform factor which affects the intention of using mobile internet communication devices with a coefficient of
regression at 0.229. This is followed by the technological factor with a regression coefficient of 0.186, the data
distribution factor with a regression coefficient of 0.181, and the social factor with a regression coefficient of 0.181.
Lastly, the economic factor, with regression coefficient of 0.135, did not have a significant influence on intention
due to a p-value >.05. There is a significant relationship between four of the environmental factors and the intention
of using smart mobile devices to access the internet. Therefore, it can be concluded that H1, H3, H4, and H5 are
accepted and H2 is rejected.
Multicollinearity checks were carried out by examining the Variance Inflation Factor (VIF) or Tolerance or Eigen
Value. The criteria of examination were as follows: If the Eigen Value or Tolerance <0.2 or Tolerance <0
(Pedhazur, 1997), a multicollinearity problem is indicated. The Variance Inflation Factor or appropriate VIF should
not exceed 4. If so, the independent variables are correlated (Miles & Shevlin, 2001). From the results of Table 6, it
is found that the lowest tolerance value is 0.342, which is not lower than 0.2, and the highest VIF is 2.922, which is
less than 4. Therefore, the independent variables are unrelated or do not encounter the multicollinearity problem.
Based on Table 6, it was found that only some of the environmental factors affecting the choice of Internet access
devices had a positive relationship to the intention of using mobile internet communication devices for business
improvement. Int (Y) was statistically significant at the .01 level without any problems of multicollinearity as
indicated by the Tolerance and the calculated VIF. Creating multiple regression equations to predict the intention of
using Internet communication devices for business improvement can be done by using the factor values from Table
6 for both the raw score equation and standard score equation.
Forecast equation in raw score form:
Y (Overall effect on the intention of using mobile internet communication device) = .110 + .229 (App platform)
+.186 (Technology) +.181 (Data distribution) +.181 (Social) + .135 (Economic)
Equation of Forecast in Standard Score:
Z = .242 (App platform) +.188 (Data distribution) +.168 (Technology) +.136 (Social) + .140 (Economic)

Vinyu V.
38
Figure 1. The model of factors enhancing intention to access internet via smart phones
DISCUSSION
The personal information of the respondents trading in Muang district, Phuket, shows that they are middle-aged and
educated people that can cope well with digital technology. They can afford to pay monthly expenses to receive
adequate high speed internet. Most micro-entrepreneurs trade and sell products used in everyday life such as food,
drinks, clothes, accessories, and mobile phones. The research results are summarized in figure 1 and they show that
not all factors significantly influence the intention of using a mobile internet communication device. However, signi-
ficant relationships between four environmental factors and the intention of using mobile internet communication
devices were found. Although the economic factor has a positive relationship, it does not have a real impact on the
intention of using a mobile internet communication device. The cause of this low impact could be the nature of the
businesses that the sampled micro-entrepreneurs represent. They may not involve themselves in online business
enough to benefit or feel the importance of the economic factor. It is obvious that the social factor, the data distri-
bution factor, the technology factor, and the app platform factor are positively correlated with and influence the
intention of using a mobile internet communication device for this group of micro-entrepreneurs. These factors
seem to reflect some necessary conditions influencing the usage and engagement of mobile device users signi-
ficantly. On the other hand, the left out economic factor should not be ignored from further study because the factor
almost obtained a significant value and the mean score is at a high importance level. It might be proven to signi-
ficantly influence a different sample group.
CONCLUSION
The significant relationship between the environmental factors and micro business entrepreneurs’, in Muang district,
Phuket, intentions to use mobile devices in accessing the internet shows that generating innovative software
applications that suit various different groups of users exclusively must be given a long-term commitment. This will
help enhance the efficiency of using applications over a smartphone. The findings suggest that users are happy with
the present situation of services, but improvement of relevant information technology should be kept up to meet the
increasing expectations of smartphone users by improving information content and the technology of mobile
devices in line with future demands. Government policy should support private sector in the generation of useful
business content rather than working separately on government’s own, which is risky as its services may become
obsolete and out of date. This is due to the pressures and challenges of the rapidly changing world of the digital
economy and the need to implement Thailand’s 4.0 policy efficiently.

Enhancing Micro-Entrepreneurs’ Business Activities Via Smart Mobile Devices, pp. 30–39
39
ACKNOWLEDGEMENTS I would like to thank my students who helped with data collection and entry. Also many thanks are given to Dr. Jeffrey Dale Hobbs, Dr. Piengpen Na Pattalung, and Dr. Akkarin Thongkaw of Phuket Rajabaht University for their helpful suggestions. REFERENCES ASTV Manager Online (2015) Bloomberg" raises Thailand with the most economic happiness in the world.
Retrieved March 4, 2015, http://www.manager.co.th/Around/ViewNews.aspx?NewsID = 9580000026004. Bunnag, M. (1994). Statistics for decision making. Bangkok: Chulalongkorn University. Bovornkiratikajorn, C. (2017). Social commerce: A case study of fashion products. Veridian E-Journal, Silpakorn
University (Humanities, Social Sciences and arts),10(2), 2056–2071. Electronic Transaction Development Office (2015). Report of the survey of internet user behavior in Thailand in
2015. Bangkok: Index and Survey Division. Higgins, L. M., Wolf, M. M., & Wolf, M. J. (2014). Technological change in the wine market? The role of QR
codes and Wine apps in consumer wine purchases. Wine Economics and Policy, 3(1), 19–27. Iampum, J., & Tangwirun, A. (2015). Stat in focus, statistics and information department Bank of Thailand.
Retrieved March 4, 2015, https://www.bot.or.th/Thai/Statistics/Articles/Doc_Lib_ StatinFocus/SMEs.pdf. Kidsom, A., & Vorlapanit, N. (2015) Willingness to pay and usage for high-speed internet and digital economy
promotion of the local administrative unit: A case study of 3 northern provinces in Thailand, MUT. Journal of Business Administration, 12(2), 54–72.
Kim, Y. H., Kim, D. J., & Wachter, K. (2013). A study of mobile user engagement (MoEN): Engagement motivations, perceived value, satisfaction, and continued engagement intention. Decision Support System, 56, 361–370.
Mali, B. J. (2015). The impact of mobile phone usage on youth micro enterprise development in Embakasi South in Nairobi. Unpublished dissertation. The University of Nairobi, Kenya. Nairobi.
Manager Online. (2015). Insights into Thai consumer behavior in 3 GEN, (online). Retrieved from http: //www.manager.co.th/iBizChannel/ViewNews.aspx? NewsID = 9580000110621 (March 5, 2016).
Matlala, R., Shambare, R., & Lebambo, M. (2014). How South African spaza shop owners utilize mobile communication technologies to run their businesses. European Scientific Journal, 10(25), 180–195.
Miles, J., & Shevlin, M. (2001). Applying regression and correlation: A guide for students and researchers. London: Sage Publications.
National Statistical Office. (2015). Survey of the use of information and communication technology in household, 2015. Bangkok: Forecast Bureau.
Niratorn, N. (2014). Management of hawker trafficking in Bangkok: Observations and suggestions Journal of Sociology of Anthropology, 33(2), 47–72.
Pedhazur, E. J. (1997). Multiple regression in behavioral research: Explanation and prediction. Stamford, CT: Thomson Learning.
Purateera, T. (2008) The model for developing sustainable micro-entreprenneur. Doctor of Philosophy Thesis. Development Science, Graduate School, Khon Kaen University.
Ramyakur, P. (2018). Mobile revolution: A study of factors causing a step to mobile age in Thailand, and following impacts. Siam Communication Review, 17(22), 45–53.
Rumanyika, J. D., & Galan, R. M. (2015). The dynamics of mobile phone technologies and the performance of micro and small enterprises in Tanzania. The Third Asia Pacific Conference on Global Business, Economics, Finance and Banking.
Small and Medium Enterprises Promotion Office. (2010). Situation report small enterprises 2010. Bangkok: Office of Small and Medium Enterprises Promotion (OSMEP).
Stansfield, M., & Grant, K. (2003). An investigation into issues influencing the use of the internet and electronic commerce among small-medium sized enterprises. Journal of Electronic Commerce Research, 4(1), 15–33.
Tarute, A., Nikou, S., & Gatautis, R. (2017). Mobile application driven consumer engagement. Telematics and Informatics, 34(4), 145–156.
Walker, E., & Brown A. (2004) What success factors are important to small business owners? International Small Business Journal, 22(6), 577–594.
Watson, C., McCarthy, J., & Rowley, J. (2013). Consumer attitudes towards mobile marketing in the smart phone era. International Journal of Information Management, 33(5), 840–849.
Wolcott, P., Qureshi, S., & Kamal, M. (2007). An information technology therapy approach to micro-enterprise adoption of ICTs. AMCIS Proceeding.
Yamane, T. (1967). Statistics: An introductory analysis. 2nd
Edition, New York: Harper and Row.

40
3rd International Conference on Management & Entrepreneurship (3rd i-CoME) ISBN 978-602-5446-15-3
Phuket, 25th – 27th July 2019
FACTORS THAT INFLUENCE MINORITY ENTREPRENEURS IN
DEVELOPING A BUSINESS
Mutia Tri Satya
1, Abdul Fidayan
2
1 STIE Ekuitas, Jawa Barat, Indonesia
2 Universitas Sangga Buana YPKP, Jawa Barat, Indonesia
Email: [email protected]; [email protected]
2
ABSTRACT Minority entrepreneurs are categories of people who are distinguished from social majority (for example, ethnic minorities).
Minority entrepreneurs are an important source of creation and innovation of employment in the economy in several countries,
especially in Indonesia, as well as generate of economic development in their respective communities. However, few understand
about unique motivation, the factor that makes them become minority entrepreneurs, business strategies, and plans in the early
stages of forming their businesses. The method of measuring factors affecting minorities in entrepreneurship is suggested by Van
Den Bergh, Button, Nijkamp, and Pepping (1997) (200 these factors include: Ethnicity; Age; Level of education; job position
before becoming an entrepreneur; Experience about business activities; Motivation to start a business; Business sector; Business
planning; Sources of information and advice; Sales growth; Benefits; and the level of satisfaction with the business owned. The
research is quantitative by exploring the phenomenon found in the object under study. Quantitative was carried out using the
method of confirmatory factor analysis. The data obtained will be linked with the theory of ethnic minority entrepreneurs in
Bandung, Indonesia. Respondents from this study were entrepreneurs who came from Madurese, Minang, Batak ethnic
Keywords: Minority entrepreneur, factors entrepreneurs, business strategy.
INTRODUCTION
One of the factors behind the arrival of migrants to the city of Bandung is the availability of jobs in this city. The city
of Bandung has a variety of activities, so many residents from other regions come to and find work here. In 2017 it
was noted that the working age population population aged 15 years and above) in the city of Bandung was
1,932,114 people, consisting of 50.27 percent. The working age population is divided into the workforce and not the
workforce. Bandung City Work Force Participation Rate (TPAK) in 2017 was 63.11 percent. This TPAK shows an
increase when compared to the conditions in 2015 where the TPAK in Bandung was 62.52 percent.
Migrants in the city of Bandung who come from villages, or regions whose average income is smaller than Kota
Bandung, mostly work in the middle economic sector. Migrants who come with this condition see that the industrial
sector is not a sector that benefits them. With their background, migrants will end up as laborers in large industries.
While they came to Bandung City to improve the family's financial condition. In addition, to enter into large
factories, they must go through various recruitment procedures set by the factory. One of them is their domicile in
the city of Bandung. As is well known, migrants tend to have a reluctance to deal with civil offices. The increasing
number of migrants has made the Bandung City government as close as newcomers.
In addition to the industrial sector, there are also middle and middle and lower middle economic sectors. In this city,
there are communities that organize small and medium enterprises. To follow this kind of community does not
require long procedures, so migrants can enter easily. The growth in the number of Micro, Small and Medium
Enterprises (MSMes) units in Bandung in 2012–2017 is shown in Table 1.
Table 1 shows that from 2012–2017 the number of MSMEs in the city of Bandung continues to increase from year
to year. In 2012, the number of MSMEs was 3,291 units and until 2017 the number of MSMEs was 4,077 units.
This shows that more and more people choose to open their own businesses as a source of income. MSMEs in the
city of Bandung experience growth every year because of the economic growth in Bandung which is quite good.
According to Deden Y. Hidayat, Chair of Kamar Dagang Indonesia (KADIN) House of Chamber and Industry
Bandung City, "the growth of Micro, Small and Medium Enterprises (MSMEs) in the city of Bandung experienced
growth driven by the large absorption of products by the community, especially tourists".

Factors that Influence Minority Entrepreneurs in Developing a Business, pp. 40–51
41
Table 1
The Growth in the Number of Micro, Small and Medium Enterprises (MSMEs) in Bandung City in 2012–2017
Year Number of MSMEs ( Unit )
2012 3291 2013 3397 2014 3498 2015 3544 2016 3764 2017 4077
Source: The Office of Cooperative Micro, Small and Medium Enterprises and Industry Trade in Bandung City
Some of the migrants in Bandung are of the Minang, Batak and Madura ethnic groups. This study uses ethnic variables as one of the important variables. This is related to the reality that the number of entrepreneurial workers is different based on ethnic groups, and also aims to show that workers in choosing jobs are influenced by ethnicity. This is important in order to understand why a particular ethnic group controls the field of work that is not controlled by other ethnic groups. This writing seeks to answer how the characteristics of minority entrepreneurs in the city of Bandung are from the three ethnic groups. Ethnicity; Age; Level of education; job position before becoming an entrepreneur; Experience about business activities; Motivation to start a business; Business sector; Business plan-ning; Sources of information and advice; Sales growth; Benefits; and the level of satisfaction with the business owned.
LITERATURE REVIEW Entrepreneurship or entrepreneurship Often Also called is interpreted as the characteristics of courage, virtue, exemplary in taking risks originating from their own abilities (Wijandi, 1988).The emergence of entrepreneurship is nothing but a result of imbalances in the labor market. In other words, the workforce that is not accommodated in the formal sector will be faced with two problems, namely, they continue to be unemployed or they have to open their own jobs called entrepreneurship. Not to mention in looking for employment, they have to compete with other workers who have different characteristics. According to (Elfindri & Bachtiar, 2004)Antitrust competition in the same region / country can also occur due to differences in race, language, and level of education. This condition is caused by pressure on the labor market (Bachtiar & Amalia, 2012).
There are various kinds of entrepreneurial profiles put forward by (Zimmerer & Scarborough, 2005): a. Women entrepreneur is a woman who is engaged in business. These women work as entrepreneurs because they
have a variety of factors that encourage them including wanting to show their achievement abilities, helping the household economy, getting bored with their previous jobs and as housewives.
b. Minority entrepreneur the existence of minorities in a country makes them have different job opportunities than others. This makes them try to pursue business in their daily activities in order to develop and advance.
c. Immigrant entrepreneur It is migrants who come to an area. Usually, migrants find it difficult to get a job, so they develop a business as a livelihood.
d. Part-time entrepreneurs an entrepreneur who starts a business that will be run by filling in the empty time he has as a way to achieve greater effort or just to channel his hobbies.
e. Home-based entrepreneur Is an entrepreneur who runs his business from home or runs his business from home. f. Family own business in a family that develops various types and branches of business by giving up management
of their business for generations or only held by their own family members together. g. Copreneurs There are divisions in the management of jobs based on their respective expertise. People who are
experts in this field are appointed to be in charge of certain divisions of existing businesses.
When individuals decide to become paid workers/ salary workers or open their own jobs, there are two factors that influence it, namely internal factors and external factors. Internal factors originate from the characteristics of the individual concerned, such as age, sex, education, marital status, ethnicity, language skills, population status, and other individual characteristics. While external factors come from characteristics outside the individual's self, such as the economic condition of a country, the number of unemployed, limited employment opportunities and so on (Fairle & Meyer, 1994). In addition, according to Cuervo (2005) the characteristics of individual actors such as psychological aspects and non-psychological aspects also influence individual decisions to become self-employed/ entrepreneurial workers. Psychological aspects include the characteristics of independence possessed by individuals, such as motivation and desire for self-independence, while non-psychological aspects include heredity and social environment (Bachtiar & Amalia, 2012).

Mutia T. and Abdul F.
42
There’s two theories regarding the impetus for entrepreneurship, namely push theory and pull theory (Gilad & Levine, 1986). According to push theory, individuals are encouraged (push) for entrepreneurship due to negative direct incentives such as dissatisfaction with work, difficulty in finding work, inflexibility in working hours or insufficient salary. Conversely, pull theory argues that individuals are interested in entrepreneurship because they are indeed looking for things related to the entrepreneurial characteristics themselves, such as independence, or indeed because they believe entrepreneurship can provide prosperity. But many studies indicate that most individuals become entrepreneurs mainly due to pulling factors rather than push factors (Bachtiar & Amalia, 2012).
Some sociologists argue that more independent/entrepreneurial workers come from migrant groups who do not live permanently in the destination. They come to work with a relatively short time and not stay for longer in the destination. Light (1972) and Sowell (1981) reveal the existence of disadvantage theory in minority immigrant groups in the United States which causes certain groups to tend to become independent workers compared to wage workers. Then (Light, 1984) revealed about cultural theory, that cultural values contained in certain ethnicities could be the reason why people tend to choose to become entrepreneurs. The sources of ethnic culture include the culture of entrepreneurship, the transfer or skill of transmission in the relevant ethnic groups, as well as ethnic group solidarity such as orientation to migrants, networks/ ethnic support organizations both formal and informal.
Minority entrepreneurs are categories of people who are distinguished from the social majority (for example, ethnic minorities). Minority business companies are an important source of creation and innovation of employment in the economy in several countries, especially in Indonesia, as well as generate economic development in their respective communities. However, few understand unique motivation, the factor that makes them become minority entrepre-neurs, business strategies, and plans in the early stages of forming their businesses.
RESEARCH METHOD The research is quantitative by exploring the phenomenon found in the object under study. Quantitative analysis was carried out using the method of confirmatory factor analysis. The data obtained will be linked with the theory of ethnic minority entrepreneurs in Bandung, Indonesia. Respondents from this study were entrepreneurs who came from Madurese, Minang, and Batak ethnic. The total respondents used as many as 90 entrepreneurs in the city of Bandung from when the ethnic groups to be studied included 30 Madura entrepreneurs, 30 Minang businessmen, and 30 Batak entrepreneurs.
FINDINGS Questionnaire Results Based on data from 90 respondents, through a list of questions obtained the conditions of respondents regarding the origin of the Tribe, Age, Education Level, Previous Job, Form of Business, Length of Establishment of Business, and Income. Classification carried out on respondents in this study aims to know clearly about the results obtained from the distribution of questionnaires that have been done.
Table 2
Classification of Respondents
Frequency Percent
Origin of the Tribe Batak 30 33.3 %
Madura 30 33.3 %
Minang 30 33.3 %
Total 90 100 %
Age < 25 year 1 1.1 %
25–35 year 11 12.2 %
35–50 year 65 72.2 %
>50 year 13 14.4 %
Total 90 100.0 %
Last Education Degree Not Educated 0 0
SD (Elementary School) 0 0
SMP (Junior High School) 18 2%
SMA/SMK (Senior High School) 72 80%
University/College 0 0
Total 90 100%
Previous Job Students 0 0
Private employee 20 22.2%
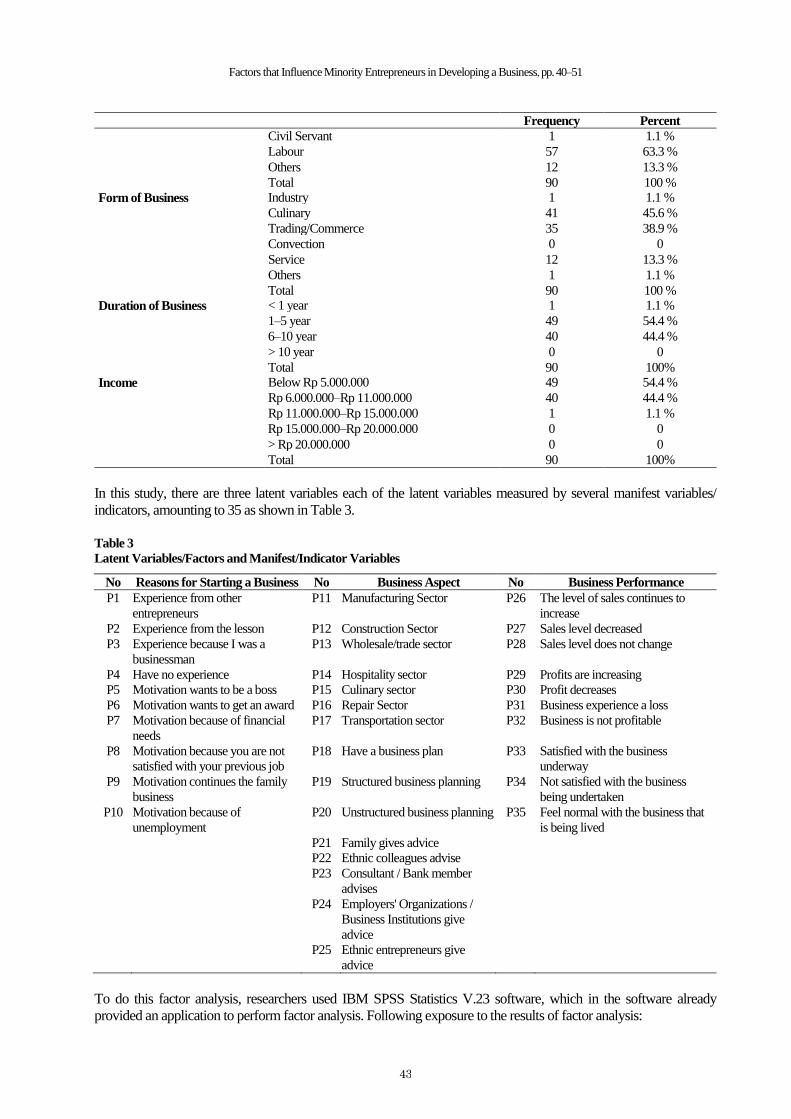
Factors that Influence Minority Entrepreneurs in Developing a Business, pp. 40–51
43
Frequency Percent
Civil Servant 1 1.1 %
Labour 57 63.3 %
Others 12 13.3 %
Total 90 100 %
Form of Business Industry 1 1.1 %
Culinary 41 45.6 %
Trading/Commerce 35 38.9 %
Convection 0 0
Service 12 13.3 %
Others 1 1.1 %
Total 90 100 %
Duration of Business < 1 year 1 1.1 %
1–5 year 49 54.4 %
6–10 year 40 44.4 %
> 10 year 0 0
Total 90 100%
Income Below Rp 5.000.000 49 54.4 %
Rp 6.000.000–Rp 11.000.000 40 44.4 %
Rp 11.000.000–Rp 15.000.000 1 1.1 %
Rp 15.000.000–Rp 20.000.000 0 0
> Rp 20.000.000 0 0
Total 90 100%
In this study, there are three latent variables each of the latent variables measured by several manifest variables/
indicators, amounting to 35 as shown in Table 3.
Table 3
Latent Variables/Factors and Manifest/Indicator Variables
No Reasons for Starting a Business No Business Aspect No Business Performance
P1 Experience from other
entrepreneurs
P11 Manufacturing Sector P26 The level of sales continues to
increase
P2 Experience from the lesson P12 Construction Sector P27 Sales level decreased
P3 Experience because I was a
businessman
P13 Wholesale/trade sector P28 Sales level does not change
P4 Have no experience P14 Hospitality sector P29 Profits are increasing
P5 Motivation wants to be a boss P15 Culinary sector P30 Profit decreases
P6 Motivation wants to get an award P16 Repair Sector P31 Business experience a loss
P7 Motivation because of financial
needs
P17 Transportation sector P32 Business is not profitable
P8 Motivation because you are not
satisfied with your previous job
P18 Have a business plan P33 Satisfied with the business
underway
P9 Motivation continues the family
business
P19 Structured business planning P34 Not satisfied with the business
being undertaken
P10 Motivation because of
unemployment
P20 Unstructured business planning P35 Feel normal with the business that
is being lived
P21 Family gives advice
P22 Ethnic colleagues advise
P23 Consultant / Bank member
advises
P24 Employers' Organizations /
Business Institutions give
advice
P25 Ethnic entrepreneurs give
advice
To do this factor analysis, researchers used IBM SPSS Statistics V.23 software, which in the software already
provided an application to perform factor analysis. Following exposure to the results of factor analysis:
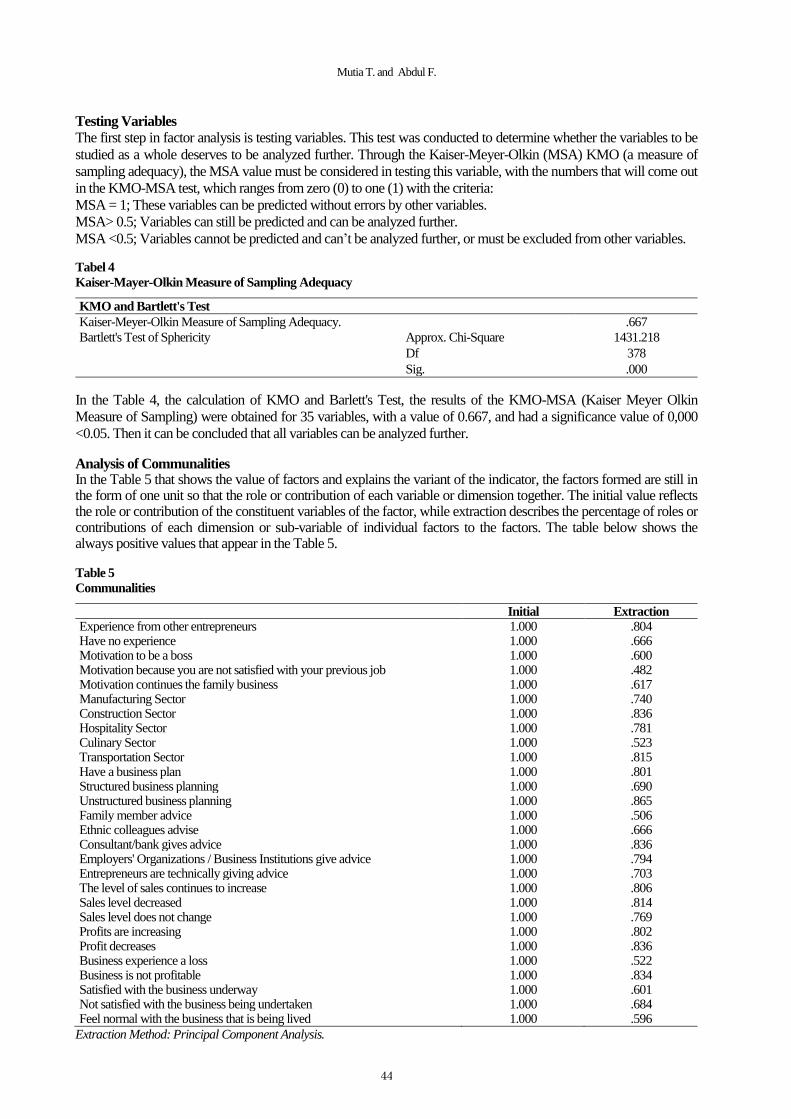
Mutia T. and Abdul F.
44
Testing Variables
The first step in factor analysis is testing variables. This test was conducted to determine whether the variables to be
studied as a whole deserves to be analyzed further. Through the Kaiser-Meyer-Olkin (MSA) KMO (a measure of
sampling adequacy), the MSA value must be considered in testing this variable, with the numbers that will come out
in the KMO-MSA test, which ranges from zero (0) to one (1) with the criteria:
MSA = 1; These variables can be predicted without errors by other variables.
MSA> 0.5; Variables can still be predicted and can be analyzed further.
MSA <0.5; Variables cannot be predicted and can’t be analyzed further, or must be excluded from other variables.
Tabel 4
Kaiser-Mayer-Olkin Measure of Sampling Adequacy
KMO and Bartlett's Test
Kaiser-Meyer-Olkin Measure of Sampling Adequacy. .667
Bartlett's Test of Sphericity Approx. Chi-Square 1431.218
Df 378
Sig. .000
In the Table 4, the calculation of KMO and Barlett's Test, the results of the KMO-MSA (Kaiser Meyer Olkin
Measure of Sampling) were obtained for 35 variables, with a value of 0.667, and had a significance value of 0,000
<0.05. Then it can be concluded that all variables can be analyzed further.
Analysis of Communalities In the Table 5 that shows the value of factors and explains the variant of the indicator, the factors formed are still in the form of one unit so that the role or contribution of each variable or dimension together. The initial value reflects the role or contribution of the constituent variables of the factor, while extraction describes the percentage of roles or contributions of each dimension or sub-variable of individual factors to the factors. The table below shows the always positive values that appear in the Table 5.
Table 5
Communalities
Initial Extraction
Experience from other entrepreneurs 1.000 .804 Have no experience 1.000 .666 Motivation to be a boss 1.000 .600 Motivation because you are not satisfied with your previous job 1.000 .482 Motivation continues the family business 1.000 .617 Manufacturing Sector 1.000 .740 Construction Sector 1.000 .836 Hospitality Sector 1.000 .781 Culinary Sector 1.000 .523 Transportation Sector 1.000 .815 Have a business plan 1.000 .801 Structured business planning 1.000 .690 Unstructured business planning 1.000 .865 Family member advice 1.000 .506 Ethnic colleagues advise 1.000 .666 Consultant/bank gives advice 1.000 .836 Employers' Organizations / Business Institutions give advice 1.000 .794 Entrepreneurs are technically giving advice 1.000 .703 The level of sales continues to increase 1.000 .806 Sales level decreased 1.000 .814 Sales level does not change 1.000 .769 Profits are increasing 1.000 .802 Profit decreases 1.000 .836 Business experience a loss 1.000 .522 Business is not profitable 1.000 .834 Satisfied with the business underway 1.000 .601 Not satisfied with the business being undertaken 1.000 .684 Feel normal with the business that is being lived 1.000 .596
Extraction Method: Principal Component Analysis.
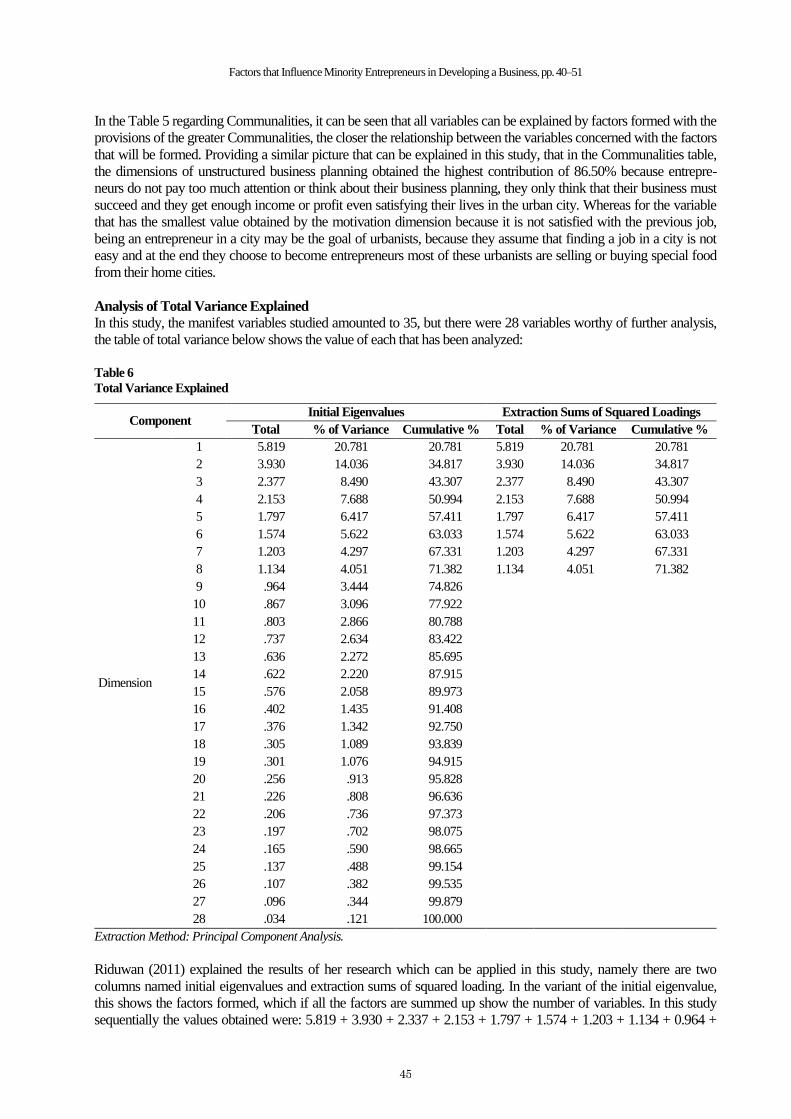
Factors that Influence Minority Entrepreneurs in Developing a Business, pp. 40–51
45
In the Table 5 regarding Communalities, it can be seen that all variables can be explained by factors formed with the
provisions of the greater Communalities, the closer the relationship between the variables concerned with the factors
that will be formed. Providing a similar picture that can be explained in this study, that in the Communalities table,
the dimensions of unstructured business planning obtained the highest contribution of 86.50% because entrepre-
neurs do not pay too much attention or think about their business planning, they only think that their business must
succeed and they get enough income or profit even satisfying their lives in the urban city. Whereas for the variable
that has the smallest value obtained by the motivation dimension because it is not satisfied with the previous job,
being an entrepreneur in a city may be the goal of urbanists, because they assume that finding a job in a city is not
easy and at the end they choose to become entrepreneurs most of these urbanists are selling or buying special food
from their home cities.
Analysis of Total Variance Explained
In this study, the manifest variables studied amounted to 35, but there were 28 variables worthy of further analysis,
the table of total variance below shows the value of each that has been analyzed:
Table 6
Total Variance Explained
Component Initial Eigenvalues Extraction Sums of Squared Loadings
Total % of Variance Cumulative % Total % of Variance Cumulative %
Dimension
1 5.819 20.781 20.781 5.819 20.781 20.781
2 3.930 14.036 34.817 3.930 14.036 34.817
3 2.377 8.490 43.307 2.377 8.490 43.307
4 2.153 7.688 50.994 2.153 7.688 50.994
5 1.797 6.417 57.411 1.797 6.417 57.411
6 1.574 5.622 63.033 1.574 5.622 63.033
7 1.203 4.297 67.331 1.203 4.297 67.331
8 1.134 4.051 71.382 1.134 4.051 71.382
9 .964 3.444 74.826
10 .867 3.096 77.922
11 .803 2.866 80.788
12 .737 2.634 83.422
13 .636 2.272 85.695
14 .622 2.220 87.915
15 .576 2.058 89.973
16 .402 1.435 91.408
17 .376 1.342 92.750
18 .305 1.089 93.839
19 .301 1.076 94.915
20 .256 .913 95.828
21 .226 .808 96.636
22 .206 .736 97.373
23 .197 .702 98.075
24 .165 .590 98.665
25 .137 .488 99.154
26 .107 .382 99.535
27 .096 .344 99.879
28 .034 .121 100.000
Extraction Method: Principal Component Analysis.
Riduwan (2011) explained the results of her research which can be applied in this study, namely there are two
columns named initial eigenvalues and extraction sums of squared loading. In the variant of the initial eigenvalue,
this shows the factors formed, which if all the factors are summed up show the number of variables. In this study
sequentially the values obtained were: 5.819 + 3.930 + 2.337 + 2.153 + 1.797 + 1.574 + 1.203 + 1.134 + 0.964 +
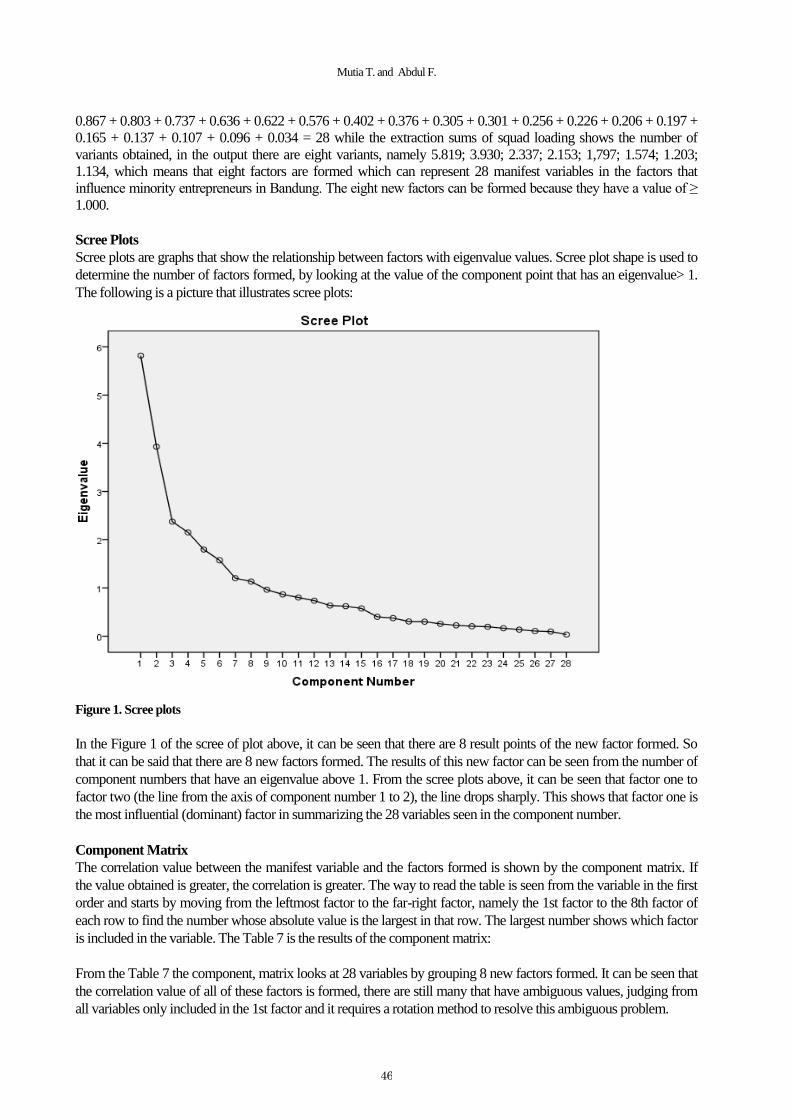
Mutia T. and Abdul F.
46
0.867 + 0.803 + 0.737 + 0.636 + 0.622 + 0.576 + 0.402 + 0.376 + 0.305 + 0.301 + 0.256 + 0.226 + 0.206 + 0.197 +
0.165 + 0.137 + 0.107 + 0.096 + 0.034 = 28 while the extraction sums of squad loading shows the number of
variants obtained, in the output there are eight variants, namely 5.819; 3.930; 2.337; 2.153; 1,797; 1.574; 1.203;
1.134, which means that eight factors are formed which can represent 28 manifest variables in the factors that
influence minority entrepreneurs in Bandung. The eight new factors can be formed because they have a value of ≥
1.000.
Scree Plots
Scree plots are graphs that show the relationship between factors with eigenvalue values. Scree plot shape is used to
determine the number of factors formed, by looking at the value of the component point that has an eigenvalue> 1.
The following is a picture that illustrates scree plots:
Figure 1. Scree plots
In the Figure 1 of the scree of plot above, it can be seen that there are 8 result points of the new factor formed. So
that it can be said that there are 8 new factors formed. The results of this new factor can be seen from the number of
component numbers that have an eigenvalue above 1. From the scree plots above, it can be seen that factor one to
factor two (the line from the axis of component number 1 to 2), the line drops sharply. This shows that factor one is
the most influential (dominant) factor in summarizing the 28 variables seen in the component number.
Component Matrix
The correlation value between the manifest variable and the factors formed is shown by the component matrix. If
the value obtained is greater, the correlation is greater. The way to read the table is seen from the variable in the first
order and starts by moving from the leftmost factor to the far-right factor, namely the 1st factor to the 8th factor of
each row to find the number whose absolute value is the largest in that row. The largest number shows which factor
is included in the variable. The Table 7 is the results of the component matrix:
From the Table 7 the component, matrix looks at 28 variables by grouping 8 new factors formed. It can be seen that
the correlation value of all of these factors is formed, there are still many that have ambiguous values, judging from
all variables only included in the 1st factor and it requires a rotation method to resolve this ambiguous problem.

Factors that Influence Minority Entrepreneurs in Developing a Business, pp. 40–51
47
Tabel 7
Component Matrix
Component
1 2 3 4 5 6 7 8
Experience from other entrepreneurs .421 -.033 .100 -,454 -,453 ,451 -,037 ,000
Have no experience -.415 -.101 -.303 ,282 ,506 -,220 ,085 ,022
Motivation to be a boss -.313 .012 .216 ,087 ,132 ,564 -,311 ,125
Motivation because you are not satisfied with your
previous job
.188 .381 .411 ,120 ,044 ,018 ,010 -,340
Motivation continues the family business .221 .171 .470 -,343 ,055 ,209 -,385 -,076
Manufacturing Sector .427 .598 .176 -,158 ,079 -,348 -,116 -,048
Construction Sector .625 .524 .185 -,095 ,005 -,345 -,094 ,013
Hospitality Sector .706 .307 .129 ,025 ,167 -,225 -,207 ,220
Culinary Sector .426 -.105 -.093 -,323 -,369 -,072 ,269 ,062
Transportation Sector .541 .604 .079 ,022 -,169 -,247 -,151 ,196
Have a business plan .453 -.134 .575 ,418 ,133 ,195 ,105 ,073
Structured business planning .544 .250 .118 ,217 -,028 -,120 ,446 -,236
Unstructured business planning .459 -.062 .432 ,596 ,180 ,180 ,189 ,089
Family member advice .557 -.244 .026 -,039 -,159 ,237 ,231 -,006
Ethnic colleagues advise .564 -.007 .037 -,171 ,045 ,362 ,298 ,309
Consultant / bank gives advice .528 .314 -.503 -,004 ,296 ,332 -,090 -,010
Employers' Organizations/Business Institutions give
advice
.422 .394 -.501 ,144 ,290 ,223 -,099 -,213
Entrepreneurs are technically giving advice .471 .345 -.377 -,110 ,385 ,212 -,006 ,120
The level of sales continues to increase .610 -.540 -.250 -,108 ,002 -,095 -,084 -,228
Sales level decreased -.338 .607 -.141 ,380 -,349 ,087 -,039 ,188
Sales level does not change -.402 .365 .233 -,450 ,219 -,061 ,349 ,209
Profits are increasing .653 -.526 -.226 -,143 -,019 -,114 -,045 -,109
Profit decreases -.268 .550 -.320 ,340 -,389 ,117 -,036 ,279
Business experience a loss .263 .324 -.501 ,013 -,178 ,041 ,249 -,025
Business is not profitable -.523 .406 .122 -,412 ,238 ,044 ,384 ,074
Satisfied with the business underway .404 -.434 .018 ,423 ,050 -,075 ,125 ,217
Not satisfied with the business being undertaken -.165 .355 .023 ,312 -,474 ,087 ,069 -,443
Feel normal with the business that is being lived -.207 .412 .082 -,065 ,284 ,251 ,140 -,457
Extraction Method: Principal Component Analysis.
a. 8 components extracted.
Factor Rotation
Factor rotation is useful to ensure that a variable is included in which group of factors, it can be determined by
looking at the largest correlation value between the variables with the formed factor (component). Following is the
table of results of factor rotation.
Table 8
Rotation Factor Rotated Component Matrix
Component
1 2 3 4 5 6 7 8
Experience from other entrepreneurs .043 .092 -.068 -.074 -.055 .876 -.112 .025
Have no experience -.279 .113 -.037 .106 -.036 -.735 .087 -.118
Motivation to be a boss -.270 .032 .165 .097 .096 .011 -.692 .034
Motivation because you are not satisfied with your
previous job
.362 -.026 .015 .078 .236 .028 -.090 .528
Motivation continues the family business .379 -.036 -.223 .075 -.018 .327 -.527 .176
Manufacturing Sector .818 .143 -.010 .123 -.035 .028 .079 .164
Construction Sector .868 .161 -.025 -.005 .097 .136 .145 .090
Hospitality Sector .760 .271 -.102 -.142 .257 .070 -.010 -.166
Culinary Sector .116 .010 -.126 -.056 -.034 .542 .417 -.147
Transportation Sector .810 .179 .275 -.053 .078 .179 .099 -.030
Have a business plan .157 -.084 -.131 -.133 .829 .107 -.168 .087
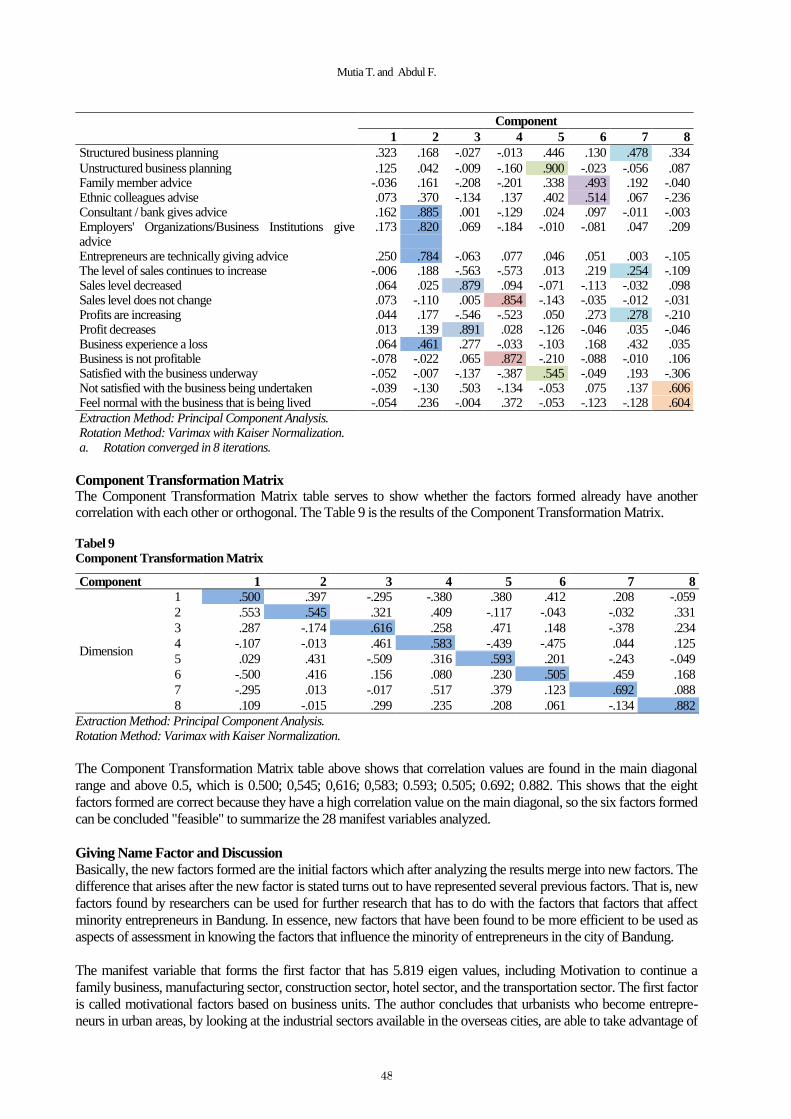
Mutia T. and Abdul F.
48
Component
1 2 3 4 5 6 7 8
Structured business planning .323 .168 -.027 -.013 .446 .130 .478 .334
Unstructured business planning .125 .042 -.009 -.160 .900 -.023 -.056 .087 Family member advice -.036 .161 -.208 -.201 .338 .493 .192 -.040 Ethnic colleagues advise .073 .370 -.134 .137 .402 .514 .067 -.236 Consultant / bank gives advice .162 .885 .001 -.129 .024 .097 -.011 -.003 Employers' Organizations/Business Institutions give advice
.173 .820 .069 -.184 -.010 -.081 .047 .209
Entrepreneurs are technically giving advice .250 .784 -.063 .077 .046 .051 .003 -.105 The level of sales continues to increase -.006 .188 -.563 -.573 .013 .219 .254 -.109 Sales level decreased .064 .025 .879 .094 -.071 -.113 -.032 .098 Sales level does not change .073 -.110 .005 .854 -.143 -.035 -.012 -.031 Profits are increasing .044 .177 -.546 -.523 .050 .273 .278 -.210 Profit decreases .013 .139 .891 .028 -.126 -.046 .035 -.046 Business experience a loss .064 .461 .277 -.033 -.103 .168 .432 .035 Business is not profitable -.078 -.022 .065 .872 -.210 -.088 -.010 .106 Satisfied with the business underway -.052 -.007 -.137 -.387 .545 -.049 .193 -.306 Not satisfied with the business being undertaken -.039 -.130 .503 -.134 -.053 .075 .137 .606 Feel normal with the business that is being lived -.054 .236 -.004 .372 -.053 -.123 -.128 .604
Extraction Method: Principal Component Analysis. Rotation Method: Varimax with Kaiser Normalization. a. Rotation converged in 8 iterations.
Component Transformation Matrix The Component Transformation Matrix table serves to show whether the factors formed already have another correlation with each other or orthogonal. The Table 9 is the results of the Component Transformation Matrix.
Tabel 9
Component Transformation Matrix
Component 1 2 3 4 5 6 7 8
Dimension
1 .500 .397 -.295 -.380 .380 .412 .208 -.059
2 .553 .545 .321 .409 -.117 -.043 -.032 .331
3 .287 -.174 .616 .258 .471 .148 -.378 .234
4 -.107 -.013 .461 .583 -.439 -.475 .044 .125
5 .029 .431 -.509 .316 .593 .201 -.243 -.049
6 -.500 .416 .156 .080 .230 .505 .459 .168
7 -.295 .013 -.017 .517 .379 .123 .692 .088
8 .109 -.015 .299 .235 .208 .061 -.134 .882
Extraction Method: Principal Component Analysis. Rotation Method: Varimax with Kaiser Normalization.
The Component Transformation Matrix table above shows that correlation values are found in the main diagonal
range and above 0.5, which is 0.500; 0,545; 0,616; 0,583; 0.593; 0.505; 0.692; 0.882. This shows that the eight
factors formed are correct because they have a high correlation value on the main diagonal, so the six factors formed
can be concluded "feasible" to summarize the 28 manifest variables analyzed.
Giving Name Factor and Discussion
Basically, the new factors formed are the initial factors which after analyzing the results merge into new factors. The
difference that arises after the new factor is stated turns out to have represented several previous factors. That is, new
factors found by researchers can be used for further research that has to do with the factors that factors that affect
minority entrepreneurs in Bandung. In essence, new factors that have been found to be more efficient to be used as
aspects of assessment in knowing the factors that influence the minority of entrepreneurs in the city of Bandung.
The manifest variable that forms the first factor that has 5.819 eigen values, including Motivation to continue a
family business, manufacturing sector, construction sector, hotel sector, and the transportation sector. The first factor
is called motivational factors based on business units. The author concludes that urbanists who become entrepre-
neurs in urban areas, by looking at the industrial sectors available in the overseas cities, are able to take advantage of
Factors that Influence Minority Entrepreneurs in Developing a Business, pp. 40–51
49
these conditions. The fact is that indeed in the city of Bandung itself there are many industrial sectors in manu-
facturing, construction, hospitality, and even transportation. These opportunities are taken by urbanists to open
business opportunities around the industrial area, with the aim of continuing the family business that has been under-
taken in their hometown.
The manifest variable that forms the second factor, including not having the experience, consultants/banks giving
advice, employers' organizations/business institutions giving advice, entrepreneurs as ethnic as giving advice, busi-
nesses experiencing losses. The factor that has an eigen value of 3.930 is named the information search factor,
because the authors conclude that urbanists do not have experience about becoming entrepreneurs in overseas cities,
and in the end some institutions and even ethnic entrepreneurs understand that it is not easy to become an entrepre-
neur in the city of overseas, and sometimes times both in the city itself or in the city of overseas experiencing losses
in conducting business activities is a common thing.
The third factor has an eigen value of 2.377, which is formed by manifest variables including, motivation to become
a boss, sales level decreases, profits decrease, these factors are named risk factors, why is that because when an
entrepreneur feels he wants to become a boss, he also must be willing to accept when sales and profits decline
because not all the time sales and profits can be stable, it takes a long time to make a business say successful with a
small percentage of sales and profits decreasing, along with the process of becoming a boss tested.
The fourth factor that becomes the factors that influence the minority of entrepreneurs is formed by the manifest
variable the level of sales does not change, and the business is not profitable. Factors that have an eigen value of
2.153, this factor is called a survival factor. Because it is not only products that have a life cycle but also business
activities that have a life cycle. Where the business will definitely enter in a situation where the business does not
experience an increase or decrease in sales and profits because in essence, the situation illustrates that the important
thing is that the business that is undertaken is able to survive and will definitely pass through the cycle.
For the fifth factor that is formed as an eigen value of 1.797, which consists of variables having business planning,
unstructured business planning, and being satisfied with the business being undertaken, this factor is named the
business unit planning factor. The fact is that when business activity has planned and even planning is considered
unstructured, it is able to influence the end result that will be achieved or obtained by an entrepreneur. Because with
a plan the maturity of business activity can be measured, and as an urbanist who becomes an entrepreneur in a
foreign city certainly has a business plan that will be undertaken
Then the sixth factor consists of experience variables from other entrepreneurs, the culinary sector, families give
advice, ethnic colleagues give advice, which has an eigen value of 1.574 named the strongest push factor. In
choosing a business unit in the culinary sector an entrepreneur urbanist must-see based on the experience of other
entrepreneurs who run business units in the same sector. In addition, an entrepreneur will ask for encouragement or
support from the people closest to achieving business goals.
The seventh factor formed has an eigen value of 1.203, which consists of structured manifest planning variables, the
level of sales continues to increase, profits increase, this factor is named the maturity factor of the business unit. That
in reality, if a business has a very mature plan, it will affect the future of the business undertaken. The more mature
the planning, the future of the business can be predicted to be more successful, because with a plan an entrepreneur
is ensured that he has been lame about how the business began, how to develop the business, starting from what
type of business will be run, which target market to achieve, how the selling price will be issued as well as what an
effective and efficient marketing strategy for the business that will be run.
For manifest variables that are formed in the 8th factor, among them motivation because they are not satisfied with
the previous job, are not satisfied with the business being undertaken, and feel normal with the business that is being
undertaken. This factor has an eigen value of 1.134 which will be named the factor of dissatisfaction. The reason an
urbanist becomes an entrepreneur in an overseas city is one of them is because he is not satisfied with their work in
the city of origin, with the intention of changing destiny, but sometimes when making a decision to become an
entrepreneur in the city, the results obtained are not always satisfying and possible occasionally the results obtained
are considered the same as the work first in the city of origin. That is one of the consequences or risks that must be
accepted when deciding to become an entrepreneur in a foreign city.
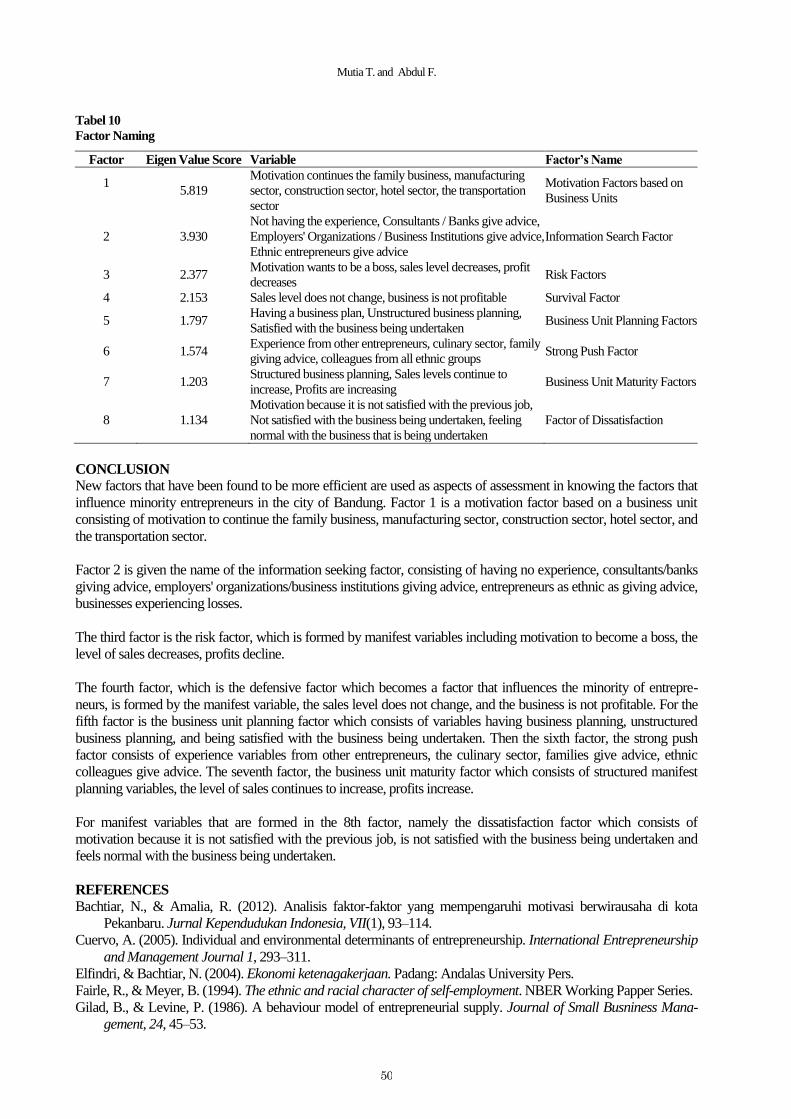
Mutia T. and Abdul F.
50
Tabel 10
Factor Naming
Factor Eigen Value Score Variable Factor’s Name
1
5.819
Motivation continues the family business, manufacturing
sector, construction sector, hotel sector, the transportation
sector
Motivation Factors based on
Business Units
2 3.930
Not having the experience, Consultants / Banks give advice,
Employers' Organizations / Business Institutions give advice,
Ethnic entrepreneurs give advice
Information Search Factor
3 2.377 Motivation wants to be a boss, sales level decreases, profit
decreases Risk Factors
4 2.153 Sales level does not change, business is not profitable Survival Factor
5 1.797 Having a business plan, Unstructured business planning,
Satisfied with the business being undertaken Business Unit Planning Factors
6 1.574 Experience from other entrepreneurs, culinary sector, family
giving advice, colleagues from all ethnic groups Strong Push Factor
7 1.203 Structured business planning, Sales levels continue to
increase, Profits are increasing Business Unit Maturity Factors
8 1.134
Motivation because it is not satisfied with the previous job,
Not satisfied with the business being undertaken, feeling
normal with the business that is being undertaken
Factor of Dissatisfaction
CONCLUSION
New factors that have been found to be more efficient are used as aspects of assessment in knowing the factors that
influence minority entrepreneurs in the city of Bandung. Factor 1 is a motivation factor based on a business unit
consisting of motivation to continue the family business, manufacturing sector, construction sector, hotel sector, and
the transportation sector.
Factor 2 is given the name of the information seeking factor, consisting of having no experience, consultants/banks
giving advice, employers' organizations/business institutions giving advice, entrepreneurs as ethnic as giving advice,
businesses experiencing losses.
The third factor is the risk factor, which is formed by manifest variables including motivation to become a boss, the
level of sales decreases, profits decline.
The fourth factor, which is the defensive factor which becomes a factor that influences the minority of entrepre-
neurs, is formed by the manifest variable, the sales level does not change, and the business is not profitable. For the
fifth factor is the business unit planning factor which consists of variables having business planning, unstructured
business planning, and being satisfied with the business being undertaken. Then the sixth factor, the strong push
factor consists of experience variables from other entrepreneurs, the culinary sector, families give advice, ethnic
colleagues give advice. The seventh factor, the business unit maturity factor which consists of structured manifest
planning variables, the level of sales continues to increase, profits increase.
For manifest variables that are formed in the 8th factor, namely the dissatisfaction factor which consists of
motivation because it is not satisfied with the previous job, is not satisfied with the business being undertaken and
feels normal with the business being undertaken.
REFERENCES
Bachtiar, N., & Amalia, R. (2012). Analisis faktor-faktor yang mempengaruhi motivasi berwirausaha di kota
Pekanbaru. Jurnal Kependudukan Indonesia, VII(1), 93–114.
Cuervo, A. (2005). Individual and environmental determinants of entrepreneurship. International Entrepreneurship
and Management Journal 1, 293–311.
Elfindri, & Bachtiar, N. (2004). Ekonomi ketenagakerjaan. Padang: Andalas University Pers.
Fairle, R., & Meyer, B. (1994). The ethnic and racial character of self-employment. NBER Working Papper Series.
Gilad, B., & Levine, P. (1986). A behaviour model of entrepreneurial supply. Journal of Small Busniness Mana-
gement, 24, 45–53.

Factors that Influence Minority Entrepreneurs in Developing a Business, pp. 40–51
51
Light, I. H. (1972). Ethic enterprise in America: Business and welfare among Chinese, Japanese, and Blacks.
Berkeley, CA: University of Californis Press.
-------- (1984). Immigrant and ethnic enterprise in North America. Ethnic and Racial Studies, 7(2), 195–216.
Riduwan. (2011). Cara menggunakan dan memakai path analysis. Bandung: Alfabeta.
Sowell, T. (1981). Ethnic America: A history. New York, NY: Basic Books.
Van den Bergh, J. C., Button, K. J., Nijkamp, P., & Pepping, G. C. (1997). Meta-analysis in environmental
economics. Dordrecht: Kluwer Academic Publishers.
Wijandi. (1988). Pengantar kewiraswastaan. Bandung: Sinar Baru.
Zimmerer, T. W., & Scarborough, N. M. (2005). Essentials of entrepreneurship and small business management.
4th Edition. Upper Saddle River, NJ: Prentice Hall.

52
3rd International Conference on Management & Entrepreneurship (3rd i-CoME) ISBN 978-602-5446-15-3
Phuket, 25th – 27th July 2019
MORATORIUM OF SACRED TEMPLE AREA AS A TOURIST
ATTRACTION
Putri Kusuma Sanjiwani
1, Luh Putu Kerti Pujani
2
1,2 Tourism Faculty of Udayana University, Indonesia
Email: [email protected]; [email protected]
2
ABSTRACT The main problem in this study is how form of arrogant attitude of management and local communities in the in sacred temple
area in Bali? How the effectiveness of the moratorium policy can save the sacred temple area in Bali? This research uses
empirical research and analysis facts in society with legal theory, policy concepts, the concept of moratorium, the concept of
tourism. The research location is in Bali, using primary and secondary legal sources. The technique of collecting data uses
observation, interviews and documentation. Analysis techniques use policy analysis techniques and policy evaluation techniques.
The moratorium cycle is a cycle that is between the cycle of stagnation and rejuvenation cycle/ cycle of decline. The moratorium
cycle can provide a break (time lag) for tourist attractions, especially the sacred temple area to return to the starting point. Back to
the vision and mission of tourist attraction, fix the management of the sacred temple area as a tourist attraction, not closed the
sacred temple area from religious activities but temporarily closes the sacred temple area from tourism activities.
Keywords: Tourism, moratorium, attraction.
INTRODUCTION
Bali Province is part of the Unitary State of the Republic of Indonesia and Bali has cultural potential as a superior
product of tourism. Balinese cultural tourism is closely related and cannot be separated from Hindu religious
activities and Hindu philosophy. Tourism activities that move massively have transformed agrarian life patterns into
tourism service industries. Local society are competing to build tourist attraction that relies on cultural assets and
local wisdom, trying to explore new potentials according to the 4A method (attraction, accessibility, amenities, and
ancillary) and use of the sacred temple area as a tourist attraction.
Temples in Bali are one of the cultural tourist attractions that are in great demand by tourists, so that there are quite a
number of temples in the sacred temple area of Sad Kahyangan, the sacred temple area of Dang Kahyangan and the
sacred temple area of Tri Kahyangan which are a tourist attraction. the sacred temple area of Kahyangan Jagat
Temple in every regency in Bali also doesn't escape the development of tourism. This opportunity provides two
impacts, namely positive impacts and negative impacts. The positive impact of tourism activities in the sacred
temple area provide alternative economic benefits for local communities, opening up the horizons mind of society
and tourism making villages more independent. The negative impact of tourism activities is tourism planning that
isn’t in accordance with government provisions in Spatial and Regional Planning in Bali Province in the sacred
temple area will destruct of the temple's sanctity radius that is considered sacred by the Hindu community in Bali.
Local community began competing to seize opportunities in the tourism industry. All kinds of opportunities will not
be missed, so that action arises outside the boundaries of the tourism code of ethics, namely the exploitation of
tourist attractions and arrogant attitudes. This study analyses two problems, namely the form of management
exploitation of the sacred temple area, the local community arrogance towards the sacred temple area and the
effectiveness of the moratorium policy in saving the holy area of the temple in Bali. The purpose of this study is to
provide an overview for world tourism stakeholders that the dual use of sacred temple area into tourism areas such
as blades, tourism can prosper society and tourism also damage life and socio-cultural and religious order if not
managed in a harmonious and sustainable.
The urgency of this study for analyzing the two temples has several reasons. First, according to Bali Province
regional regulation Number 16 of 2009 concerning Bali Province Spatial and Regional Plans for 2009–2029, Article
1 Paragraph 41, that the sanctuary area is "the area around the temple which needs to be kept clean and holy purity
within a certain radius according to the temple status as stipulated in Bhisama Kesucian Pura Parisadha Hindu
Dharma Indonesia Pusat (PHDIP) in 1994". It means, the sacred temple area should be free from the anarchist
activities, acts of arrogance, exploitation and things that are negative, particularly at odds with the norms of decency,
norm of morality, norm of law and norm of religion. Second, negative news or issue was published through digital
media that damaged the image of Bali tourism. Third, boycott action was carried out by travel agents so that it had

Moratorium of Sacred Temple Area as a Tourist Attraction, pp. 52–60
53
an impact on other tourism businesses around the sacred temple area. Fourth, tourism in the sacred temple area
experience a decline phase so that mean tourism will go into paralysis.
LITERATURE REVIEW
The Concept of Moratorium
A moratorium is a suspension, delay or termination of a certain activity within a specified time period. The
moratorium phase is not included in the tourism cycle. A moratorium arises in the phase of stagnation where tourist
attraction must choose will lead to the rejuvenation phase or the decline phase (Sanjiwani & Pujani, 2017b). A
tourist attraction requires a pause so that it can carry out self-monitoring and evaluation so that it can get out of the
crisis period. During the moratorium phase, tourist attraction will have a detrimental effect on local community
incomes, resulting in a deterrent effect for exploiters, arrogant actors and other actors as a source of the causes of a
crisis of tourist attraction. The moratorium can only be done if government policies provide results that are not in
accordance with what is expected, the crisis of trust from the public and employers towards the government and
uncontrolled community.
The Concept of Sacred Temple Area
The sacred area must be guarded from all profane matters, the sacred area is an area free from profane activities and
intended for religious activities. If tourism enters the sacred area, tourism will adjust to the holy area, not the sacred
area that adapts to tourism. Tourism activities in the sacred area are limited to a visit, tourists are not permitted to
carry out religious activities that can dissolve the sacred value of a temple (Sudiarta, 2011). The decision of the
Central Parisada Hindu Dharma Indonesia Number 11/Kep/I/PHDIP/1994 (Parisada Hindu Dharma Indonesia,
1994) which contains the radius of chastity which is divided into several types of temples, namely:
a. Sad Kahyangan Temple
Sad Kahyangan Temple has a radius of chastity at least Apeneleng Agung or equivalent to 5.000 meters from
the outside of the temple wall.
b. Dang Kahyangan Temple
Pura Dang Kahyangan has a radius of chastity at least Apeneleng Alit or equivalent to 2.000 meters from the
outside of the temple wall.
c. Kahyangan Tiga Temple and other temples
Kahyangan Tiga Temple and other temples have a purity of purity, at least Apenimpug/ Apenyengker or
equivalent with sacred area is only inside the temple wall area.
The Concept of Tourist Attraction
According to the Republic of Indonesia Law Number 10 of 2009 concerning tourism, tourist attraction is anything
that has a uniqueness, beauty and value in the form of natural, cultural, and human made diversity that is the target
or destination of tourist visits. Generally, in Indonesia, and refer to the law, tourist attraction divided into three parts,
namely natural tourist attraction, cultural tourist attraction, and artificial tourist attraction. Cultural tourist attraction is
Everything that is unique, beauty and value based on culture such as historical objects, traditions, art and everything
inherent in the life of a society. Temple classified into tourist attraction culture where there is a combination cultural
value and spiritual value. This uniqueness can only be found on the island of Bali.
RESEARCH METHOD
This research was conducted in a sacred temple area that has complex problems and every place has different
problems. The temples which is the main point as the location of this research is:
1. The sacred temple area of Sad Kahyangan which is represented by Besakih Temple. Pura Besakih is a temple
located at the foot of Mount Agung, precisely located in Besakih Village, Rendang District, Karangasem
Regency, Bali. Besakih temple is the highest position in Bali, because it became the center of Hindu religion in
Bali.

Putri K. S. and Luh P. K. P.
54
Picture 1. Besakih temple
Source: www.google.com
2. The sacred temple area of Kahyangan Jagat represented by Tirta Empul Temple. Tirta Empul Temple is located
in the village of Manukaya Village, Tampaksiring District, Gianyar Regency. Tirta Empul Temple is a temple
that has a holy spring water for source life and spiritual of community in Bali.
Picture 2. Tirta Empul temple
Source: www.indonesia.travel/shuttherstock
The scope of this research is the form of exploitation activities carried out in the sacred temple area, acts of arro-
gance of the local community, and moratorium policy to protect the sacred temple area. The scope of this research is
an effort to reinforce the scope of research problems so that the data aspects become clear and there are no biased or
distorted discussions.
This research is categorized as a qualitative research (Bungin, 2007). The types of research data sources derived
from primary data (main data obtained from informants) and secondary (data that supports primary data) (Bungin,
2003). Data collection techniques using observation, interview and documentation techniques. The technique of
determining informants in this study uses purposive sampling, determining the informants who are in accordance
with the criteria and competent for the problem of this research. The data analysis technique used is a qualitative
data analysis technique with an inductive logic approach, where the data obtained in the field will lead to general
conclusions.
DISCUSSION
Overview of The Sacred Temple Area in Bali
The first impression of tourists on Bali tourism is an island that is able to combine a spiritual base with a cultural
base as a unique value. These things are reflected in religious activities, customs, and behavior or patterns of life and
community behavior. The sacred temple area in Bali is mostly at exotic points of nature. The combination of temple
architecture and nature has a strong allure for tourists. The main temple in Bali is located in the sacred temple area of

Moratorium of Sacred Temple Area as a Tourist Attraction, pp. 52–60
55
Sad Kahyangan and Dang Kahyangan, the whole people/ Hindu society in Bali is carried out the prayer/ puja/
worshiped at the temple. It’s different from Tri Kahyangan Temple which is worshiped by local people according to
the boundaries of traditional villages. The temple which has general characteristics as a place of worship for Ida
Sang Hyang Widhi and the function of the temple which has a special function that is needed by the Hindu
community in Bali. This generally classified temple is worshiped by all Hindus, so often called the Kahyangan Jagat
Bali Temple.
Temple is a tangible cultural heritage that meets the criteria of Balinese cultural tourism. Sad Kahyangan Temple
developed as a leading tourist attraction in the regency area, the outstanding value of the attraction is that there is
philosophical value, socio-cultural value and religious value, so that tourists get a lot of experience in traveling. The
term temple with the meaning as a sacred place of worship of the Balinese Hindu community was used after the
Krisna Kepakisan Dynasty around the seventeenth century. The characteristics of temples in Bali generally have
three parts, in accordance with Bhisama PHDI (Arniati, 2015), namely:
1. Nistaning Mandala
Nistaning Mandala is the outermost part of the temple, where the outermost side of the temple is equated as the
most profane valued area compared to the other parts of the temple.
2. Madianing Mandala
Madianing Mandala is the middle part of the temple, where this part is a transitional part, which has a medium
sacred value. This area is also a semi-profane zone.
3. Utamaning Mandala
Utamaning Mandala is the most sacred part compared to other parts of the temple, because in this area there are
buildings or statues of gods that will be worshiped and believed to be the place of dwelling God.
Picture 3. Tri mandala concept
Source: www.google.com
Besakih Temple is a part of Sad Kahyangan Temple in Bali. PHDI regulating in Bhisama about Sad Kahyangan
Temple has a sanctity radius of at least Apeneleng Agung or equivalent to 5,000 meters (5 km) from the outside of
the temple wall. Tourism activities in Besakih Temple are in the entire Mandala area. Tourist activities are limited to
visiting and walking around looking at the temples of Besakih, to be able to get around the temple, tourists are
required to use light traditional clothing, such as wearing a sarong and a scarf at the waist. They want knowing the
history and philosophy of the temple, structuring temples and the meaning of each temple.
Tirta Empul Temple is a part of Kahyangan Jagat, special temple in obtaining holy water for all forms of cere-
monies in Bali. Tourism activities are in the Madianing Mandala and Nistaning Mandala areas. Tourist activities
piled up in the Madianing Mandala area, they did melukat activities mingling with the Balinese Hindu community
who did religious activities. Melukat activities also require tourists to use traditional clothing. Most of the tourists do
activities without doing sacred procession which is usually done by Hindu communities in Bali. The activities of
melukat are not bathing activities in the Pura but the activities of melukat are activities carried out with sacred
processions first, then wash themselves with holy water who have been prayed for with holy spells.
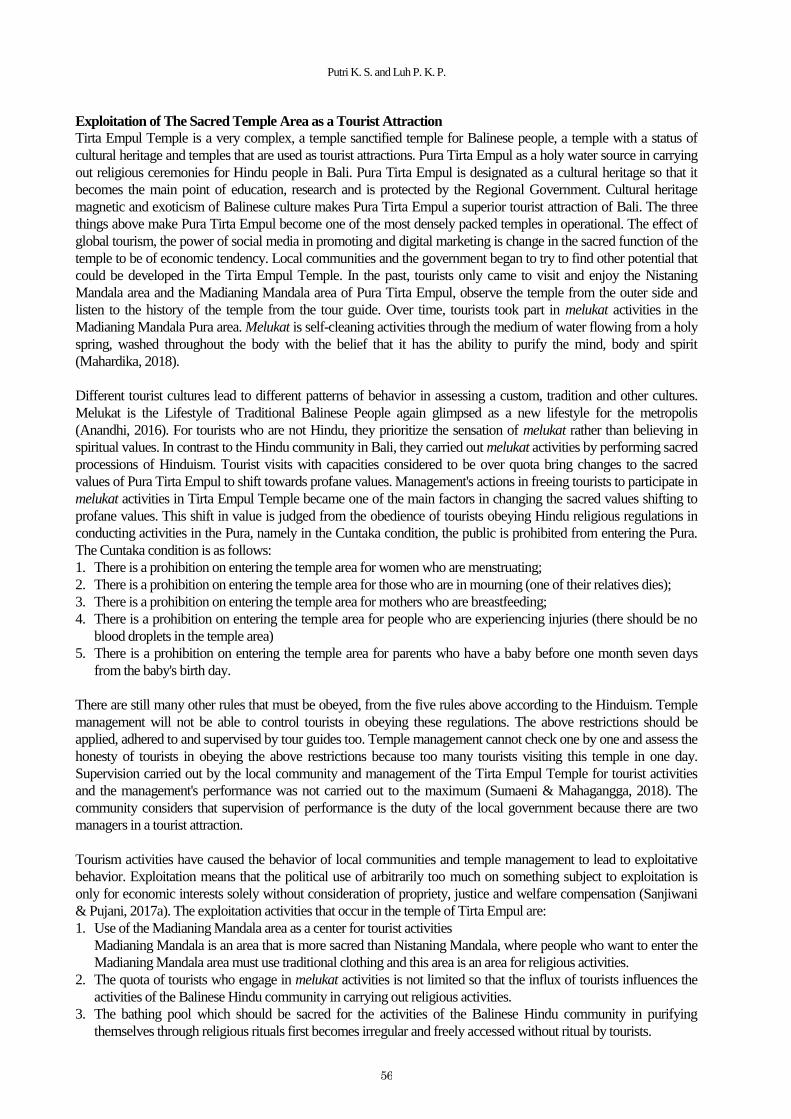
Putri K. S. and Luh P. K. P.
56
Exploitation of The Sacred Temple Area as a Tourist Attraction
Tirta Empul Temple is a very complex, a temple sanctified temple for Balinese people, a temple with a status of
cultural heritage and temples that are used as tourist attractions. Pura Tirta Empul as a holy water source in carrying
out religious ceremonies for Hindu people in Bali. Pura Tirta Empul is designated as a cultural heritage so that it
becomes the main point of education, research and is protected by the Regional Government. Cultural heritage
magnetic and exoticism of Balinese culture makes Pura Tirta Empul a superior tourist attraction of Bali. The three
things above make Pura Tirta Empul become one of the most densely packed temples in operational. The effect of
global tourism, the power of social media in promoting and digital marketing is change in the sacred function of the
temple to be of economic tendency. Local communities and the government began to try to find other potential that
could be developed in the Tirta Empul Temple. In the past, tourists only came to visit and enjoy the Nistaning
Mandala area and the Madianing Mandala area of Pura Tirta Empul, observe the temple from the outer side and
listen to the history of the temple from the tour guide. Over time, tourists took part in melukat activities in the
Madianing Mandala Pura area. Melukat is self-cleaning activities through the medium of water flowing from a holy
spring, washed throughout the body with the belief that it has the ability to purify the mind, body and spirit
(Mahardika, 2018).
Different tourist cultures lead to different patterns of behavior in assessing a custom, tradition and other cultures.
Melukat is the Lifestyle of Traditional Balinese People again glimpsed as a new lifestyle for the metropolis
(Anandhi, 2016). For tourists who are not Hindu, they prioritize the sensation of melukat rather than believing in
spiritual values. In contrast to the Hindu community in Bali, they carried out melukat activities by performing sacred
processions of Hinduism. Tourist visits with capacities considered to be over quota bring changes to the sacred
values of Pura Tirta Empul to shift towards profane values. Management's actions in freeing tourists to participate in
melukat activities in Tirta Empul Temple became one of the main factors in changing the sacred values shifting to
profane values. This shift in value is judged from the obedience of tourists obeying Hindu religious regulations in
conducting activities in the Pura, namely in the Cuntaka condition, the public is prohibited from entering the Pura.
The Cuntaka condition is as follows:
1. There is a prohibition on entering the temple area for women who are menstruating;
2. There is a prohibition on entering the temple area for those who are in mourning (one of their relatives dies);
3. There is a prohibition on entering the temple area for mothers who are breastfeeding;
4. There is a prohibition on entering the temple area for people who are experiencing injuries (there should be no
blood droplets in the temple area)
5. There is a prohibition on entering the temple area for parents who have a baby before one month seven days
from the baby's birth day.
There are still many other rules that must be obeyed, from the five rules above according to the Hinduism. Temple
management will not be able to control tourists in obeying these regulations. The above restrictions should be
applied, adhered to and supervised by tour guides too. Temple management cannot check one by one and assess the
honesty of tourists in obeying the above restrictions because too many tourists visiting this temple in one day.
Supervision carried out by the local community and management of the Tirta Empul Temple for tourist activities
and the management's performance was not carried out to the maximum (Sumaeni & Mahagangga, 2018). The
community considers that supervision of performance is the duty of the local government because there are two
managers in a tourist attraction.
Tourism activities have caused the behavior of local communities and temple management to lead to exploitative
behavior. Exploitation means that the political use of arbitrarily too much on something subject to exploitation is
only for economic interests solely without consideration of propriety, justice and welfare compensation (Sanjiwani
& Pujani, 2017a). The exploitation activities that occur in the temple of Tirta Empul are:
1. Use of the Madianing Mandala area as a center for tourist activities
Madianing Mandala is an area that is more sacred than Nistaning Mandala, where people who want to enter the
Madianing Mandala area must use traditional clothing and this area is an area for religious activities.
2. The quota of tourists who engage in melukat activities is not limited so that the influx of tourists influences the
activities of the Balinese Hindu community in carrying out religious activities.
3. The bathing pool which should be sacred for the activities of the Balinese Hindu community in purifying
themselves through religious rituals first becomes irregular and freely accessed without ritual by tourists.

Moratorium of Sacred Temple Area as a Tourist Attraction, pp. 52–60
57
Cultural heritage requires tourists who are exclusive, in the sense that tourists are tourists who value cultural heritage
and prioritize education from cultural heritage. It is very difficult in separating religious functions and values from
tourism. The uniqueness of the culture that merges into one with Hinduism makes uniqueness available with
universal values that can only be found in Bali. The number of tourists who exceed normal capacity will be very
dangerous for the sustainability of cultural heritage, over quotas of tourists will be very difficult to monitor, both
from attitude and behavior. Travel agents are required to participate in the preservation of cultural heritage and
realize sustainable tourism. They must be able to changing the high number of tourists not as threat to the sacred
area of Tirta Empul Temple.
Arrogant Action of Local Community in Tourism Activities in The Sacred Temple Area
The hopes of local community to live better in economic status make them break the norms that apply in society.
Arrogant action arises from the dissatisfaction of local people, especially local guides in fulfilling their daily needs.
The arrogant actions of local people in Sacred Area Besakih Temple began in 2012 until now. This arrogant action
was practiced by the local guide Sacred Area Besakih Temple. The disappointment of tourists for this arrogant
attitude was poured on electronic media such as Trip Advisor, social media, e-commerce application review and
personal blogs so that the effects of these disappointments quickly spread. Since this issue has become hot in the
media, local community and community leaders are reluctant to be invited to dialogue. They seem closed and try to
avoid the media, academics/ researchers, and the government.
Tourists can only complain to travel agents or tourism businesses around Besakih Village and outside Besakih
Village. Their complaints are difficult to convey to the management of Besakih Temple because of the closed
attitude they show. The forms of complaints expressed by tourists include:
1. Coercion the amount of donations set at USD 250;
2. Purchase of entrance tickets does not include parking, sarong rental and tour guide services;
3. Coercion using local guide services for tourists;
4. Prohibition of outside guides to enter the Besakih Temple area;
5. Most European tourists are charged 10 EURO charges for guide services that are personally negotiated by the
local guide.
Local guides take extortion actions when they are outside the supervision of the Besakih Temple management. The
form of extortion in the payment of guide fees is carried out when it is finished delivering tourists or before carrying
out guiding services.
The safety, comfort and trust of tourists is very important to obtain and maintain so that tourists, both domestic and
foreign tourists, still come to visit or take a repeater trip. Quite a lot of international tourists who cried due to running
out of money after visiting the Sacred Area Besakih Temple. Most of their sadness was expressed to tourism
businesses visited after visiting the Sacred Area Besakih Temple. The act of extortion is truly beyond the expecta-
tions of tourists. The travel agent has given a warning but there are always gaps for extortion. The arrogant action
causes a series of adverse effects for some parties such as:
1. Action boycotting travel agents in the form of not bringing tourists to visit Besakih Temple so that local people
experience a decline in income
Travel agent protested by removed the Sacred Area Besakih Temple tour package from their tour package list.
The Travel Agent doesn't bring tourists to the Sacred Temple Besakih Temple in a long time.
2. The occurrence of latent conflict towards tourism activities between local communities and tourism entrepre-
neurs (travel agents and tour guides from outside parties) and Regional Governments
Travel agents experience conflicts with local guides due to continuous negative reviews of tourists, thus giving a
bad track record to their business. The Regional Government's policy in disciplining local guides did not get a
response at all.
3. Tourism entrepreneurs around Besakih Village and outside Besakih Village become quiet and the income
decreases from the lack of tourist visits
Tourists who come to visit the Sacred Area Besakih Temple will be visit tourism businesses around Besakih
Village such as restaurants and rafting, usually these activities become tour packages offered by travel agents.
Automatically, the boycott will also affect the tourism business.

Putri K. S. and Luh P. K. P.
58
The efforts made by tourism stakeholders in approaching local communities have failure. People in other villages
always try to invite the elite and traditional leaders of Besakih Temple to meeting together. They tried to find
solutions to negative tourism issues, but the results were nil. Focus group discussion in 2016 on the Design of
Tourism in Karangasem Regency held at Maha Giri Restaurant, Rendang also invited adat leaders, Pura besakih
managers (before the Pura Besakih had management (MO)) and the elite of Besakih Village, but the result is failure.
Not one invitation from Besakih Temple came to attend the Focus Group Discussion. The Tourism Village in
Karangasem Regency is restless because the main tourist attraction of Karangasem Regency is the main symbol of
other tourist attractions. A symbol will give the first image or first impression that is very important to foster a sense
and desire to explore Karangasem Regency.
Moratorium Policy for Protecting the Sacred Temple Area in Bali
The government's policy goals are efficiency, equity and security. Government policies can be felt positively or
negatively for policy recipients, depending on how deeply they benefit from the object of policy. Government
policies must prioritize public interests rather than certain individuals and groups. Tourism policy needs to pay
attention to a number of things, especially in the four pillars of tourism development. The development of tourism
destinations is the main basis in take on policy for arrogant and exploitation action in the sacred temple area. This is
an important consideration in maintaining the stability of the tourism cycle so that it does not reach saturation.
The cycle of tourism movements is not lasting, they experience progress and setbacks such as amplitude waves.
Stakeholders must be able to see opportunities and read changes in circumstances. The habit of local people in
carrying out arrogant and exploitative actions has a basis in economic value so that the more people become
complacent about the economic value, the stronger the arrogant behavior and exploitation is carried out. The
arrogant and exploitative action making tourism trapped in shackles and then becomes an acute problem that is
difficult to resolve. Arrogant and exploitative actions can lead to tourist attraction in a crisis. The crisis situation is
able to cripple tourism in a gradual time if it is still in the prod moral crisis stage but it will be very difficult to
recover if it has entered the acute crisis / chronic crisis stage.
Picture 4. Tourism cycle
Source: www.google.com
When a tourist destination is in the cycle of stagnation (stagnation), then there will be two choices, namely:
1. Letting tourist attraction to be abandoned by tourists and entering the decline phase;
2. Moratorium for rejuvenation on sacred temple area as a tourist attraction.
Arrogant and exploitative actions can be suppressed by good communication such as focus group discussions
involving all levels of society and policy holders. If the resolution of the problem cannot be communicated again,
the attitude taking will be carried out as a form of government policy. The firm attitude of the Regional Government
as a chain breaker from arrogant actions and exploitation practices is a moratorium on the sacred region as a tourist

Moratorium of Sacred Temple Area as a Tourist Attraction, pp. 52–60
59
attraction. Moratorium of sacred temple area is the best way to be able to suppress exploitation activities, arrogant
actions and negative issues or negative images that have always haunted the Sacred Temple Area and has a wide-
spread impact. Negative imagery has a widespread impact on tourist attraction and tourism businesses around the
sacred temple area.
There are quite a lot of tourist attractions that undermine their intention to carry out the moratorium. Several reasons
stated include fear of losing the popularity of tourist attractions, the emergence of new superior competitors so that
tourist attraction will be difficult to get back up, job and livelihood losses, and reluctant to conduct monitoring and
evaluation of systems that have worked. The main tourist attraction in an area is too lulled by tourism and it is
difficult to see weaknesses and measure oneself. There needs to be a joint commitment in self-improvement to save
tourist attraction from a crisis. Every tourist attraction requires a break in fixing itself and requires space in restoring
a situation that is saturated with tourism activities. The form of the moratorium taken in the two types of problems
above is:
1. Moratorium of the sacred area Besakih Temple
The closure while sacred area besakih temple from the tour activities in total. The aim is to restore the function of
the Pura Besakih as a center of Hinduism and provide a deterrent effect for local guides. This temporary closure
is done to correct a number of things as follows:
Providing education to local communities about sustainable tourism and changing the mind set of local
communities in instil understanding cultural tourism;
Improving the management system in tour guides, updating standard operational procedure (SOP) and
requiring certification for local guides;
Suppress negative images by restoring the positive image of the sacred area Besakih Temple through positive
activities with the aim of avoiding a crisis situation;
Restoring the sense of security and comfort and trust of tourists in the sacred area Besakih Temple;
2. Moratorium of the sacred area Tirta Empul Temple
The moratorium on the sacred area of Pura Tirta Empul was not carried out in total but only in for the melukat
activities. There needs to be more mature consideration from the management of the temple and the local
community in utilizing the Madianing Mandala for tourism activities.
This moratorium is carried out to fix a number of things as follows:
Restoring the function of the Madianing Mandala as a sacred area to do activities in accordance with the rules
of Hinduism.
Considering changing places for tourists to do malukat activities outside the area of the Nistaning Mandala.
Tourists can still do melukat activities with different locations from Hindu community in Bali.
Avoid mass tourism that can threaten changes to cultural heritage sites.
CONCLUSION
A problem that continues to occur and experience omission will be difficult to resolve so that it has a negative
impact on both the internal and external tourist attractions. The sacred area of tourism has two choices in a state of
stagnation or crisis, namely letting tourist attraction to be abandoned by tourists and entering the decline phase or
moratorium for rejuvenation on sacred temple area as a tourist attraction. It is important to understand that the
moratorium offered is not a permanent halt to the sacred area as a tourist attraction but temporarily stops the sacred
temple area from tourism activities. The moratorium policy will not weaken the position of the sacred area as a
tourist attraction but the moratorium is used as a medium of evaluation in resolving latent problems, suppressing the
seeds of problems so that the sacred area is protected from the tourism crisis. The form of the moratorium taken in
the two types of problems above is:
1. Moratorium of the sacred area Besakih Temple by shutting down tourism activities to stop arrogant actions from
local tour guides and provide a deterrent effect to them;
2. Moratorium of the sacred area Tirta Empul Temple by stopping tourist activities to do melukat activities, to
avoid the sacred values that shift to profane values, and tourist activities are only in Nistaning Mandala.
Arrogant and exploitation actions are a weakness of the management of the sacred area in controlling the operation
of the sacred temple area as a tourist attraction. Strict rules must be accompanied by strict sanctions, so management
needs to hold regular monitoring and evaluation to be able to enforce the rules and impose sanctions on actions that
are beyond the limits.

Putri K. S. and Luh P. K. P.
60
REFERENCES
Anandhi, I. M. G. (2016). Melukat tourism: Water perspective in the contemporary era. Journal of Cultural Studies,
1(2), 105–109.
Arniati, I. A. K. (2015). Bhisama Parisada about the sanctity of the temple of interprestation over the sacred zone of
Uluwatu Temple. Dharmasmrti Journal, XIII(26), 100–112.
Badung District Regulation number 26 concerning the 2013–2033 Badung District spatial planning (2013).
Bungin, B. (2003). Qualitative research data analysis. Jakarta: PT Grafindo.
-------- (2007). Qualitative research. Second Edition. Jakarta: PT Prenada Media Group.
Mahardika, N. (2018). The essence of screaming rituals as a spiritual tourist attraction. Culture Tourism Journal,
3(2), 51–61.
Parisada Hindu Dharma Indonesia (1994). Decision of Parisada Hindu Dharma Indonesia number:
11/Kep/I/PHDIP/1994 concerning Bhisama Temple sanctity.
Regional Regulation of Bali Province number 16 concerning Bali Province spatial planning for 2009–2029 (2009).
Republic of Indonesia Law number 10 concerning tourism (2009).
Republic of Indonesia Law number 11 concerning cultural heritage (2010).
Sanjiwani, P. S., & Pujani, L. P. K. (2017a). Moratorium of sacred area Besakih Temple as a tourist attraction. A
paper presented in the Seminar of Innovation and Development of Tourism Creative as The Economic
Implementation Indonesian Society, Denpasar, Indonesia.
------------ (2017b). Exploitation of Goa Pindul as speleo tourism in Gunung Kidul, Yogyakarta. Tourism Analysis
Journal, 17(1), 17–23.
Sudiarta, I. K. (2011). Determination of sacred temple areas and areas of tourism in spatial planning in Bali. MMH
Journal, 40(1), 66–72.
Sumaeni, & Mahagangga. (2018). The management system for Tirta Empul Temple as a heritage attraction in
Tampak Siring Gianyar. Tourism Destination Journal, 5(2), 322–326.

61
3rd International Conference on Management & Entrepreneurship (3rd i-CoME) ISBN 978-602-5446-15-3
Phuket, 25th – 27th July 2019
EMPIRICAL STUDY OF RISK-TAKING ABILITY FACTOR OF STUDENTS’
ENTREPRENEURSHIP INTENTION
Tusshar Mahajan
Management Department, Institute of Management Studies, Ghaziabad, U.P., India
Email: [email protected]
ABSTRACT Entrepreneurship leads to socio-economic transformation. From students’ perspective, opting entrepreneurship as career is
challenging task because of risk and uncertain future. Several factors trigger Entrepreneurship Intention of students; Risk-taking
Ability is one such factor. This study analyzed Risk-taking Ability factor of entrepreneurship intentions of students with reference
to selected universities of North-India. Students having Risk-taking Ability were found to have more inclination towards
entrepreneurship. According to results of the study, Government University Male students were found to have more Risk-taking
Ability than Private University Male students, indicating that Government University Male students are having more Entrepre-
neurial Intention in terms of Risk-taking Ability.
Keywords: Entrepreneurship, entrepreneurship intention, risk-taking ability.
INTRODUCTION
Entrepreneurship plays an important role for economic growth, employment generation and social development.
Entrepreneurship enables society, to generate productive human resource, mobilize and sustain the same in subse-
quent process of development. Government, policymakers, academic institutions and different organizational bodies
are giving emphasis on entrepreneurship development in order to provide support for the budding entrepreneurs.
Students and young people can bring drastic change through entrepreneurship. Henry (2003) found that many
business graduates are unable to get a job, so there is need to enhance students’ entrepreneurship skills to start their
own business.
In this particular direction and especially in context of developing countries like India, there is scope of conducting
research. The present research study focused on identifying factors affecting entrepreneurship intentions of students
of selected universities of the North India region. The study analyzed the effect of risk-taking ability factor of
entrepreneurship intentions of students with respect to demographic variables.
LITERATURE REVIEW
One of the reasons to go for entrepreneurship is the utility derived from entrepreneurship as a career alternative.
Individuals choose entrepreneurship if the utility derived from this choice exceeds the utility derived from formal
employment (Douglas & Shepherd, 2000). Scarborough and Zimmerer (2003) reported that entrepreneurship is an
important driver for enhancing economic growth. Kuratko and Hodgetts (2004) showed that there is a significant
relationship between entrepreneurship and employment opportunities creation leading to technological change in
any financial system.
Venesaar and Loomets (2006) focused on identifying the intentions of students at Tallinn University of Technology
to start with business, their personality traits and contextual factors of business environment, including the role of
university in supporting students’ entrepreneurial intentions. They found that despite the considerable share of
respondents thinking about starting a business, most of them do not want to undertake entrepreneurial activity after
graduation, but postpone this to a more distant future. Bhandari (2006) conducted research study on group of
university students in India intended to start their own business or work for someone else. According to results of
factor analysis, six variables: to lead other people, to be my own boss, to put my innovative ideas into practice,
determination, personal challenge and non-business education were found to relate to the dependent variable.
Maalu, Nzuve, and Magutu (2010) found that the goals in entrepreneurial ability are influenced by factors such as:
maximum utilization of own skills and talents; full control of own future; achievement of what one values
personally; being “my own boss”; the freedom/opportunity to make own decisions; the opportunity to learn new
things; financial security; performing challenging and exciting work; having peace of mind with a peaceful and
stress-free life; allocation of enough free time for family, hobbies, leisure, and other interests; an opportunity to
extend one’s range of abilities, a goal to accumulate wealth; desire to live an adventurous and exciting life; the goal

Tusshar M.
62
to start own business, striving for an idea to own business, an ultimate goal to be self-employed and the wish to
become an influential person to the future.
Risk-taking & venturing is one of the major characters of entrepreneurs. It is willingness to bear substantial loss with
a motive to achieve higher profit subsequently (Forlani & Mullins, 2000). It has been reported that it is precisely this
willingness to take risks, which separates the entrepreneur from non-entrepreneurs (Elston & Audretsch, 2007).
Achchuthan and Nimalathasan (2012) studied Entrepreneurial intention among management undergraduates of Sri
Lanka. They reported that Self-employment Desirability and Risk-Tolerance influence intention of students toward
the entrepreneurship.
RESEARCH METHOD
The present study analyzed risk-taking ability factor of entrepreneurship intention with reference to students of
selected universities of North India. In this regard, objectives of the research study are as below:
1. To identify the main driving factors for Entrepreneurship Intention of students.
2. To study effect of specific demographic variables viz. gender, university type and area type on risk-taking ability
factor of entrepreneurship intention of students.
For the present study, data were collected through self-designed structured close-ended questionnaire based on 5-
point Likert Scale through convenient sampling. After validating, the final total sample size was 400. Factor Analy-
sis, ANOVA and t-test were applied for data analysis using SPSS 21. Cronbach alpha was found to be 0.82, indica-
ting higher reliability of the Questionnaire. The respondents were management and engineering students from go-
vernment and private universities belonging to Metropolitan area & Non-Metropolitan area, consisting of male and
female students.
FINDINGS AND DISCUSSION
First of all through the factor analysis, four driving factors of Entrepreneurship Intention were derived, which are:-
Factor 1: Autonomy Factor (When an individual is inclined towards entrepreneurship for the sake of freedom of
work); Factor 2: Need for Achievement Factor (When an individual needs some resources to achieve purpose of
entrepreneurship); Factor 3: Confidence in Support-system Factor (When an individual have confidence in govern-
ment and other support-system and then works hard to achieve effectiveness); and Factor 4: Risk-Taking Ability
Factor (When an individual knows risks related to entrepreneurship and ready to take risk).
The present study emphasized on risk-taking ability factor of entrepreneurship intention and the results are presented
in form of two problems and 16 hypotheses as follows:
Problem 1: Is risk-taking ability factor of entrepreneurial intention a function of university type, area and gender?
H01: Gender (Male students and female students) does not interact in terms of risk-taking ability factor of
entrepreneurial intention.
The null hypothesis is accepted (F= 1.897, p= .169)
H02: University type (Private university students and government university students) does not interact in terms of
risk-taking ability factor of entrepreneurial intention.
The null hypothesis is accepted (F= .872, p= .351)
H03: Area (Metropolitan area students and non-metropolitan area students) does not interact in terms of risk-taking
ability factor of entrepreneurial intention.
The null hypothesis is accepted (F=.479, p= .489)
H04: Gender and university type do not interact in terms of risk-taking ability factor of entrepreneurial intention.
The null hypothesis is accepted (F= .895, p= .345)
H05: Gender and area do not interact in terms of risk-taking ability factor of entrepreneurial intention.
The null hypothesis is accepted (F= 2.840, p= .093)
H06: University type and area do not interact in terms of risk-taking ability factor of entrepreneurial intention.
The null hypothesis is accepted (F= .012, p= .913)
H07: Gender, university type and area do not interact in terms of risk-taking ability factor of entrepreneurial
intention.
The null hypothesis is accepted (F=1.786, p= .182)

Empirical Study of Risk-Taking Ability Factor, pp. 61–65
63
Table 1
Tests of between-Subjects Effects
Source Type III Sum of Squares df Mean Square F Sig.
Corrected Model 104.648a 7 14.950 1.219 .291
Intercept 174101.996 1 174101.996 14193.309 .000
GENDER 23.267 1 23.267 1.897 .169
UNIV_TYPE 10.698 1 10.698 .872 .351
AREA 5.871 1 5.871 .479 .489
GENDER * UNIV_TYPE 10.975 1 10.975 .895 .345
GENDER * AREA 34.842 1 34.842 2.840 .093
UNIV_TYPE * AREA .146 1 .146 .012 .913
GENDER * UNIV_TYPE * AREA 21.913 1 21.913 1.786 .182
Error 4808.462 392 12.266
Total 192662.000 400
Corrected Total 4913.110 399
Dependent Variable: RISK_TAKING
a. R Squared = .021 (Adjusted R Squared = .004)
Problem 2: Do the students differ in terms of risk-taking ability factor of entrepreneurial intention?
H08: Male students do not differ significantly from female students in terms of risk-taking ability factor of
entrepreneurial intention.
MALE = 21.84 MALE ≈ FEMALE
FEMALE =21.49
The null hypothesis is accepted (t = .997, p=.319)
H09: Private university students do not differ significantly from government university students in terms of risk-
taking ability factor of entrepreneurial intention.
PRIV.UNIV. = 21.53 PRIV.UNIV. ≈ GOVT.UNIV.
GOVT.UNIV.= 21.80
The null hypothesis is accepted (t = -.769, p=.442)
H10: Metropolitan area students do not differ significantly from non-metropolitan area students in terms of risk-
taking ability factor of entrepreneurial intention.
METROPOLITAN = 21.63 NON-METROPOLITAN ≈ METROPOLITAN
NON-METROPOLITAN =21.71
The null hypothesis is accepted (t = -.228, p=.820)
H11: Metropolitan male students do not differ significantly from non-metropolitan male students in terms of risk-
taking ability factor of entrepreneurial intention.
METRO.MALE = 22.16 METRO.MALE ≈ NON-METRO.MALE
NON-METRO.MALE =21.52
The null hypothesis is accepted (t = 1.215, p=.226)
H12: Metropolitan female students do not differ significantly from non-metropolitan female students in terms of
risk-taking ability factor of entrepreneurial intention.
METRO.FEMALE = 21.09 NON-METRO.FEMALE ≈ METRO.FEMALE
NON-METRO.FEMALE =21.89
The null hypothesis is accepted (t = -1.737, p=.084)

Tusshar M.
64
H13: Private university male students do not differ significantly from government university male students in terms
of risk-taking ability factor of entrepreneurial intention.
PRIV.UNIV.MALE = 20.92 GOVT.UNIV.MALE > PRIV.UNIV.MALE
GOVT.UNIV.MALE =22.28
The null hypothesis is rejected (t = -2.515, p=.013)
Hence, private university male students differ significantly from government university male students in terms of
risk-taking ability factor of entrepreneurial intention. government university male students are found to be more
inclined towards risk-taking ability factor than private university male students. It shows that government university
male students are having more entrepreneurial intention in terms of risk-taking ability.
H14: Private university female students do not differ significantly from government university female students in
terms of risk-taking ability factor of entrepreneurial intention.
PRIV.UNIV.FEMALE = 21.55 PRIV.UNIV.FEMALE ≈ GOVT.UNIV.FEMALE
GOVT.UNIV.FEMALE =21.64
The null hypothesis is accepted (t = .159, p=.874)
H15: Private university male students do not differ significantly from private university female students in terms of
risk-taking ability factor of entrepreneurial intention.
PRIV.UNIV.MALE = 21.49 PRIV.UNIV.MALE ≈ PRIV.UNIV.FEMALE
PRIV.UNIV.FEMALE =21.55
The null hypothesis is accepted (t = -.101, p=.920)
H16: Government university male students do not differ significantly from government university female students
in terms of risk-taking ability factor of entrepreneurial intention.
GOVT.UNIV.MALE = 22.28 GOVT .UNIV.MALE ≈ GOVT .UNIV.FEMALE
GOVT .UNIV.FEMALE =21.42
The null hypothesis is accepted (t = -1.837, p=.068)
CONCLUSIONS AND RECOMMENDATIONS
The research analyzed risk-taking ability factor on entrepreneurship intention of students of selected universities of
North-India. Results of the study showed that private university male students differ significantly from government
university male students in terms of risk-taking ability factor of entrepreneurial intention. Government university
male students were found to have more risk-taking ability than private university male students, indicating that
government university male students are having more entrepreneurial intention in terms of risk-taking ability.
Hence, it can be concluded that in general government university male students are having more entrepreneurial
intention with reference to risk-taking ability.
During the study, it was observed that in comparison to government universities, students’ placement cell is func-
tioning better in private universities. It is also the fact that in Indian society, male members have more responsibility
for earning. Probably due to these reasons, government university male students are showing more risk-taking
ability in terms of entrepreneurial intention.
It implied that government universities/institutions and government bodies should take care of establishment and
effective functioning of Entrepreneurship Development Cell (EDC) to help and guide especially government uni-
versity male students, as well as female students too.
Empirical Study of Risk-Taking Ability Factor, pp. 61–65
65
REFERENCES
Achchuthan, S., & Nimalathasan, B. (2012). Level of entrepreneurial intention of the management undergraduates
in the University of Jaffna, Sri Lanka: Scholars and undergraduates perspective. South Asian Academic
Research Journals, 2(10), 24–42.
Bhandari, N. C. (2006). Intention for entrepreneurship among students in India. The Journal of Entrepreneurship,
15(2), 169–179.
Douglas, E. J., & Shepherd, D. A. (2000). Entrepreneurship as a utility-maximizing response. Journal of Business
Venturing, 15(3), 231–251.
Elston, J. A., & Audretsch, D. B. (2007). The role of risk in entrepreneurial behavior. In M. Minniti et al. (Eds.),
Entrepreneurship: The Engine of Growth, Volumes 1–3 (pp. 65–80). London, UK: Praeger.
Forlani, D., & Mullins, J. W. (2000). Perceived risks and choices in entrepreneurs new venture decisions. Journal of
Business Venturing, 15, 305–322.
Henry, B. (2003). Entrepreneurship education in Kenya: A reality or plodding on? Presented in The First
International Entrepreneurship Conference, 23–24 April, 2003 Kenya.
Kuratko, D. F., & Hodgetts, R. M. (2004). Entrepreneurship: Theory, process and practice. Ohio, US: Thomson
South-Western.
Maalu, J. K., Nzuve, S. M., & Magutu, P. O. (2010). A survey of personal goals and perceptions of entrepreneurial
ability among students at the school business, University of Nairobi. African Journal of Business &
Management, 1, 29–43.
Scarborough, N. M., & Zimmerer, T. W. (2003). Effective small business management: An entrepreneurial
approach. Seventh Edition. Upper Saddle River, NJ: Prentice Hall.
Venesaar, U., & Loomets, P. (2006). The role of entrepreneurship in economic development and implications for
sme policy in Estonia 1, Tallinn University of Technology, School of Economics and Business Administration,
Estonia. Paper presented to the 14th Nordic Conference on Small Business Research, May 11–13, 2006,
Stockholm, Sweden.

66
3rd International Conference on Management & Entrepreneurship (3rd i-CoME) ISBN 978-602-5446-15-3
Phuket, 25th – 27th July 2019
BUSINESS FAILURE OF FAMILY BUSINESS: A CASE IN MINING INDUSTRY INDONESIA ITS IMPLICATIONS FOR FUTURE BUSINESS
SUCCESS
Liliana Dewi1*
, Eko Budi Santoso2, Kazia Laturette
3, I Gusti Bagus Yosia Wiryakusuma
4
1,2,3,4 Faculty of Management and Business, University of Ciputra, Indonesia
*Corresponding author; Email: [email protected]
ABSTRACT The purpose of this paper is to analyze after of business failure by addressing: how the developed new ventures and what was the effect of the previous failure on the decision the owner to embark on subsequent ventures. The authors resort to qualitative methods to understand the effect of business failure from the owner's perspective. Authors undertook a semi-structured interview to the owner mining industry. The data are collected via interviews, observations, and literature reviews. The participants of the study include the director and a second-generation successor from a mining industry in Indonesia. The selection of objects is based on a purposive sampling method with related selection based on accessibility between researchers and the research participants. The result of this study shows that the effect of previous failures decides the owner goes into another business, namely business investment. Experience teaches that the readiness of employees to run a business is important, if it is not ready, then the owner's involvement is needed. Succession that does not go well results in business failure. Keywords: Business failure, family business, learning from failure, succession.
INTRODUCTION Every business has a life span that is depicted by its business life cycle. A business life cycle is normally defined by four stages; Introduction, Growth, Maturity and Decline. Most business life cycles will experience a slow introduce-tion and growth stage, a short maturity stage and a rather quick decline stage (Titus, 2005). There are five principle factors which are the main factors of business success, namely corporate structure, financial structure, productivity, technological procedures and human resources. The authors found that previous failure impacted individuals strongly, being shaped by the individual‟s experience and age, and their perception of the blame for the failure (Ibrahim, Soufani, & Lam, 2001). A firm‟s ownership structure and its features are considered very important antecedents of firm growth (Shleifer & Vishny, 1997; Thomsen & Pedersen, 2000). Firm‟s ownership seems especially interesting within the context of Family Firm as their ownership structures are generally driven by the family principals‟ priorities. Growth is also important for family firms as it represents the outcome of strategies develop to more successfully seize opportunities in the market (Le Breton-Miller & Miller, 2008), give new employment opportunities to suc-ceeding generations (Habbershon, Williams, & MacMillan, 2003). Therefore, growth is not only a measure of business success but also of the well-being of the family over time (Olson et al., 2003). Combination of family ownership structure and family ownership dynamics affects firm growth (Calabrò, Campopiano, & Basco, 2017). The majority of studies in business failure have focused on business rather than the owner of the business, while the entrepreneurs and the related factors are the most important factors in entrepreneurial process. The cases which have mostly attracted the attention of researchers are causes of business failure, patterns for failure prediction, and strategy for weak businesses, while the events occurred for company and its owner and manager were reviewed less than once (Stokes & Blackburn, 2002). Unsuccessful entrepreneurs who experience failure in businesses, “strategy and investment” is an important factor, while successful entrepreneurs do not emphasize on this it. Some researchers did not consider succession or succession planning as a control. Since a succession event can be a pivotal moment that causes a change in the ownership structure (Sciascia, Mazzola, & Chirico, 2013), it might be relevant for future research to consider whether family owners are involved in the succession process to further understand the effects of the dynamics and conflicts among them on growth. The focus of the current study is to gain more insight into long-lived family businesses by studying a case study of a family business in Indonesia. This study aims to analyze after of business failure by addressing: how the developed new ventures and what was the effect of the previous failure on the decision the owner to embark on subsequent ventures.

Business Failure of Family Business, pp. 66–70
67
LITERATURE REVIEW
In general, many different terminologies are related to business failure, such as firm closure, entrepreneurial exit,
dissolution, discontinuance, insolvency, organizational mortality, and bankruptcy (Cardozo & Borchert 2004). Typi-
cally, entrepreneurial failure is defined as the cease of an operation for financial reasons (Liao, Welsch, & Moutray,
2008).
Nonetheless, a failed business is the one which have to sell or liquidate in order to avoid losses or pay off the
creditors, or the one which is unable to make a profitable go of the business (Gaskill, Van Auken, & Manning,
1993). Pretorius (2009) reviewed the business failure definitions, and suggested a universal definition for the failure
phenomenon: “a venture fails when it involuntarily becomes unable to attract new debt; consequently, it cannot
continue to operate under the current ownership and management” (Pretorius, 2009).
Managerial experience and financial management team are vital in determining the success or failure of a firm; a
survey studying the causes of firm bankruptcy in Canada found that almost half of the firms in Canada go bankrupt
due to internal problems caused by managerial inexperience and lack of knowledge and vision (Baldwin, Bian,
Dupuy, & Gellatly, 2000). Management‟s motivation, qualities, and skills have an impact on the way a company is
managed. The majority of previous studies on business failure have confirmed the effect of “lack of management
skills” as the most important factor (Berryman, 1983; Gaskill et al., 1993; Baldwin et al., 2000; Tushabomwe-
Kazooba, 2006; Ooghe & De Prijcker, 2008).
Although there is no universal definition of what succession is, the definition proposed by Beckhard and Burke
(1983 in Handler, 1994) seems quite appropriate, namely: “the passing of the leadership baton from the founder-
owner to a successor who will either be a family member or a non-family member; that is, a „professional manager‟.
However, succession is not just a step of passing the baton, but instead it is a process that develops over several
stages that evolve over time and, in some cases, begin even before the successor enters the business (Handler, 1994).
It should be noted that succession should not be viewed as an event that occurs with the sudden death of the founder.
In fact, a succession results from effective planning soon after descendants enter the business (Ibrahim et al., 2001).
The successors‟ perspective family business, the succession process has drawn the attention of researchers who have
tried to identify those variables driving an effective succession.
For instance, Dyer (1986) believes that the role of business, family and administration (and their cultural setting) are
critical elements to the succession. The succession process encompasses a number of factors which are usually
associated with both the predecessor and successor. Among these factors, quality, harmony of family relations,
organizational culture and succession planning have been emphasized in relevant literature. After a qualitative study
with 32 family businesses, Handler (1989) found that mutual respect and a common vision between the founder and
successor are very important components of an effective succession. Several authors also stress the importance of
personal and professional realization of family members (Dunn, 1995; Basly, 2007).
RESEARCH METHOD
To explore this issue, this study conducted a case study research, which aims to describe the state of the problem.
According to Yin (2004), in Yin (2017), case study is an appropriate strategy to be implemented in a study when the
research wants to answer the "How" or "Why" of a problem and the research problem is directed to a series of
contemporary processes or events (the focus of the research lies on a contemporary phenomena). The research
participants are a director and a second generation successor from a family business that works in the mining
industry in Indonesia.
The type of data used in this study is qualitative data. According to Kuncoro (2010), qualitative data is a set of data
that cannot be measured with a numerical scale. The data was obtained from primary and secondary sources.
According to Lofland (1984) in Moleong (2014), the primary data includes the words and actions from the real-life
condition, while the rest acts as supporting data, such as documents and others. This research uses a purposive
sampling method (purposely), where the data is only provided by the members of the chosen population in
accordance with certain considerations (Sugiyono, 2014).
According to Miles and Huberman in Sugiyono (2014), analyzing a qualitative data needs to be done in an
interactive manners and lasted continuously; in result, the data is saturated. The data that will be analyzed includes:

Liliana D., Eko B. S., Kazia L., and I Gusti B. Y. W.
68
1. Reduction of data, which summarize, choose the main points, focuse on the important thing, and sought the
theme and pattern;
2. Presentation of data, in the form of brief descriptions, charts, relationships between categories, flowcharts, and
the like; and,
3. Conclusion or verification of conclusions based on the results.
FINDINGS AND DISCUSSION
The analysis was conducted based on the result of interview evaluation with the resource person, which then
compared the result of the interview from the resource person. Then, the interview between the participants will be
further compared with the observation result and the literature study.
The guideline research questions of the empirical work are How did the company close? How did you manage to
support them? Why did the company close? What main lessons did you take from the failure? How was the
opinion of yourself affected by the experience? and Did your attitude towards risk change after the experience? The
result of the research questions as follows Table 1.
Table 1
Interview with the Main Subject, Discussing about Ways to Analyze After of Business Failure by Addressing: How the
Developed New Ventures and What Was the Effect of the Previous Failure on the Decision the Owner to Embark on
Subsequent Ventures.
Interviewee Interview with the main subject Analysis
1. "... The point is that if I was a professional at first, then indeed the
professional time was made by the company. Well, the settings, my brother
who wants to help my father, then only 5 years to help, my brother died.."
2. "...Well, that's a special logistics, just, after 25 years, the mining industry in
2012 is like this, now we are introspection, in 2010 it was a good time we
never looked at other businesses, because we did see a better focus right,
even though at that time I also began to understand the concept of Warren
Buffet, but maybe because of time, or maybe because of busyness, so we
were stunned by the logistics business this. Well when the mine began to
fall, it began to decline, we got the trial, our account receivable was
enormous. So finally we go down. Not debt, but accounts receivable. "
3. "... So here it is, there is an expression in English that says "If parents build
their own business, even though until they will die, they will not give the
business to the legacy."
4. "... Yes, it was in the middle of the way, so I felt that there were 2 captain on
one ship, that is, and my men had read about it. Now I am also a Padang
person."
5. "... The "Padang" person, let alone his child, is still small, his son is already
large, and is still a child. Now it's also a lesson for all of us as parents, we
must realize that our age is our children are teenagers, our children are
adults, and our children also have space where they can argue."
6. "... In 2013 my father died. Finally, I must be patient. Well, when we want
to take off, unfortunately external condition is not as good as before.”
7. "... the director that I appointed, I have trusted him very much, and I have
educated him. But at the end, when the company had a problem, it turned
out that in my heart that if I saw him save a wound against me that had
never been delivered, finally what he was going to escort me to change
industry, instead he was the first to leave... Well, we jumped a little, what
was even worse, after three months until four months, I got the news he
joined with my other subordinates to make other similar companies. "
8. “...Finally I switched business by making my assets into a portfolio
investment... portfolio investment does not require a lot of energy. Enough
on a laptop, just one administration person, and 1 supervisor, already. So I
am now only three people. And I say this, my liquid is even better than
when I was active in the real sector.”
- Good legacy is the most
important for successful
succession.
- The owner of the business
decision maker that
facilitates the process of
changing make another
business to achieve success.
- Business failure can be
caused by the owner of a
business family.
- The combination of family
ownership structure and
family ownership dynamics
affects firm growth.
- The effect of the previous
failure on the decision the
owner to embark on
subsequent ventures then
success.
Source: Interview transcript data with resource persons were processed.

Business Failure of Family Business, pp. 66–70
69
Five propositions in this research as follows:
P1: Good legacy is the most important for successful succession. This finding is in line with a research by
Habbershon et al. (2003); Olson et al. (2003).
P2: The owner of the business decision maker that facilitates the process of changing make another business to
achieve success.This is consistent with the findings of Stokes and Blackburn (2002).
P3: Business failure can be caused by the owner of a business family. This is in accordance with Stokes and
Blackburn (2002).
P4: The combination of family ownership structure and family ownership dynamics affects firm growth. This
finding is in line with a research by Calabrò et al. (2017).
P5: The effect of the previous failure on the decision the owner to embark on subsequent ventures then success.
Family business is something unique. Failure in the business family often occurs because the previous generation is
not ready to give a relay to the next generation. The failure of a business is often caused by bad legacy. But the next
generation can make the failure of the business a valuable lesson in the decision to switch business to achieve
success. The most important finding in this study that distinguishes previous research is the effect of the previous
failure on the owner's decision to embark on subsequent ventures and success.
CONCLUSION The most important findings of the research are:
The first Good legacy is the most important for successful succession. The second proposition shows that the owner
of the business decision maker that facilitates the process of changing make another business to achieve success.
The third proposition shows that Business failure can be caused by the owner of a business family. The fourth
proposition shows that the combination of family ownership structure and family ownership dynamics affects firm
growth. The last proposition shows that the effect of the previous failure on the decision the owner to embark on
subsequent ventures then success.
ACKNOWLEDGEMENT
This research was supported by Universitas Ciputra, Indonesia and the Minister of Research and Technology,
Indonesia. The researchers want to thank the Family Business Community of Universitas Ciputra, Indonesia. The
researchers acknowledge responsibility for errors in this paper and may not cause damage to the reputation of the
respected individual.
Funded by:
Directorate of Research and Community Service Directorate General of Strengthening Research and Development
at the Ministry of Research, Technology and Higher Education in accordance with Research Contracts Number:
038 / SP2H / LT / MULTI / L7 / 2019.
REFERENCES
Baldwin, J., Bian, L., Dupuy, R., & Gellatly, G. (2000). Failure rates for new Canadian firms: New perspectives on
entry and exit. Ottawa, Ontario: Tunney's Pasture.
Basly, S. (2007). Conservatism: An explanation of the financial choices of the small and medium family enterprises.
Corporate Ownership and Control, 5(1), 459–469.
Berryman, J. (1983). Small business failure and survey of the literature. International Small Business Journal:
Researching Entrepreneurship, 1(4), 47–59.
Cardozo, R., & Borchert, P. S. (2004). The disappearance of business. Retrieved from:
http://www.babson.edu/entrep/fer/BABSON2003/II/IIP2/Chapter1.h tm.
Calabrò, A., Campopiano, G., & Basco, R. (2017). Principal-principal conflicts and family firm growth: The
moderating role of business family identity. Journal of Family Business Management, 7(3), 291–308.
Dunn, B. (1995). Success themes in Scotish family businesses: Philosophies and practices through the generations.
Family Business Review, 8(1), 17–28.
Dyer, W. G. (1986). Cultural change in family firms: Anticipating and managing business and family transitions.
San Francisco, CA: Jossey-Bass.
Gaskill, L. R., Van Auken, H. E., & Manning, R. A. (1993). A factor analytic study of the perceived causes of small
business failure. Journal of Small Business Management, 31(4), 18–31.

Liliana D., Eko B. S., Kazia L., and I Gusti B. Y. W.
70
Habbershon, T. G., Williams, M., & MacMillan, I. C. (2003). A unified systems perspective of family firm
performance. Journal of Business Venturing, 18(4), 451–465.
Handler, W. C. (1989). Methodological issues and considerations in studying family businesses. Family Business
Review, 2(3), 257–276.
-------- (1994). Succession in family business: A review of the research. Family Business Review, 7(2), 133–157.
Ibrahim, A. B., Soufani, K., & Lam, J. (2001). A study of succession in a family firm. Family Business Review,
14(3), 245–258.
Kuncoro, M. (2010). Metode riset untuk bisnis dan ekonomi: Bagaimana meneliti dan menulis tesis? Edisi 3.
Jakarta: Erlangga.
Le Breton-Miller, I., & Miller, D. (2008). To grow or to harvest? Governance, strategy and performance in family
and lone founder firms. Journal of Strategy and Management, 1(1), 41–56.
Liao, J., Welsch, H., & Moutray, C. (2008). Start-up resources and entrepreneurial discontinuance: The case of
nascent entrepreneurs. Journal of Small Business Strategy, 19(2), 1–16.
Moleong, L. J. (2014). Metodologi penelitian kualitatif. Bandung: Remaja Rosdakarya.
Olson, P. D., Zuiker, V. S., Danes, S. M., Stafford, K., Heck, R. K. Z., & Duncan, K. A. (2003). The impact of the
family and the business on family business sustainability. Journal of Business Venturing, 18(5), 639–666.
Ooghe, H., & De Prijcker, S. (2008). Failure processes and causes of company bankruptcy: A typology.
Management Decision, 46(2), 223–242.
Pretorius, M. (2009). Defining business decline, failure and turnaround: A content analysis. The Southern African
Journal of Entrepreneurship and Small Business Management, 2(1) 1–16.
Sciascia, S., Mazzola, P., & Chirico, F. (2013). Generational involvement in the top management team of family
firms: Exploring nonlinear effects on entrepreneurial orientation. Entrepreneurship Theory and Practice,
37(1), 69–85.
Shleifer, A., & Vishny, R. W. (1997). A survey of corporate governance. The Journal of Finance, 52(2), 737–783.
Stokes, D., & Blackburn, R. (2002). Learning the hard way: The lessons of owner-managers who have closed their
businesses. Journal of Small Business and Enterprise Development, 9(1), 17–27.
Sugiyono. (2014). Metodologi penelitian bisnis. Bandung: AlfaBeta.
Thomsen, S., & Pedersen, T. (2000). Ownership structure and economic performance in the largest European
companies. Strategic Management Journal, 21(6), 689–705.
Titus, S. (2005). Key reasons why small business fail. Commmissioned by IIB-Business Supports Americas.
Accredited Associate of The Institute for Independent Business.
Tushabomwe-Kazooba, C. (2006). Causes of small business failure in Uganda: A case study from Bushenyi and
Mbarara Towns. African Studies Quarterly, 8(4), 27–25.
Yin, R. K. (2017). Case study research and applications: Design and methods. 6th Edition. USA: Sage publications,
Inc.

71
3rd International Conference on Management & Entrepreneurship (3rd i-CoME) ISBN 978-602-5446-15-3
Phuket, 25th – 27th July 2019
A NEW MODEL OF CUSTOMER HELPING BEHAVIOR
Erin McGuinness1, Halimin Herjanto
2, Alexandra Chilicki
3
1,2,3 School of Management, Marist College, USA
Email: [email protected],
ABSTRACT Despite customer helping behavior being understood as an important antecedent of competitive advantage in business, prior studies have not fully addressed this phenomenon. Understanding what factors generate such behavior could help businesses design better marketing strategies and tactics to strengthen their business-customer relationships. This study, therefore aims to fulfill this important gap by proposing a new model of customer helping behavior. Our model proposes that diffusion of responsibility, evaluation apprehension and pluralistic ignorance affect customer intention to help. In addition, we propose that customer intention to help is also responsible for consumer helping behavior. Finally, our model shows that brand loyalty can moderate the relationship between diffusion of responsibility, evaluation apprehension and pluralistic ignorance, and customer helping intention, as well as the association between customer helping intention and customer helping behavior. Keywords: Brand loyalty, helping behavior, responsibility, business strategy.
INTRODUCTION
“Great things in business are never done by one person. They are done by a team of people”
Steve Jobs – Apple CEO
Modern businesses understand that to survive in today’s unforgiving business competitiveness, businesses should constantly maintain, if not improve, their business performance. Extant literature shows that strong business performance not only guarantees businesses sustainability, but more importantly growth and financial stability (Wiklund & Shepherd, 2005). Maintaining business performance is not an easy task, because there are many variables responsible for high businesses performance (Garg, Joubert & Pellissier, 2004). Among these variables, Steven, Dong and Dresner (2012) suggest that customer variable is the key variable affecting high business performance. According to Herjanto and Franklin (in press), customer variable is unique, because every customer is different and therefore, business organizations should adopt different levels of customer service and exercise different strategies to handle customer complaints. The ability to effectively solve customer complaints improves overall customer satisfaction (Davis-Sramek, Droge, Mentzer & Myers, 2009), higher customer commitment (Hocutt, Chakraborty & Mowen, 1997), stronger customer loyalty (Jones & Farquhar, 2007), and more importantly customer faithfulness. Faithful customers not only have a stronger emotional attachment with the business organization, they are also more sensitive and accepting of their preferred businesses (Herjanto, Schller-Sampson & Andreani, 2019). As a result, faithful customers are more helpful and willing to help businesses solve their problems (Hasan, Raheem & Subhani, 2011), which includes providing positive responses to other customer complaints. For example, professional football team quarterback, Colin Kaepernick, is a former San Francisco, California “49ers” team player decided to kneel down during the National Anthem just ahead of a televised football game as a strong protest against police brutality and bias against black crime suspects. The protest generated mixed public outcries and shook his sponsor, NIKE. Many customers expressed their disagreement with Mr. Kaepernick’s action on social media and suggested boycotting NIKE’s products. Following this incident, faithful customers helped NIKE by guarding and confronting negative comments. As a result, NIKE’s stock went up and sales increased by 31% (Meyersohn, 2018). This shows that customer helping behavior plays an important role in saving businesses (Kim & Yi, 2017) and promotes effective functioning of businesses (Groth, 2001). Thus, as stated by Steve Job’s quote above, the success of businesses is dependent on people which include staff and customers. Despite these intensive efforts, extant literature on customer helping behavior focused on determinants of customer helping behavior (Revilla-Camacho, Vega-Vazquez & Cossio-Silva, 2015) and therefore studies on consequences of such behavior is limited. The current study proposes a new model of customer helping behavior in an effort to build upon existing research. LITERATURE REVIEW Customers want and appreciate goods and services produced ethically and responsibly (Caruana, & Chatzidakis, 2014) that support fairness, sustainability, justice, and other social issues (Anderson, 2018). Such products reflect a company’s genuine values and ethical concern (Carrigan & Attala, 2001) for customer welfare (Ferrell, Harrison, Ferrell & Hair, 2018). In response, customers tend to express their positive feelings toward such companies and
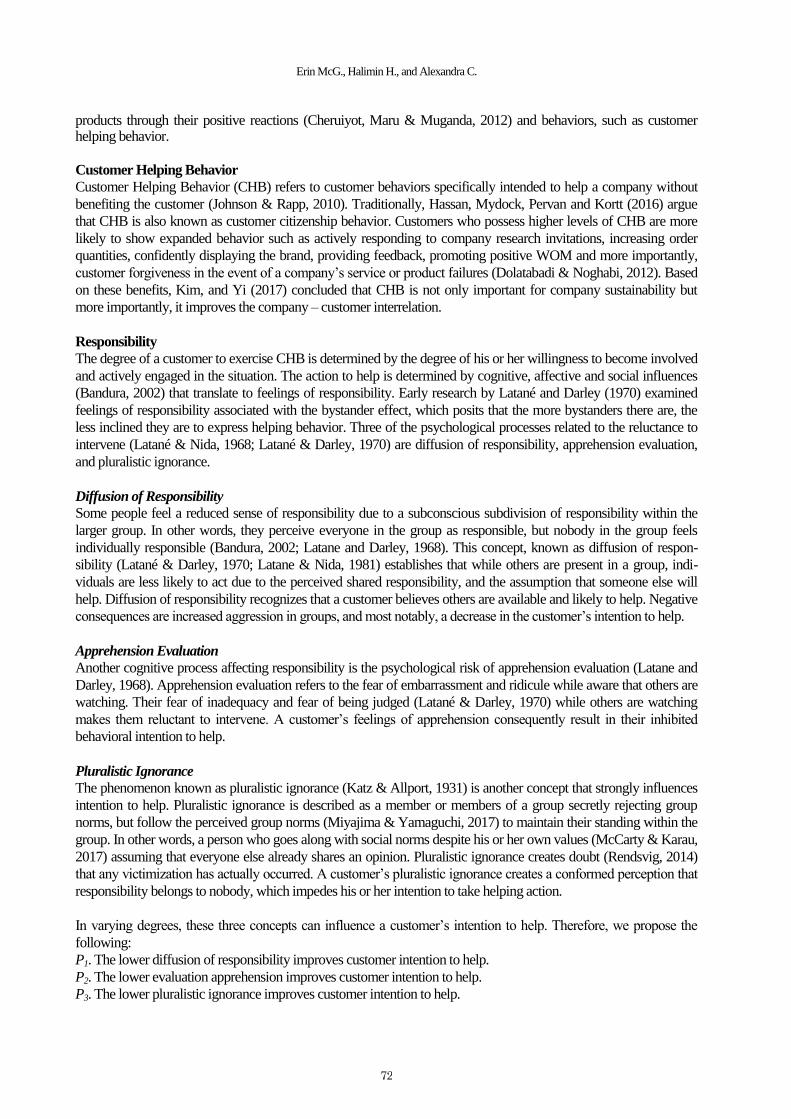
Erin McG., Halimin H., and Alexandra C.
72
products through their positive reactions (Cheruiyot, Maru & Muganda, 2012) and behaviors, such as customer helping behavior.
Customer Helping Behavior
Customer Helping Behavior (CHB) refers to customer behaviors specifically intended to help a company without
benefiting the customer (Johnson & Rapp, 2010). Traditionally, Hassan, Mydock, Pervan and Kortt (2016) argue
that CHB is also known as customer citizenship behavior. Customers who possess higher levels of CHB are more
likely to show expanded behavior such as actively responding to company research invitations, increasing order
quantities, confidently displaying the brand, providing feedback, promoting positive WOM and more importantly,
customer forgiveness in the event of a company’s service or product failures (Dolatabadi & Noghabi, 2012). Based
on these benefits, Kim, and Yi (2017) concluded that CHB is not only important for company sustainability but
more importantly, it improves the company – customer interrelation.
Responsibility
The degree of a customer to exercise CHB is determined by the degree of his or her willingness to become involved
and actively engaged in the situation. The action to help is determined by cognitive, affective and social influences
(Bandura, 2002) that translate to feelings of responsibility. Early research by Latané and Darley (1970) examined
feelings of responsibility associated with the bystander effect, which posits that the more bystanders there are, the
less inclined they are to express helping behavior. Three of the psychological processes related to the reluctance to
intervene (Latané & Nida, 1968; Latané & Darley, 1970) are diffusion of responsibility, apprehension evaluation,
and pluralistic ignorance.
Diffusion of Responsibility
Some people feel a reduced sense of responsibility due to a subconscious subdivision of responsibility within the
larger group. In other words, they perceive everyone in the group as responsible, but nobody in the group feels
individually responsible (Bandura, 2002; Latane and Darley, 1968). This concept, known as diffusion of respon-
sibility (Latané & Darley, 1970; Latane & Nida, 1981) establishes that while others are present in a group, indi-
viduals are less likely to act due to the perceived shared responsibility, and the assumption that someone else will
help. Diffusion of responsibility recognizes that a customer believes others are available and likely to help. Negative
consequences are increased aggression in groups, and most notably, a decrease in the customer’s intention to help.
Apprehension Evaluation
Another cognitive process affecting responsibility is the psychological risk of apprehension evaluation (Latane and
Darley, 1968). Apprehension evaluation refers to the fear of embarrassment and ridicule while aware that others are
watching. Their fear of inadequacy and fear of being judged (Latané & Darley, 1970) while others are watching
makes them reluctant to intervene. A customer’s feelings of apprehension consequently result in their inhibited
behavioral intention to help.
Pluralistic Ignorance
The phenomenon known as pluralistic ignorance (Katz & Allport, 1931) is another concept that strongly influences
intention to help. Pluralistic ignorance is described as a member or members of a group secretly rejecting group
norms, but follow the perceived group norms (Miyajima & Yamaguchi, 2017) to maintain their standing within the
group. In other words, a person who goes along with social norms despite his or her own values (McCarty & Karau,
2017) assuming that everyone else already shares an opinion. Pluralistic ignorance creates doubt (Rendsvig, 2014)
that any victimization has actually occurred. A customer’s pluralistic ignorance creates a conformed perception that
responsibility belongs to nobody, which impedes his or her intention to take helping action.
In varying degrees, these three concepts can influence a customer’s intention to help. Therefore, we propose the
following:
P1. The lower diffusion of responsibility improves customer intention to help.
P2. The lower evaluation apprehension improves customer intention to help.
P3. The lower pluralistic ignorance improves customer intention to help.

A New Model of Customer Helping Behavior, pp. 71–75
73
Intention to Help Intention to help refers to a willingness and desire of customers to involve and engage in support and helping a
company voluntarily (Afsar & Bin Saeed, 2010). According to Organ (1988), the degree of a customer’s intention to
help is determined by a customers’ level of their altruism. Further, Fishbein and Ajzen (2011) assert that a cus-
tomer’s intention to actually perform an act of help is the immediate determinant of such helping behavior. Based on
this consideration, therefore, a customer’s intention to help will strongly and positively affect their actual helping
behavior. Thus, we propose:
P4. The higher the customer intention to help, the stronger the helping behavior.
Brand loyalty A brand loyalty refers to the customer positive attitude toward a brand that reflects to their strong attachment (Liu,
Li, Mizerski & Soh, 2012) and willingness to maintain their relationship with the brand (Fajer & Schouten, 1995).
To Lynch (1995), the degree of brand loyalty is determined by customer positive brand perception which is
generated by enjoyment, fulfilment and positive feelings that customer experience during their interaction with the
brand. As a result, a higher brand loyalty creates feelings such as belongingness, group camaraderie (Hur, Ahn &
Kim, 2011), and commitment which affect the value of ongoing customer relationships, repeat purchasing (Bowen
& McCain, 2015; Jambulingam, Kathuria, & Nevin, 2011), and more importantly reduce the intention to boycott
the products (Petrof, 1963). In his study, Petrof (1963) noted that brand loyalty reduces consumer disappointment
and allows customers to solve their problems with the brand positively. In other words, Punniyamoorthy and Raj
(2017) suggest that brand loyalty allows customers to involve actively in their decision making to solve their
problem with the problem. Hence, brand loyalty reduces customers’ uncertainty in dealing with any brand problem
situations and consequently, it will affect the association of three component of responsibilities on intention to help.
This argument suggests that brand loyalty moderates the association between intention to help and helping behavior.
Based on these arguments, it is safe to propose the following:
P5. The degree of brand loyalty moderates the relationship between (a) diffusion responsibility, (b) apprehension
evaluation, (c) pluralistic ignorance and customer intention to help
P6. The degree of brand loyalty moderates the link between customer intention to help and the helping behavior.
CONCLUSION
As a business strategy, establishing and maintaining a good rapport with customers is essential. Our study proposes
the basis for a new marketing strategy that leverages the strength of that bond. Encouraging customer helping
behavior with the underpinnings of shared moral, ethical, and social beliefs translates to the mutual benefits of long-
term customer commitment. This study suggests that forces behind customer helping behavior are important ele-
ments of the customer-business relationship. As a conceptual study, we have introduced several propositions for
empirical research in this important area. With a desire to build upon research, we are interested in understanding
how customer responsibility to protect a brand (Williams & Steffel, 2015) reinforces the customer-business rela-
tionship. Moreover, we are interested in studying the potential effects of giving faithful customers a voice to
mobilize the power of responsibility and brand loyalty.
REFERENCES Afsar, B., & Bin Saeed, B. (2010). Subordinate’s trust in the supervisor and its impact on organizational
effectiveness. The Romanian Economic Journal, 13(38), 3–25.
Anderson, M. (2018). Fair trade and consumer social responsibility: Exploring consumer citizenship as a driver of
social and environmental change. Management Decision, 56(3), 634–651.
Bandura, A. (2002). Selective moral disengagement in the exercise of moral agency. Journal of Moral Education,
31(2), 101–119.
Bowen, J. T., & McCain, S. L. C. (2015). Transitioning loyalty programs: A commentary on “the relationship
between customer loyalty and customer satisfaction”. International Journal of Contemporary Hospitality
Management, 27(3), 415–430.
Carrigan, M., & Attalla, A. (2001). The myth of the ethical consumer – Do ethics matter in purchase behavior?
Journal of Consumer Marketing, 18(7), 560–577. Caruana, R., & Chatzidakis, A. (2014). Consumer social responsibility (CnSR): Toward a multi-level, multi-agent
conceptualization of the "other CSR". Journal of Business Ethics, 121(4), 577–592.

Erin McG., Halimin H., and Alexandra C.
74
Cheruiyot, T. K., Maru, L. C., & Muganda, C. M. (2012). Reconstructing dimensionality of customer corporate
social responsibility and customer response outcomes by hotels in Kenya. Journal of Business, Economics &
Finance, 1(3), 5–21.
Davis-Sramek, B., Droge, C., Mentzer, J. T., & Myers, M. B. (2009). Creating commitment and loyalty behavior
among retailers: What are the roles of service quality and satisfaction? Journal of the Academy of Marketing
Science, 37(4), 440–454.
Dolatabadi, H. R., & Noghabi, E. S. M. (2012). Prioritization of customer helping behavior in improvement the
performance of Business Company in Iran with using AHP – analytic. International Journal of Academic
Research in Business and Social Science, 2(7), 333–347.
Fajer, M. T., & Schouten, J. W. (1995). Breakdown and dissolution of person-brand relationships. In F. R. Kardes,
& M. Sujan (Eds.), Advances in Consumer Research, 22, 663–667.
Ferrell, O. C., Harrison, D. E., Ferrell, L., & Hair, J. F. (2018), Business ethics, corporate social responsibility, and
brand attitudes: An exploration study. Journal of Business Research, 95, 491–501.
Fishbein, M., & Ajzen, I. (2011). Predicting and changing behavior: The reasoned action approach. New York,
NY: Taylor & Francis.
Garg, A. K., Joubert, R. J. O., & Pellisier, R. (2004). Measuring business performance: A case study. Southern
African Business Review, 8(1), 7–21.
Groth, M. (2001). Managing service delivery on the internet: Facilitating customers’ coproduction and citizenship
behavior in service organizations. Doctoral dissertation. University of Arizona.
Hassan, M., Mydock III, S., Pervan, S. J., & Kortt, M. (2016). Facebook, self-disclosure and brand mediated
intimacy: Identifying value creating behaviors. Journal of Consumer Behavior, 15(6), 493–502.
Hasan, S. A., Raheem, S., & Subhani, M. I. (2011). Measuring customer delight: A model for banking industry.
European Journal of Social Sciences, 22(4), 510–518.
Herjanto, H., & Franklin, D. (2019). Investigating salesperson performance factors: A systematic review of the
literature on the characteristics of effective salesperson. Australasian Marketing Journal, (in press).
Herjanto, H., Scheller-Sampson, J., & Andreani, F. (2019). Customer faithfulness: The moderating role of the
relational benefits trilogy. Presented at Marketing Management Association Conference, Chicago, IL, March
27–29.
Hocutt, M. A., Chakraborty, G., & Mowen, J. C. (1997). The impact of perceived justice on customer satisfaction
and intention to complain in a service recovery. In M. Brucks, & D. J. MacInnis (Eds.), Advances in Consumer
Research, 24, 457–463.
Hur, W. M., Ahn, K. H., & Kim, M. (2011). Building brand loyalty through managing brand community
commitment. Management Decision, 49(7), 1194–1213.
Jambulingam, T., Kathuria, R., & Nevin, J. R. (2011). Fairness-trust-loyalty relationship under varying conditions of
supplier-buyer interdependence. Journal of Marketing Theory and Practice, 19(1), 39–56.
Johnson, J. W., & Rapp, A. (2010). A more comprehensive understanding and measure of customer helping
behavior. Journal of Business Research, 63(8), 787–792.
Jones, H., & Farquhar, J. D. (2007). Putting it right: Service failure and customer loyalty in UK banks. International
Journal of Bank Marketing, 25(3), 161–172.
Katz, D., & Allport, F. H. (1931). Student attitudes: A report of the Syracuse University research study. Syracuse,
NY: Craftsman Press.
Kim, S. Y., & Yi, Y. (2017). Embarrassed customers: The dark side of receiving help from others. Journal of
Service Management, 28(4), 788–806.
Latané, B., & Darley, J. M. (1968). Group inhibition of bystander intervention in emergencies. Journal of
Personality and Social Psychology, 10(3), 215–221.
--------- (1970). The unresponsive bystander: Why doesn't he help? New York, NY: Appleton-Century-Croft.
Latané, B., & Nida, S. (1981). Ten years of research on group size and helping. Psychological Bulletin, 89(2), 308–
324.
Liu, F., Li, J., Mizerski, D., & Soh, H. (2012). Self-congruity, brand attitude, and brand loyalty: A study on luxury
brands. European Journal of Marketing, 46(7/8), 922–937.
Lynch, J. J. (1995). Customer loyalty and success. UK: Palgrave Macmillan.
McCarty, M. K., & Karau, S. J. (2017). Social inhibition. In S. G. Harkins, K. D. Williams, & J. M. Burger (Eds.),
Oxford library of psychology. The Oxford handbook of social influence (pp. 165–181). New York, NY:
Oxford University Press.
A New Model of Customer Helping Behavior, pp. 71–75
75
Meyersohn, N. (2018). Young people support Nike’s bet on Kaepernick, poll shows. CNN Wire Service. Retrieved
December 18, 2018, from https://money.cnn.com/2018/09/13/news/companies/nike-colin-kaepernick-just-do-
it-national-anthem-nfl-football/index.html.
Miyajima, T., & Yamaguchi, H. (2017). I want to but I won't: Pluralistic ignorance inhibits intentions to take
paternity leave in japan. Frontiers in Psychology, 8(1508), 1–12.
Organ, D. W. (1988). Organizational citizenship behavior: The good soldier syndrome. Lexington, MA: Lexington
Books.
Petrof, J. (1963). The effect of the student boycott upon the purchasing habits of Negro families in Atlanta, Georgia.
Phylon, 24(3), 266–270.
Punniyamoorthy, M., & Raj, M. P. M, (2017). An empirical model for brand loyalty measurement. Journal of
Targeting, Measurement and Analyzing for Marketing, 15(4), 222–233.
Rendsvig, R. K. (2014). Pluralistic ignorance in the bystander effect: Informational dynamics of unresponsive
witnesses in situations calling for intervention. Synthese, 191(11), 2471–2498.
Revilla-Camacho, M. A., Vega-Vazquez, M., & Cossio-Silva, F. J. (2015). Customer participation and citizenship
behavior effects on turnover intention. Journal of Business Research, 68(7), 1607–1611.
Steven, A. B., Dong, Y., & Dresner, M. (2012). Linkages between customer service, customer satisfaction and
performance in the airline industry. Investigation of non-linearities and moderating effects. Transportation
Research Part E, 48, 743–754.
Wiklund, J., & Shepherd, D. (2005). Entrepreneurial orientation and small business performance: A configuration
approach. Journal of Business Venturing 20, 71–91.
Williams, E. F., & Steffel, M. (2015). Does sharing signal caring? Asymmetric interpretations of the
informativeness of own and others' social media communications. In K. Diehl, & C. Yoon (Eds.), Advances in
Consumer Research, 43, 197–202.
76
3rd International Conference on Management & Entrepreneurship (3rd i-CoME) ISBN 978-602-5446-15-3
Phuket, 25th – 27th July 2019
THE INFLUENCE OF KNOWLEDGE, ATTITUDE AND FINANCIAL
BEHAVIOR ON PERSONAL FINANCIAL MANAGEMENT AMONG THE
GOVERNMENT EMPLOYEES AT TWO HEALTH CENTERS
Caecilia Wahyu Estining Rahayu
1, Christina Heti Tri Rahmawati
2
1,2 Management Department, Faculty of Economics, Sanata Dharma University, Yogyakarta, Indonesia
Email: [email protected];
ABSTRACT This study aims to examine (1) the influence of financial knowledge, financial attitude, and financial behavior partially to
personal financial management among the government employees at Kalibawang and Sentolo 2 Health Centers, Kulon Progo;
(2) the differences in personal financial management between female and male government employees at Kalibawang and
Sentolo 2 Health Centers. The population used in this research was all active State Civil Apparatus in Kalibawang and Sentolo 2
Health Centers with the sample of 90 people. The data analysis techniques used were Multiple Linear Regression Analysis and
independent sample t-test. The study found that: (1) financial attitude and financial behavior had a positive and significant effect
partially on personal financial management of government employees at Kalibawang and Sentolo 2 Health Centers; (2) there is
no difference in personal financial management between female and male government employees at Kalibawang and Sentolo 2
Health Centers.
Keywords: Financial knowledge, financial attitude, financial behavior, personal financial management.
INTRODUCTION
Everyone certainly wants to have a prosperous life. One of the indicators of a prosperous person is not experiencing
financial difficulties because the person is assumed to have the skills to deal with his or her financial problems or is
able to manage his or her personal finance well (Margaretha and Sari, 2015). Therefore, if someone has a good
personal financial management, the welfare of the person is expected to increase. This is in accordance with the
opinion stated by Kapoor, Dlabay, and Hughes (2012) that personal financial management is a process of managing
money to achieve personal welfare
According to Atkinson and Messy (2012) from OECD (Organization for Economic Cooperation and Develop-
ment), financial literacy is a combination of financial knowledge, financial attitudes, and financial behavior. The
existence of financial literacy can help someone to improve one's knowledge in dealing with financial problems, so
it is expected that if someone makes the right planning in financial management, then the welfare of that person can
increase. In other words, if a person has a good financial literacy (a combination of financial knowledge, financial
attitudes and financial behavior), the welfare of that person can increase.
Financial knowledge includes understanding the basic concepts of finance covering the calculation of simple interest
rates, compound interest, inflation effect, opportunity cost, time value of money, liquidity of an asset and many
more (Wagland & Taylor, 2009 in Yushita, 2017). Financial knowledge and skills in managing personal finance are
very needed in everyday life, so that someone will not make any mistakes in financial management, and help in
arranging personal financial plans, so that the time value of money can be maximized and profits can be increased
which ultimately will be able to improve his or her living standards (Yushita, 2017).
Financial attitude is the application of financial principles to create and maintain values through making decisions
and managing resources as best as possible. According to Ariani (2015), in making financial decisions, a person can
be influenced by rational attitudes (a person's thinking attitude which is based on a sense that can be proven by
existing data and facts) and irrational attitudes (a person's thinking attitude that is not based on a sense). A person
who has a good financial attitude will be wise in managing his or her personal finances, so that they have a financial
surplus for future savings and can improve their welfare (Hilgert, 2003 in Ariani, 2015)
Financial behavior is the human behavior in relation to money management (Xiao, 2009; Nofsinger, in Manurung,
2012). According to Ricciard and Simon (2000) (in Siahaan, 2013), financial behavior is the involvement of existing
behavior in a person which includes emotions, traits, preferences, and various kinds of things that are attached in a
person as an intellectual and a social being that interact and underlie the emergence of decisions to take an action.
Financial behavior is related to one's financial responsibility in relation to the ways of managing the finance (Ida and

The Influence of Knowledge, Attitude and Financial Behavior on Personal Financial Management, pp. 76–84
77
Dwinta, in Andrew and Linawati, 2014). Someone who has good financial behavior will consider the risks and
profits encountered in managing their personal finances so that they can improve their standard of living. The results of the research generally show that there is still a low level of financial literacy in developed countries and more so in developing countries including Indonesia (Aziza, 2017). The Financial Services Authority (OJK) noted that in 2016, the Indonesian financial literacy index was still low, in which the public financial inclusion index was just around 67.8% and around 29.7% for the financial literacy (OJK, 2013; Yudistira, 2017). The survey results show that the Indonesian people still have low financial literacy, indicating that their financial knowledge, financial attitudes and financial behavior were still not good. The problems that arise due to the low financial literacy of the Indonesian people are the emergence of various problems regarding personal financial management, such as having no willingness to save money, having lots of debt, tendency not to pay the bills on time, high frequency of shopping for unnecessary items, and being easily deceived by bids cheap and easy fraudulent or credit investment. Therefore, OJK's efforts to provide education about financial literacy, which includes financial knowledge, financial attitudes, and financial behavior are very much needed, on various occasions by collaborating with various parties in order to improve the financial literacy of the Indonesian people. Increased financial knowledge can help someone to use money with a more appropriate and wiser attitude, so that it can provide economic benefits and can behave well by carrying out an analysis of risks and profits that ultimately improve their welfare. Based on the description of the level of financial literacy, which is a representation of a combination of financial knowledge, financial attitudes and low financial behavior and the relationship between the three with personal financial management, researchers are motivated to carry out an in-depth testing of the influence of the three on personal financial management of the employees of State Civil Apparatus (ASN) at Kalibawang and Sentolo 2 Kulonprogo Health Centers. The problems in this study are: 1. Do financial knowledge, attitudes, and behaviors partially affect the personal financial management of the
employees of the State Civil Apparatus at Kalibawang and Sentolo 2 Kulonprogo Health Centers? 2. Are there differences in personal financial management between female State Civil Apparatus employees and
the male State Civil Apparatus employees at Kalibawang and Sentolo 2 Kulonprogo Health Center?
LITERATURE REVIEW AND HYPOTHESIS
Financial Literacy Financial literacy is the financial knowledge and the ability to apply it (Lusardi and Mitchell, 2010 in Silvy, and Yulianti, (2013). According to Vit et al. (2000) (in Wiharno, 2015) financial literacy includes the ability to dis-tinguish financing options, discuss financial issues without any worry, plan for the future and respond competently to life events that affect daily financial decisions covering events in the economy in general. Financial literacy will influence how people save, borrow, invest, and manage finances (Hailwood, 2007 in Siahaan, 2013). Financial literacy is a basic need that has to be owned by someone to avoid financial difficulties, so that they get the welfare of their lives (Silvy and Yulianti, 2013). With appropriate personal financial management that is supported by good financial literacy, it is expected that one's welfare will be improved. This is because no matter how big a person's income is, if it is not supported by good personal financial management, then the person will experience financial problems.
Financial Knowledge
Knowledge refers to what individuals know about personal financial problems that are measured by their level of
knowledge about various concepts of personal finance (Marsh, 2006 in Herdjiono and Damanik, 2016). Whereas
Bowen (2003) (in Wiharno, 2015) defines financial knowledge as an understanding of financial terms and concepts
that are needed to be used everyday in social life. Someone who has good financial knowledge will have good
financial behavior as well, for example paying all bills on time and having an emergency fund that can be used at
any time.
Financial knowledge is closely related with financial literacy (Herdjiono and Damanik, 2016). Chen and Volpe
(1998) (in Herdjiono and Damanik, 2016), define financial literacy as knowledge to manage finances in financial
decision making. The financial knowledge includes (Chen and Volpe, 1998 in Yushita, 2017): (1) General know-
ledge of personal finance; (2) Savings and loans; (3) Insurance; (4) Investment.
Caecilia W. E. R. and Christina H. T. R.
78
Financial Attitude
Financial attitude is a state of mind, opinion and judgment on finance (Pankow, 2003 in Herdjiono and Damanik,
2016). Whereas Anthony (2011) defines financial attitudes as the application of financial principles to create and
maintain values through making decisions and managing resources as best as possible. Attitude is a personality
image of a person that is born through physical movements and mind responses towards a situation or object (Emil,
1996 in Silvy and Yulianti, 2013). A good financial management attitude starts with conducting financial planning
(short-term and long-term goals), so that they will not be trapped in unlimited financial behavior and ultimately can
improve their lives’ welfare. Financial attitudes can be reflected in the following six concepts, namely (Furnham,
1994 in Herdjiono and Damanik, 2016): (1) Obsession, which refers to a person's mindset about money and their
perception of the future to manage money well; (2) Power, which refers to someone who uses debt as a tool to
control other people and according to them, money can solve problems; (3) Effort, which refers to someone who
feels worthy of having money from what he or she has done; (4) Inadequacy, which refers to someone who always
feels that he or she does not have enough money; (5) Retention, which refers to someone who has a tendency not to
spend money; (6) Security, which refers to someone's view of money such as the assumption that money is better to
only be saved by themselves without saving it in a bank or for investment.
Financial Behavior
Financial behavior is a person's ability to regulate which includes planning, budgeting, checking, managing, con-
trolling, searching and storing daily financial funds (Kholilah and Iramani, 2013 in Herdjiono and Damanik, 2016).
The emergence of financial behavior is the impact of the magnitude of one's desire to fulfil their lives needs in
accordance with the level of income that they earn (Kholilah and Iramani, 2013 in Herdjiono and Damanik, 2016).
Furthermore, financial behavior according to Xiao (2009) (in Wiharno, 2015) is defined as human behavior in rela-
tion to money management. One's financial behavior can be seen from four things, namely (Dew and Xiao, 2011 in
Herdjiono and Damanik, 2016): (1) Consumption, namely the households expenditure on various goods and
services, which can be seen from what someone buys and the reason of buying; (2) Cash flow management, which
is an indicator of a person's ability such as paying the bills on time, paying attention to notes or proof of payment and
making financial budgets and future planning; (3) Savings and investments are made to anticipate future events and
obtain future benefits; (4) Debt management, namely the ability of a person to take advantage of debt so that it does
not make someone experiences bankruptcy, but increases his welfare instead.
Personal Financial Management
Personal financial management (MKP) is the art and science of managing financial resources from individual units
(Giltman, 2002 in Yushita, 2017). Kapoor et al. (2012) (in Wiharno, 2015) defines personal financial management
as a process of managing money to achieve economic satisfaction or personal welfare. Knowing the right personal
financial management is the first step to manage the personal money. According to Warsono (2010) (in Yushita,
2017), managing personal finance can be seen from four domains, namely: (1) Use of funds, related to how to
allocate these funds to meet their needs appropriately, and must be based on priorities; (2) Deciding the funds
sources, regarding the ability to know and find alternative sources of funds as sources of financial income to be
managed, in addition to funding sources from; (3) Risk management, in relation to having good protection to anti-
cipate unexpected events, such as illness, urgent needs, etc.; (4) Future planning which is important to do so that
someone can analyze the future needs so that they can prepare investments from now on.
Development of Hypothesis
Financial Knowledge with Personal Financial Management
Financial knowledge is not only important for individual interests and is not only about the ability to use money
wisely, but it can also provide economic benefits (Siahaan, 2013). Financial knowledge and skills in managing per-
sonal finance are very much needed in daily life, so that people will be prevented from experiencing financial
difficulties. The existence of good financial knowledge will help a person in managing personal financial planning,
so that person can maximize the time value of money and the benefits earned will be bigger and will improve their
standard of living (Yushita, 2017; Wiharno, 2018). Based on the description above, the first hypothesis can be for-
mulated, namely:
Hypothesis 1: Financial knowledge has a positive effect on personal financial management

The Influence of Knowledge, Attitude and Financial Behavior on Personal Financial Management, pp. 76–84
79
Financial attitude with Personal Financial Management
Financial attitude is a state of mind, opinion and judgment about finance (Pankow, 2003 in Herdjiono and Damanik,
2016). The attitude of good financial management starts by applying good financial attitudes as well, so that it will
have a financial surplus for future savings (Silvy and Yulianti, 2013). In conducting the personal financial manage-
ment, there has to be a financial planning, both short and long term planning. Therefore, having wise attitudes means
having the ability to manage personal finances well too, and can improve the welfare of their lives (Wiharno, 2018).
Based on the description above, the second hypothesis can be formulated, namely:
Hypothesis 2: Financial attitudes has a positive effect on personal financial management
Financial Behavior with Personal Financial Management
Financial behavior according to Xiao (2009) (in Wiharno, 2015) is human behavior in relation to money manage-
ment. Financial knowledge has a good influence on everyday decision making regarding finance. Increased finan-
cial knowledge can help someone to use money with a more appropriate and wiser attitude, so that it can provide
economic benefits and be able to behave well by conducting an analysis of risks and benefits which can ultimately
improve their welfare (Silvy and Yulianti, 2013; Wiharno, 2018) . Based on the description above, the third hypo-
thesis can be formulated, namely:
Hypothesis 3: Financial behavior has a positive effect on personal financial management
Gender Factors with Personal Financial Management
Research conducted by Mandell (2008), Cole et al. (2008), Worthington (2004), Chen and Vope (1998), Lusardi
and Mitchell (2006, 2008) (in Wiharno, 2015) show that the male has higher financial literacy rates than women.
According to Atkinson and Messy (2012) of the OECD (in Wiharno, 2015), women had lower levels of finansial
knowledge, financial behavior and personal financial management compared to men. Nevertheless, women had
higher financial attitudes than men. This is also found in the research conducted by Bank Indonesia and the
Demographic Institute of the University of Indonesia which shows that women have a higher level of financial
literacy and personal financial management than men. Based on the description above, the following hypothesis can
be formulated:
Hypothesis 4: There are differences in personal financial management between male and female State Civil
Apparatus employees at Kalibawang and Sentolo 2 Kulonprogo Health Centers
The theoretical framework in this study can be described on Figure 1.
Figure 1. Theoretical framework

Caecilia W. E. R. and Christina H. T. R.
80
RESEARCH METHOD
The population in this study were all ASN employees at the Kalibawang and Sentolo 2 Kulonprogo Health Centers
who were still actively working. The study sample was 90 respondents who were the same as the total population.
The sampling method is a saturated sampling method. The data in this study were collected by distributing question-
naires. The data of this study were quantitative data which were measured on a Likert scale. The data used are
primary data, namely data sourced from respondents which were obtained directly by using the questionnaire
method. According to Jogiyanto (2015), questionnaire is a communication instrument in the form of questions or
statements to obtain answers from the respondents.
In order to obtain good research results, it was very important to test the research instruments used because research
instruments must be able to measure accurately. Tests are conducted using validity and reliability tests (Jogiyanto,
2015). Furthermore, the classic assumption test was performed on the existing data, including: normality test, multi-
collinearity test, and heteroscedasticity test (Santoso, 2015). After the classic assumption test was declared to fulfill
the requirements, the next step was to carry out the Multiple Linear Regression Analysis which was intended to test
the effect of independent variables (financial knowledge, financial attitudes, and financial behavior) on the depen-
dent variable (personal financial management). The next test was to use the independent sample t-test, which was
intended to test whether there are differences in personal financial management between male and female State Civil
Apparatus employees at Kalibawang and Sentolo 2 Kulonprogo Health Centers.
FINDINGS
Respondents’ Characteristics
The respondents who participated in this study were those who were active as ASN employees in both Kalibawang
(KB) and Sentolo 2 (S2) Kulon Progo Health Centers. The following Table 1 shows the profile of all respondents
who participated in this study.
Table 1
Respondents’ Profile
Based on Categories Total Percentage
Gender Female 62 69%
Male 28 31%
Age 20 to less than 30 17 19%
30 to less than 40 19 21%
40 to less than 50 29 32%
50 or more 25 28%
Education High School 33 37%
level Diploma/ D3 39 43%
Bachelor 16 18%
Master 1 1%
Others 1 1%
Income < Rp 1,000,000.00 11 12%
monthly Rp 1,000,000.00 – Rp 2,999,999.00 34 38%
Rp 3,000,000.00 – Rp 4,999,999.00 39 43%
> Rp 5,000,000.00 6 7%
Table 1 shows that based on gender, the characteristics of ASN employees at Kalibawang and Sentolo 2 Health
Centers who were the respondents in this study were mostly female as many as 62 people (69%), the highest age
group of respondents is around 40 – <50 years old, which is amounted to 29 people (32%), the highest level of
education of most respondents was Diploma / D3 which was chosen by 39 people (43%), and there was one group
which amounted to 39 people (43%) had the highest monthly income in the range of Rp. 3,000,000.00 – Rp.
4,999,999.00.
Multiple Linear Regression Analysis
Table 2 shows the test results by using the Multiple Linear Regression analysis. The t-test results in Table 2 shows
that the probability value (sig) of the financial knowledge (FK) variable > α (0.962 > 0.05), it can be concluded that
H0 is accepted and HA is rejected. Thus, hypothesis 1 is not supported. This can be interpreted that the financial

The Influence of Knowledge, Attitude and Financial Behavior on Personal Financial Management, pp. 76–84
81
knowledge variable does not have a significant positive effect on personal financial management (PFM), that is, if
financial knowledge is continuously improved, then the personal financial management will not necessarily be
better, the possibility can be worse or does not change (fixed).
The test results for financial attitude (FA) variables show that the probability value (sig) of financial knowledge
variable < α (0.005 < 0.05), so it can be concluded that H0 is rejected and HA is accepted. Thus, hypothesis 2 is
proven to be true. It can be interpreted that the financial attitude variable has a significant positive effect on personal
financial management, namely if the financial attitude is getting better then the personal financial management will
be better as well.
Table 2.
Multiple Linear Regression Analysis Results
Model
Unstandardized Coefficients Standardized Coefficients t Sig.
B Std. Error Beta
1
(Constant) 7.225 4.122 1.753 .083
Total FK -.013 .277 -.004 -.048 .962
Total FA .349 120 .264 2.911 .005
Total FB .514 .095 .482 5.414 .000
a. Dependent Variable: Total PFM
The next test results, which is the financial behavior variables have a probability value (sig) < α (0.000 < 0.05) so it
can be concluded that H0 is rejected and HA is accepted. Thus, hypothesis 3 is supported. This indicates that financial
behavior (FB) has a significant positive effect on personal financial management, meaning that if financial behavior
is getting better, then the personal financial management will be better as well.
The following Table 3 and Table 4 show the independent sample t-test results.
Table 3
Independent Sample T-test Results
PFM_Gender_Combination
Equal variances
assumed
Equal variances
not assumed
Levene’s Test for Equality of
Variances
F .000
Sig. .997
t-test for Equality of Means
t -.390 -.394
df 88 53.508
Sig. (2-tailed) .698 .695
Mean Difference -.356 -.356
Std. Error Difference .913 .904
95% Confidence Interval of the
Difference
Lower -2.171 -2.168
Upper 1.459 1.456
Table 4
Statistical Description of the Male and Female PFM Variable Scores
Group_KB & S2_Gender N Mean Std. Deviation Std. Error Mean
PFM_KB & Sentolo 2 Female 62 38.32 4.044 .514
Male 28 38.68 3.935 .744
Based on Table 3, it is shown that in Levene’s test there is a p-value (0.997) > α (0.05) so that it can be interpreted
that the two variants are the same. Thus, the next stage is to do a different test (sig 2-tailed) by using the equal
variances assumed assumption. The stage of conducting this different test is done to prove whether the 4th
hypothesis is supported or not. Based on the results in Table 3, it is known that p-value (0.698) > α (0.05), it can be
concluded that H0 is accepted and HA is rejected. Thus, hypothesis 4 is not supported. This means that there is no
significant difference in personal financial management between male and female ASN employees in the two health

Caecilia W. E. R. and Christina H. T. R.
82
centers. This can also be seen in Table 4 which shows the PFM mean of female employee at 38.32 and the PFM
mean of 38.68 for the male employees, which means the mean of the two groups of employees is not significantly
different.
DISCUSSION
The first finding in this study was that financial knowledge (FK) had a negative but not significant effect on the
personal financial management (PFM). This can be interpreted that the higher one's financial knowledge is, the
worse the personal financial management of the person, but the effect is not significant. The findings of this study
are not in accordance with the research results by Yushita (2017) and Wiharno (2018) stating that financial know-
ledge has a positive and significant effect on personal financial management. This finding shows that the average
score of financial knowledge of most respondents (57%) ranged from 37.5%–68.8% (including the low category)
while the average score of respondents' perceptions of their personal financial management was high (3.8). This
indicates that respondents have a low understanding of financial knowledge that includes general financial know-
ledge, banking products, insurance and investment but that does not necessarily mean that their personal financial
management is bad. In fact, their financial management is classified as good. This is indicated by the majority of
respondents agreeing on a number of statements in the questionnaires on the personal financial management such as
making financial decisions by thinking first, they state that they buy something because they need to, and not to
impress others, and they believe that thinking about the expected future financial conditions in five or 10 more years
is an important thing in achieving financial goals.
The second finding in this study is that financial attitudes (FA) have a positive and significant effect on personal
financial management (PFM), which means that the better the financial attitude a person has, the better the person
will be in managing his or her personal finances. This is in line with the research results by Yushita (2017) and
Wiharno (2018) that financial attitudes have a positive and significant effect on personal financial management. The
findings of this research are supported by the obtained average score of respondents 'perceptions towards financial
attitudes which is included as the high category (3.4) and the average score of the respondents' perceptions towards
the personal finansial management is also included to a high category (3.8). This indicates that if the respondents’
financial attitudes are good, then the respondents’ personal financial management is also good. This is indicated by
the majority of respondents agreeing on some items in the questionnaire statements regarding financial attitudes
such as financial planning is important for future life, getting remuneration is a right that is deserved after work, and
buying goods only as needed.
The third finding in this study is that financial behavior (FB) has a positive and significant effect on personal
financial management (PFM), which means that the better financial behavior a person has, the better that person is
in managing his personal finances. This result is in line with the research results by Yushita (2017) and Wiharno
(2018) that financial behavior has a positive and significant effect on personal financial management. The findings
show that the average score of respondents 'perceptions of financial behavior (3.75) and the average score of
respondents' perceptions of personal financial management (3.8) are equally high. This indicates that respondents
have good financial behavior, so the personal financial management of the respondents is also good. This is proven
by the majority of respondents agreeing on a number of statement in the questionnaires on financial behavior such
as financial records help in managing the money, financial records help in planning needs, I save money for
unexpected needs, I always save a portion of my income that I earn.
The last finding in this study is that there are no differences in personal financial management between male and
female State Civil Service employees in the two Health Centers. This can be interpreted that the male personal
financial management is not better than the female, and conversely the personal financial management of female is
not better than the male. The absence of significant differences in personal financial management is due to the level
of education of most male and female respondents who are relatively not much different, namely high school /
vocational school (37%) and Diploma / D3 (43%) and this relatively similar respondents' education levels are
indicated to be the reason behind the same perception towards the personal financial management, among others,
having the same ability to find solutions before financial problems increase, having a mindset that investment for
future goals is important; having specific plans for achieving financial goals; and saving is done first before buying
or paying other expenses. The results of this study are not in line with the results from Mandell (2008), Cole et al.
(2008), Worthington (2004), Chen and Vope (1998), Lusardi and Mitchell (2006, 2008) (in Wiharno, 2015) which
showed that male financial literacy rates were higher than women.

The Influence of Knowledge, Attitude and Financial Behavior on Personal Financial Management, pp. 76–84
83
CONCLUSION
The conclusion of this study is that financial attitudes and financial behavior partially have a significant effect on
personal financial management. If the financial attitude is getting better, then the personal financial management will
be better too, and if financial behavior is getting better, then the personal financial management will be better as
well. Nevertheless, financial knowledge has no significant effect on personal financial management.
There are some suggestions for the employees of ASN Kalibawang and Sentolo 2 Health Centers. The of analysis
results show that financial attitudes and financial behaviors have a positive and significant effect towards personal
financial management. Therefore, the researchers suggest that the good financial attitudes and financial behaviors of
the employees are maintained or made better so that the personal financial management will still be good or be
better as well. For example, by continuing the habit of making financial records of income and expenses on a regular
basis, trying to buy goods in accordance with needs rather than desires, conducting price surveys before buying
goods that are needed, paying the bills in a timely manner, and still behaving economically in using money. If these
things are conducted as a routine, then financial problems will be resolved properly and wisely so as to create
prosperity in accordance with the expectations.
Future researchers with similar topics are suggested to add other variables besides the variables used in this study,
which are likely to affect personal financial management more accurately. In addition, future researcher should use
intervening variables (mediation variables or moderation variables) to obtain more accurate results, that may provide
appropriate answers to the hypotheses in this study that are not proven, namely financial knowledge does not have a
significant effect on personal financial management .
REFERENCES
Andrew, V., & Linawati, N. (2014). Hubungan faktor demografi dan pengetahuan keuangan dengan perilaku
keuangan karyawan swasta di Surabaya. Finesta, 2 (2), 35–39.
Anthony, R. A/P R. (2011). Knowledge, attitude, practice and satisfaction on personal financial management
among the medical practitioners in the public and private medical services in Malaysia. Thesis. Faculty of
Medicine Universiti Kebangsaan Malaysia Kuala Lumpur.
Ariani, S. (2015). Pengaruh literasi keuangan, locus of control, dan etnis terhadap pengambilan keputusan
investasi. Surabaya: Sekolah Tinggi Ilmu Ekonomi Perbanas.
Atkinson, A., & Messy, F. (2012). Measuring financial literacy: Results of the OECD/International Network on
Financial Education (INFE) pilot study. OECD Working Papers on Finance, Insurance and Private Pensions,
No. 15, OECD Publishing (http://dx.doi.org/10.1787/5k9csfs90fr4-en).
Aziza, K. S. (2017). OJK: Hanya 29,7 persen masyarakat yang paham keuangan. Kompas.com. Retrieved from
http://ekonomi.kompas.com/read/2017/10/04/144105526/ojk-hanya-297-persen masyarakat-yang-paham-
literasi-keuangan.
Bowen, C. F. (2003). Financial knowledge of teens and their parents. Journal of Financial Counseling and
Planning, 13(2), 93–102.
Herdjiono, I., & Damanik, L. A. (2016). Pengaruh financial attitude, financial knowledge, parental income terhadap
financial management behavior. Jurnal Manajemen Teori dan Terapan, 9(3), 226–241.
Jogiyanto, H. (2015). Pedoman survei kuesioner. Yogyakarta: BPFE.
Kapoor, J. R., Dlabay, L. R., & Hughes, R. J. (2012). Personal finance. Tenth Edition. New York: McGraw-Hill.
Manurung, A. H. (2012). Teori investasi: Konsep dan empiris. Jakarta: PT. Adler Manurung Press.
Margaretha, Farah and Sari, Siti May. (2015). Faktor Penentu Tingkat Literasi Keuangan Para Pengguna Kartu
Kredit di Indonesia. Jurnal Akuntansi dan Investasi, 16 (02), 132–144.
Otoritas Jasa Keuangan. (2013). OJK Perkuat Upaya Inklusi dan Perluasan Akses Keuangan Melalui Literasi
Keuangan. (http://keuangan.kontan.co.id/news/ojk-literasi-keuangan-masyarakat-masih-rendah)
Santoso, S. (2015). Menguasai statistik multivariat. Jakarta: PT Elex Media Komputindo.
Siahaan, M. D. R. (2013). Pengaruh literasi keuangan terhadap perilaku pengelolaan keuangan pada mahasiswa
perguruan tinggi di Surabaya. Artikel Ilmiah. Surabaya: Sekolah Tinggi Ilmu Ekonomi Perbanas.
Silvy, M., & Yulianti, N. (2013). Sikap pengelola keuangan dan perilaku perencanaan investasi keluarga di
Surabaya. Journal of Business and Banking, 3(1), 57–68.
Wiharno, H. (2018). Pengaruh Financial Knowledge, Financial Behavior, dan Financial Attitude terhadap Personal
Financial Management (Survei pada aparatur sipil negara daerah di Kabupaten Kuningan). JRKA, 4 (01), 64–
76.

Caecilia W. E. R. and Christina H. T. R.
84
Wiharno, H. (2015). Karakteristik sosial ekonomi yang mempengaruhi literasi keuangan serta dampaknya terhadap
manajemen keuangan personal (Survei pada aparatur sipil negara daerah di Kabupaten Kuningan). JRKA,
1(02), 1–15.
-------- (2018). Pengaruh financial knowledge, financial behavior, dan financial attitude terhadap personal financial
management (Survei pada masyarakat di Kabupaten Kuningan). JRKA, 4(1), 64–76.
Yudistira, G. (2017). OJK: Literasi keuangan masyarakat masih rendah. Kontan.co.id. Retrieved from
http://keuangan.kontan.co.id/news/ojk-literasi-keuangan-masyarakat-masih-rendah.
Yushita, A. N. (2017). Pentingnya literasi keuangan bagi pengelolaan keuangan pribadi. Jurnal Nominal, VI (01).
85
3rd International Conference on Management & Entrepreneurship (3rd i-CoME) ISBN 978-602-5446-15-3
Phuket, 25th – 27th July 2019
THE COCOON AND SHALLOT FOR BEAUTY: INNOVATION OF THAI
WISDOM IN COMMUNITY PRODUCT DEVELOPMENT THE
SUFFICIENCY ECONOMY PHILOSOPHY
Theerakan Pokaew
1, Supatanachai Pokaew
2
1,2 Department of Community Development Faculty of Humanities and Social Sciences, Phuket Rajabhat University
Email2:
ABSTRACT The Development Beauty Set of Thai Wisdom from Cocoon and Shallot. It is research and development. Focus on research.
Experiment to create new inventions with the community. purpose to create an innovation by combining wisdom, develop a
beauty soap from cocoon mixed with shallots under the learning base with Baan Noon Kraseat. Kantharawichai District
Mahasarakham province and the process of technology transfer to the community. The study group consisted of 35 people. It
focuses on the prototype community used tools. It is a participant observation. Structured interview and the workshop to transfer
knowledge. There is a study to create a common soap formula. The research found that the development of soap formula
together with the Baan Noon Kraseat group had three formulas. Formula 1, Cocoon and Shallot soap. Formula 2, Thai dessert
soap and Formula 3, cocoon and Shallot soap for children. The benefits of community innovation will affect the reduction of the
problem of shallot prices and the development is based on the principle of sufficiency. Made to Self before order to sell. Reduce
household income. And increase the revenue to the community. By utilizing local resources for maximum benefit.
Keywords: Innovation, wisdom, product community, cocoon, shallot.
INTRODUCTION
Development of herbal products for beauty from local resources It is a research study under sufficiency economy
philosophy so the community can reduce expenditure. Monetize your household and community as strong can be
grouped into community enterprises. Most of the community migrate have a base of belief. The local wisdom is a
cognitive, inherited since the ancestors. The herb process is therefore not new, but the community has continually
been developed and promoted. The introduction of local herbs that are cheap at all levels can be picked up to add
value, but it is manufactured under the base of sufficiency (Ratanakom, 2011) is manufactured to the rest of its own,
so it can be used by others. Good quality products are environmentally friendly, because Thais often believe that the
products that are processed from the herb are in a form used as a remedy. Food, beverage, cosmetics and household
are more secure than products manufactured by chemical ingredients. This is because the herb is causing toxic or
adverse reactions that are less than the current synthetic chemicals (Karunamaiwong, 2003).
For Thai wisdom, herbal and health of the traditional the living way of Thai people from the past to the present.
There are many different branches, but the popularity and development of the most widely known consumers are
"health and beauty products." The market for health and beauty of the world is growing steadily and from the flow
of health care that spreads to people of all ages. This makes the product of natural products more popular than those
produced by synthetic goods, which is a great opportunity for Thai entrepreneurs to produce the products. Meet the
needs of consumers appropriately (Public Relations Department, 2018.
The cosmetic and cosmetic industry Data Warehouse has predicted the value of the world's natural cosmetic market
in 2017 years to be valued up to 47 million or baht 1,529 million. The average growth rate during the year of 2013-2
017 is 8% Thai beauty business in Thailand, a Thai-Asian Cosmetics Center, Japan and South Korea. Total value
2.1 million baht the domestic market is 60% is 1.2 million and the international market 40% is a value of 9 billion
baht. This is because Thailand has the world's top biological diversity and is the country where one of the world's
largest natural resource bases (Srinakrarintaraviroj University, 2018).
Thai silk extract is one of the most popular products from wisdom, which is known for its present beauty, which is
used as an important raw material in the spa and beauty salon areas. The popularity to the Thai silk powder is used
to remove the skin, as it is a vital part that can be maintained by the skin. Mulberry Department of the Queen Sirikit
was researching the utilization of debris since the year 2005 by bringing the residual chips from the silk to the
weaving. Research to bring out the rest of the silk route to the use (Khaosod, 2016).

Theerakan P. and Supatanachai P.
86
Figure 1. Coocoon name nang noi srisakeat 1
Figure 2. Shallot name bang chang srisakeat
In addition to Srisakeat Province, there are varieties of beauty benefits, and there is also an important raw material
that every household must have. It is a good place to develop a Thai beauty. The Shallot in addition to ancient Thai
people are believed to help relieve the cold for children or the low immune. The firm helps to maintain the skin, but
the problem is not rarely interested in bringing Shallot to develop as a general skin care product, or become
widespread in the community, because it has been understood to have a pungent scent. The researchers invented a
new formula in the smell to reduce the pungent of the Shallot, using Mook and Thai orchids. An interesting research
example, which is used and actually distributed. The researchers have the idea to reveal the Heritage of the Beauty
Set which is another Thai wisdom to the public. After the researchers have made research for integrated
development in conjunction with Many University, the formula, which is a master product in the group. Baan noon
kraseat district Kantarawichai, MahaSarakham Province.
LITERATURE REVIEW The researcher studied about the research and development of herbal soap processing products. The group has a
new shape for the processed herb group.
1. The shape of the design concept is geometry and natural shapes. To attract attention from consumers including
can be used as a deposit in another way and
2. In the form of processed herbal packaging the group has a new format in two forms: single cube and processed
herbal soap set (Ratanakom, 2011).
And there are researchers who have studied about the processing of products from Acanthus leaf for health, beauty
the study indicated that Local wisdom in the use of Acanthus leaf to develop that product Bang Tib community is a
model community in education. Because the community believes that the conventional wisdom of the Acanthus
leaf can be boiled and treated with flares Useful for both eating and bathing the community therefore continue to the
development as a beauty product. Both in the form of soap, shampoo and conditioner (Wankaew, 2016). The
The Cocoon and Shallot for Beauty: Innovation of Thai Wisdom, pp. 85–91
87
community in Thailand has started to focus on research on herbal soap. Because of the miracle study of herbal soap,
it was found that soap is a type of cosmetics used to cleanse the body. Originally used for body cleaning only at
present, the production of soap contains more ingredients, so that the soap has properties that have medicinal
properties the needs of consumers. Such as having beautiful colors to use and fragrant which is different from using
synthetic products that entrepreneurs try to make the product worth using the packaging is beautiful. But hidden
with dangerous chemicals with toxic residues (Tepyaa, 2006).
At present, the use of cocoons containing sericin is a waste material from the production of silk fibers. Because the
cocoon consists of fibroin fibers and sericin glue. Silk glue water be used to produce soap as well Basil has
properties to help firm skin. From the study of properties, it was found that the silk glue helps reduce inflammation.
Antimicrobial and release moisture well It also has special properties to store water well. good storage, affected by
x-rays (UV) helps to inhibit the absorption of radiation that is harmful to the body. According to natural proteins
from silk glue like used as an ingredient in cosmetics (Tanthanee, 2018).
RESEARCH METHOD This research is a mix method:
1. Experimental research
The development of a chemical precursor from chemistry A is acetate substance. The boiled water is extracted
from the cocoon and chemical B. Extracted from the red onion and trial plan There are three plans: To create
new product formal. Cocoon and Shallot Soap Create a new product formula. Thai Dessert Cocoon Soap and
Create a new product Formula cocoon and Shallot liquid soap.
2. Qualitative research
2.1 Population in research: Group of women Education in MahaSarakham. Sample groups Select a specific
number of 35 people divided into three groups: Community leader group six people, group operators 20
persons and group of experts and developing teachers from School outside Education Center five people,
Academics from MahaSarakham University three people, Academic from and MahaSarakham Rajabhat
University, one people total of nine people.
2.2 Collect this research data: Researchers use several ways to capture information to provide comprehensive
and complete information. With a qualitative study method (qualitative Research) by performing data
collection. The study will collect information be classified by the informa tion you want to study and from
related resources. The information collected is the collection of information you need to study and from a
source of related resources. By storing the information from the document (documentary research) and the
field information store (field research), it is a trial to find the right source formula for convey. The tech-
nology to the community then introduced the training kit to the successful completion of the group to the
operators by focusing on participating practices.
2.3 Research tools: Work practice activities, create, develop, and three-phase soap products, to develop the
original formula, in the form of soap, crystal and liquid soap for elderly adults and those with sensitive skin.
Participating observation (participant observation) researchers keep track of the time of a member in the
practice conference group. Observed the solution while practicing After that, there will be more advice after
practicing the problem of suspicious group members to plan to work continuously and to learn with the
qualified team to develop products to solve smell and continuous production quality. And the conclusion of
the experimental results is the new invention, a combination of basic formulations, a mixture of soap,
cocoon and a red onion soap for learning to be the community business.
2.4 Analysis of using explain the results of the experiment for experimental research and descriptive analysis
for qualitative research.
RESEARCH RESULT Research Center for the Herb Learning Centre of non-agriculture women's group baannoonkraseat, Kantharawichai-
District Mahasarakham-province, is a traditional community of Mahasarakham Province. Develop a healthy herbal
product for more than 20 years to be a learning center for people interested in Student. The student came to a long
time until the anniversary celebrated 150 years “TAKASILA NAKRON” Education Center city of Thailand. The
research and development of the community beauty products research. To help Thai farmers to bring local res
ources, create more value by enhancing local wisdom. "The beauty Set of Cocoon and Shallot" is a soap and
Cocoon and Shallot of Thai desserts soap. This research aims to provide a suggested formula to a resource base area
to become a future community business.

Theerakan P. and Supatanachai P.
88
Formula 1 innovation "Cocoon and Shallot soap" Preparation of device
1. Glycerin Grade A 1 kg.
2. Cocoon Nangnoi Sisakeat 0.5 kg.
3. Shallot 0.5 kg.
4. Pandan Leaf 1 handful
5. Sugar 1 Tea Spoon
6. Salt 0.5 teaspoon
7. White Fabric 1 Piece
8. The smell of Thai Fower 0.2 CC.
9. Alcohol 1 bottom
10. 1 Water Sprayer
11. 2 mould
12. 1 Pot of 1
13. 1 Wooden Paddle
14. Ladle 1 an
15. 1 Roll Wrap Film
The production process of red onion soap per 1 kilogram
1. Remove shallot and smoothie Put the tank 1 night in order to make shallot reduce the pungent scent
2. It is a shallot that decreases the scent. Bring a lot of water and waste
3. Take the cocoon Nangnoi Srisakeat to boil the pandan leaves for 30 minutes and then bring it very well with
some white fabrics.
4. Bring the glycerin grade A to a stew with the middle light. Temperature 50-60 degrees Celsius
5. When the glycerin dissolves, fill the boiled substances from the cocoon and shallot 4 tablespoons
6. Add 1 teaspoon of sugar so that the glycerin is clear and solid.
7. Add salt 0.5 spoon to nourish your skin and be a preservative in natural products.
8. The scent of Mook or Orcid 2 CC.
9. Prepare the print by bringing the prepared alcohol into the sterilization before pouring the ingredients cooked
down to
10. Pour the ingredients cooked, then spray the bubbles with alcohol again.
11. Let the mixture harden for about 1 hour
12. Remove the soap from the print and wrap it with the film.
13. To be branded Enter the beautiful packaging box
14. Released for distribution.
Figure 4. Working together with the community

The Cocoon and Shallot for Beauty: Innovation of Thai Wisdom, pp. 85–91
89
By experimenting with the development of beauty products in Formula 1, it has been the remainder of the produc-
tion, which is a waste of the Shallot, giving the research to a new formula in order to use the ingredients in the
production process. There is no rest in the system and bring the rest to the value and add more value. At the time of
trial, consider Mor-kang Thai dessert with a shallot, and when you see a cocoon that has not been boiled. To
commemorate the Foy thong sweets and Pandan leaves, reminiscent of Jelly and Kha nom Zaan Thai Dessert. The
research and the community have agreed to make Formula 2 as Soap Thai dessert as expected. Make the commu-
nity more creative and excited to learn during the trial period. In the near New Year festival, a soap that has been
tried to be made is a gift set for the community.
Figure 5. Thai dessert soap Set
Formula 2 Thai dessert soap set: the equipment and ingredients are prepared just like part 1, but there are more
ingredients to be similar to Thai sweets using creativity. By filling from the shallot and fibers from the cocoon,
including the cleansing of Thai natural herbs such as:
1. Mor Kang Soap. Cooking rice Soup The curry will have a shallot fragrance to boil the glycerin, bringing it to
the second layer of aromatic soap in Formula 1 in front of
2. Kha Nom Saan Soap. The remaining Pandan leaves are boiled to the 1st floor, and the coconut milk blends
with glycerin to the second floor with a wisdom that is believed to help nourish the skin moist.
3. Foy Thong Soap. The community has tried the silk line to remove the residual glycerin from the production.
This small line is believed to be a very beautiful face and body scrub.
4. Kha Noon Soap The community has brought the remaining cocoon to the rolling and the glycerin of the
residual. The pot has a beautiful golden jackfruit too distribute the seeds and five Baht, remove the body scrub.
This product in the market has been a great interest from teenagers for all four Thai desserts Master, this is just a
preliminary recipe from the production that requires the rest of the production process to use the resources that
have the highest benefit. By using creativity, develop the product from local wisdom. Interested people can also
develop a lot of Thai desserts.
DISCUSSION Cocoon and Shallot soap when finished, there is a beautiful amber yellow color. The skin is soft and moisture-free.
This is the result of the adhesive water from the water, which is extracted from the flavor of the plant. In accordance
with the research of the National Mulberry Institute Ratchaphrisek (Meesil, 2009) to disclose the results of the
research showed that water is glued there is a large quantity of Nangnoi Srisakeat 1 compared to another cocoon. In
particular, amino acids in this quality protein are absorbed into the skin cells, helping to stimulate the skin's collagen,
which is a protein fiber that helps to firm skin. In addition, antioxidants and antimicrobial in Thai varieties powder
also help remove toxins in cells, reduce inflammation of the cells, and reduce the amount of germs on the skin,
resulting in a faster wound. Reduce inflammation from healthy skin Wrinkles are always younger and more
youthful. The traditional Thai wisdom will believe that the shallot helps to nourish the skin and cure the flu. Young
children time Sick will be recommended to bring shallot pounded and hung on the cradle, or can bring a big shallot.
Detox Fever When a shallot comes to experiment with the community to learn, it has been a huge interest in the
community because it is believed to be the same capital. For the shallot, from the experiment when bringing the red

Theerakan P. and Supatanachai P.
90
aroma water to boil the glycerin will also be yellow. It is close to the cocoon, helping skin to shine and reduce
inflammation of the two skin, it is a relatively low-end ingredient, and there is a Thai flavor. Use Thai scents to
reduce the scent of shallot. The results are consistent with the concept and international research for the shallot, and
the beauty found that sulfur in the red onion keeps skin youthful. Help the skin cells to relieve the red pain from
insect bites. A sting can be applied to a shallot that will cause Verrucas to fall away (Stylecraze, 2018). The shallot
contains vitamin A, which is beneficial to the skin. Skin Care & Bronzers (body) The skin can be used to use a
healthy body to remove dandruff and stimulate the hair growth (Nature and Garden, 2018).
The findings found that belief in the skin care of both Thai and foreign scents is consistent. In the future, a shallot
should be developed as a more diverse beauty product. Thailand is one of the biggest shallot base product in
ASEAN. By developing the foundation of creativity and innovation on the research base, together with educational
institutes, it will lead to a wide variety of wisdom, products such as liquid soap for children and gentle skin. This
concept is in line with the theory of hair removal, which is consistent with the theory 7 C development of the
creative and innovative human capital. (Hongladarom & Pokaew, 2018). This Research Discover the development
of human resources to be creative by stimulating the idea of thinking, as well as promoting the production of
innovative products and services to create a society. Creative learning by keeping the same things as wisdom and
enhancing the new things with continuous research and development. Learn together with community society
When you get creative products, lead to creative and creative marketing communications. A new knowledge is
spread to the public as well as the use of intellectual The power of wisdom community in order to accept new things
together.
CONCLUSION The research for the beauty of cocoon and shallot innovations sting Thai wisdom to develop community products
from the cocoon and the shallot, as well as the sufficiency economic philosophy, has begun to develop a master of
cocoon and shallot to develop the beauty formula. Thai Herbal soap is the remainder of the manufacturing process.
Using creativity on the basis of sufficiency is the use of resources to maximize the benefit of the production process,
it is a beauty formula that can be further capped into other products. Once you get the recipe and the product, the
researchers want to publish this helpful basic formula to those interested in developing a career or a new business,
especially the community. These two important resource bases can develop products from Thailand's wisdom to the
international under the Community's good resource base to create value-added values from wisdom to Thai society.
And the final goal is to develop Thai herbal business potential to be more strong from Thailand in the most potent
country in the ASEAN market. It also has some interesting important information about Thailand's first alternative
medical potential, which is ranked second in the world from China.
If Thailand and China have established relationships in developing herbal products for beauty, including more
alternative medicine, Thailand and China will be continuing to be the world's top strength in herbs and traditional
Thai medicine, and is more robust than ever. We have good relationships with both friendly and long-term
relationship.
SUGGESTIONS 1. Encourage Baan Noon Kaset women group to be a learning center on herbal product processing. Continuing
research results have been developed to lead to privatization for distribution. Will create a job, create a real career
and publish useful information for the good health of community members. And the general public to realize the
importance of Thai wisdom Beauty products that are processed from Thai herbs
2. When the research results indicate that Thai shallot Bang Chang Srisaket is a shallot that has the best quality in
product development Research results should be extended to Technology transfer to the community in Srisaket
Province for the farmers who grow shallot Will be a product development in the upstream source Help solve the
problem of shallot with a low price Reduce processing costs and adding value to Thai shallots.
3. Extend results in developing other health products in more ways.
ANNOUNCEMENT OF THE RESEARCH Researchers requested a thank you for Prontip Mahasarakram drinking water to support for community services,
Community group, participants who provide support and courtesy information in this research. In all sectors that
result in innovative research, this community has achieved success. Thank you teachers from school outside
education center, academics, biotechnology, Mahasarakham University and academics statistics from Mahasara-
The Cocoon and Shallot for Beauty: Innovation of Thai Wisdom, pp. 85–91
91
kham Rajabhat University, including Phuket Rajabhat University, the affiliation with the opportunity to develop
research to the community. And thank you for i-CoME International Conference on management and
Entrepreneurship.
REFERENCES Hongladarom, C., & Pokaew, T. (2018). Vitamin creative human capital development and innovation capital
development. Bangkok: Triple Education Group.
Karunamaiwong, P. (2003). Thai herbal processing. Bangkok: Chulalongkorn University Book Center.
Khaosod. (2016). Silk powder benefits for health and beauty. Recorded on 8 Aug 2016 Searched on 19 May 2018.
Nature, & Garden. (2018). Shallot: Health benefits and therapeutic value. http://www.nature-and- garden.com/
health/shallot-health.
Meesil, P. (2009). Turn over waste, worthless silk, with a price increase in the value of local waste. Retrieved 22
Jan 2009 from https://Mgronline.com/science/detail/9520000005347.
Public Relations Department. (2018). The department of traditional Thai medicine and alternative medicine drives
the development of Thai herbs as an economic plant. Retrieved 15 May 2018 from http://nwnt.prd.go.th/
CenterWeb/News.
Ratanakom, P. (2011). The study and development of herbal products, processing and packaging to promote
community careers. Bangkok: The Innovative Design Director.
Srinakrarintaraviroj University. (2018). Trend nano technology cosmetic/ cosmetic Thai herbs 2018. Post today.
Save on 4 Jan 2018 Searched on 14 May 2018 https://www.posttoday.com.
Stylecraze. (2018). 13 amazing benefits of shallots for skin, hair, and health. Http://www.stylecraze.com/articles/
benefits-of-shallots-for-skin-hair- and Health.
Tanthanee, S. (2018) Natural protein cocoon for skin health care. Department of Science Service, 66(207), 14–17.
Tepyaa, N. (2006) The magic of herbal soap. Yala Rajabhat University, 1(2), 156–164.
Wankaew, K. (2016). Processing of the product from the Acanthus leaf for health beauty of Baan Bang Tib Khura
Buri District Phang Nga Province. Department of Community Development Faculty of Humanities and
Social Sciences.

92
3rd International Conference on Management & Entrepreneurship (3rd i-CoME) ISBN 978-602-5446-15-3
Phuket, 25th – 27th July 2019
TRI NING DANU SUSTAINABLE TOURISM DESTINATION MODEL IN BEDUGUL TOURISM AREA, BALI
I Nyoman Sunarta
1, I Nyoman Sukma Arida
2, I Made Adikampana
3, Saptono Nugroho
4,
Ni Made Sofia Wijaya5
1,2,3,4,5 Universitas Udayana, Bali, Indonesia
Email: [email protected]; [email protected]
4;
ABSTRACT This research aims to formulate a sustainable tourism development model on three lakes in Bali or Tri Ning Danu. The model is designed based on existing features and strategic issues that have been identified which consist of seven variables, specifically: physical characteristics; typology and ideology of actors; tourism capital; type of community participation; typology of tourists based on actual and potential markets; life cycle of the destination area; and government policy. The scheme that formulated as a model for the integrated and sustainable development of Tri ning Danu tourism destinations with reference to the seven variables. This model is well-known MASTIM that stands for Mass-Alternative-Spiritual Tourism Integrated Model based on the concept of spiritual-ecotourism. Keywords: Tri ning danu, model, sustainable, tourism destination.
INTRODUCTION This research addressed to formulate a sustainable tourism development model on three lakes which are located in Bedugul Tourism Area, Beratan Lake, Buyan Lake, and Tamblingan Lake. The model are design based on strategis issues that have been identified and consist of seven variables, which are: Physical characteristic of Tri Ning Danu (v1); Typology and Ideology of Actors (v2); Tourism Capital (v3); Types of Community Participation (v4); Tourist Typology based on actual and potential tourism market (v5); Life Cycle of Destination Area (v6); Government Policy (v7). In order to achieve those goals, it will be carried out in two phase: 1. Conduct an analisys of existing features and strategic issues related to the seven variables
a. Analysis of physical condition related to water quality and quantity of the lake b. Analysis of Bedugul tourism stakeholder’s ideology c. Analysis of tourism capital d. Analysis of local community participation types e. Analysis of tourist typology identification related to actual and potential tourism market f. Analysis of tourism destination area’s life cycle g. Analysis of government policy
2. Model design a. Accumulated analysis as the base for designing sustainable tourism destination model based on Tri Ning
Danu in Bedugul tourism area b. Document preparation of analysis and sustainable tourism destination model design of Tri Ning Danu in
Bedugul Tourism Area
LITERATURE REVIEW The development of sustainable tourism is based on empowerment efforts, both in economic, social and cultural terms, which are a model of tourism that can stimulate the growth of socio-cultural and economic quality of the community and ensure environmental sustainability. The basic idea of sustainable development is the sustainability of natural and cultural resources. These resources must be maintained and preserved so that they can be used in the future. The use of these resources must involve local communities and provide optimal benefits for them (Damanik & Weber, 2006; Mowforth & Munt, 2004; Fagence, 2000). In addition, according to Mowforth and Munt (2004), the concept of sustainable tourism development includes three
components that are interconnected with one another, as follows:
1. Ecological Sustainability means that tourism development is not caused by irreversible changes in an existing
ecosystem, and is a generally accepted dimension since the need to protect natural resources from the negative
impacts of tourism activities.
Tri Ning Danu Sustainable Tourism Destination Model, pp. 92–97
93
2. Social Adaptability, in accordance with the ability of the community group to adapt with tourists without causing disharmony in social relations, both among members of the group with tourists, or between fellow members of the group.
3. Cultural Sustainability, in this context, assumes that the impact of the presence of tourists in a tourist destination does not have a negative impact on the development of local culture, but the existence of such cultures must be maintained for next generations.
Furthermore, to achieve the goal of sustainable tourism development, two approaches are needed in relation to
tourism. Fagence (2000) shows two models related to sustainable tourism. First, horizontal linkage, this approach
implies that tourism is a facilitator of various programs and policies that will be implemented. In order for the
process to be efficient, various components of policies that are mutually supportive are needed to be able to
understand the problem clearly, define the vision and mission of development, understanding the hierarchy of
program goals and objectives, and organizing the process well. In this approach tourism is a component of the
process that runs parallel to other fields so that collectivity is needed. Second, vertical linkage, the purpose of this
approach is to find a balance of combining the important components of tourism and development activities to
produce various creative breakthroughs in decision making.
In this study, the discourse of sustainability in the implementation of tourism also considers the approaches as
above. The new thing to do in this research is to add variables in assessing the existing aspects of the research
location, namely lake-based tourism areas, which consist of:
1. The ideology of tourism stakeholders; is an interpretation of the realm of tourism based on the truth value that is
believed and guides the actor in acting.
2. Tourism capital; is a resource owned by a destination that determines the peculiarities of tourism products
offered to tourists, which consist of: physical environmental capital, economic capital, social capital, cultural
capital, symbolic capital (Adi, 2008; Bourdieu, 1990; Field, 2010)
3. Level of participation of local people; is the level of involvement of local communities in the implementation of
tourism in the region related to aspects of involvement in decision making and sharing of tourism benefits
(Adikampana, Pujani, & Nugroho, 2018; Tosun, 2000)
4. Tourist typology related to the actual and potential of the tourism market; is a tourist who comes based on the
interaction, motivation and products offered (Murphy, 1985).
This research offers a new approach to interpreting the sustainable tourism model. The thinking framework used
previously in the discourse of sustainable tourism departs from the assumption of modernism, which is still anthro-
pocentric in nature, although it has included environmental variables in its studies, but still at the level of axiology
(ethics) in the context of human relations with nature. That implies the truth criteria that are built are still in
subjective (individual) and intersubjective (social agreement). This study utilizes a critical realism approach at the
epistemology level (Bhaskar, 1990) and ecophenomenology at the ontology level (Saraswati, 2013), so that object-
tive and subjective truths are obtained, which are seen as more adequate in interpreting the reality of tourism.
RESEARCH METHOD
The type of research conducted is field research using a mixed method. The mixed method is a method that com-
bines qualitative and quantitative approaches in all stages of the research process (Tashakkori, & Taddlie, 2010).
This type of research is considered capable of producing more comprehensive facts, because these researchers have
the freedom to use all data collection tools according to the type of data needed to achieve the research objectives.
The Mixed Method is also referred to as a methodology that provides philosophical assumptions in showing direc-
tions or giving instructions on how to collect data and analyze data, and the combination of quantitative and
qualitative approaches through several phases of the research process. Hesse in Sarwono (2011) suggests two ways
to make a mixed research design. The model is differentiated based on objectives, namely the design of parallel
mixed methods and the design of sequential mixed methods.
This research was located in the Bedugul Tourism Area, Bali and the scope covers ecological aspects, socio-cultural
aspects, and tourism aspects in Bedugul Tourism Area. Ecological aspects in the form of data on physical envi-
ronmental capital; socio-cultural aspects in the form of related data about the ideology of tourism stakeholders and
data on economic capital, social capital, cultural capital, and symbolic capital. While the tourism aspect is related to

I Nyoman S., I Nyoman S. A., I Made A., Saptono N., and Ni Made S. W.
94
tourist typology. Research was designed using parallel mixed methods. Parallel design using both studies (quan-
titative and qualitative) in a separate way but in the same research activities. Domination is given to the qualitative
component. Research begins by setting specific goals, which are then spelled out with aspects of the data to be
sought. The next step is to design a mixed method, namely quantitative and qualitative research design to find data
in accordance with the research objectives. After the data has been collected, the data is analyzed so that the findings
can be concluded.
FINDINGS
Existing Features of Tri Ning Danu Tourism Destination
Existing features of Tri Ning Danu consist of: (i) physical characteristic of the lake (water quality and quantity); (ii)
actor’s typology and ideology, consist of: main actor (actor with direct access to the lake and live around the lake
area), types of actor’s interpretation (touristic, ecology, theology), (iii) tourism capital (economy, social, culture,
symbolic), (iv) community participation type (coercive, induced, spontaneous); (v) tourist typology based on
tourism actual and potential market (market source, motivation, typology, length of stay, visitation behavior, source
of information and spending pattern); (vi) tourism destination life cycle (exploration, involvement, development,
consolidation, stagnation); and (vii) government policy.
Table 1
Existing Features of Tri Ning Danu
Variables Lakes in Bedugul Tourism Area
Beratan Buyan Tamblingan
Physical characteritic
- wáter quantity
- wáter quality
62.960.000 m3
Severely polluted
96.733.443 m3
Moderately polluted
33.530.000 m3
Mildly polluted
Typology and ideology of actor
- main actor
- interpretation type based on
dominant order
Local community
Touristic-Theological-
Ecological
Government (BKSDA)
Ecological-Touristic-
Theological
Government (BKSDA)
Ecological-Touristic-
Theological
Tourism capital Complete Deficient Mediocre
Types of community participation Spontaneous Coerced Induced
Tourist typology
- Market source
- Motivation
- Typology
- Length of stay
- Behavior
- Information source
- Spending
French, Germany, Australian
Natural and cultural
Day visitor
2 night
First timer, in group
Guide book, internet, WOM
IDR 450.000
French, Australian, USA
Natural and cultural
Day visitor
1 night
First timer, in group
Guide book, travel agent
IDR 350.000
Holland, French, UK, China
Natural and cultural
Day visitor
1 night
First timer, in group
Internet, travel agent, guide
book
IDR 300.000
Destination stages Consolidation Involvement Exploration
Government policy Have not maximally acted as
regulators and facilitators
Have not maximally acted as
regulators and facilitators
Have not maximally acted as
regulators and facilitators
Strategic Issues of Tri Ning Danu Tourism Destination
Furthermore, after acquiring the three lakes outlined in Table 1 concerning the existing features of the tourist
destination Tri Ning Danu, further exploration of strategic issues is carried out on each lake. The strategic issues
found will be the base for the model of sustainable tourism destination development on the three lake. The strategic
issues that have been obtained are outlined in Table 2.

Tri Ning Danu Sustainable Tourism Destination Model, pp. 92–97
95
Table 2
Strategic Issues of Tri Ning Danu
Strategic Issue Lakes in Bedugul Tourism Area
Beratan Buyan Tamblingan
Physical characteritic - Degradation of water quality
resulted by the presence of
heavy contamination from
pollutant caused by tourism
activity
- Construction of spillways
(valves/water holes for dams)
that pay less attention to lake
physical factors, cultural
factors of local communities,
and factor of tourism needs
- Degradation of lake water
quality with moderate
sedimentation and pollution
due to pollutants caused by
community agricultural and
fisheries activities
- Massive growth of weeds
(Selvinea) that begin to
cover some part of the lake
- Degradation of lake water
quality in the presence of
sedimentation and mild
pollution due to pollutants
resulting from community
agriculture and fisheries
activities
- Appearance of weeds
(Selvinea) begin to cover
some part of the lake
Typology and ideology of actor - Elitism by internal actor
- Tourism based coercion by
local community phenomena
- Mainstreaming of touristic
interpretation
- Elitism by quasi-internal
actor
- Tourism based coercion by
BKSDA phenomena
- Mainstreaming of ecologic
interpretation
- Elitism in tourism practices
with the domination of
quasi internal and external
actors (BKSDA, local
government, and investor
Tourism capital Lack of variations in tourist
attraction products offered
resulting in monotonous
attraction
Lack of variations in tourist
attraction products offered
resulting in monotonous
attraction
Lack of variations in tourist
attraction products offered
resulting in monotonous
attraction
Types of community
participation
Although it has the spontaneous
participation level, it is still
informal
Level of participation is very
low, which is coerced
participation
Level of participation
relatively low which is induced
participation
Tourist typology The dominance of day visitor The dominance of day visitor The dominance of day visitor
Destination stages In consolidation level. If it is not
vigilant it will slide down to the
stage of stagnation
Relatively low level which is
involvement
Very low level which is
exploration
Government policy Weak coordination/ sectoral,
partial, and elitist ego
Weak coordination/ sectoral,
partial, and elitist ego
Weak coordination/ sectoral,
partial, and elitist ego
Intergrated and Sustainable Development Model of Tri Ning Danu Tourism Destination
The integrated and sustainable development of Tri ning Danu tourist destinations is formulated based on the
strategic issues that have been acquired. Furthermore, based on this matter a representative development strategy is
carried out.
Table 3
Tourism Development Strategy of Tri Ning Danu
Development Strategy Lakes in Bedugul Tourism Area
Beratan Buyan Tamblingan
Physical characteristic Efforts are needed to glorify
the lake’s physical
environment
Efforts are needed to glorify the
lake’s physical environment
Efforts are needed to glorify the
lake’s physical environment
Typology and ideology of
actor - Decomposition of
interpretations into
theological-ecological-
touristic
- Deconstruction of tourism-
based coercion practices
- Decomposition of
interpretations into theological-
ecological-touristic
- Deconstruction of tourism-
based coercion practices
- Encouraging local community
as internal and main actor
- Decomposition of
interpretations into
theological-ecological-
touristic
- Mainstreaming the local
community in tourism
- Encouraging local
community as internal and
main actor
Tourism capital - Efforts needed to intensify
(quality improvement) and
- Efforts needed to intensify
(quality improvement) and
- Efforts needed to intensify
(quality improvement) and
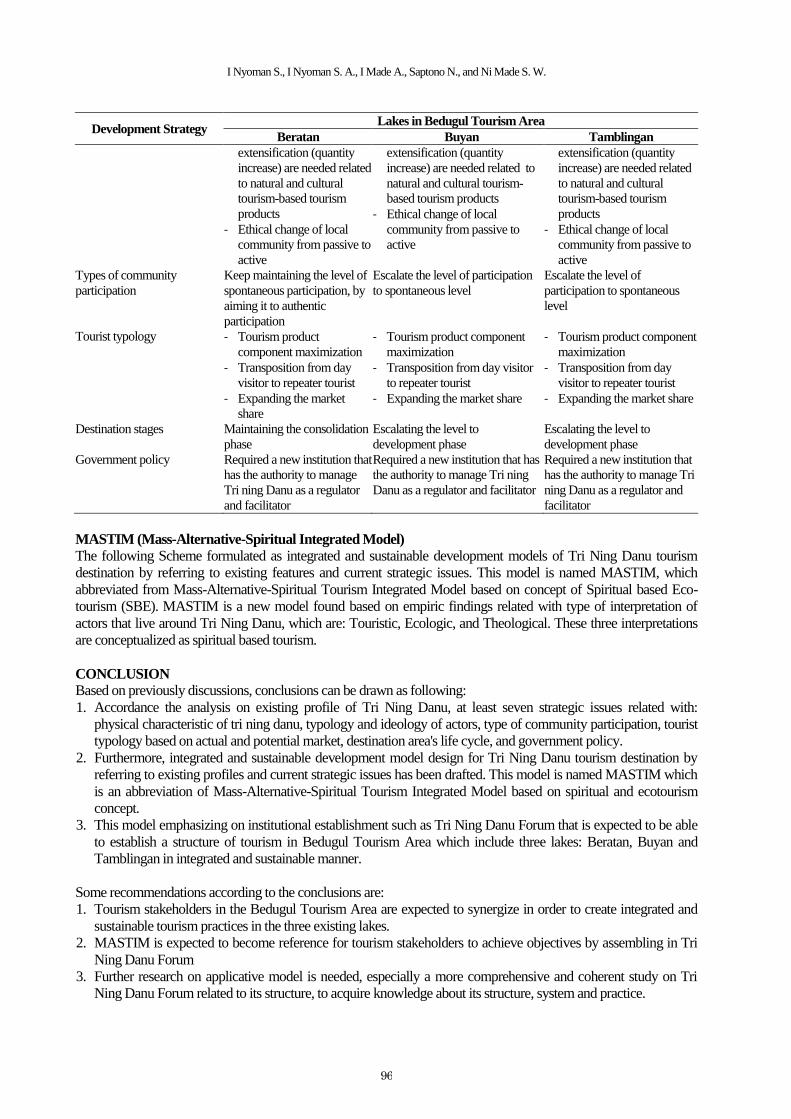
I Nyoman S., I Nyoman S. A., I Made A., Saptono N., and Ni Made S. W.
96
Development Strategy Lakes in Bedugul Tourism Area
Beratan Buyan Tamblingan
extensification (quantity
increase) are needed related
to natural and cultural
tourism-based tourism
products
- Ethical change of local
community from passive to
active
extensification (quantity
increase) are needed related to
natural and cultural tourism-
based tourism products
- Ethical change of local
community from passive to
active
extensification (quantity
increase) are needed related
to natural and cultural
tourism-based tourism
products
- Ethical change of local
community from passive to
active
Types of community
participation
Keep maintaining the level of
spontaneous participation, by
aiming it to authentic
participation
Escalate the level of participation
to spontaneous level
Escalate the level of
participation to spontaneous
level
Tourist typology - Tourism product
component maximization
- Transposition from day
visitor to repeater tourist
- Expanding the market
share
- Tourism product component
maximization
- Transposition from day visitor
to repeater tourist
- Expanding the market share
- Tourism product component
maximization
- Transposition from day
visitor to repeater tourist
- Expanding the market share
Destination stages Maintaining the consolidation
phase
Escalating the level to
development phase
Escalating the level to
development phase
Government policy Required a new institution that
has the authority to manage
Tri ning Danu as a regulator
and facilitator
Required a new institution that has
the authority to manage Tri ning
Danu as a regulator and facilitator
Required a new institution that
has the authority to manage Tri
ning Danu as a regulator and
facilitator
MASTIM (Mass-Alternative-Spiritual Integrated Model)
The following Scheme formulated as integrated and sustainable development models of Tri Ning Danu tourism
destination by referring to existing features and current strategic issues. This model is named MASTIM, which
abbreviated from Mass-Alternative-Spiritual Tourism Integrated Model based on concept of Spiritual based Eco-
tourism (SBE). MASTIM is a new model found based on empiric findings related with type of interpretation of
actors that live around Tri Ning Danu, which are: Touristic, Ecologic, and Theological. These three interpretations
are conceptualized as spiritual based tourism.
CONCLUSION
Based on previously discussions, conclusions can be drawn as following:
1. Accordance the analysis on existing profile of Tri Ning Danu, at least seven strategic issues related with:
physical characteristic of tri ning danu, typology and ideology of actors, type of community participation, tourist
typology based on actual and potential market, destination area's life cycle, and government policy.
2. Furthermore, integrated and sustainable development model design for Tri Ning Danu tourism destination by
referring to existing profiles and current strategic issues has been drafted. This model is named MASTIM which
is an abbreviation of Mass-Alternative-Spiritual Tourism Integrated Model based on spiritual and ecotourism
concept.
3. This model emphasizing on institutional establishment such as Tri Ning Danu Forum that is expected to be able
to establish a structure of tourism in Bedugul Tourism Area which include three lakes: Beratan, Buyan and
Tamblingan in integrated and sustainable manner.
Some recommendations according to the conclusions are:
1. Tourism stakeholders in the Bedugul Tourism Area are expected to synergize in order to create integrated and
sustainable tourism practices in the three existing lakes.
2. MASTIM is expected to become reference for tourism stakeholders to achieve objectives by assembling in Tri
Ning Danu Forum
3. Further research on applicative model is needed, especially a more comprehensive and coherent study on Tri
Ning Danu Forum related to its structure, to acquire knowledge about its structure, system and practice.
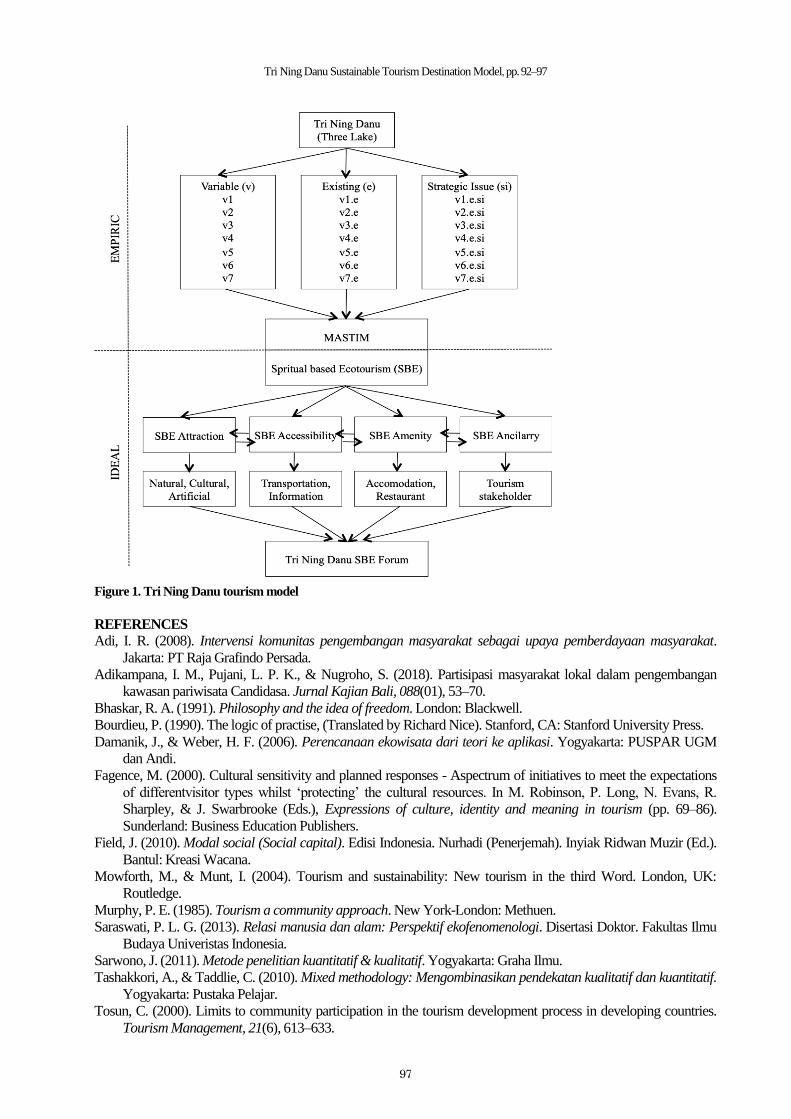
Tri Ning Danu Sustainable Tourism Destination Model, pp. 92–97
97
Figure 1. Tri Ning Danu tourism model
REFERENCES
Adi, I. R. (2008). Intervensi komunitas pengembangan masyarakat sebagai upaya pemberdayaan masyarakat.
Jakarta: PT Raja Grafindo Persada.
Adikampana, I. M., Pujani, L. P. K., & Nugroho, S. (2018). Partisipasi masyarakat lokal dalam pengembangan
kawasan pariwisata Candidasa. Jurnal Kajian Bali, 088(01), 53–70.
Bhaskar, R. A. (1991). Philosophy and the idea of freedom. London: Blackwell.
Bourdieu, P. (1990). The logic of practise, (Translated by Richard Nice). Stanford, CA: Stanford University Press.
Damanik, J., & Weber, H. F. (2006). Perencanaan ekowisata dari teori ke aplikasi. Yogyakarta: PUSPAR UGM
dan Andi.
Fagence, M. (2000). Cultural sensitivity and planned responses - Aspectrum of initiatives to meet the expectations
of differentvisitor types whilst ‘protecting’ the cultural resources. In M. Robinson, P. Long, N. Evans, R.
Sharpley, & J. Swarbrooke (Eds.), Expressions of culture, identity and meaning in tourism (pp. 69–86).
Sunderland: Business Education Publishers.
Field, J. (2010). Modal social (Social capital). Edisi Indonesia. Nurhadi (Penerjemah). Inyiak Ridwan Muzir (Ed.).
Bantul: Kreasi Wacana.
Mowforth, M., & Munt, I. (2004). Tourism and sustainability: New tourism in the third Word. London, UK:
Routledge.
Murphy, P. E. (1985). Tourism a community approach. New York-London: Methuen.
Saraswati, P. L. G. (2013). Relasi manusia dan alam: Perspektif ekofenomenologi. Disertasi Doktor. Fakultas Ilmu
Budaya Univeristas Indonesia.
Sarwono, J. (2011). Metode penelitian kuantitatif & kualitatif. Yogyakarta: Graha Ilmu.
Tashakkori, A., & Taddlie, C. (2010). Mixed methodology: Mengombinasikan pendekatan kualitatif dan kuantitatif.
Yogyakarta: Pustaka Pelajar.
Tosun, C. (2000). Limits to community participation in the tourism development process in developing countries.
Tourism Management, 21(6), 613–633.
98
3rd International Conference on Management & Entrepreneurship (3rd i-CoME) ISBN 978-602-5446-15-3
Phuket, 25th – 27th July 2019
GASTRONOMY TOURISM IN UBUD
Putu Sucita Yanthy
1, Ni Nyoman Sri Aryanti
2
1,2 Diploma IV Programe, Tourism Faculty of Udayana University
Email: [email protected]; [email protected]
2
ABSTRACT Ubud has been recognized as an international tourist destination because of its traditional cultural tourist attraction, and currently
has a great opportunity to be designated as the UNWTO Prototype as a world gastronomic destination. The purpose of this study
was to analyzed the Ubud’s potential as a gastronomic tourism in terms of history, authenticity and uniqueness that can increase
the opportunity of Ubud becoming more widely known as a gastronomic tourist destination. As a result, from the historical
aspects found that the existence of Yeh Pulu Subak which has historical value in Bali agriculture and from its uniqueness and
authenticity, Ubud's local food has a unique taste that come from the Base genep that represents the taste of local food.
Keywords: Gastronomy tourism, history, authenticity, uniqueness.
INTRODUCTION
The Importance of Gastronomy in Ubud Gastronomy is a tool to facilitate understanding of cultural heritage well. Tourists who are traveling are looking for
something authentic and a transparent travel experience. Local food provides everything for tourists, like a lens, food
reveals the history, people, and culture of the destination they visit. Even so, TV shows and cooking shows and even
cooking competitions are very important nowadays and very popular. Gastronomy also acts as a protector of cul-
tural authenticity because gastronomic development in a destination can protect local food traditions, food ingre-
dients and spices, and culture. It is emphasized by Boutsioukou (2018) that at present the destination that dares to
introduce local food globally refers to gastronomy, this leads to a more local destination. More destinations
embraced localism when it comes to food and drinks destinations where there is a lot of localism when it comes to
gastronomy - they are turning to local (Boutsioukou, 2018).
Hall and Sharples (2003) explain about gastronomy travel is the experience gained by tourists as a whole related to
food. The main purpose of the trip is to enjoy food at the destination and link it to attractions, entertainment festivals,
exhibitions, cooking shows and markets that sell local products directly from the farmers. Gastronomy tourism is
very identical to lifestyle including experience gained by studying cultural differences, understanding the attributes
and quality of the products produced at a destination.
Gastronomy is interpreted as the art of eating in order to distinguish it from the culinary emphasis on the art of
cooking (Ketaren, 2019). Gastronomy is in eating and eating procedures. The beginning of the gastronomic word is
known through a poem written by Jaques Barcheux in 1804, the growing popularity of this term throughout the
gastronomic world is now so well known that the growth of restaurants offering a variety of foods and classes is
sought by enthusiasts including tourists who are now competing looking for types of foods in various corners of
tourist destinations.
Indonesia itself gets various gastronomic influences from various ethnic and ethnic groups in Indonesia. For exam-
ple, China, Arabia, India, which adds a diversity of Indonesian food tastes. Regarding gastronomy in Indonesia
certainly has a lot of potential. One of the popular Ubud destinations is introduced as the international village of
Bali. Gastronomy in Ubud can also be said to have a plus because the history and culture contained in Balinese food
in particular in this destination is very strong and still competes with other gastronomic destinations.
Ubud gastronomy can be formed from three factors, namely culture, history, and food, this concept was developed
from a triangle gastronomy of Indonesia which is reinforced by the aspects possessed by Ubud as a gastronomic
destination.
Triangle Concept on Ubud is an adaptation of a triangle on Indonesian Gastronomy cited from the UNWTO report
2nd Global report on gastronomy tourism in 2017. The main aspects discussed are food which is the main center of
gastronomic aspects, influenced by cultural, ritual, and spices. Next is culture, the story behind food. Stories about
food will enliven the values of food that can be lifted from rituals and ceremonies including the process of cooking
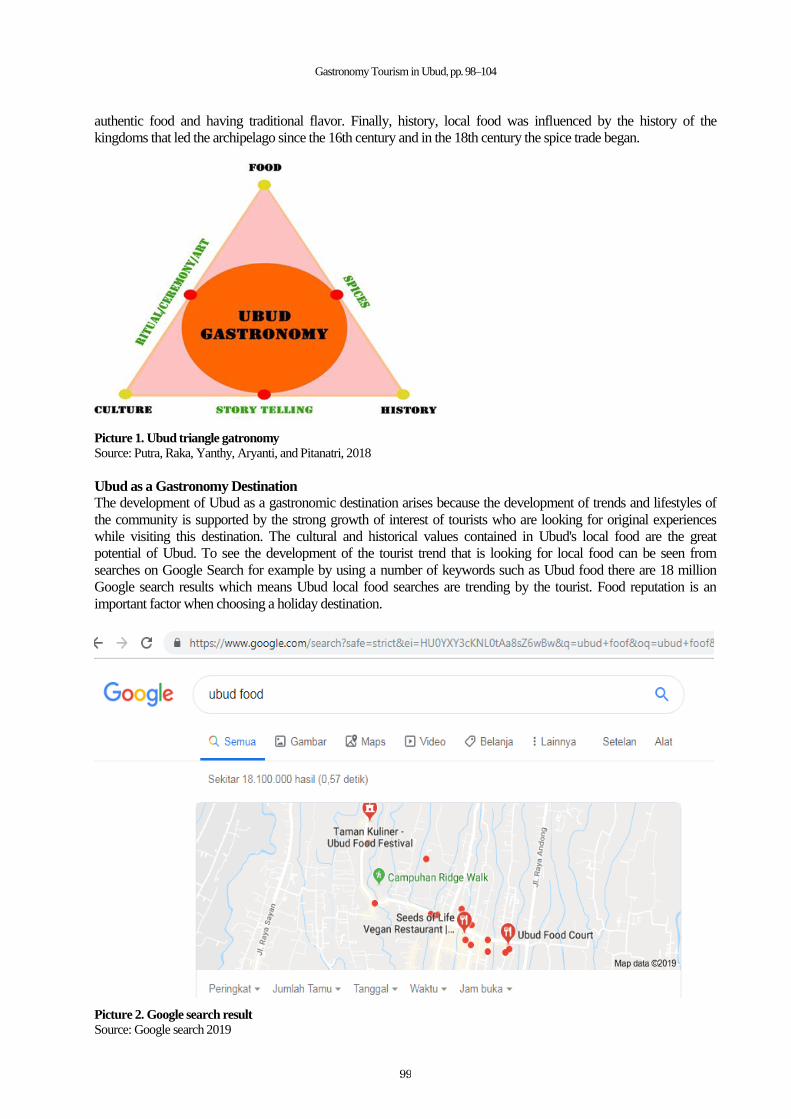
Gastronomy Tourism in Ubud, pp. 98–104
99
authentic food and having traditional flavor. Finally, history, local food was influenced by the history of the
kingdoms that led the archipelago since the 16th century and in the 18th century the spice trade began.
Picture 1. Ubud triangle gatronomy
Source: Putra, Raka, Yanthy, Aryanti, and Pitanatri, 2018
Ubud as a Gastronomy Destination The development of Ubud as a gastronomic destination arises because the development of trends and lifestyles of
the community is supported by the strong growth of interest of tourists who are looking for original experiences
while visiting this destination. The cultural and historical values contained in Ubud's local food are the great
potential of Ubud. To see the development of the tourist trend that is looking for local food can be seen from
searches on Google Search for example by using a number of keywords such as Ubud food there are 18 million
Google search results which means Ubud local food searches are trending by the tourist. Food reputation is an
important factor when choosing a holiday destination.
Picture 2. Google search result
Source: Google search 2019
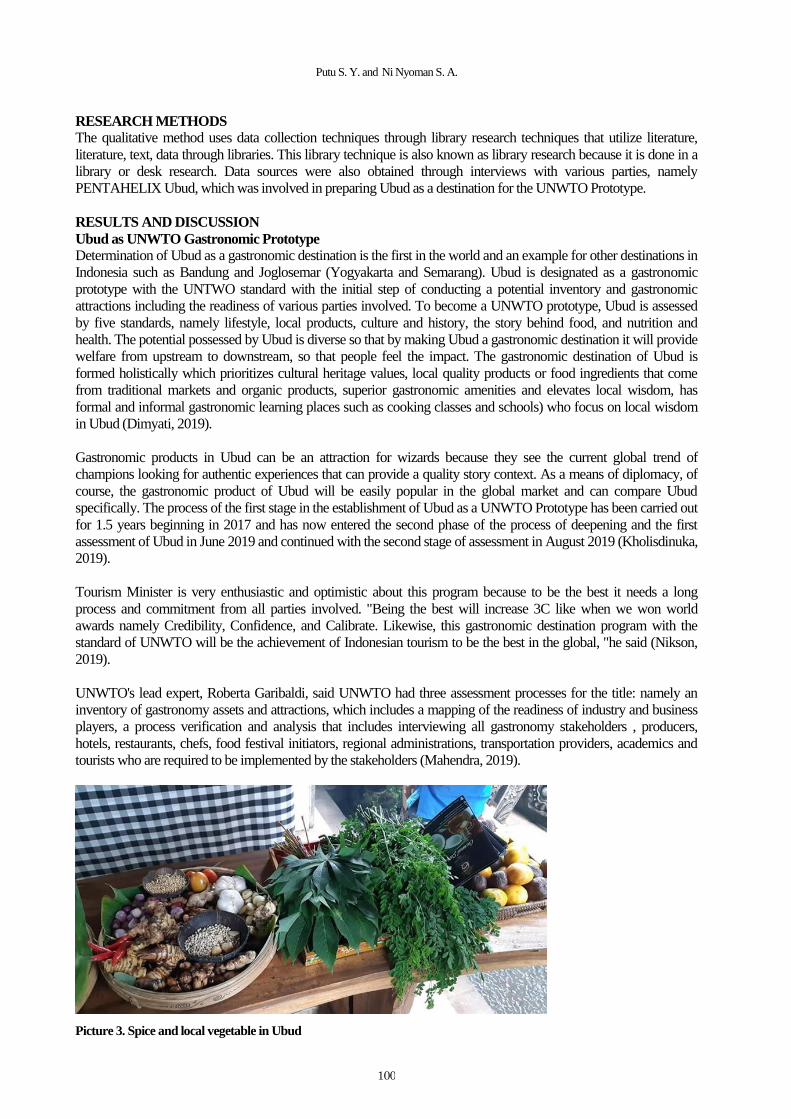
Putu S. Y. and Ni Nyoman S. A.
100
RESEARCH METHODS
The qualitative method uses data collection techniques through library research techniques that utilize literature,
literature, text, data through libraries. This library technique is also known as library research because it is done in a
library or desk research. Data sources were also obtained through interviews with various parties, namely
PENTAHELIX Ubud, which was involved in preparing Ubud as a destination for the UNWTO Prototype.
RESULTS AND DISCUSSION
Ubud as UNWTO Gastronomic Prototype Determination of Ubud as a gastronomic destination is the first in the world and an example for other destinations in
Indonesia such as Bandung and Joglosemar (Yogyakarta and Semarang). Ubud is designated as a gastronomic
prototype with the UNTWO standard with the initial step of conducting a potential inventory and gastronomic
attractions including the readiness of various parties involved. To become a UNWTO prototype, Ubud is assessed
by five standards, namely lifestyle, local products, culture and history, the story behind food, and nutrition and
health. The potential possessed by Ubud is diverse so that by making Ubud a gastronomic destination it will provide
welfare from upstream to downstream, so that people feel the impact. The gastronomic destination of Ubud is
formed holistically which prioritizes cultural heritage values, local quality products or food ingredients that come
from traditional markets and organic products, superior gastronomic amenities and elevates local wisdom, has
formal and informal gastronomic learning places such as cooking classes and schools) who focus on local wisdom
in Ubud (Dimyati, 2019).
Gastronomic products in Ubud can be an attraction for wizards because they see the current global trend of
champions looking for authentic experiences that can provide a quality story context. As a means of diplomacy, of
course, the gastronomic product of Ubud will be easily popular in the global market and can compare Ubud
specifically. The process of the first stage in the establishment of Ubud as a UNWTO Prototype has been carried out
for 1.5 years beginning in 2017 and has now entered the second phase of the process of deepening and the first
assessment of Ubud in June 2019 and continued with the second stage of assessment in August 2019 (Kholisdinuka,
2019).
Tourism Minister is very enthusiastic and optimistic about this program because to be the best it needs a long
process and commitment from all parties involved. "Being the best will increase 3C like when we won world
awards namely Credibility, Confidence, and Calibrate. Likewise, this gastronomic destination program with the
standard of UNWTO will be the achievement of Indonesian tourism to be the best in the global, "he said (Nikson,
2019).
UNWTO's lead expert, Roberta Garibaldi, said UNWTO had three assessment processes for the title: namely an
inventory of gastronomy assets and attractions, which includes a mapping of the readiness of industry and business
players, a process verification and analysis that includes interviewing all gastronomy stakeholders , producers,
hotels, restaurants, chefs, food festival initiators, regional administrations, transportation providers, academics and
tourists who are required to be implemented by the stakeholders (Mahendra, 2019).
Picture 3. Spice and local vegetable in Ubud

Gastronomy Tourism in Ubud, pp. 98–104
101
Potential Gastronomic Tourism in Ubud
As a gastronomic destination, Ubud has a variety of tourist attractions, from historical heritage to interesting and
related digital attractions both directly and indirectly with gastronomic tourism. The potential of gastronomic tourist
attraction in Ubud can be seen tangibly from the existence of historical sites that tell of food gathering activities,
ancient artifacts related to food activities and the availability of a variety of culinary forms that can be served to
tourists. While intangible things that can be used as an attraction include the culture of processing and serving food,
the story behind traditional food both in terms of history and philosophy.
If traced deeper into gastronomic tourism is part of cultural tourism. Gastronomic tourism is a cultural tourism that
explores and puts forward the culture of eating a community group. As revealed by Gillesoie and Cousin (2001)
quoted in Wikipedia that gastronomy is a study of food as part of a cultural component, while according to Savarin
(2009) gastronomy is defined as a science that deals with everything related to human food.
Gastronomy that is often identified with traditional food is an ethnic identity because food is central to the rituals of
daily life, habits, and traditions of an ethnic group. Traditional food ingredients, agricultural methods or systems and
geographical conditions are factors that cause food to reflect the identity of a culture (Elbert, 2011). To be able to
make gastronomy as a tourist attraction according to Damanik and Weber (2006) at least the gastronomy must be
unique, originality, authentic and diversity
Historical Value Food is a basic human need. Various sciences and technologies developed in order to meet these basic needs gave
birth to various civilizations of human culture. Differences in geographical conditions and local expertise give birth
to different gastronomy in different places. The length of human civilization in its efforts to fulfill its food needs
gave birth to historical values and folklore related to food. Likewise in the Ubud area of Gianyar, various historical
and historical relics of traditional foods color the gastronomic development of Ubud.
Gastronomy can be said to start from farming activities that have been carried out since human entered settled
civilization to meet food needs. World agriculture is believed to have begun since the 800th century BC by the
Romans (White, 1970). The farming activities of the Ubud community itself began with the arrival of Rishi
Markandeya to Bali in the 8th century AD. the arrival of Rishi Markandeya in Bali coincides with the beginning of
Balinese history. The story of Maharesi Markandeya's arrival and my buying journey to build a farming system in
Bali gave birth to various stories and historical relics that have the potential to be used as a gastronomic tourist
attraction.
The word Ubud itself originating from the word Ubad originated from a Maharesi journey that carried out puri-
fication in a Campuhan (meeting two rivers) between the Wos Lanang and Wos rivers. drug). until now the river
that flows from the two rivers is called the Campuhan river which flows in the heart of the Ubud area.
The story of Maharesi markandeya in spreading agricultural activities then continued into the era of the ancient
Balinese kingdom in the 9th century until the 14th century where agriculture began to be organized more modernly
marked by historical relics and various artifacts or inscriptions made in the kingdom Ancient Bali led by the
Warmadewa dynasty. such as the irrigation system which is still used today, the subak system was introduced
during the reign of Marakatta (King of the Warmadewa dynasty).
Archaeological remains such as Pura Tirta Empul, and the site of Pulu indicate that gastronomic activities in the area
of Ubud have been started long ago. Pura Tirta Empul is a spring that was dammed by Sri Chandrabayasingha
Warmadewa which was channeled to irrigate the fields of the Subak Kulub and Subak Pulagan (Ardhana &
Setiawan, 2014). Subak Pulagan itself can still be found in the Ubud area. While the Yeh Pulu site is one of the
historical legacies that provides a clear picture of the process of hunting and agriculture in a wall relief that stretches
along 26.5 meters.
Various inscriptions that mention the gatronomy developments of Ubud have also been found around the area of
Ubud. as in the Serai A II inscription, Sading A, Abang Pura Batur A / (Goris, 1954) which is a relic of the ancient
Balinese era, there are many mentioned food ingredients which are still consumed today by the Balinese and Ubud
communities in particular.
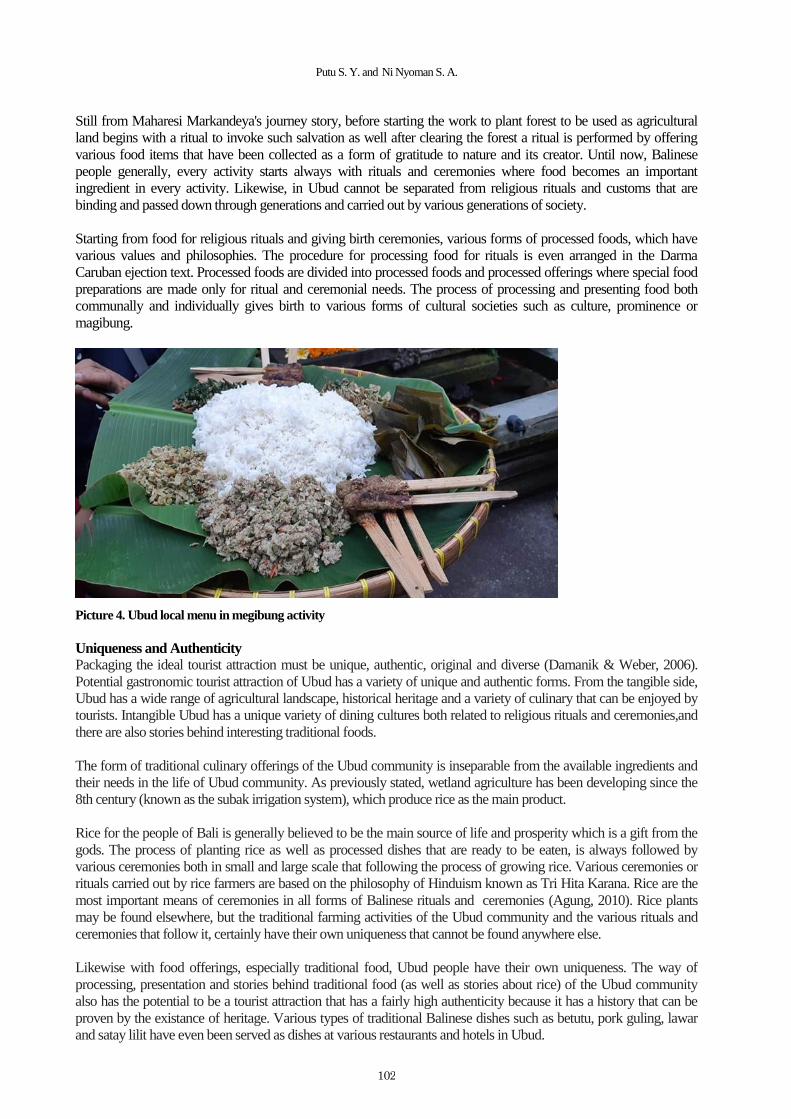
Putu S. Y. and Ni Nyoman S. A.
102
Still from Maharesi Markandeya's journey story, before starting the work to plant forest to be used as agricultural
land begins with a ritual to invoke such salvation as well after clearing the forest a ritual is performed by offering
various food items that have been collected as a form of gratitude to nature and its creator. Until now, Balinese
people generally, every activity starts always with rituals and ceremonies where food becomes an important
ingredient in every activity. Likewise, in Ubud cannot be separated from religious rituals and customs that are
binding and passed down through generations and carried out by various generations of society.
Starting from food for religious rituals and giving birth ceremonies, various forms of processed foods, which have
various values and philosophies. The procedure for processing food for rituals is even arranged in the Darma
Caruban ejection text. Processed foods are divided into processed foods and processed offerings where special food
preparations are made only for ritual and ceremonial needs. The process of processing and presenting food both
communally and individually gives birth to various forms of cultural societies such as culture, prominence or
magibung.
Picture 4. Ubud local menu in megibung activity
Uniqueness and Authenticity Packaging the ideal tourist attraction must be unique, authentic, original and diverse (Damanik & Weber, 2006).
Potential gastronomic tourist attraction of Ubud has a variety of unique and authentic forms. From the tangible side,
Ubud has a wide range of agricultural landscape, historical heritage and a variety of culinary that can be enjoyed by
tourists. Intangible Ubud has a unique variety of dining cultures both related to religious rituals and ceremonies,and
there are also stories behind interesting traditional foods.
The form of traditional culinary offerings of the Ubud community is inseparable from the available ingredients and
their needs in the life of Ubud community. As previously stated, wetland agriculture has been developing since the
8th century (known as the subak irrigation system), which produce rice as the main product.
Rice for the people of Bali is generally believed to be the main source of life and prosperity which is a gift from the
gods. The process of planting rice as well as processed dishes that are ready to be eaten, is always followed by
various ceremonies both in small and large scale that following the process of growing rice. Various ceremonies or
rituals carried out by rice farmers are based on the philosophy of Hinduism known as Tri Hita Karana. Rice are the
most important means of ceremonies in all forms of Balinese rituals and ceremonies (Agung, 2010). Rice plants
may be found elsewhere, but the traditional farming activities of the Ubud community and the various rituals and
ceremonies that follow it, certainly have their own uniqueness that cannot be found anywhere else.
Likewise with food offerings, especially traditional food, Ubud people have their own uniqueness. The way of
processing, presentation and stories behind traditional food (as well as stories about rice) of the Ubud community
also has the potential to be a tourist attraction that has a fairly high authenticity because it has a history that can be
proven by the existance of heritage. Various types of traditional Balinese dishes such as betutu, pork guling, lawar
and satay lilit have even been served as dishes at various restaurants and hotels in Ubud.

Gastronomy Tourism in Ubud, pp. 98–104
103
In general, traditional Balinese cuisine is very dependent on the strength of the spices. Base Gede (complete spice) is
one of the spices used in most traditional Balinese dishes. Like rice, the Balinese seasoning is also believed by the
Balinese as a gift of God. The story behind this spice starts from the Mahabarata legend where the pandawa of the
brothers (Yudisthira, Bima, Arjuna, Nakula, Sahadewa and Drupadi) do yoga semadhi to be endowed with the
power of taste. The prayers were granted by the gods by conferring the salty taste in the form of kencur (Kaempferia
galanga), the taste of bitter in the form of galangal, pungent taste in the form of turmeric, spicy taste in the form of
ginger, sweetness in the form of shallots and garlic and sour taste in the form of lime.
In addition to the Pandawa legend, Base Gede materials are also mentioned in Batur Pura Abang A (dated 9th
century) such as chili, red onion, garlic, galangal, kencur, turmeric, ginger, pecan, coriander, cardamom, orange, and
coconut , which has been cultivated in Bali since the reign of ancient Balinese kings (Aryanti, 2014).
Traditional cuisine of Ubud people that can be said to be authentic one of them is chicken / duck Betutu. It is said
authentic because the ingredients of the making have been mentioned in ancient Balinese inscriptions, this dish is
present in every religious ritual and ceremonies activity of the Ubud community, and the processing is quite unique.
The history of chickens and ducks or poultry as dishes has been known since the days of the Ancient Balinese
Empire. In the Serai AII IV.1 inscription mentioned royal officials who were visiting were given chicken meat
dishes. This shows that in the ancient Balinese kingdom even chicken became a valuable dish given to royal
officials.
In religious rituals chicken or duck betutu have a philosophy as an embodiment of the request for holiness and
dharma before the gods. Betutu form where the head is bent toward the abdomen and closed part of the wing
describes the attitude of people who are yoga. The processing of betutu chickens in Ubud in particular has its own
uniqueness where the chicken / duck that has been covered with Base gede is then tied and wrapped with coconut
fronds before being roasted under the coals of rice husk.
In addition to traditional chicken betutu which can be said to be authentic in the area of Ubud is a guling and lawar
pork which is made from pork and of course seasoned with Base gede. In the religious rituals of guling pork, it has a
philosophy as a symbol of prosperity and prosperity. Likewise, lawar has four kinds of colors (white, yellow, red
and green) where each color is a symbol of the gods.
CONCLUSION Ubud has been known as a tourist destination in Bali that has natural beauty as well as the uniqueness of its
traditional culture. However, Ubud also has the potential for tourist attraction which can be packaged in the form of
gastronomic tourism.
Ubud has a variety of relics and historical stories related to the gastronomy of the Ubud community. Gastronomic
cultivation in Ubud stems from agricultural activities that have been developed since the days of the ancient
Balinese kingdom (8–14th century AD). Stories and historical relics related to the gastronomy of Ubud can still be
seen today which can be used as tourist attractions that can be visited such as Yeh Pulu site, Tampak siring, and
subak Pulagan.
These stories and historical heritage support the authenticity of the gastronomic tourist attraction of Ubud. While the
function of traditional food in the Ubud community as a dish and offering gives birth to a unique and authentic
gastronomic culture as a tourist attraction.
The big potential gastronomic tourism which is owned Ubud would be stronger if the support the people of Ubud.
Therefore, there should be socialization to all community in Ubud. Because commuity awareness needs to be raised
to support every positive activity for the advancement of tourism. Even more important is building the commitment
of the community, especially the Ubud community to succeed in the gastronomic acceleration program. The
presence of gastronomic tourist attraction based on local wisdom is expected to be able to live, grow and develop as
other tourist attractions. The Ubud community that has made tourism a part of their lives, the tourist attraction that
they have has increased with the presence of gastronomy (culinary). With hope, the presence of gastronomy can
support, strengthen, and make Ubud more complete as a world tourist attraction.

Putu S. Y. and Ni Nyoman S. A.
104
REFERENCE Agung, N. M. (2010). Pawon Bali 60 resep masakan khas Bali pilihan. Jakarta: Gramedia.
Ardhana, I. K., & Setiawan, I. K. (2014). Raja Udayana Warmadewa: Nilai-nilai kearifan dalam konteks religi,
sejarah, sosial budaya, ekonomi, lingkungan, hukum, dan pertahanan dalam perspektif lokal, nasional, dan
universal. Denpasar, Bali: Pustaka Larasan bekerja sama dengan Pemerintah Kabupaten Gianyar.
Aryanti, N. N. S. (2014). Menelusuri jejak gastronomi jaman Raja Udayana (Warisan budaya gastronomi
sebagai daya tarik wisata). In I. K. Ardhana, & I. K. Setiawan (Eds.), Raja Udayana Warmadewa: Nilai-nilai
kearifan dalam konteks religi, sejarah, sosial budaya, ekonomi, lingkungan, hukum, dan pertahanan dalam
perspektif lokal, nasional, dan universal. Denpasar, Bali: Pustaka Larasan bekerja sama dengan Pemerintah
Kabupaten Gianyar.
Boutsioukou, K. (2018). Key trends in culinary tourism. Retrieved from https://sector.tov.be/wp-content/uploads/
2018/11/GlobalData_Keytrendsinculinarytourism_130918.pdf
Damanik, J., & Weber, H. F. (2006). Perencanaan ekowisata: Dari teori ke aplikasi. Yogyakarta: Puspar UGM &
Andi Offset.
Dimyati, V. (2019). Ubud ditetapkan jadi destinasi wisata gastronomi standar dunia. Retrieved from https://www.
inews.id/travel/destinasi/ubud-ditetapkan-jadi-destinasi-wisata-gastronomi-standar-dunia/566525
Elbert, C. (2011). Gastronomy and cultural identity in a pluralistic society. Retrieved from http://faith andheritage.
com/2011/01/gastronomy-and-cultural-identity-in-a-pluralistic-society/
Gillesoie, C., & Cousin, J., A. (2001). European gastronomy into the 21st century. Retrieved from http://id.wiki-
pedia.org/wiki/Gastronomi
Goris, R. (1954). Prasasti Bali I dan II. Bandung: Masa Baru.
Ketaren, I. (2019). Pemahaman terhadap gastronomi. Retrieved from https://groups.google.com/d/msgid/ gas-
tronomi-indonesia/1ca16415-8632-4e86-87f8-17fe35ee0462%40googlegroups.com.
Kholisdinuka, A. (2019). Ubud Bali siap jadi destinasi gastronomi berstandar global. Detik.com. Retrieved from
https://travel.detik.com/travel-news/d-4583915/ubud-bali-siap-jadi-destinasi-gastronomi-ber standar-global
Mahendra, A. (2019). Ubud may be named global 'gastronomy destination. The Jakarta Post. Retrieved from
https://www.thejakartapost.com/life/2019/06/13/ubud-may-be-named-global-gastronomy-de stination.html
Nikson. (2019). Ubud segera ditetapkan sebagai destinasi gastronomi dunia. Balipost.com. Retrieved from
http://www.balipost.com/news/2019/06/11/77454/Ubud-Segera-Ditetapkan-sebagai-Destinasi...ht ml
Putra, I. N. D., Raka, A. A. G., Yanthy, P. S., Aryanti, N. N. S., & Pitanatri, P. D. S. (2018). Wisata gastronomi
Ubud Gianyar. Denpasar: Cakra Media Utama.
Savarin, J. A. B. (2009). The physiology of taste or meditations on transcendental gastronomy (Translated by M. F.
K. Fisher). Retrieved from http://books.google.co.id/books?id=djEEAAAAYAAJ&pri ntsec=frontcover&dq=
gastronomy&hl=id&sa=X&ei=6FLU8DQGeT40gHbqoDAAw&redir_esc=y#v=onepage&q=gastronomy&f
=false
White, K. D. (1970). Roman farming. Ithaca, NY: Cornell University Press.

105
3rd International Conference on Management & Entrepreneurship (3rd i-CoME) ISBN 978-602-5446-15-3
Phuket, 25th – 27th July 2019
ANALYSIS THE IMPACT OF CAPITAL STRUCTURE AND
PROFITABILITY ON DIVIDEND POLICY: CASE STUDY OF
MANUFACTURING FIRM IN INDONESIA
Miswanto Miswanto
1, Fajar Ardy Prasetyo
2
1,2 Sekolah Tinggi Ilmu Ekonomi (STIE) YKPN Yogyakarta, Indonesia
Email: [email protected]; [email protected]
2
ABSTRACT This research was done to test the impact of capital structure and profitability on dividend policy. This research examines
manufacturing firms listed in IDX (Indonesia Stock Exchange) period 2011–2014. The companies studied are 120
manufacturing firms. The main source of research data is from Indonesia Capital Market Directory (ICMD). Sampling in this
study takes purposive sampling method. The analysis system uses multiple linear regression and panel data. The results of
research on the effect of capital structure to dividend policy indicates that Book Debt to Asset Ratio and Long Term Debt to
Equity Ratio have a negative effect on dividend policy. Book Debt to Equity Ratio has a positive impact on dividend policy. The
results of research on the effect of profitability to dividend policy indicates that Return on Asset, Return on Equity, and Net Profit
Margin do not have a positive impact on dividend policy. The findings of this study are that the capital structure influences
dividend policy, but profitability does not influence dividend policy.
Keywords: Capital structure, debt, dividend, equity, profitability.
INTRODUCTION
Competition in the increasing stringent business world makes companies, especially manufacturing companies, try
to rise the value and performance of the firm. To increase the value and performance of the firm, it can be done
through increasing the prosperity of ownership or shareholders. In choosing an alternative funding to finance, the
activities of the firm to be considered is how the firm can create a favorable combination between the uses of
funding sources. The source of corporate funding comes from internal sources and external sources. Internal sources
of the firm are self-generated funds within the firm while external sources are funds from creditor and owner or
shareholder.
The capital structure has an impact on the dividend policy because the capital structure reflects the ability of the
company to fulfill all debt obligations indicated by what part of its own capital taken to pay the debt. Debt is one of
the funding source which will cause the company to bear the fixed burden of interest and debt installment. The
proportion of debt that is getting bigger on the capital structure shows a big burden on the company to pay interest
and principal installments (Huda, 2013; Sulistyowati, Suhadak, & Husaini, 2014).
Profitability affects dividend policy because profitability is a firm's ability to make profit so that dividend will be
divided if the firm earns profit. The earnings after-tax are partially distributed as dividends to shareholders and
others held in the retained earnings. Dividends received by shareholder’s increase, the shareholder's prosperity will
increase. Therefore, the company's goal to prosper shareholders can be achieved. One of the firm's goals is to
prosper the owner of the company (shareholder) very closely related to the firm's ability to earn profit (Wati, 2015).
The dividend policy is a part of the firm's funding decisions. The dividend policy shows a decision about whether
the profits earned by the firm will be given dividends to shareholders or will be withheld to raise capital for future
investment financing. Dividends distributed to shareholders are highly dependent on the results of the agreement of
participants in the common meeting of shareholders. If the retained earnings mean that the profits are reinvested for
use in supporting the business activities of the company.
The company tries to seek an optimal dividend policy. Brigham and Houston (2016) state that the optimal dividend
policy shows a dividend policy which can create a balance between corporate growth and dividends. When
management decides how much profit to share with shareholders, they should always keep in mind that one of the
company's goals is to maximize shareholder wealth. Shareholder prosperity can be achieved if shareholders earn
dividends. Dividends paid depend on the policies of each firm. Thus they require a more serious consideration from
the firm management. The dividend policy is fundamentally used to determine how much profit is shared with the
shareholders as dividend, and which will be retained as retained earnings. However, dividend policies in some com-

Miswanto M. and Fajar A. P.
106
panies have not been able to support the achievement of corporate goals to maximize shareholder’s wealth
(Darminto, 2008). In consideration of making a dividend policy, study into the effect of capital structure and
profitability on dividends needs to be done. Study in several countries shows that the capital structure and
profitability influence dividend policy. In Indonesia, the results of study on the effect of capital structure and
profitability on dividend policy show different results. Some of the results of the study show that the capital structure
and profitability have an impact but some others have no impact on dividend policy. Based on the description of the
background of the problem above, the problems in this study can be formulated as follows: 1) Do the variables in
capital structure have an impact on the dividend policy on manufacturing firms listed on IDX? 2) Do the variables in
profitability have an impact on dividend policy on manufacturing firms listed on IDX?
Capital structure variable can be measured by Book Debt to Asset Ratio (DAR), Long-term Debt to Equity Ratio (LDER) and Book Debt to Equity Ratio (DER) and profitability variable can be measured by Return on Assets (ROA), Return on Equity (ROE) and Net Profit Margin (NPM) (Van Horne & Wachowicz, 2009). Based on the problems which have been formulated, this study aims to: 1) Know the impact of variables in capital structure: DAR, LDER and DER on dividend policy in manufacturing companies listed on IDX. 2) Know the impact of variables in profitability: ROA, ROE and NPM on dividend policy in manufacturing companies listed on IDX.
LITERATURE THEORY AND HYPOTHESES
Capital Structure The capital structure is a proportion or combination of debt, preferred stock, and equity common stock (Brigham & Houston, 2016; Ross, Westerfield, Jaffe, & Jordan, 2016). Measurement of capital structure can be done through the calculation of corporate leverage level, which illustrates how much debt-financed company assets. The optimal capital structure shows a capital structure that maximizes the price of equity common stock, and usually the debt ratio is lower than the ratio that maximizes the expected earnings per share (EPS) (Brigham & Houston, 2016).
Capital structure shows the determination of the composition of capital, the comparison between debt and capital itself. In other words, the capital structure is result of financing decisions which essentially decide whether they use debt or equity to fund the company's operations (Syamsuddin, 2009). Leverage is the use of external sources of funds by the firm and the consequence that the firm must bear the fixed burden of interest and debt repayments. The leverage ratios consist of:
DAR
(Syamsuddin, 2009)
LDER
(van Horne & Wachowicz, 2009)
DER
(Syamsuddin, 2009)
Profitability Profitability is the firm's ability to create a profit. Shareholders in the company want to rate returns, which consist of results and capital gains (Brigham & Houston, 2016). The higher the firm's ability to generate profits, the higher the rate of return for received shareholders, and the higher the value of the firm. It can also be said that profitability is the firm's ability to generate net income from business activities in the accounting period.
According to Van Horne and Wachowicz (2009) if there is an excess of funds derived from operating profit after being used to fund all investment opportunities, the surplus will be shared to shareholders as investors in cash dividends. Sutrisno (2017) states that the company sets a dividend payout ratio target based on its profit target. If the profit target is achieved and has stabilized, then the company will adjust the amount of dividend to be paid to reach the target set. Profitability ratio is the ratio to quantify the ability of the firm and seek earning. The ratio also quantifies of the effectiveness of a firm's management level. Profitability ratios consist of (Husnan & Pudjiastuti, 2018):
ROA
100%
ROE
100%
NPM
100%

Analysis the Impact of Capital Structure and Profitability, pp. 105–113
107
Dividend Policy
Dividend policy is something that cannot be separated from the company's funding decisions. The dividend policy
shows a decision on whether the profits earned by the firm will be shared to shareholders as dividends or to be
retained as retained earnings for future business development decisions (Sartono, 2016). Dividend policy is a
concern for 2 (two) important reasons: 1) Payment of dividends can affect the stock price, and 2) Retained earnings
are generally the main and most important source of additional capital for the company's growth.
These two reasons are two sides of the company's interests that must be taken seriously. By considering this,
company management must make careful decisions in making dividend policies to be chosen. The dividend policy
needs to be analyzed and decided more wisely, because if dividends are distributed to shareholders, this will reduce
the amount of internal funds that will be used to expand the firm's operations (Ross et al., 2016).
Signaling Theory
The company manager is obliged to give a signal about the condition of the company to shareholders. Giving these
signals is as a matter of responsibility to them. The signal theory explains that companies have incentives to provide
financial information to shareholders. The company's encouragement to give information is due to symmetrical
information between insiders and outsiders because the company knows more about the company and its future
conditions or prospects than outsiders (especially investors and creditors) (Weston & Copeland, 2010).
The announcement of dividends as a mean to send a real signal to external firms and markets about the work of the
firm in the present and future is an appropriate but expensive way. After receiving the signal through the
announcement of the dividend then the market will react to the announcement of the dividend change paid so that it
can be said the market captures information about the prospect of the company contained in the announcement. The
better the condition and performance of the company will produce a positive signal for investors and creditors (Ross
et al., 2016).
Theory Debt Covenant Hypothesis
Theory Debt Covenant Hypothesis argues that the level of the desired loan size of the firm is greater, the firm must
strive to show good performance to the debtholders. It is intended that debtholders believe the security of the funds
is guaranteed, and confident that the company can repay the loan with interest. Therefore, the company tends to be
not conservative when it seeks to raise large funds from debtholders (Ross et al., 2016).
Loans made by the company will greatly affect the profits owned by the company. Meanwhile, profit owned by the
company is very influential on dividends. Thus, loans or debts incurred by the firm will affect shareholder
dividends. The effect of leverage on dividends can also be explained by the thought of a debt covenant hypothesis
(Kalay, 1982) which discloses firms using high leverage will cause the company to reduce or not increase its
dividend payout.
Agency Theory
Jensen and Meckling (1976) state that the creditor is principal and the management of the firm is agent. The
principal gives decision-making authority to the agent. When a shareholder appoints managers or agents as mana-
gers and decision makers for the company, then the agency relationship emerges. The agency theory from Jensen
and Meckling (1976) refers to the fulfillment of the main objectives of financial management that is to maximize
shareholders’ wealth. The inability or unwillingness of management to increase shareholder wealth leads to so-
called agency problems.
According to Jensen and Meckling (1976), agency problems happen if people force to trigger conflict and selfish-
ness when some interests meet in a joint activity. Motivated principals enter into contracts to endow themselves with
ever-increasing profitability, while agents are motivated to maximize their economic and psychological needs.
Agency costs are costs related to supervision to ensure that management responds consistently in accordance with
company contractual agreements between creditors and companies that represent shareholders. Agency costs can
increase if the difference in interests between shareholders, managers and creditors increases as well. Increased
disclosure will reduce agency costs and information gaps (Marston, 2003).

Miswanto M. and Fajar A. P.
108
Agency problems between company managers as agent and shareholders can be avoided or minimized by dividend
policy (Jensen and Meckling, 1976). The more dividends a company wants to pay, the more likely it is to reduce the
retained earnings. Dividend payments also play a role in the monitoring mechanism because it makes managers
have to provide funds that may be obtained from outside the company which will certainly be able to reduce agency
costs.
The Impact of Capital Structure to Dividend Policy
Citing research from (Sulistyowati et al., 2014) and Al-Najjar (2011) constructed on agency theory (Jensen &
Meckling, 1976), DAR has a significant effect on the positive direction towards the DPR. When the DAR increases,
the DPR will increase, when the DAR decreases, the DPR will also decrease and based on the thought of covenant
hypothesis (Kalay, 1982) when DAR increases, the DPR decreases, DAR decreases then the DPR will increase.
The results of the study (Sulistyowati et al., 2014) that DAR negatively affect the DPR.
By using agency theory as stated by Jensen and Meckling (1976), Sulistyowati et al. (2014) show that LDER has a
significant effect on the positive direction towards the DPR. When the LDER increases, the DPR will increase,
when the LDER decreases, the House will also decrease and based on the thought of covenant hypothesis (Kalay,
1982) when LDER increases, the DPR decreases, LDER decreases then the House will increase. The consequence
of the study (Sulistyowati et al., 2014) that the LDER negatively impact on the DPR.
By using agency theory (Jensen & Meckling, 1976), Sulistyowati et al. (2014) also show that DER has significant
influence with positive direction toward DPR. When DER increases, the DPR will increase, when DER decreases
so the House will also decrease and based on the thought of covenant hypothesis (Kalay, 1982) when DER
increases, DPR decreases, DER decreases then DPR will increase. The consequence of the study (Sulistyowati et
al., 2014) that the DER has a positive impact on the DPR.
The Impact of Profitability to Dividend Policy
The signal theory presented by Miller and Mondigliani states that dividend increase gives a signal to investors that
firm has good income and good performance in the future. Based on the theory, it can be shown that high income
through assets owned as reflected by the value of return on assets has a positive impact on profit policy given to
shareholders as dividend. This is due to the increased ability of companies to get profits. Therefore, the value of the
company will certainly increase and provide a good signal to investors. The signal is that the firm is able to get
profits. The theory is in line with the study of Yudhanto and Aisjah (2013) about influence Return on Assets, Net
Profit Margin, Return on Equity, Earning per Share (EPS) on Dividend Policy and Wati (2015) about impact of
Debt to Equity Ratio, Return on Asset, Collateral Asset, and Asset Growth on Dividend Policy.
ROE as one of the profitability ratios is a very important indicator for investors to help investors in measuring and
knowing the company's ability in obtaining net profit related to dividend distribution. Dividend policy taken by the
company is certainly inseparable from the valuation of earning on equity. Earnings on equity are usually measured
by return on equity. Companies with high return equity have the ability to share high dividends. Therefore, a rise in
the company's return on equity is expected to attract investor interest. Based on the above explanation, it can be
indicated that ROE is in line with signaling theory proposed by Miller and Mondigliani, that the higher the profit,
the higher the welfare of shareholders through high distributed dividends. The theory is in line with research of
Yudhanto and Aisjah (2013).
NPM is a measure of the percentage of each sale value that results in a net profit or profit rate. Based on signaling
theory which states that the level of profits obtained by the company increases, it shows that the performance of
management in managing the company is increasing as well. Assessment of a firm's achievements can be seen from
the firm's capability to get profits. The high level of profitability becomes the determinant of corporate value.
Corporate value is very important because high corporate value will cause high shareholder wealth (Brigham &
Houston, 2016). The theory is in line with the study results of Yudhanto and Aisjah (2013).
Hypothesis Formulation
Based on several reviews and results of the study described above, this first study hypothesis can be written as
follows.
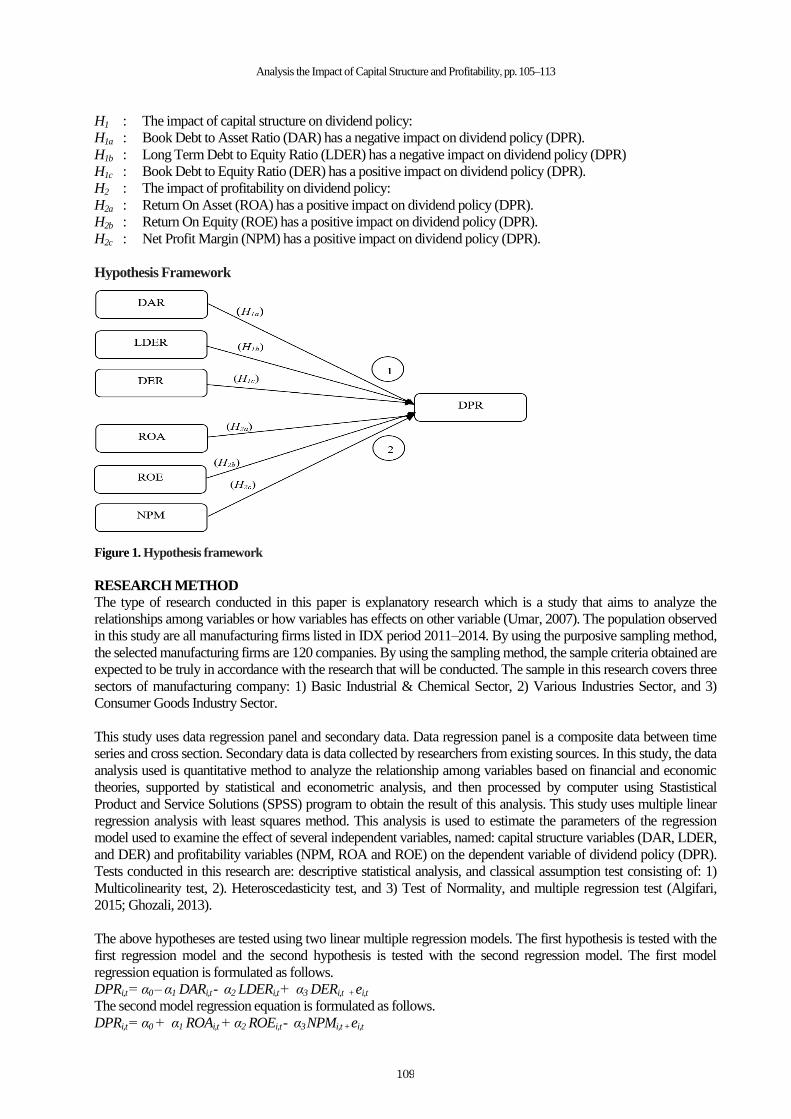
Analysis the Impact of Capital Structure and Profitability, pp. 105–113
109
H1 : The impact of capital structure on dividend policy:
H1a : Book Debt to Asset Ratio (DAR) has a negative impact on dividend policy (DPR).
H1b : Long Term Debt to Equity Ratio (LDER) has a negative impact on dividend policy (DPR)
H1c : Book Debt to Equity Ratio (DER) has a positive impact on dividend policy (DPR).
H2 : The impact of profitability on dividend policy:
H2a : Return On Asset (ROA) has a positive impact on dividend policy (DPR).
H2b : Return On Equity (ROE) has a positive impact on dividend policy (DPR).
H2c : Net Profit Margin (NPM) has a positive impact on dividend policy (DPR).
Hypothesis Framework
Figure 1. Hypothesis framework
RESEARCH METHOD
The type of research conducted in this paper is explanatory research which is a study that aims to analyze the
relationships among variables or how variables has effects on other variable (Umar, 2007). The population observed
in this study are all manufacturing firms listed in IDX period 2011–2014. By using the purposive sampling method,
the selected manufacturing firms are 120 companies. By using the sampling method, the sample criteria obtained are
expected to be truly in accordance with the research that will be conducted. The sample in this research covers three
sectors of manufacturing company: 1) Basic Industrial & Chemical Sector, 2) Various Industries Sector, and 3)
Consumer Goods Industry Sector.
This study uses data regression panel and secondary data. Data regression panel is a composite data between time
series and cross section. Secondary data is data collected by researchers from existing sources. In this study, the data
analysis used is quantitative method to analyze the relationship among variables based on financial and economic
theories, supported by statistical and econometric analysis, and then processed by computer using Stastistical
Product and Service Solutions (SPSS) program to obtain the result of this analysis. This study uses multiple linear
regression analysis with least squares method. This analysis is used to estimate the parameters of the regression
model used to examine the effect of several independent variables, named: capital structure variables (DAR, LDER,
and DER) and profitability variables (NPM, ROA and ROE) on the dependent variable of dividend policy (DPR).
Tests conducted in this research are: descriptive statistical analysis, and classical assumption test consisting of: 1)
Multicolinearity test, 2). Heteroscedasticity test, and 3) Test of Normality, and multiple regression test (Algifari,
2015; Ghozali, 2013).
The above hypotheses are tested using two linear multiple regression models. The first hypothesis is tested with the
first regression model and the second hypothesis is tested with the second regression model. The first model
regression equation is formulated as follows.
DPRi,t = α0 – α1 DARi,t - α2 LDERi,t + α3 DERi,t + ei,t
The second model regression equation is formulated as follows.
DPRi,t = α0 + α1 ROAi,t + α2 ROEi,t - α3 NPMi,t + ei,t

Miswanto M. and Fajar A. P.
110
FINDINGS
Descriptive Statistics Analysis
Result of descriptive statistics analysis of model I as follows. N shows the amount of data observed. The amount of
data observed in DAR, LDER, DER and DPR is 455, 449, 455 and 440. DAR has minimum value 0.008;
maximum value 1.162; average value (mean) 0.460; and standard deviation (Std. Dev.) of 0.204. LDER has a
minimum value of 0.002; maximum value 5.037; average value (mean) 0.357; and a standard deviation of 0.592.
DER has a minimum value of 0.009; maximum value 11,254; average value (mean) 1,231; and the standard
deviation (Std. Dev.) of 1.389. DPR has a minimum value of 0.001; maximum value 2,194; average value (mean)
0.380; and standard deviation (Std. Dev.) of 0.323. The descriptive statistics data in model I can also be shown in
Table 1. The descriptive data in model II can also be shown in the Table 2.
Table 1
Summary of Descriptive Statistics in Model I
Variable N Minimum Maximum Mean Std. Dev.
DAR
LDER
DER
DPR
455
449
455
440
0.008
0.002
0.009
0.001
1.162
5.037
11.254
2.194
0.460
0.357
1.231
0.380
0.204
0.592
1.389
0.323
Notes: N = the amount of data observed, DAR = Book Debt to Asset Ratio, LDER = Long Term Debt to Equity Ratio, DER=
Book Debt to Equity Ratio, DPR= Dividend Payout Ratio and Std. Dev. = standard deviation.
The results of statistical analysis of descriptive model II as follows: ROA has a minimum value of -0.083;
maximum value of 0.456; average value (mean) 0.070; and a standard deviation of 0.087. ROE has a minimum
value of -0.174; maximum value 1,238; average value (mean) 0.112; and a standard deviation of 0.160. NPM has a
minimum value of -0.623; maximum value 31,871; average value (mean) 0.323; and standard deviation 2,930. DPR
has a minimum value of 0.024; maximum value 1.830; average value (mean) 0.368; and a standard deviation of
0.298. Table 2 shows Summary of Descriptive Statistics in Model II
Table 2
Summary of Descriptive Statistics in Model II
Variable N Minimum Maximum Mean Std. Dev.
ROA
ROE
NPM
DPR
118
120
118
110
-0.083
-0.174
-0.623
0.024
0.456
1.238
3.871
1.830
0.070
0.112
0.323
0.368
0.087
0.160
2.930
0.298
Notes: N = the amount of data observed, ROA = Return on Assets, ROE = Return on Equity, NPM = Net Profit Margin, DPR =
Dividend Payout Ratio and Std. Dev. = standard deviation.
The result of multicolinearity test of model I and II shows that there is no multicolinearity among independent
variables in the multiple regression model. The result of heteroscedasity test of model I and II using glesjer test
shows that the level of significance of the independent variables is all greater than 0.05. By using of these results, it
can be stated that there is no variance inequality so there is no problem of heteroscedasticity in regression model.
Based on Central Limit Theorem (Cooper & Emory, 1995) that the sampling distribution curve for sample size 30
or more has a normal distribution.
Summary of regression coefficients, t test, R adjusted test, and F test are stated in Table 3. Using Table 3, Model I
can be made the following regression equation: DPRi,t = 0.580 – 0.778 DARi,t – 0.148 LDERi,t + 0.183 DERi,t + ei,t.
The equation can be interpreted and explained as follows:
a) The constant of a positive value of 0.580 suggests that the DPR tends to increase by assuming DAR, LDER and
DER remain.
b) The negative DAR regression coefficient states that the decrease of DAR by one unit will increase the DPR by
0.778 with the judgement that the other independent variables do not change.
c) The negative value LDER regression coefficient states that the decrease of LDER by one unit increases the DPR
by 0.148 with the judgement that the other independent variables do not change.
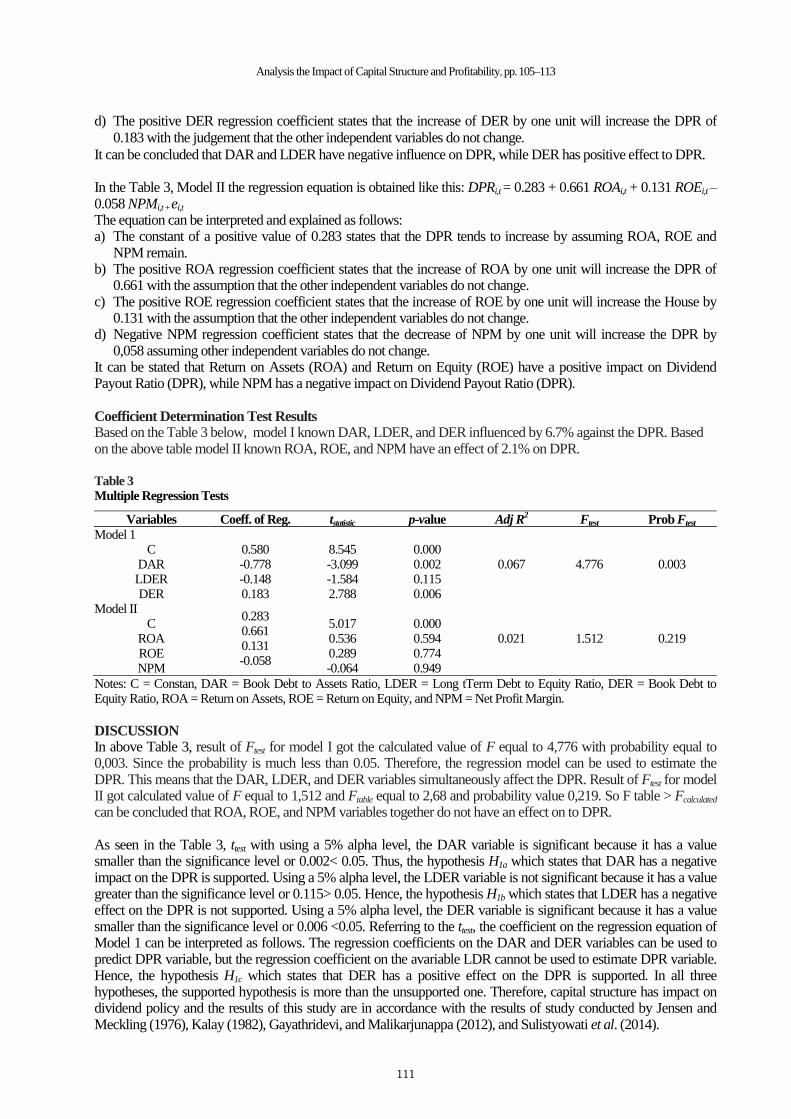
Analysis the Impact of Capital Structure and Profitability, pp. 105–113
111
d) The positive DER regression coefficient states that the increase of DER by one unit will increase the DPR of
0.183 with the judgement that the other independent variables do not change.
It can be concluded that DAR and LDER have negative influence on DPR, while DER has positive effect to DPR. In the Table 3, Model II the regression equation is obtained like this: DPRi,t = 0.283 + 0.661 ROAi,t + 0.131 ROEi,t – 0.058 NPMi,t + ei,t The equation can be interpreted and explained as follows: a) The constant of a positive value of 0.283 states that the DPR tends to increase by assuming ROA, ROE and
NPM remain. b) The positive ROA regression coefficient states that the increase of ROA by one unit will increase the DPR of
0.661 with the assumption that the other independent variables do not change. c) The positive ROE regression coefficient states that the increase of ROE by one unit will increase the House by
0.131 with the assumption that the other independent variables do not change. d) Negative NPM regression coefficient states that the decrease of NPM by one unit will increase the DPR by
0,058 assuming other independent variables do not change. It can be stated that Return on Assets (ROA) and Return on Equity (ROE) have a positive impact on Dividend Payout Ratio (DPR), while NPM has a negative impact on Dividend Payout Ratio (DPR).
Coefficient Determination Test Results Based on the Table 3 below, model I known DAR, LDER, and DER influenced by 6.7% against the DPR. Based on the above table model II known ROA, ROE, and NPM have an effect of 2.1% on DPR. Table 3
Multiple Regression Tests
Variables Coeff. of Reg. tstatistic p-value Adj R2
Ftest Prob Ftest
Model 1 C
DAR LDER DER
0.580 -0.778 -0.148 0.183
8.545 -3.099 -1.584 2.788
0.000 0.002 0.115 0.006
0.067 4.776 0.003
Model II C
ROA ROE NPM
0.283 0.661 0.131 -0.058
5.017 0.536 0.289 -0.064
0.000 0.594 0.774 0.949
0.021 1.512 0.219
Notes: C = Constan, DAR = Book Debt to Assets Ratio, LDER = Long tTerm Debt to Equity Ratio, DER = Book Debt to Equity Ratio, ROA = Return on Assets, ROE = Return on Equity, and NPM = Net Profit Margin.
DISCUSSION In above Table 3, result of Ftest for model I got the calculated value of F equal to 4,776 with probability equal to 0,003. Since the probability is much less than 0.05. Therefore, the regression model can be used to estimate the DPR. This means that the DAR, LDER, and DER variables simultaneously affect the DPR. Result of Ftest for model II got calculated value of F equal to 1,512 and Ftable equal to 2,68 and probability value 0,219. So F table > Fcalculated can be concluded that ROA, ROE, and NPM variables together do not have an effect on to DPR. As seen in the Table 3, ttest with using a 5% alpha level, the DAR variable is significant because it has a value smaller than the significance level or 0.002< 0.05. Thus, the hypothesis H1a which states that DAR has a negative impact on the DPR is supported. Using a 5% alpha level, the LDER variable is not significant because it has a value greater than the significance level or 0.115> 0.05. Hence, the hypothesis H1b which states that LDER has a negative effect on the DPR is not supported. Using a 5% alpha level, the DER variable is significant because it has a value smaller than the significance level or 0.006 <0.05. Referring to the ttest, the coefficient on the regression equation of Model 1 can be interpreted as follows. The regression coefficients on the DAR and DER variables can be used to predict DPR variable, but the regression coefficient on the avariable LDR cannot be used to estimate DPR variable. Hence, the hypothesis H1c which states that DER has a positive effect on the DPR is supported. In all three hypotheses, the supported hypothesis is more than the unsupported one. Therefore, capital structure has impact on dividend policy and the results of this study are in accordance with the results of study conducted by Jensen and Meckling (1976), Kalay (1982), Gayathridevi, and Malikarjunappa (2012), and Sulistyowati et al. (2014).
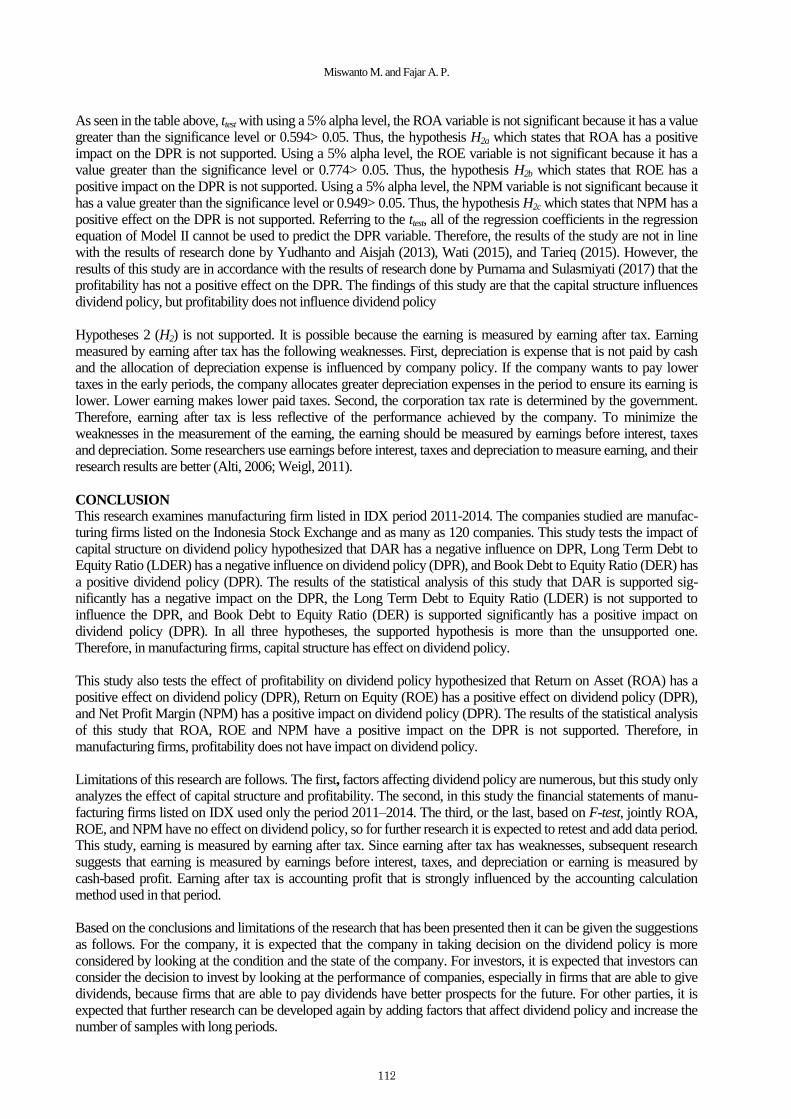
Miswanto M. and Fajar A. P.
112
As seen in the table above, ttest with using a 5% alpha level, the ROA variable is not significant because it has a value greater than the significance level or 0.594> 0.05. Thus, the hypothesis H2a which states that ROA has a positive impact on the DPR is not supported. Using a 5% alpha level, the ROE variable is not significant because it has a value greater than the significance level or 0.774> 0.05. Thus, the hypothesis H2b which states that ROE has a positive impact on the DPR is not supported. Using a 5% alpha level, the NPM variable is not significant because it has a value greater than the significance level or 0.949> 0.05. Thus, the hypothesis H2c which states that NPM has a positive effect on the DPR is not supported. Referring to the ttest, all of the regression coefficients in the regression equation of Model II cannot be used to predict the DPR variable. Therefore, the results of the study are not in line with the results of research done by Yudhanto and Aisjah (2013), Wati (2015), and Tarieq (2015). However, the results of this study are in accordance with the results of research done by Purnama and Sulasmiyati (2017) that the profitability has not a positive effect on the DPR. The findings of this study are that the capital structure influences dividend policy, but profitability does not influence dividend policy Hypotheses 2 (H2) is not supported. It is possible because the earning is measured by earning after tax. Earning measured by earning after tax has the following weaknesses. First, depreciation is expense that is not paid by cash and the allocation of depreciation expense is influenced by company policy. If the company wants to pay lower taxes in the early periods, the company allocates greater depreciation expenses in the period to ensure its earning is lower. Lower earning makes lower paid taxes. Second, the corporation tax rate is determined by the government. Therefore, earning after tax is less reflective of the performance achieved by the company. To minimize the weaknesses in the measurement of the earning, the earning should be measured by earnings before interest, taxes and depreciation. Some researchers use earnings before interest, taxes and depreciation to measure earning, and their research results are better (Alti, 2006; Weigl, 2011).
CONCLUSION This research examines manufacturing firm listed in IDX period 2011-2014. The companies studied are manufac-turing firms listed on the Indonesia Stock Exchange and as many as 120 companies. This study tests the impact of capital structure on dividend policy hypothesized that DAR has a negative influence on DPR, Long Term Debt to Equity Ratio (LDER) has a negative influence on dividend policy (DPR), and Book Debt to Equity Ratio (DER) has a positive dividend policy (DPR). The results of the statistical analysis of this study that DAR is supported sig-nificantly has a negative impact on the DPR, the Long Term Debt to Equity Ratio (LDER) is not supported to influence the DPR, and Book Debt to Equity Ratio (DER) is supported significantly has a positive impact on dividend policy (DPR). In all three hypotheses, the supported hypothesis is more than the unsupported one. Therefore, in manufacturing firms, capital structure has effect on dividend policy. This study also tests the effect of profitability on dividend policy hypothesized that Return on Asset (ROA) has a positive effect on dividend policy (DPR), Return on Equity (ROE) has a positive effect on dividend policy (DPR), and Net Profit Margin (NPM) has a positive impact on dividend policy (DPR). The results of the statistical analysis of this study that ROA, ROE and NPM have a positive impact on the DPR is not supported. Therefore, in manufacturing firms, profitability does not have impact on dividend policy. Limitations of this research are follows. The first, factors affecting dividend policy are numerous, but this study only analyzes the effect of capital structure and profitability. The second, in this study the financial statements of manu-facturing firms listed on IDX used only the period 2011–2014. The third, or the last, based on F-test, jointly ROA, ROE, and NPM have no effect on dividend policy, so for further research it is expected to retest and add data period. This study, earning is measured by earning after tax. Since earning after tax has weaknesses, subsequent research suggests that earning is measured by earnings before interest, taxes, and depreciation or earning is measured by cash-based profit. Earning after tax is accounting profit that is strongly influenced by the accounting calculation method used in that period. Based on the conclusions and limitations of the research that has been presented then it can be given the suggestions as follows. For the company, it is expected that the company in taking decision on the dividend policy is more considered by looking at the condition and the state of the company. For investors, it is expected that investors can consider the decision to invest by looking at the performance of companies, especially in firms that are able to give dividends, because firms that are able to pay dividends have better prospects for the future. For other parties, it is expected that further research can be developed again by adding factors that affect dividend policy and increase the number of samples with long periods.
Analysis the Impact of Capital Structure and Profitability, pp. 105–113
113
ACKNOWLEDGEMENT This study work is supported by the competitive research scheme supported by Ministry of Research, Technology
and Higher Education of Indonesian Republic.
REFERENCES
Al-Najjar, B. (2011). Inter-relationshop between capital structure and dividend policy: Empirical from Jordanian
data. International Review of Applied Economics, 25(2), 209–224.
Alti, A. (2006). How persistent is the impact of market timing on capital structure? The Journal of Finance, LXI(4),
1681–1710.
Algifari. (2015). Analisis regresi: Teori, kasus dan solusi. 3th Edition. Yogyakarta: BPFE UGM.
Brigham, E. F., & Houston, J. F. (2016). Fundamental of financial management. 14th Edition. Boston, MA:
Cancage Learning.
Darminto. (2008). Pengaruh profitabilitas, likuiditas, struktur modal dan struktur kepemilikan saham terhadap
kebijakan dividen. Jurnal Ilmu-Ilmu Sosial, 20(2), 87–97.
Cooper, D. R., & Emory, W. (1995). Business research method. 5th Edition. Chicago, IL: Irwin Inc.
Gayathridevi, A., & Malikarjunappa, T. (2012). Dividend policy of Indian textile companies - An empirical study.
The Journal Contemporary Management Research, 6(2), 14–22.
Ghozali, I. (2013). Aplikasi Analisis Multivariate dengan Program SPSS. Edisi Ketujuh. Semarang: BP UNDIP.
Huda, M. (2013). Analisis pengaruh struktur modal tehadap kebijakan dividen pada perusahaan manufaktur yang
terdaftar di Bursa Efek Indonesia (BEI). Skripsi. Program Sl Jurusan Manajemen Keuangan Fakultas
Ekonomi dan Ilmu Sosial Universitas Islam Negeri Sultan Syarif Kasim Riau Pekanbaru.
Husnan, S., & Pudjiastuti, E. (2018). Dasar-dasar manajemen keuangan. 7th Edition. Yogyakarta: UPP AMP
YKPN.
Jensen, M. C., & Meckling, W. H. (1976). Theory of the firm: Managerial, behavior, agency, and ownership
structure. Journal of Financial Economic, 3(4), 305–360.
Kalay, A. (1982). Stockholder-bondholder conflict and dividend constraint. Journal of Financial Economics, 10(2),
211–233.
Purnama, A. R. N., & Sulasmiyati, S. (2017). Analisis pengaruh profitabilitas, likuiditas terhadap kebijakan dividen
kas. Jurnal Administrasi Bisnis (JAB), 51(2), 201–206.
Ross, S. A., Westerfield, R. W., Jaffe, J., & Jordan, B. D. (2016). Corporate finance. 11th Edition. New York, NY:
McGraw-Hill International Edition.
Sartono, A. (2016). Manajemen keuangan: Teori dan aplikasi. 4th Edition. Yogyakarta: BPFE UGM.
Sulistyowati, A., Suhadak, & Husaini, A. (2014). Pengaruh struktur modal terhadap kebijakan dividen (Studi pada
perusahaan yang terdaftar di Bursa Efek Indonesia periode tahun 2010–2012). Jurnal Administrasi Bisnis,
8(2), 1–10.
Sutrisno. (2017). Manajemen keuangan: Teori, konsep dan aplikasi. Revised Edition. Yogyakarta: Ekonisia.
Syamsuddin, L. (2009). Manajemen keuangan perusahaan: Konsep aplikasi dalam perencanaan, pengawasan,
pengambilan keputusan. Jakarta: Rajawali Pers.
Tarieq, A. (2015). The joint-determinants of leverage and dividen plocy: A balanced panel study of non financial
firms of India and Pakistan, 11(10), 1857–7811.
Umar, H. (2007). Metodologi penelitian untuk skripsi dan tesis. Jakarta: PT Grafindo Persada.
van Horne, J. C., & Wachowicz, Jr., J. M. (2009). Fundamentals of financial management. 13th Edition. Essex,
England: Pearson Education Limited.
Wati, T. A. P. (2015). Pengaruh return on asset, debt to equity ratio, collateral asset, dan pertumbuhan aset
terhadap kebijakan dividen (Studi pada perusahaan manufaktur yang terdaftar di Bursa Efek Indonesia periode
2011–2013). Skripsi. Program Studi Manajemen Jurusan Manajemen Fakultas Ekonomi Universitas Negeri
Yogyakarta.
Weigl, J. (2011). Market-timing of capital structure and factors influencing the leverage decision of firms.
Inaugural-Dissertation. Fakultät für Wirtschaftswissenschaften an der Technischen Universität Chemnitz.
Weston, J. F., & Copeland, T. E. (2010). Manajemen keuangan. Jilid 2. Jakarta: Bina Rupa Aksara.
Wilkinson, J. (2013). Supplier power (one of the Porter’s five forces). https://strategiccfo.com/ supplier-power-one-
of-porters-five-forces/.
Yudhanto, S., & Aisjah, S. (2013). Pengaruh net profit margin, return on asset, return on equity, earning per share
terhadap kebijakan dividen. Jurnal Ilmiah Mahasiswa FEB Universitas Brawijaya, 1(2).

114
3rd International Conference on Management & Entrepreneurship (3rd i-CoME) ISBN 978-602-5446-15-3
Phuket, 25th – 27th July 2019
FINANCING OF WORKING CAPITAL REQUIREMENTS AND
PROFITABILITY OF THE INDONESIAN COMPANIES IN BASIC
INDUSTRY AND CHEMICALS SECTOR
Lukas Purwoto
Department of Management, Universitas Sanata Dharma, Indonesia
Email: [email protected]
ABSTRACT Taking short-term financing decisions is a task that must be carried out effectively by the company manager. However, research
in Indonesia still rarely has topics related to financing of working capital requirements. This study examines the effect of working
capital financing on the profitability of Indonesian companies in the latest data in the basic industry and chemicals sector. The
results show the inverse U-shape relationship between short-term financial debt used to fund working capital requirements and
the profitability of the firm. Analysis is carried out by applying panel data testing procedures. Findings can be considered so that
managers should not only pay attention to the investment side, but also in working capital funding.
Keywords: Working capital financing, profitability.
INTRODUCTION
The company's working capital refers to a net investment in short-term assets. These short-term assets are conti-
nuously moving into and out of the company and are important for daily activities (Atrill, 2014). The need for
working capital certainly needs to get short-term financing from the company. Related to this, Miswanto (2012) has
discussed policies for financing corporate working capital. He explained that in the relationship between short-term
versus long-term funding, it was concluded that different policies would have different risks and benefits.
In recent years, working capital management obtains increasing concern from companies and also other parties
related to the capital market, especially in funding activities for working capital needs. In CNN Indonesia’s online
business news (2017), Otoritas Jasa Keuangan (OJK) revealed that during the period January-March 2017, as many
as 23 listed companies received funds in the capital market as much as Rp33.2 trillion, which increased by 40.1
percent compared to the same period in 2016. On this CNN news, OJK explained that different from the previous
year, in 2017 it was planned that 24 percent of the funds would be used for business expansion and 69 percent for
working capital.
Meanwhile, the knowledge of the author until the present time, research in Indonesia still has not yet examined the
topic of working capital financing in relation to the financial performance of the company. This research fills the
gap. Not long ago, Mulyono, Djumahir, and Ratnawati (2018) and Rustandi, Supriatna, Nugraha, and Supiyadi
(2018) examined the impact of working capital management on the profitability in Indonesian companies. However,
the attention of those two studies is more about each component of working capital investment, which is not about
fund working capital needs. As Baños-Caballero, García-Teruel, and Martínez-Solano (2016), investment in
working capital requirements should not be the only thing that is important in a company's short-term decision, but
also on how these investments are funded should be considered.
The objective of this research is to investigate the effect of working capital financing on the profitability of Indo-
nesian public corporations in the basic industry and chemicals sector for the 2016–2018 period. In the meantime,
Filbeck and Krueger (2005) have shown that there are prominent differences in the practice of working capital
among different industries. Therefore, the focus of this research on a particular sector is in accordance with the
understanding that working capital is an industry-specific issue. Interestingly, the following two research correspond
to the topic of working capital funding convey the opposite results. Dinçergök (2018) found concave-shaped rela-
tions for a sample of companies from Borsa Istanbul in the chemical related sectors. On the contrary, Panda and
Nanda (2018) show convex relationships in the chemical sector of Indian firms.
LITERATURE REVIEW AND HYPOTHESIS In corporate financial management textbooks, working capital is often defined as short-term assets reduced by short-
term liabilities (Atrill, 2014). The main components in short-term assets are inventories, accounts receivable, and
cash in hand and at the bank. While important components of the short-term liabilities are accounts payable and

Financing of Working Capital Requirements and Profitability, pp. 114–121
115
bank loans. Darun, Roudaki, and Radford (2015) discuss the evolution of dynamic working capital management
research as a change in managerial focus in reflecting on how companies manage working capital. Following the
description of Darun et al. (2015), the current research period (1990–2000s) is showing two developing themes,
namely effectiveness in working capital management and understanding its practice. In this case, one important
concern of the effectiveness of working capital management is the profitability of the company.
A number of previous studies have examined the effect of working capital management on company profitability.
Many studies use the cash conversion cycle (CCC) as a popular measure of working capital management in relation
to the company profitability. Using Swedish data, Yazdanfar and Ohman (2014) provide empirical evidence that the
CCC has a significant effect on the company profitability. Singh and Kumar (2014) examined the findings of
previous studies of CCC's influence on the company profitability by applying a meta-analysis technique. They took
a set of 46 research papers and the results confirmed that the CCC was related to the profitability of the company.
Some studies use the net trade cycle (NTC) as a measure of working capital management in relation to the
profitability of the company. Shin and Soenen (1998) analyzed a sample of US public companies and their results
showed a negative effect of the net trade cycle on profitability. By using the data panel of manufacturing listed firms
in Pakistan, the results of the study of Raheman, Afza, Qayyum, and Bodla (2010) also shows that the net trade
cycle negatively affects company performance. Karadagli (2012) examined the effect of the net trade cycle on firm
performance in a sample of Turkish listed companies. However, the findings of the Karadagli’s study show that an
increase in the net trade cycle improves performance in terms of both the operating income and the stock market
return for SMEs.
A number of other studies are interested in each component of working capital management. Deloof (2003) took a
sample of large Belgian companies and showed a significant negative relationship between profitability and the
length of days for the period of accounts receivable, inventories, and trade payable. Mathuva (2010) examined the
effect of working capital management components on the profitability of Kenyan listed firms. This Mathuva’s study
found a significant negative relationship between collection period accounts and profitability, which means that the
short time the cash billing for consumers increases the profitability of the company. However, a significant positive
relationship was found in this Mathuva’s study between both the inventory conversion period and the period of
payment to creditors with profitability. Similar research, testing the item details from working capital management,
was also conducted by Kasozi (2017) on the listed manufacturing firms in South Africa and by Lyngstadaas and
Berg (2016) in the small-and medium-sized Norwegian firms.
Some other studies consider two approaches to both conservative and aggressive strategies of working capital
management. Nazir and Afta (2009) examined the potential relationship of aggressive / conservative policies and
the profitability of companies from Pakistani firms. However, a well-known research in this regard is Baños-
Caballero et al. (2012), Baños-Caballero, García-Teruel, and Martínez-Solano (2014) which began with showing
quadratic non-linear relations between working capital management and the company profitability. Similar results
from concave relations are also shown by Afrifa and Padachi (2016) in small and medium-sized companies listed on
the UK stock market and Altaf and Shah (2017) in Indian non-financial companies. These results imply the
existence of an optimal level of investment in working capital that balances benefits and costs so as to maximize
value.
In summary, the results of previous studies suggest that company managers can create value for their shareholders
by carrying out working capital management at the right level of investment. Furthermore, the attention of several
current studies also leads to funding working capital needs and their relation to the company profitability.
Using data from Spanish SMEs, Baños-Caballero, García-Teruel, and Martínez-Solano (2016) examined the rela-
tionship between financing of working capital requirements and firm performance. They showed that the right fun-
ding strategy for working capital requirements can help companies improve profitability. This finding encouraged
Dinçergök (2018) to also conduct similar research on open-air companies in Turkey. The results of his research
showed that there are concave-shaped relations between short-term financial debt that are used to fund working
capital needs and firm performance. However, Panda and Nanda (2018) found Convex's relationship between the
financing of working capital requirements and profitability in a number of Indian public sector companies.

Lukas P.
116
The need for working capital and project investment must be funded so that the company can run. The availability
of long-term and short-term sources of finance requires company managers to make choices between the two
sources. In this situation, company managers can choose aggressive funding policies or conservative funding poli-
cies (Berk & DeMarzo, 2014). When companies finance all permanent working capital using short-term debt, this
policy is known as an aggressive funding policy. When yield curves are upward sloping, the interest rate on short-
term debt is lower than long-term debt (Berk & DeMarzo, 2014). This encourages firm managers to prefer the use
of short-term debt.
However, the benefits of lower short-term interest rates will be masked by the risk that companies may face debt
refinancing at higher interest rates in the future, thereby enlarging the firm's equity cost of capital (Berk & DeMarzo,
2014). On the contrary, the company can fund the needs of permanent working capital and its fixed assets by using
long-term debt, or what is known as a conservative financing policy. In order to implement such a policy effectively,
there will necessarily be periods when excess cash is available—those periods when the company requires little or
no investment in temporary working capital (Berk & DeMarzo, 2014). In this policy, corporate loans become less
volatile in the short term.
Table 1 summarizes the arguments that mention in the study of Baños-Caballero et al. (2016), Dinçergök (2018),
and Panda and Nanda (2018) regarding the benefits and risks of using short-term debt in financing working capital
needs. Those benefits motivate managers to use short-term debt in order to fund working capital needs. However,
the potential risks that could arise would limit the use of short-term debt. Thus, benefits obtained by the company in
using short-term debt financing will be limited. In this case, it is expected that inverse U-shaped relations occur
between working capital financing and profitability (Dinçergök, 2018). If the ratio of short-term debt to the
company's working capital requirements is still low, increasing short-term debt will benefit and therefore increase
profitability. However, if the ratio is very high, the addition of short-term loans will increase the risk that increases
costs and ultimately reduces profitability. In other words, following Baños-Caballero et al. (2016), when the short-
term debt used to fund working capital requirements is low, the addition will increase profitability. However, when
the short-term debt used to fund working capital requirements is high, the addition will reduce profitability.
This study intends to examine the effect of working capital financing on profitability in the basic industry and
chemicals sector. The hypothesis is set:
H1: The relationship between short-term debt used to fund working capital requirements and the profitability in
Indonesian public companies from the basic industry and chemicals sector can be expressed in the form of an
inverted U.
Table 1
Use of Short-Term Debt in Financing of Working Capital Requirements
Advantages: Risks:
Short-term debt interest rates are smaller than long-term debt. Short-term debt faces the risk of increasing the interest
rate in its renewal.
Acquisition of credit benefits due to good relations with banks
that are interwoven from short-term bank loans.
Short-term debt has a problem of extension, especially for
companies that have high short-term debt.
Short-term debt is more easily adjusted to the company's
financial needs.
Short-term debt can reduce conflicts between shareholders and
long-term debt holders.
Source: Summarized from Baños-Caballero et al. (2016), Dinçergök (2018), Panda and Nanda (2018)
RESEARCH METHOD The Indonesia Stock Exchange divides all companies listed in various sectors based on their characteristics of the
business. As discussed in the introductory section, this study focuses on investigating non-financial companies from
basic industry and chemicals sector. A number of investigations have demonstrated that the nature of corporate
working capital is significantly different between industries, both in terms of statistical measures (Pais & Gama,
2015; Lyngstadaas & Berg, 2016) as well as their effect on profitability (Yazdanfar & Ohman, 2014; Afrifa &
Padachi, 2016). Therefore, this study has anticipated the possibility of problems that arise because of industry-
specific issues.

Financing of Working Capital Requirements and Profitability, pp. 114–121
117
The data used in this research comes from financial statements of publicly listed companies on the Indonesia Stock
Exchange. The company is required to have the availability of financial reports published in order to enter into the
research sample. The financial statements of the company under study are for a period of three years and on the
latest data that can be obtained, namely 2016–2018. In this way, this study uses panel data that contain data across
time and across companies.
With reference to the study of Baños-Caballero et al. (2016) and Dinçergök (2018), this research estimates the
following model to examine the association among working capital funding and company performance:
(1)
To test the effect of working capital financing on the company profitability, this research uses a measure of
accounting-based financial performance as the dependent variable. Following the study of Baños-Caballero et al.
(2016) and Dinçergök (2018), the dependent variable is return on equity (ROE). In this case, return on equity is a net
profit as a proportion of shareholders' equity. In other words, return on equity is computed by dividing profits after
taxes by common equity.
The independent variable is working capital financing (WCF). WCF variables are calculated as short-term loans
divided by working capital requirements (Baños-Caballero et al., 2016; Dinçergök, 2018; Panda & Nanda, 2018).
Technically, working capital requirements (WCR) is determined as current assets minus accounts payable, while
short-term loans are proxied using short-term bank loans. Then WCF2 is obtained by calculating the square of
working capital financing. Referring to the research hypothesis a concave relation between short-term funding and
financial performance, then β1 is expected to be positive and β2 is expected to be negative.
Six control variables are SIZE, LEV, AGE, FA, CR, and DIV. SIZE is measured as the natural logarithm of total
assets. LEV is calculated by dividing total liabilities by total assets. AGE states the company's long years of
establishment. FA is a fixed assets divided by total assets. CR is current assets divided by current liabilities. The
DIV is sought by dividing cash dividends by total assets. The selection of the five control variables refers to previous
studies that are commonly found in the effect of working capital on company profitability. All research variables are
presented in Table 2.
Table 2
Variable Description
Variable Name Definitions Calculation
ROE Return on Equity Net Income / Total Assets
WCF Working Capital Financing Short Term Bank Debt / (Current Assets – Account Payable)
SIZE Size Ln (Total Assets)
LEV Leverage Total Debt / Total Assets
AGE Age Calender Year – Incorporation Year
FA Fixed Assets Tangible Net Fixed Assets / Total Assets
CR Current Ratio Currents Assets / Current Liabilities
DIV Dividen Cash Dividend / Total Assets
Still referring to the study of Baños-Caballero et al. (2012) and Dinçergök (2018), the relationship between working
capital funding and company performance estimated in equation (1) is examined again for robustness by applying
the following model:
(2)
Two dummy variables were created in this study, namely WCFL for companies that have low WCF and WCFH for
companies that have high WCF. More specifically, if the WCF value of a company is below the WCF median
value, WCFL is 1; otherwise, WCFL takes the value of zero. Whereas if the WCF value of a company is above the
median WCF value, then WCFH is 1; otherwise, WCFH takes the value of zero. An inverse U-shape relation
between short-term funding and profitability is supported if β1 is positive and β2 is negative.

Lukas P.
118
Data analysis of this study was carried out using panel data analysis. The panel data in this research are characterized
by a wider range of cross-sectional data than between years. Panel data like this can be estimated by applying pooled
models. However, the application of pooled least squares in pooled models has limitations, especially in less realistic
assumptions about the existence of zero error correlations between times in the same company. Therefore, this was
solved by applying the cluster-robust standard errors when estimating the regression equation (Hill, Griffiths, &
Lim, 2011). Research data processing shows that the Breusch-Pagan test indicates a non-significant result rejecting
the null hypothesis. The insignificant results of the Breusch-Pagan test lead to conclusions about the absence of
random effects (Hill et al., 2011). Therefore, the equation in the panel data in this research is estimated using the
fixed effect model.
FINDINGS Table 3 shows descriptive statistics of research variables, which include profitability, working capital financing, and
other relevant variables. The first variable of concern is return on equity (ROE). During the analysis period, the
average ROE of companies in basic industry and chemicals sectors is 0.1021 or 10.21 percent. The second variable
is working capital financing (WCF). The average WCF is 0.4530. This means that on average short-term financial
debt funds as much as 45.30 percent of working capital needs. Some of the following variables are company size
(SIZE), leverage (LEV), company age (AGE), fixed assets (FA), current assets (CR), and cash dividends (DIV).
The mean value of SIZE is 22.81, LEV is 54.47 percent, AGE is 34.78 years, FA is 41.79 percent, CR is 2.21 times,
and DIV is 0.093 percent. In addition, the table also shows these variable values in standard deviation, 10th
percentile, median, and 90th
percentile.
Table 3
Descriptive Statistics
Variables Obs Mean Std. Dev. p10 p50 p90
ROE 189 0.1021 1.9704 -0.1263 0.0409 0.1825
WCF 189 0.4530 1.0567 0.0000 0.2198 0.8809
SIZE 189 22.8052 5.2978 15.1083 25.6195 28.4129
LEV 189 0.5447 0.3691 0.1595 0.5136 0.8406
AGE 189 34.7831 9.6602 22.0000 35.0000 45.0000
FA 190 0.4179 0.2202 0.1419 0.4432 0.6999
CR 189 2.2101 2.3331 0.8037 1.3085 4.8856
DIV 189 0.0093 0.0213 0.0000 0.0000 0.0278
Table 4 provides Pearson correlation between research variables. Overall, the correlation between all research
variables is less than 0.5. Furthermore, one test was conducted to make certain the absence of collinearity problems
in the analysis of this investigation. One way is to estimate the auxiliary regressions and then check the amount of R2
from each of the estimated auxiliary regressions (Hill et al., 2011). This procedure is done by regressing WCF,
SIZE, LEV, AGE, FA, CR, and DIV, which then search for each R2 for the seven equations. The value of R
2 for the
seven equations is 0.0878, 0.1309, 0.2822, 0.0911, 0.2546, 0.4032, and 0.0793. The R2 value found from the
artificial model is not high, so collinearity is concluded not to be a problem with this analysis.
Table 4
Pearson Correlation Matrix
Variables ROE WCF SIZE LEV AGE FA CR
ROE 1
WCF -0.0595 1
SIZE 0.0038 0.0828 1
LEV 0.0479 0.1211* 0.0081 1
AGE -0.0375 -0.0172 -0.2315*** -0.0512 1
FA -0.0976 0.0175 -0.2438*** -0.1026 0.1186 1
CR -0.0334 -0.2426*** 0.1674* -0.4170*** 0.0925 -0.3665* 1
DIV 0.0014 -0.1318* -0.0668 -0.2508*** 0.0769 0.0397 0.1279*
*p<0.10, **p<0.05, ***p<0.01
Table 5 provides the estimation results from equation (1). The dependent variable of this research is the company's
profitability as measured by ROE. The WCF coefficient is positive and statistically significant at the 10 percent
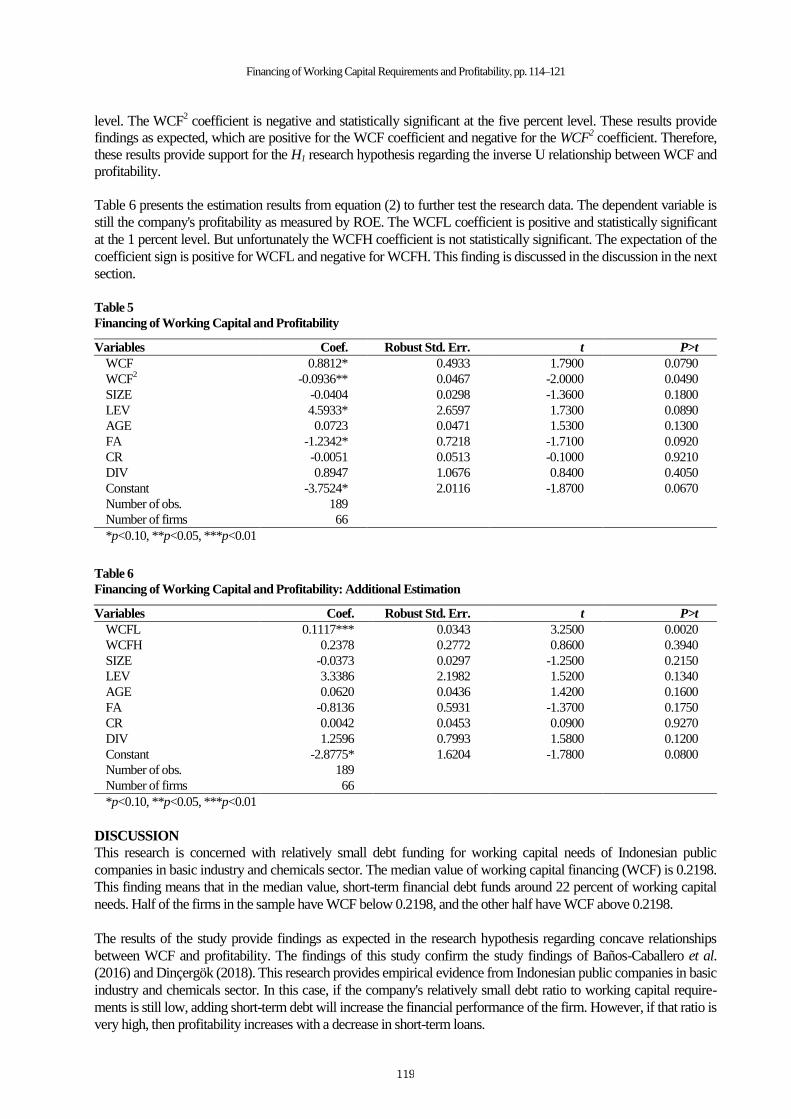
Financing of Working Capital Requirements and Profitability, pp. 114–121
119
level. The WCF2 coefficient is negative and statistically significant at the five percent level. These results provide
findings as expected, which are positive for the WCF coefficient and negative for the WCF2 coefficient. Therefore,
these results provide support for the H1 research hypothesis regarding the inverse U relationship between WCF and
profitability.
Table 6 presents the estimation results from equation (2) to further test the research data. The dependent variable is
still the company's profitability as measured by ROE. The WCFL coefficient is positive and statistically significant
at the 1 percent level. But unfortunately the WCFH coefficient is not statistically significant. The expectation of the
coefficient sign is positive for WCFL and negative for WCFH. This finding is discussed in the discussion in the next
section.
Table 5
Financing of Working Capital and Profitability
Variables Coef. Robust Std. Err. t P>t
WCF 0.8812* 0.4933 1.7900 0.0790
WCF2 -0.0936** 0.0467 -2.0000 0.0490
SIZE -0.0404 0.0298 -1.3600 0.1800
LEV 4.5933* 2.6597 1.7300 0.0890
AGE 0.0723 0.0471 1.5300 0.1300
FA -1.2342* 0.7218 -1.7100 0.0920
CR -0.0051 0.0513 -0.1000 0.9210
DIV 0.8947 1.0676 0.8400 0.4050
Constant -3.7524* 2.0116 -1.8700 0.0670
Number of obs. 189
Number of firms 66
*p<0.10, **p<0.05, ***p<0.01
Table 6
Financing of Working Capital and Profitability: Additional Estimation
Variables Coef. Robust Std. Err. t P>t
WCFL 0.1117*** 0.0343 3.2500 0.0020
WCFH 0.2378 0.2772 0.8600 0.3940
SIZE -0.0373 0.0297 -1.2500 0.2150
LEV 3.3386 2.1982 1.5200 0.1340
AGE 0.0620 0.0436 1.4200 0.1600
FA -0.8136 0.5931 -1.3700 0.1750
CR 0.0042 0.0453 0.0900 0.9270
DIV 1.2596 0.7993 1.5800 0.1200
Constant -2.8775* 1.6204 -1.7800 0.0800
Number of obs. 189
Number of firms 66
*p<0.10, **p<0.05, ***p<0.01
DISCUSSION
This research is concerned with relatively small debt funding for working capital needs of Indonesian public
companies in basic industry and chemicals sector. The median value of working capital financing (WCF) is 0.2198.
This finding means that in the median value, short-term financial debt funds around 22 percent of working capital
needs. Half of the firms in the sample have WCF below 0.2198, and the other half have WCF above 0.2198.
The results of the study provide findings as expected in the research hypothesis regarding concave relationships
between WCF and profitability. The findings of this study confirm the study findings of Baños-Caballero et al.
(2016) and Dinçergök (2018). This research provides empirical evidence from Indonesian public companies in basic
industry and chemicals sector. In this case, if the company's relatively small debt ratio to working capital require-
ments is still low, adding short-term debt will increase the financial performance of the firm. However, if that ratio is
very high, then profitability increases with a decrease in short-term loans.
Lukas P.
120
However, the results of the robustness test of this study further confirm the relationship that occurred at the time the
company WCF was lower than high. In this situation, if the ratio of relatively short debt to the company's working
capital requirements is still low (below the median), then adding short-term debt will enjoy the benefits and there-
fore increase profitability. In other words, when the relatively short debt used to fund the working capital
requirements is low, the addition will increase profitability.
CONCLUSION This research aims to examine the influence of working capital financing on the profitability of Indonesian public
companies in the basic industry and chemical sector for the period of 2016–2018. The results of this research show
that the relationship between working capital funding and profitability can be expressed in an inverted U shape.
Here opportunities for improvement arise, especially for companies that still have a relatively short amount of funds
for working capital needs. In these companies, performance can be sought to increase by appending the proportion
of short-term funding. Therefore, this research presents practical recommendations so that company managers
increase the proportion of relatively short debt funding when the proportion is still low.
This research has disadvantages. First, this research is not able to convey how much the optimal level of relatively
short funding for working capital needs. This can be interesting in terms of short-term funding practices that provide
policy guidance for managers of Indonesian companies. Therefore, future research is good if it can arrive at the
calculation of the optimal level. The second weakness is this research is still limited to the basic industry and
chemicals sector. For this reason, one option for future research is to explore samples of companies from other
sectors. This will add a complete insight into understanding.
REFERENCES Afrifa, G. A., & Padachi, K. (2016). Working capital level influence on SME profitability. Journal of Small
Business and Enterprise Development, 23(1), 44–63.
Altaf, N., & Shah, F. A. (2018). How does working capital management affect the profitability of India companies?
Journal of Advances in Management Research, 15(3), 347–366.
Atrill, P. (2014). Financial management for decision makers. 7th Edition. New York, NY: Pearson Education
Limited.
Baños-Caballero, S., García-Teruel, P.J., & Martínez-Solano, P. (2012). How does working capital management
affect the profitability of Spanish SMEs? Small Business Economics, 39(2), 517–529.
---------- (2014). Working capital management, corporate performance, and financial constraints. Journal of
Business Research, 67, 332–338.
---------- (2016). Financing of working capital requirement, lexibility and SME performance. Journal of Business
Economics and Management, 17(6), 1189–1204.
Berk, J., & DeMarzo, P. (2014). Corporate finance. 3rd Edition. Upper Saddle River, New Jersey: Pearson
Education, Inc.
CNN Indonesia Online Business News. (2017). OJK: 69 persen dana dari lantai bursa untuk modal kerja.
CNNindonesia.com Retrieved January 24, 2019, from https://www.cnnindonesia.com/ekonomi/20170412
184625-92-207110/ojk-69-persen-dana-dari-lantai-bursa-untukmodal-kerj a.
Darun, M. R., Roudaki, J., & Radford, J. (2015). The evolution of working capital management research.
International Business Management, 9(5), 987–997.
Deloof, M. (2003). Does working capital management affect profitability of Belgian firms? Journal of Business
Finance & Accounting, 30(3/4), 573–587.
Dinçergök, B. (2018). Financing of working capital requirement and profitability: Evidence from Borsa Istanbul
chemical, petroleum, rubber, and plastic sector. In G. Kucukkocaoglu, & S. Gokten, Financial management
from an emerging market perspective (pp. 175–187). http://dx.doi.org/ 10.5772/intechopen.72760.
Filbeck, G., & Krueger, T. M. (2005). An analysis of working capital management results across industries. Mid
American Journal of Business, 20(2), 12–18.
Hill, R. C., Griffiths, W. E., & Lim, G. C. (2011). Principles of econometrics. 4th Edition. New Jersey, NJ: John
Wiley & Sons, Inc.
Karadagli, E. C. (2012). The effect of working capital management on the profitability of Turkish SMEs. British
Journal of Economics, Finance and Management Sciences, 5(2), 36–44.
Kasozi, J. (2017). The effect of working capital management on profitability: A case of listed manufacturing firms
in South Africa. Investment Management and Financial Innovations, 14(2), 336–346.

Financing of Working Capital Requirements and Profitability, pp. 114–121
121
Lyngstadaas, H., & Berg, T. (2016). Working capital management: Evidence from Norway. International Journal
of Managerial Finance, 12(3), 295–313.
Mathuva, D. M. (2010). The influence of working capital management components on corporate profitability: A
survey on Kenyan listed firms. Research Journal of Business Management, 4(1), 1–11.
Miswanto (2012). Kebijakan dalam penentuan dan pendanaan modal kerja perusahaan. Jurnal Economia, 8(2),
181–195.
Mulyono, S., Djumahir, D., & Ratnawati, K. (2018). The effect of capital working management on the profitability.
Jurnal Keuangan dan Perbankan, 22(1), 94–102.
Nazir, M. S., & Afza, T. (2009). Impact of aggressive working capital management policy on firms’ profitability.
The IUP Journal of Applied Finance, 15(8), 19–30.
Pais M. A., & Gama, P. M. (2015). Working capital management and SMEs profitability: Portuguese evidence.
International Journal of Managerial Finance, 11(3), 341–358.
Panda, A. K., & Nanda, S. (2018). Working capital financing and corporate profitability of Indian manufacturing
firms. Management Decision, 56(2), 441–457.
Raheman, A., Afza, T., Qayyum, A., & Bodla, M. A. (2010). Working capital management and corporate
performance of manufacturing sector in Pakistan. International Research Journal of Finance and Economics,
47, 156–163.
Rustandi, F., Supriatna, N., Nugraha, & Supiyadi, D. (2018). Pengaruh manajemen modal kerja terhadap
profitabilitas pada bank konvensional periode 2013–2017. Jurnal Ilmu Manajemen & Bisnis, 9(2), 44–55.
Shin, H. H., & Soenen, L. (1998). Efficiency of working capital and corporate profitability. Financial Practice and
Education, 8(2), 37–45.
Singh, H. P., & Kumar, S. (2014). Working capital management: A literature review and research agenda.
Qualitative Research in Financial Markets, 6(2), 173–197.
Yazdanfar, D., & Ohman, P. (2014). The impact of cash conversion cycle of firm profitability: An empirical study
based on Swedish data. International Journal of Managerial Finance, 10(4), 442–452.

122
3rd International Conference on Management & Entrepreneurship (3rd i-CoME) ISBN 978-602-5446-15-3
Phuket, 25th – 27th July 2019
RETAIL COMPANY PERFORMANCE IN INDONESIA BASED ON
FINANCIAL RATIO ANALYSIS: WARREN BUFFETT’S PERSPECTIVE
Ima Kristina Yulita
1, Caecilia Wahyu Estining Rahayu
2
1,2 Management Department, Faculty of Economy, Sanata Dharma University, Jogjakarta, Indonesia
Email: [email protected]/[email protected]; [email protected]
2
ABSTRACT This research aim at determining the performance of retail companies in the Indonesia based on the analysis of financial ratios
using Warren Buffett’s perspective. Total number of sample is 10 companies listed in Indonesia Stock Exchange in 2014-2017.
The analysis of financial ratio includes Earning Per Share (EPS), Price to Earnings Ratio (PER), Price to Book Value (PBV),
Return on Equity (ROE), Current Ratio (CR), Debt to Equity Ratio (DER) and RoCE (Return on Capital Employee). First, this
research examined the effect of those seven financial ratios on stock prices either partially. Afterwards, only financial ratio that
had a significant effect on stock prices are analyzed using Warren Buffett. Hypothesis testing was conducted using Multiple
Linier Regression analysis. The results point out that: 1) EPS, PBV, ROE, and DER partially effect to stock prices; 2) ACES
meets 4 of 4 determined criteria for good company according to Warren Buffett. The criteria are the company has EPS growth
for 4 consecutive years, has ability to pay off debt, and has consistent ROE> = 15%.
Keywords: Retail companies, financial ratios, financial performance, stock price, Warren Buffet.
INTRODUCTION
According to Berman, Evans, and Chatterjee (2018) retail business is a business activity that sells goods and
services to the final consumers. This sector supports Indonesian economy because in 2016, it contributed 5.24% of
the total of GDP and absorbed 22.4 million or 31.81% of workforce from the non-agricultural sector (Tim
Sindonews, 2017). In addition, according to Global Retail Development Index (GRDI), Indonesia was listed in the
top ten most attractive countries in the retail sector in 2017 (Margrit, 2017).
However, in 2017 to 2019, retail outlets in several shopping centers in Indonesia were closed. In 2019, 4.300 outlets
are estimated to close (Mangkuto, 2019). The outlet closure is caused by changes in consumers’ life style, changes
in priority from consumption to investment, weak purchasing power, economic slowdowns, and shifting offline
shopping patterns to online shopping (Fitriya, 2017). Besides, this closure is the opportunity for companies to
expand and relocate to other prospective areas (Bella, 2018). Therefore, this phenomenon needs to be considered by
retailers by implementing Omnichannel Retailing, to provide a shopping experience to consumers through various
channels, both physical and digital (Rigby, 2011).
The phenomenon of retail outlets closure has attracted the researcher to identify further about the feasibility or the
prospects of retail sector to be investment choices and performance of retail sector from the perspective of financial
management. According to Fahmi (2014), an overview of a company’s performance can be observed from its
financial statement. He also states that a financial statement can help investors decide to buy or sell stocks after
analyzing the company’s prospect in the future. Samsul (2015) says that the company’s performance reflects its
operating income and net income per unit of shares, as well as several financial ratios that can describe the strength
of management in managing the company.
This research used seven financial ratios influencing stock prices namely Earning Per Share (EPS), Price to Earnings
Ratio (PER), Price to Book Value (PBV), Return on Equity (ROE), Current Ratio (CR), Debt to Equity Ratio
(DER) and RoCE (Return on Capital Employee). The stock price is one of the indicators of the success of the
company management. If the stock price of a company always increases, investors or candidates of investor assume
that the company is successful in managing its business (Astuty, 2017). In this case, multiple linear regression
analysis will examine whether the influence appears or not. Ratios affecting the stock price will be observed from
Warren Buffett’s perspective as the reference for candidates of investor before they buy certain company stocks.
Warren Buffett is the most successful investor in the world who is also a commissioner, president director, and the
largest shareholder in Berkshire Hathaway. Buffett and Clark (2002) state that Warren Buffett is interested in
companies with earning per share that has grown up over ten years. According to Eduwinsah and Sitorus (2018),
“Warren Buffett chooses a company’s share based on the company values with the following criteria: 1) the
Retail Company Performance in Indonesia Based on Financial Ratio Analysis, pp. 122–131
123
business company is understandable, 2) it has profitable long-term prospects, 3) the company is running by honest
and competent people 4) it has attractive business prices”.
Earning Per Shares shows profits given by shareholders from each share owned (Fahmi, 2014). The higher the EPS
value, the better the company’s ability in providing returns to investors. Price Earnings Ratio (PER) shows in-
vestors’ assessment in the company’s growth prospect in the future reflected in share prices (Sudana, 2015). Price to
Book Value (PBV) can be used to compare the market value and the book value of the company. According to
Brigham and Houston (2018), “Return of Equity (ROE) measures the rate of return on investment of ordinary
shareholders”. The current ratio shows the company’s ability in providing current assets to pay current liabilities
(Sudana, 2015). The higher the Current Ratio, the greater the company’s ability to pay off the current liabilities.
Debt to Equity Ratio (DER) measures the ratio between total liabilities and total common equity (Brigham &
Ehrhardt, 2017). The smaller the Debt to Equity Ratio (DER), the smaller the percentage of the company’s debt.
Return on Capital Employed (RoCE) shows efficiency and profitability for the company’s capital investment
(Morsy & Rwegasira, 2010).
LITERATURE REVIEW AND HYPOTHESIS
The researches on fundamental factors affecting stock prices have conducted by several researchers in Indonesia and
other countries. Petcharabul and Rompasert (2014) study the relationship between financial ratios and stock returns
in technology sector companies in Thailand Stock Exchange from 1997 to 2011. The research used five financial
ratios, namely current ratio, debt-to-equity ratio, inventory turnover ratio, return on equity ratio, and price-earnings
ratio. According to the result of the regression analysis, only ROE and PER have a significant relationship on stock
returns.
Dita and Murtaqi (2014) find out that net profit margin and debt to equity ratio have a positive influence, while Price
to Book Value has a negative influence on stock returns. Net profit margin, price to book value, and debt equity ratio
simultaneously have a significant influence on stock returns. The research has been conducted to the consumer
goods industry in Indonesia in 2009 to 2013.
Allozi and Obeidat (2016) examine the relationship between profitability ratio ((net profit margin (NPM), gross
profit margin (GPM), return on assets (ROA), return on equity (ROE), earnings per share (EPS)) and leverage ratio
((debt ratio (DR), debt to equity ratio (DER), interest coverage ratio (CR)) with stock returns at Jordan. The research
samples were 65 manufacturing companies in 2001 to 2011 in Amman Stock Exchange. The research result shows
that gross profit margin, return on equity, return on assets, and earnings per share have a significant relationship on
stock returns. Meanwhile, net profit margin and ratio leverage have no significant relationship on stock returns.
Sukhija (2014) examines fundamental factors affecting stock prices in 200 companies listed in Bombay Stock
Exchange (BSE) India by using the inter-industrial approach in 1998 to 2013. This research concludes that book
value, dividend per share and growth are the main determiners of banking and financial companies’ stock prices.
PER, book value, and growth are the determiners of petroleum and mining companies’ stock prices. PER, book
value, Cover and DPS are the significant determiners of infrastructure companies’ stock prices. Book value, DPS
and PER are the main determiners of metal and chemical companies’ stock price. Book value, ROCE and earning
per share are the main determiners of IT and communication companies’ stock prices.
Gursida (2017) examines the influence of fundamental and macroeconomic analysis on the stock price in the
companies listed in Indonesia Stock Exchange. The fundamental analysis uses current ratio, debt to equity ratio
(DER), earning per share (EPS), return on assets (ROA), and total assets turnover (TATO), while the macro-
economic analysis uses inflation and exchange rate. The fundamental analysis shows that Current ratio (CR) and
ROA has a positive influence on stock prices while debt to equity ratio (DER), earning per share (EPS) and total
assets turnover (TATO) has no influence on stock prices. The result of macroeconomic analysis is that the inflation
rate has no influence on stock prices, while the exchange rate has a negative influence on stock prices.
Malhotra and Tandon (2013) examine factors influencing stock prices on 95 companies listed in National Stock
Exchange (NSE) India in the period of 2007–2012. The research result shows that book value, earning per share and
price earnings has a significant positive influence on companies’ stock prices.

Ima K. Y. and Caecilia W. E. R.
124
Astuty (2017) states the influence of fundamental factors and systematic risks on stock prices in the companies listed
in LQ45 Index in the period of 2011–2015. The research result shows that simultaneously, price earnings ratio
(PER), earning per share (EPS), net profit margin (NPM), price to book value (PBV), and systematic risks have a
significant influence on stock prices in the companies listed in LQ45 Index in the period of 2011–2015. Partially,
earnings ratio (PER), earning per share (EPS), net profit margin (NPM), price to book value (PBV), and systematic
risks have a significant influence on stock prices.
Pratama, Azizah, and Nurlaily (2019) examine the influence of financial performances on stock prices in 13
companies in Jakarta Islamic Index listed in the Indonesia Stock Exchange in 2014–2017. The companies’ financial
performances can be observed through financial ratios namely return on equity, earning per share, current ratio, and
debt to equity ratio. Their research was explanatory research using a quantitative approach. The data analysis used
was multiple linear regression analysis. According to the examination result conducted simultaneously, variables of
return on equity (ROE), earning per share (EPS), current ratio (CR) dan debt to equity ratio (DER) have a significant
influence on stock prices. According to the examination result conducted partially, variables of return on equity
(ROE) and earning per share (EPS) has a significant positive influence on stock prices. Meanwhile, current ratio
(CR) and debt to equity ratio (DER) have no significant influence on stock prices.
Hadi and Nurhayati (2018) find out that ROE has a positive influence on stock prices. Guritno (2013) finds that
current ratio, ROE, firm size has partially no significant influence on stock returns. Utami and Darmawan (2019)
find out that earning per share and market value added have a positive influence on stock prices, while debt to equity
ratio, return on assets and return on equity partially have no influence on stock prices. Cahyaningrum and Antikasari
(2017) find out that EPS, PBV, ROA, and ROE in 2010–2014, simultaneously and partially, have a positive
influence on financial sector companies’ stock prices. Meanwhile, Herawati and Putra (2018) find out that DER,
CR, and PER have no significant influence on food and beverages companies’ stock prices.
The Influence of Earning Per Share on Stock Prices
EPS is the net income per share given to ordinary shareholders (Brigham & Ehrhardt, 2017). The higher the profit
per share, the better the company’s financial capability showed by dividends and high retained earnings (Maholtra
& Tandon, 2013). The higher the EPS, the better the company’s prospect for investors because higher income can
be achieved. This situation can attract investor in buying shares. The increase in the number of stock requests may
cause the company’s stock prices to increase. The previous researches by Utami and Darmawan (2019),
Cahyaningrum and Antikasari (2017), Astuty (2017), and Idawati and Wahyudi (2015) show that earning per share
has a positive influence on stock prices. Therefore, the hypothesis formulated is:
H1: Earning per share affects stock prices
The Influence of Price to Earnings Ratio on Stock Prices
PER shows investors’ assessment of the companies’ growth prospects in the future reflected in stock prices (Sudana,
2015). The price/earnings (P/E) ratio shows how much investors are willing to pay per dollar of reported profits
(Brigham & Ehrhardt, 2017). A fast-growing a company has higher PER compared to the risk company. Growth
prospect can attract investors to invest in companies by buying shares. High demand on stock may lead to increasing
stock prices. The low PER ratios tend to be followed by fast-growing stock prices, while the high PER ratios will be
followed by slow-growing stock prices (Astuty, 2017). Rahmadewi and Abundanti (2018), Malhotra and Tandon
(2013), Astuty (2017) state that Price to Earnings Ratio has a positive influence on stock prices. Therefore, the
proposed hypothesis is:
H2: Price to Earnings Ratio affects stock prices
The Influence of Price to Book Value on Stock
PBV value shows the comparison between market values and book values of the company. Cahyaningrum and
Antikasari (2017) show that a company that has good performances will achieve high PBV values. The better
performance of a company leads to higher PBV ratios annually. The increase in performance will be followed by
the increase in stock prices due to higher demand in stocks. This is supported by Astuty (2017) who finds out that
PBV has a positive influence on stock prices. Therefore, the hypothesis proposed is:
H3: Price to Book Value affects stock prices

Retail Company Performance in Indonesia Based on Financial Ratio Analysis, pp. 122–131
125
The Influence of Return on Equity on Stock Prices
Return on Equity shows the comparison between operating income and equity (Samsul, 2015). If more profits are
generated, investors get greater profits on their investments. The greater ratios lead to the more efficient own capital
management (Sudana, 2015). Therefore, this will be a good signal for investors regarding companies’ future
prospects. In addition, the increase in ROE is expected to be followed by the increase in stock prices. This is in line
with Cahyaningrum and Antikasari (2017), Hadi and Nurhayati (2018), who find out that ROE has a positive
influence on stock prices. The following hypothesis is proposed as follows:
H4: Return on Equity affects stock prices.
The Influence of Current Ratio on Stock Prices
Current ratio measures companies’ capability to pay current liabilities with their current assets (Sudana, 2015). The
greater ratio shows that the company is more liquid. In this case, the company has good performances which attract
investors to buy the company’s shares. Investors’ interest in buying shares will lead to the increase in stock prices.
Choi and Sias (2012) declare that an increase in current ratio can be used to predict an increase in stock returns.
Gursida (2017) find out that CR has a positive influence on stock prices. The higher current ratio, the higher stock
prices. Therefore, the hypothesis is formulated as follows:
H5: Current Ratio affects stock prices
The Influence of Debt to Equity Ratio on Stock Prices
Debt to equity ratio is total liabilities divided by total common equity (Brigham & Ehrhardt, 2017). The lower ratio
is better for companies because they will achieve greater equity to pay debts so that investors feel safe (Fahmi,
2014). If companies are able to pay the obligation to creditors on time, they have good performances that can attract
investors to buy their shares. The more investors who are interested to buy, the higher stock prices will be.
Therefore, a low debt ratio that is followed by companies’ capability in paying obligation to creditors on time will
lead to the increase in stock prices. Therefore, the hypothesis is proposed as follows:
H6: Debt to Equity Ratio affects stock prices
The Influence Return on Capital Employee on Stock Prices
According to Sukhija (2014), RoCE is one of the factors influencing IT and communication companies’ stock prices
in India. RoCE shows the efficiency and the profitability of a company’s investment capital (Morsy & Rwegasira,
2010). The greater RoCE leads to the use of capital which is more efficient as well as the profit generated by the
company which is greater. Hence, the hypothesis is proposed as follows:
H7: Return on Capital Employee affects stock prices
RESEARCH METHOD
Population and Sample
The population in this research were 25 retail sub-sector companies listed in Indonesia Stock Exchange in 2014–
2017. The samples were chosen with certain consideration in which the company has a positive profit based on the
financial statement published during the period of 2014 to 2017 or using purposive sampling method (Sugiyono,
2017). Ten companies meeting the criteria are presented in the Table 1 as follows:
Table 1
The Companies List at Retail Subsector
Code Company Name
ACES Ace Hardware Indonesia Tbk
AMRT Sumber Alfaria Trijaya Tbk
CSAP Catur Sentosa Adiprana Tbk
ERAA Erajaya Swasembada Tbk
HERO Hero Supermarket Tbk
LPPF Matahari Departemen Store bk
MAPI Mitra Adiperkasa Tbk
MIDI Midi Utama Indonesia Tbk
RALS Ramayana Lestari Sentosa Tbk
TELE Tiphone Mobile Indonesia Tbk
Source: www.idx.co.id, 2019

Ima K. Y. and Caecilia W. E. R.
126
Data
This research used secondary data in the form of annual closing stock prices and the financial statement during the
period of 2014 to 2017. The financial statement was used to identify financial ratios as follows:
1) Earning Per Share
Earning per share is the profit given to shareholders for each share they have (Fahmi, 2011).
The formula is EPS =
2) Price to Earnings Ratio
This ratio shows how much investors are willing to pay per dollar of reported profits (Brigham & Ehrhardt,
2017).
The formula is PER =
3) Price to Book Value
Price to Book value compare market price per share with book value per share (Fahmi, 2014). The formula is
PBV
4) Return on Equity (ROE)
ROE measures the rate of return on investment of (Brigham & Houston, 2018). The formula is ROE
5) Current Ratio (CR)
According to Brigham and Ehrhardt (2017), current ratio is the comparison between current assets and current
liabilities. Generally, creditors are interested in companies with high current ratios.
The formula is CR
6) Debt to Equity Ratio
Debt to equity ratio is total liabilities divided by total common equity (Brigham & Ehrhardt, 2017). The formula
is DER
7) Return on Capital Employee (RoCE)
RoCE shows the efficiency and the profitability of a company’s investment capital (Morsy & Rwegasira, 2010).
The formula is RoCE
FINDINGS
The Result of Multiple Linear Regression Analysis Test
Multiple Linear Regression Analysis is conducted to examine the influence of the seven financial ratios on stock
prices. Before conducting regression analysis, classical assumption tests consisted of normality, multicollinearity,
autocorrelation and heteroscedasticity are conducted. The data is categorized to pass all four tests. The regression
results are presented in the Table 2.
Table 2.
The Results of Multiple Linear Regression Analysis
Model Unstandardized Coefficients Standardized Coefficients
t Sig. B Std. Error Beta
1 (Constant) 212.668 623.566 0.341 0.735
EPS 25.570 1.831 1.056 13.962 0.000
PER 3.917 2.659 0.061 1.473 0.150
PBV 468.786 84.473 4.297 5.550 0.000
ROE -15407.761 2868.878 -4.549 -5.371 0.000
CR 64.398 115.126 0.028 0.559 0.580
DER 387.895 185.305 0.256 2.093 0.044
RoCE 1415.335 863.206 0.140 1.640 0.111
a. Dependent Variable: Closed price

Retail Company Performance in Indonesia Based on Financial Ratio Analysis, pp. 122–131
127
Based on Table 2, the equation of the multiple linear regression analysis is
Y = 212.668 + 25.570 EPS + 3.917 PER + 468.786 PBV – 15,407.761 ROE + 64.398 CR + 387.895 DER +
1,415.335 RoCE
DISCUSSION
The Influence of Earning Per Share on Stock Prices
In the Table 2, EPS variable has a significant value of 0.000 which is smaller than 0.05. Therefore, EPS has a
positive and significant influence on stock prices (H1 is supported). This means that the higher EPS, the higher stock
prices will be. The higher EPS shows the better companies’ capability in producing profit for the companies and the
shareholders. This result is in line with the researches by Utami and Darmawan (2019), Cahyaningrum and
Antikasari (2017), Astuty (2017), Asmirantho and Somantri (2017), and Idawati and Wahyudi (2015) in which EPS
has a positive and significant influence on stock prices. However, the result is different from Gursida’s research
(2017) in which EPS has no influence on stock prices.
The Influence of Price to Earnings Ratio on Stock Prices
In the Table 2, PER variable has a significant value of 0.150 which is greater than 0.05. Therefore, PER has no
significant influence on stock prices (H2 is not supported). In this case, PER is not one of the factors considered by
investors in their investment. The higher or the lower PER value does not influence investors’ interest to invest in a
company. This result is in line with the research by Herawati and Putra (2018) in which PER has no influence on
stock prices. While Malhotra and Tandon (2013), Astuty (2017), Rahmadewi and Abundanti (2018) show different
result in which PER has a positive influence on stock prices.
The Influence of Price to Book Value on Stock Prices
In the Table 2, PBV variable has a significant value of 0.000 which is smaller than 0.05. Therefore, PBV has a
positive and significant influence on stock prices (H3 is supported). The higher PBV value indicates that market
value of the company is higher than the book value. Cahyaningrum and Antikasari (2017) show that companies that
have good performances will have high PBV values which lead to higher PBV ratios. The increase in performance
will be followed by the increase in stock prices due to the higher demand in stock. This result is in line with Astuty’s
research (2017) who finds that PBV has a positive influence on stock prices.
The Influence of Return on Equity on Stock Prices
In Table 2, ROE variable a beta value of -15407.761 with a significance of 0.000 < 0.05. This means ROE has a
negative and significant influence (H4 is supported). According to Cholidia (2017) as cited in Rahmadewi and
Abundanti (2018), this negative influence is caused by investors is using reference groups, experiences and
speculations instead of using fundamental analysis in investment decision making. This research is expected that the
increase or the decrease in company returns is not necessarily influenced by the increase in stock prices. The
increase in stock prices of retail companies is caused by the increase in companies’ product demand in certain events
such as Eid al-Fitr, Christmas, New Year, and when natural disasters hit several regions in which many consumers
need the products. This result is different from the researches by Cahyaningrum and Antikasari (2017), Hadi and
Nurhayati (2018) that state that ROE has a positive influence on stock prices. The result difference is happened
because there are only two out of ten companies, ACES and LPPF that have ROE over 15 % for 4 years in a row.
This means that most of the companies that are studied have poor performance in terms of ROE. This is in line with
Sudiyatno and Suharmanto (2011) who find that ROE has a negative influence on stock return in the food and
beverage industry in the IDX.
The Influence of Current Ratio on Stock Prices
In the Table 2, CR varible has a significance of 0.580 which is greater than 0.05. Therefore, H5 which states that CR
has an influence on stock prices is not supported. This means that investors do not consider the size of CR value
when they making an investment decision. In addition, the information about current ratio issued once a year while
stock prices value can be seen every day. This condition leads investors in this research, who are also market players
in making investment decision, do not really pay too much attention to the impact of the capability of companies’
liquidity (Pratama et al., 2019). This research assumes that retail companies prioritize the availability of ready-to-sell
goods rather than other current assets such as cash, receivables and short-term securities. The research result is in
line with the researches by Guritno (2013), Asmirantho and Somantri (2017), Herawati and Putra (2018) that price
to earnings ratio has no influence on stock prices. However, it is different from Gursida’s research (2017) who find
out that CR has a positive influence on stock prices.

Ima K. Y. and Caecilia W. E. R.
128
The Influence of Debt to Equity Ratio on Stock Prices
In the Table 2, DER variable has a beta value of 352.696 with a significance of .048 which is smaller than 0.05. This
means that DER has a positive and significant influence on stock prices so that H6 is supported. Investors do not pay
too much attention to the high debt ratio when investing because during 2014–2017, companies can still have a
positive profit. This can be seen in eight of out ten companies’ samples that have DER which is greater than 1. This
means that the majority of companies have greater debts than the total equity. In this case, it can be assumed that
even though companies have high debt ratio, they are still able to fulfill their responsibility to pay debts by
producing profit annually. The researches by Asmirantho and Somantri (2017), Gursida (2017), and Herawati and
Putra (2018) show that DER has no influence on stock prices.
The Influence of Return on Capital Employee on Stock Prices
In the Table 2, the significance of RoCE variable is 0.111 which is greater than 0.05. Therefore, H7 stating that
RoCE has a significant influence on stock prices is not supported. This means that investors do not consider RoCE
when they investing. They tend to pay less attention to EBIT (Earning Before Interest and Taxes) but pay more
attention to EAT (Earning After Tax) because it is relevant for them in terms of assessing shareholders’ wealth and
calculating dividends. In addition, EAT is also relevant as the indicator to assess companies’ capability in producing
profit. This research result is different from Sukhija’s research (2014) in which RoCE is one of the factors
influencing stock prices on IT and communication companies in India.
The Performance of Retail Sub-Sector Companies Based on Warren Buffett’s Perspective
The result of multiple linear regression analysis shows that EPS, PBV, ROE, and DER have a significant influence
on stock prices. The result of calculation of the four ratios in ten companies during the period of 2014–2017 is
presented in the Table 3, 4, 5, and 6.
Table 3
EPS Calculation Result
Code Year
2014 2015 2016 2017
ACES 32.44 34.51 41.69 45.62
AMRT 14.27 11.23 14.4 7.23
CSAP 36 14 21 19
ERAA 73 43 55 86
HERO 10.0 5.0 4.1 12.8
LPPF 486.5 610.5 692.4 653.8
MAPI 197 23 126 202
MIDI 48.09 48.75 68.01 35.67
RALS 50.12 47.64 60.02 60.48
TELE 50 52 66 57
According to Warren Buffett, ACES, ERAA, LPPF, MAPI, MIDI, RALS, and TELE are the companies that have
good performance because their profit is stable and they have developed for four years in a row (Buffett & Clark,
2002).
Table 4
PBV Calculation Result
Code Year
2014 2015 2016 2017
ACES 5.70 5.38 4.70 5.64
AMRT 0.010 0.005 0.005 0.005
CSAP 0.002 0.001 0.002 0.001
ERAA 1.05 0.49 0.51 0.58
HERO 0.002 0.006 0.008 0.006
LPPF 246.37 46.41 23.78 12.53
MAPI 0.000003 0.000002 0.000003 0.000002
MIDI 0.0027 0.003053 0.0026 0.0033
RALS 0.0017 0.0014 0.0025 0.0024
TELE 0.0026 0.0019 0.0019 0.0020

Retail Company Performance in Indonesia Based on Financial Ratio Analysis, pp. 122–131
129
According to Warren Buffett, ACES is the company that has good performance because the PBV value > 1 (Buffett
& Clark, 2002).
Table 5
ROE Calculation Result (in %)
Code Year
2014 2015 2016 2017
ACES 23.2 22.2 23.2 22.2
AMRT 19.16 11.49 11.86 5.7
CSAP 12.78 5.75 5.03 6.41
ERAA 7 7.17 7.68 9.37
HERO 0.8 2.47 2.54 7.7
LPPF 799.04 160.98 108.87 81.92
MAPI 2.81 1.01 6.51 8.25
MIDI 22.39 19.1 21.9 11.14
RALS 10.7 10.1 12.2 11.6
TELE 12,2 13.2 14.6 11.88
According to Warren Buffett, ACES and LPPF are the company that have good performance because the ROE
value >= 15% and it is consistent (Buffett & Clark, 2002).
Table 6
DER Calculation Result
Code Year
2014 2015 2016 2017
ACES 0.25 0.24 0.22 0.26
AMRT 3.67 2.13 2.68 3.17
CSAP 3.04 3.13 2.00 2.37
ERAA 1.03 1.43 1.18 1.39
HERO 0.52 0.88 1.23 1.11
LPPF 18.20 2.50 1.60 1.30
MAPI 2.33 2.19 2.33 1.69
MIDI 3.17 3.39 3.76 4.29
RALS 0.37 0.37 0.39 0.40
TELE 1.01 1.53 1.56 1.47
According to Warren Buffett, ACES and TELE have good performance because they have capability in paying
debts and their debt ratio is low in which DER value <=1 (Buffett & Clark, 2002).
Recommendations for Prospective Investors
The recommendations for prospective investors are based on four independent variables which significantly influ-
ences stock prices, namely EPS, PBV, ROE, and DER. The recommendations are presented in the Table 7.
Table 7
Shares Recommended for Purchase
Criteria
Increasing EPS Consistent ROE>=15% PBV > 1 DER < 1
ACES ACES ACES ACES
ERAA LPPF TELE
LPPF
MAPI
MIDI
RALS
TELE
Based on the Table 7, ACES (Ace Hardware Indonesia Tbk) is the company that meets the four criteria set by
Warren Buffett. Therefore, it is recommended to be bought by prospective investors.

Ima K. Y. and Caecilia W. E. R.
130
CONCLUSION
Conclusion
1) EPS, PBV, ROE, and DER partially have significant effect to stock prices; while PER, CR and RoCE produce
no significant effect to stock prices in retail companies in Indonesia.
2) ACES meets the four criteria for good company according to Warren Buffett
The criteria are the company has EPS growth for four consecutive years, has ability to pay off debt, and has
consistent ROE> = 15%.
Suggestion
Companies should maintain their good financial ratios, namely EPS continues to increase, ROE> = 15%, DER <1
and PBV> 1 to attract investors to invest in retail companies.
REFERENCES
Allozi, N. M., & Obeidat, G. S. (2016). The relationship between the stock return and financial indicators
(profitability, leverage): An empirical study on manufacturing companies listed in Amman Stock Exchange.
Journal of Social Sciences, 5(3), 408–424.
Asmirantho, E., & Somantri, O. K. (2017). The effect of financial performance on stock price at pharmaceutical
subsector company listed in Indonesia Stock Exchange. Jurnal Ilmiah Akuntansi Fakultas Ekonomi, 3(2), 94–
107.
Astuty, P. (2017). The influence of fundamental factors and systematic risk to stock prices on companies listed in
the Indonesian Stock Exchange. European Research Studies Journal, XX(4A), 230–240.
Bella, A. (2018). Aprindo: Ritel tutup bukan berarti mati. Retrieved April 28, 2019, from http://marketeers.com/
aprindo-ritel-tutup-bukan-berarti-mati/.
Berman, B. R., Evans, J. R., & Chatterjee, P. M. (2018). Retail management: A strategic approach. Thirteenth
Edition. Harlow: Pearson Education Limited.
Brigham, E. F., & Ehrhardt, M. C. (2017). Financial management: Theory & Practice. Fifteen Edition. Boston:
South-Western College Publishing.
Brigham, E. F., & Houston, J. F. (2018). Dasar-dasar manajemen keuangan. Edisi Empat Belas. Jakarta: Salemba
Empat.
Buffett, M., & Clark, D. (2002). The new buffettology. New York, NY: Rawson Associates.
Cahyaningrum, Y. W., & Antikasari, T. W. (2017). Pengaruh earning per share, price to book value, return on asset,
dan return on equity terhadap harga saham sektor keuangan. Jurnal Economia, 13(2), 191–200.
Choi N. Y., & Sias R. W. (2012). Why does financial strength forecast stock returns? Evidence from subsequent
demand by institutional investors. Review of Financial Studies, 25(5), 1550–1587.
Dita A. H., & Murtaqi I. (2014). The effect of next profit margin, price to book value and debt to equity ratio to
stock return in the Indonesian consumer goods sector. Journal of Business and Management, 3(3), 305–315.
Eduwinsah, N., & Sitorus, R. R. (2018). Analisis kinerja keuangan dan kinerja investasi terhadap kinerja portofolio
saham serta tax planning sebagai variabel moderating. Media Akuntansi Perpajakan, 3(1), 74–93.
Fahmi, I. (2011). Analisis kinerja keuangan: Panduan bagi akademisi, manajer, dan investor untuk menilai dan
menganalisis bisnis dari aspek keuangan. Bandung: Alfabeta.
----------- (2014). Manajemen keuangan perusahaan dan pasar modal. Jakarta: Mitra Wacana Media.
Fitriya. (2017). Mengapa banyak ‘department store’ di Indonesia tutup? Retrieved May 5, 2019, from https://www.
cermati.com/artikel/mengapa-banyak-department-store-di-indonesia-tutup.
Guritno, Y. (2013). Pengaruh financial ratio dan firm size terhadap financial distress serta return saham. Business &
Management Journal, 10(2), 127–138.
Gursida, H. (2017). The influence of fundamental and macroeconomic analysis on stock price. Jurnal Terapan
Manajemen dan Bisnis, 3(2), 222–234.
Hadi, W., & Nurhayati. (2018). analysis of the effect of net profit margin, return on assets and return on equity on
stock price (Case study on consumption industrial sector companies listed in Indonesian Sharia Stock Index at
Indonesia Stock Exchange in 2016), The Management Journal of BINANIAGA, 03(02), 81–92.
Herawati, A., & Putra, A. S. (2018). The influence of fundamental analysis on stock prices: The case of food and
beverage industries. European Research Studies Journal, XXI(3), 316–326.
Idawati, W., & Wahyudi, A. (2015). Effect of earning per shares (EPS) and return on assets (ROA) against share
price on coal mining company listed in Indonesia Stock Exchange. Journal of Resources Development and
Management, 7, 79–91.

Retail Company Performance in Indonesia Based on Financial Ratio Analysis, pp. 122–131
131
Malhotra, N., & Tandon, K. (2013). Determinants of stock prices: Empirical evidence from NSE 100 companies.
International Journal of Research in Management & Technology (IJRMT), 3(3), 86–95.
Mangkuto, W. S. (2019). Makin lesu, ada 4.300 gerai ritel bakal tutup di 2019. Retrieved April 28, 2019, From
https://www.cnbcindonesia.com/lifestyle/20190304163813-33-58793/makin-lesu-ada-4300-gerai-ritel-bakal-
tutup-di-2019.
Margrit, A. (2017). Ritel di negara berkembang: Indonesia masuk 10 besar. Retrieved May 4, 2019, from
https://kalimantan.bisnis.com/read/20170606/448/659522/ritel-di-negara-berkembang-indonesia-masuk-10-besar.
Morsy, A., & Rwegasira, K. (2010). Does demutualization matter to the financial performance of stock exchanges?
An investigation of demutualized member stock exchanges of the world federation of exchanges. International
Research Journal of Finance and Economics, 40, 155–167.
Petcharabul P., & Romprasert S. (2014). Technology industry on financial ratios and stock returns. Journal of
Business and Economics, 5(5), 739–746.
Pratama, C. A., Azizah, D. F., & Nurlaily, F. (2019). Pengaruh return on equity (ROE), earning per share (EPS),
current ratio (CR) dan debt to equity ratio (DER) terhadap harga saham. (Studi pada perusahaan Jakarta
Islamic Index yang terdaftar di Bursa Efek Indonesia Tahun 2014–2017). Jurnal Administrasi Bisnis (JAB),
66(1), 10–17.
Rahmadewi, P. W., & Abundanti, N. (2018). Pengaruh EPS, PER, CR, dan ROE terhadap harga saham di Bursa
Efek Indonesia. E-Jurnal Manajemen Unud, 7(4), 2106–2133.
Rigby, D. K. (2011). The future of shopping. Harvard Business Review, December 2011, 65–75. Retrieved from
https://hbr.org/2011/12/the-future-of-shopping.
Samsul, M. (2015). Pasar modal dan manajemen portofolio. Jakarta: Erlangga.
Sudana, I. M. (2015). Teori dan praktik manajemen keuangan perusahaan. Jakarta: Erlangga.
Sudiyatno, B., & Suharmanto, T. (2011). Kinerja keuangan konvensional, economic value added, dan return saham.
Jurnal Dinamika Manajemen, 2(2), 153–161.
Sugiyono. (2017). Metode penelitian bisnis: Pendekatan kuantitatif, kualitatif, kombinasi, dan R&D. Bandung:
Alfabeta.
Sukhija, S. (2014). An explicit model on fundamental factors affecting stock prices of bse listed companies in India:
An inter industry approach. European Journal of Business and Management, 6(37), 196–202.
Tim Sindonews. (2017). Mendag: Kontribusi ritel pada perekonomian nasional makin besar. Retrieved April 28,
2019, from https://ekbis.sindonews.com/read/1202726/34/mendag-kontribusi-ritel-pada-perekonomian-nasional-
makin-besar-1493963949.
Utami, M. R., & Darmawan, A. (2019). Effect of DER, ROA, ROE, EPS and MVA on stock prices in Sharia
Indonesian Stock Index. Journal of Applied Accounting and Taxation, 4(1), 15–22.

132
3rd International Conference on Management & Entrepreneurship (3rd i-CoME) ISBN 978-602-5446-15-3
Phuket, 25th – 27th July 2019
THE EFFECT OF ERP PRACTICE, SCM PRACTICE, TO PRODUCTION
PERFORMANCE WITH IT INFRASTRUCTURE AS A MODERATING
Zeplin Jiwa Husada Tarigan
1, Hotlan Siagian
2, Widjojo Suprapto
3, Sautma Ronni Basana
4
1,2,3,4 Petra Christian University, Surabaya, Indonesia,
Email: [email protected]; [email protected]
4
ABSTRACT Information technology is a system that is used by many companies to unite many business function systems within the
companies. The integrated information technology used by those companies is called Enterprise Resources Planning (ERP). The
practice of ERP usage by companies is to obtain integrated data system among departments. The ERP practice must be aligned
with the company operational system and must be customized for regular updates. This research distributes 74 questionnaires to
manufacturing companies that main system is using ERP, with nine questionnaires rejected by the respondents due to company
confidentiality, and 63 questionnaires are valid for further data process and analysis with PLS. ERP practice can increase SCM
practice, and improve production performance of manufacturing companies. As an intervening variable, IT infrastructure
upgrade can increase the effect of ERP practice to SCM practice because the information quality can become valuable
information sharing for supply chain partners. The upgraded IT can increase the effect of ERP practice to production
performance because it helps management to make proper decisions.
Keywords: ERP practice, SCM practice, production performance, IT infrastructure.
INTRODUCTION
The manufacturing companies must build their competitive advantage through the company strategy. The strategy
must be able to create uniqueness that is not possessed by competitors. In the global market, the creation of strategy
to respond the market and to innovate is very valuable for business capability, especially in facing severe compe-
tition marked by the increasing challenges of fast changing consumer preferences and shorter product life cycle
(Chen, 2018). Since globalization has caused many alterations in business strategies, the direct impacts of globali-
zation to business environment lately affect product processes, product packaging, product assembly, product sto-
rage and sales, and distribution across international borders and continents (Arlbjørn & Lüthje, 2012). Several push
factors include cost reduction, company responding speed, increasing product quality and production flexibility, and
reduced cycle times. This push factors are crucial for global competition (Arlbjørn & Lüthje, 2012).
Production process is very vital for business sustainability, especially for manufacturing companies. Without effi-
cient and effective processes, manufacturing companies cannot grow and excel in global markets. Therefore, the
manufacturing companies have to pay attention to their processes, especially the production methods, which contain
competitive advantages for the company’s sustainability. The manufacturing processes, which are focused on the
production performance, are intended to yield efficient and effective production processes. The production perform-
ance in most manufacturing companies is connected to the production capacity, efficient production material use,
efficient human resource use, and efficient energy use as the overhead costs.
To reach optimal production performance, manufacturing companies have to connect the SCM practice with other
production activities. The SCM practice in a company is often reflected in the organization culture, customer
relationship, information and communication technology, benchmarking, company performance measurement, and
lean manufacturing. Proper SCM practice will increase company performance. In the production department, SCM
practice is conducted by removing any obstacles that offer no significant added value to the company, implementing
just in time management to the production to make proper amount of goods in time, implementing agile
manufacturing (Gorane & Kant, 2016), and implementing information technology in the company (AL-Shboul,
Garza-Reyes, & Kumar, 2018).
The implementation of SCM is always related to the role of information technology usage of a company. Many
manufacturing companies have implemented the information technology system that can integrate data in the real
time, and that system is called ERP (Enterprise Resource Planning). The ERP practice is used by manufacturing
companies to create production schedules of each finished products for each machinery daily and weekly, making
material planning to prepare material for each production process which are matched with the schedules, controlling
work in process (WIP) in the production floor to match with the inventory, conducting data entry in the production
The Effect of ERP Practice, SCM Practice, to Production Performance, pp. 132–138
133
department and reporting them for the costing needs of the accounting and finance department, transferring goods
data from the production floor to the inventory to the finished good sections which are monitored by the ERP
system.
The SCM practice and ERP practice in increasing the company performance must be supported by information
technology that is possessed by the company in order to create benefits from both systems. SCM is a strategy used
by a company to connect customers with suppliers to control information flows, goods distribution, and appropriate
fund distribution. The integration between a company with internal and external sides is always needed (Hamister,
2012). The integration can happen with the help of information technology which unites all related departments
such as the production department, finance department, accounting department, marketing department, and other
cross functional department within the company. With the help of information technology, ERP practice assists to
achieve and implement SCM practice. The use of information technology in a company relies on the continually
upgraded information technology infrastructure. Adjusting the information infrastructure technology is closely
related with the software and hard ware upgrades of the information technology. The newness of this research relies
on the limited numbers of researches on the field of information technology upgrade adjustment to the SCM
practice supported by the ERP practice in manicuring companies in Indonesia. There is also a few researches that
discusses about the whole package of information technology infrastructure used in a company to improve
production performance.
GRAND THEORY
Supply Chain Management (SCM) Practice
The SCM practice is defined as a chain of activities done by an organization to promote effective supply chain
management. A research by Gawankar, Kamble, and Raut (2017) explores various SCM practice, such as customer
relationship management, strategic supplier partnership, information sharing, information quality, lean retailing
practises, and postponement practises. The SCM practice will bring impacts on the effective and efficient company
performance. The SCM practice is to conduct active communication on supply chain flows, to manage compatible
information exchange on supply chain flows, to communicate company development along supply chain flows, and
to build strong teams across organization within supply chain flows (Hsu, Tan, & Laosirihongthong, 2014).
SCM practice that is proposed by AL-Shboul et al. (2018) exploring the SCM performance is about doing
collaboration with supplier, controlling flexibility with company external sides, using internet for a company to gain
internal access to various departments and external access to suppliers and customers, focusing on customers to
maintain product loyalty, reducing company wastes through lean production, and integrate various across functional
departments to form an internal integration. Chong, Chan, Ooi, & Sim, (2011) claim that SCM practices cover the
area of strategic partnership with suppliers, good relationship building with customers, information sharing with
partners, and usage of information technology for training and best internal operation. SCM practice becomes the
best practice given to a company through SCM activities related to the departments of purchasing, production,
logistics, and transportation. The indicators for the SCM practice variable are schedule production, integrated
system, cross functional department, information quality, collaboration with suppliers, and coordination with
customers.
Enterprise Resources Planning (ERP) Practice
Enterprise resources planning is cross functional integration in a company to unite data to become a single data base.
A company uses ERP to facilitate its resource setting. ERP practice gives the exact information to key user and end
user in their activity. ERP practice is able to be used by the management to coordinate and control the company
operational to produce the effectivity and efficiency of Critical Success Factor (CSF) in implementing ERP. They
are project team, top management involvement, strategic decision making, communication, project management,
project support, minimum customization, organizational change management, business process alignment, software
testing, performance measurement, education and training, technical possibilities (Reitsma & Hilletofth, 2018).
According to Dezdar (2012), CSF is divided into two in implementing ERP, they are strategic success factor (top
management support, project management, business process engineering) and tactical success factor (ERP vendor
support, user training and education, enterprises wide communication). ERP practice that is used by a company to
control and organize its activity related to its information technology.

Zeplin J. H. T., Hotlan S., Widjojo S., and Sautma R. B.
134
A company uses ERP practice by building modules of each function as its needs such as module for sales and
distribution, module for management material, module for procurement and analysis, module for production and
control system, module for costing, module for finance, module for shop floor control system, module for human
resource management, etc. ERP practice is used to give information to user, key user and management for them to
see the condition of their company appropriately and it will give them to make decision appropriately. Indicator used
in measuring ERP practice is alignment ERP system with operational system, customization ERP system, training
key user and system development.
Information Technology Infrastructure
The fast changing information technology implementation in a manufacturing company starts with an implemen-
tation in a department to know all work activities of the unit function. The integration is first built from accounting
system in the company and in controlling the warehouse. The next change is that the company is building the
integrated cross functional in a company by implementing the integrated information technology called enterprise
resources planning (ERP). Using ERP is able to improve the company by producing operational system effectively
and efficiently. The next changing is by external participation to be included in the information system of the
company. The company integrates the internal and external to make the integration data with the suppliers and
customers. The integrated data between a company and customer in a supply chain stream management is called
supply chain integration (Sundram, Bahrin, Munir, & Zolait, 2018).
The changes in a company should be supported by the use of information technology infrastructure. The company
should upgrade the information technology software and hardware. Information technology capability can be
reached if the company provide fund for information technology infrastructure upgrade to fit its needs such as in
using automated data entry in the company’s business process by using data capturing machine to replace human
work (Chae, Koh, & Park, 2018). The architecture of information and communication technology (ICT) is divided
into hard and soft (human) system (Huang, Gardner, & Moayer, 2016). Hard system is an information technology
hardware related to network system, computer system, data base system and data processing system (Skotnes,
2015). On the other hand, soft system is related with knowledge system and all of the work of human competency.
Indicators used in information technology infrastructure are the company fund to improve it, hardware upgrading as
needed, software upgraded as needed and improving the employees’ competency to use it.
Production Performance
The measurement of a company performance should be done continuously to improve in the operational area. The
company operational is a process to produce the products from accepting customer order to the execution of pro-
duction plan and the procurement of goods from supplier. The company gives efforts to build the good partnership
with the supplier and customer. The company performance is determined from the non-financial and financial
performance (Ya’kob & Jusoh, 2016). Tarigan (2018) states that operational performance can be measured by
fulfillment of customer order, the accuracy of shipping according to the time that has been set, delivery flexibility,
and company flexibility to production volume change. Sundram et al. (2018) say in the research that manufacturing
perfomance is measured by the settling of the complaints from customer, the speed of order fulfillment, delivery due
date and flexibility. Chae et al. (2018) states that business performance that is measured by its financial performance
is measured from profit ratio and cost ratio. Production performance measured in this research is order fulfillment
(Tarigan, 2018; Sundram et al., 2018), delivery due date (Sundram et al., 2018), delivery flexibility (Tarigan, 2018;
Sundram et al., 2018), quality product and capacity production.
The Relationship among Research Concepts
Business performance can be improved when companies can maintain sustainable business through sustainable
SCM. Sustainable supply chain management (SSCM) is a simple relationship between supply chains of a business
where three factors, namely economic, environmental, and social are considered in their operations. Coordinated
relations between organizations in business where economic, environmental and social factors are considered to
manage raw materials, information, capital flows are designed efficiently and effectively related to the procurement,
production and distribution of services to meet stakeholder demand, increase profitability, competitiveness, and
organizational sustainability (Ahi & Searcy, 2013). The results of this sustainable will provide increased supply
chain management performance in increasing the efficiency and effectiveness of the company. This condition is
obtained when the company is always able to run and implement SCM practice properly. SCM practice in
companies can be quantitative and qualitative performance (Gandhi, Shaikh, & Sheorey, 2017).
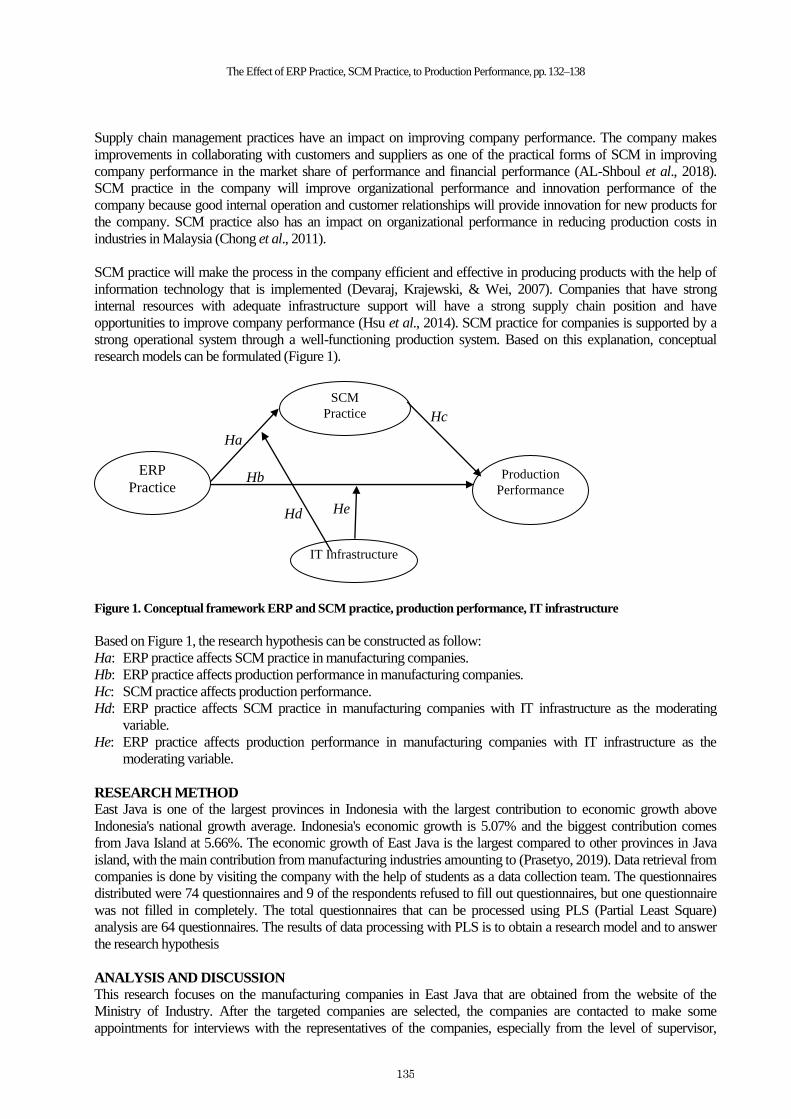
The Effect of ERP Practice, SCM Practice, to Production Performance, pp. 132–138
135
Supply chain management practices have an impact on improving company performance. The company makes
improvements in collaborating with customers and suppliers as one of the practical forms of SCM in improving
company performance in the market share of performance and financial performance (AL-Shboul et al., 2018).
SCM practice in the company will improve organizational performance and innovation performance of the
company because good internal operation and customer relationships will provide innovation for new products for
the company. SCM practice also has an impact on organizational performance in reducing production costs in
industries in Malaysia (Chong et al., 2011).
SCM practice will make the process in the company efficient and effective in producing products with the help of
information technology that is implemented (Devaraj, Krajewski, & Wei, 2007). Companies that have strong
internal resources with adequate infrastructure support will have a strong supply chain position and have
opportunities to improve company performance (Hsu et al., 2014). SCM practice for companies is supported by a
strong operational system through a well-functioning production system. Based on this explanation, conceptual
research models can be formulated (Figure 1).
Figure 1. Conceptual framework ERP and SCM practice, production performance, IT infrastructure
Based on Figure 1, the research hypothesis can be constructed as follow:
Ha: ERP practice affects SCM practice in manufacturing companies.
Hb: ERP practice affects production performance in manufacturing companies.
Hc: SCM practice affects production performance.
Hd: ERP practice affects SCM practice in manufacturing companies with IT infrastructure as the moderating
variable.
He: ERP practice affects production performance in manufacturing companies with IT infrastructure as the
moderating variable.
RESEARCH METHOD
East Java is one of the largest provinces in Indonesia with the largest contribution to economic growth above
Indonesia's national growth average. Indonesia's economic growth is 5.07% and the biggest contribution comes
from Java Island at 5.66%. The economic growth of East Java is the largest compared to other provinces in Java
island, with the main contribution from manufacturing industries amounting to (Prasetyo, 2019). Data retrieval from
companies is done by visiting the company with the help of students as a data collection team. The questionnaires
distributed were 74 questionnaires and 9 of the respondents refused to fill out questionnaires, but one questionnaire
was not filled in completely. The total questionnaires that can be processed using PLS (Partial Least Square)
analysis are 64 questionnaires. The results of data processing with PLS is to obtain a research model and to answer
the research hypothesis
ANALYSIS AND DISCUSSION
This research focuses on the manufacturing companies in East Java that are obtained from the website of the
Ministry of Industry. After the targeted companies are selected, the companies are contacted to make some
appointments for interviews with the representatives of the companies, especially from the level of supervisor,
ERP
Practice
IT Infrastructure
SCM
Practice
Production
Performance
He Hd
Hb
Ha
Hc

Zeplin J. H. T., Hotlan S., Widjojo S., and Sautma R. B.
136
middle manager, head of department, or director. After some company visits and interviews, there are 64 company
representatives willing to be the research respondents by filling the questionnaires for further data collection. The
data are processed by PLS to obtain convergent validity and composite reliability.
Validity test is obtained by loading factor score. If the score is above 0.50, the validity can be accepted. The research
instrument is reliable if the value is above 0.70. Based on the results of data processing, the reliability value of the
ERP practice variable is 0.869, the SCM practice variable is 0.845, the production performance variable is 0.868,
and the IT infrastructure variable is 0.925. The results of the obtained reliability values are above 0.70; so, the
instrument is reliable. It is also supported by the Cronbach's Alpha values for each variable, with the ERP practice of
0.798, the SCM practice of 0.829, the production performance of 0.851 and the IT infrastructure of 0.891; so that it
can be said that all variables have met the reliability requirements
The results of data processing show that the validity values which are indicated by the loading factor scores for all
measurement items are above 0.5. For the variable of ERP practice, the indicator of the ERP system alignment to
the operational system (ERP 1) is of 0.766, the ERP system customization (ERP2) is of 0.855, the key user training
(ERP3) is of 0.803, and the system development (ERP4) is of 0.730. The SCM practice variable contains some
indicators of the schedule production (SCM1) with the value of 0.625, the integrated system (SCM2) of 0.697, the
cross functional department (SCM3) of 0.831, the information quality (SCM4) of 0.609, the collaboration with
suppliers (SCM5) of 0.851, and the coordination with customers (SCM6) 0.785. For the value of loading factors of
the variable information technology infrastructure, the indicator of the company fund to improve it (IT1) is of 0.734,
the hardware upgrading as needed (IT2) is of 0.922, the upgraded software as needed (IT3) is 0.931, and the
improvement of the employees' competency to use it (IT4) is of 0.876. Finally, the variable of the production
performance surrenders the loading factor value for each indicator of the order fulfillment (PP1) of 0.820, the
delivery due date (PP2) of 0.853, the delivery flexibility (PP3) of 0.695, the quality product (PP4) of 0.742, and the
capacity production (PP5) of 0.842. Based on the results above, all research variables are valid and research
instruments are reliable. The PLS output the data processing for the path coefficient to calculate the significancy of
the impacts and to test the research hypothesis is observed in Table 1.
Table 1
Direct and Moderating Coefficient for Path Coefficient
Direct and Moderating Coefficient Original Sample (O) T Statistics (|O/STDEV|) P Values
ERP Practices -> Production Performance 0.547 5.329 0.000
ERP Practices -> SCM Practices 0.818 14.726 0.000
IT Infrastructure -> Production Performance 0.017 0.261 0.794
IT Infrastructure -> SCM Practices 0.298 3.544 0.000
Moderating Effect 1 -> SCM Practices 0.184 2.005 0.045
Moderating Effect 2 -> Production Performance 0.127 2.327 0.020
SCM Practices -> Production Performance 0.361 3.685 0.000
In Table 1, the value of the impact from ERP practice to SCM practice is obtained the path coefficient of 0.818 with
the p-value of 0.000, so the first hypothesis is accepted as the p-value is smaller than 0.05. It can be said that ERP
practice implemented by the company is able to improve SCM performance. This condition provides that the ERP
implementation of the company to integrate the internal company can be used also in carrying out internal and
external integration of the company. SCM practice can be improved with the presence of ERP practices for
companies. This study supports the results of the study (Gorane & Kant, 2016) stating that ERP software is able to
provide quality data to SC partner so as to provide a broader scale of economics to increase invoicing, increase
services and increase competitiveness.
Table 1 also reveals the path coefficient of 0.547 with p-value of 0.000 for ERP practice to production performance,
so the second hypothesis is also accepted as the p-value is smaller than 0.05. It is said that ERP practice in
manufacturing companies in East Java is able to provide improved production performance. Company
management, key users and end users can use ERP practice in coordinating and communicating between functions
to make the right decisions. Joint decisions taken are able to provide improved performance for the company. This
study is in accordance with the results of the study by Devaraj et al. (2007).

The Effect of ERP Practice, SCM Practice, to Production Performance, pp. 132–138
137
The next hypothesis is that SCM practice gives an effect on production performance with the path coefficient value
of 0.361 and the p-value of 0.000, so the third hypothesis can be accepted. SCM practice that is used by companies
in managing relationships with suppliers and customers is able to provide an increase in the company's production
performance. This research is in accordance with the results of the study by AL-Shboul et al. (2018) which states
SCM practice enabling to improve the company performance in terms of the financial performance and market
share performance.
IT infrastructure as a moderating variable in ERP Practice has an influence on SCM practice in manufacturing
companies. Table 1 shows that the p-value 0.045 is below 0.05, therefore, IT infrastructure is capable of being a
moderating variable of ERP practice to SCM performance with the path coefficient value of 0.184. ERP practice in
providing data integration within the company is used to generate supply chain practice in the form of information
quality and information sharing between cross functional to be able to improve the performance of SCM companies
(Sundram et al., 2018; and AL-Shboul et al., 2018).
IT infrastructure as a moderating variable in ERP Practice has an influence on production performance in
manufacturing companies. Table 1 shows that the p-value of 0.020 is below 0.05; so, information technology
infrastructure is capable to act as a moderating variable on ERP Practice to production performance of 0.127. This
study supports a research of Gorane and Kant (2016), which states the availability of information technology
capable of integrating such as ERP software becoming very important for the company. Information technology and
communication manufacturing companies are able to produce effective and efficient business transactions, quick
access to information, enable better customer service, reduce manual documents for companies, improve
coordination and better communication, increase company productivity, and save time.
CONCLUSION
The results from the data process, it can be concluded that ERP practice can provided integrated technology which
improves the supply chain practice. ERP practice in East Java manufacturing companies can provide information
about order fulfillment and delivery due date through ERP system which can surrender efficiency and effectiveness
on production performance. SCM practice can create quality information and collaboration with suppliers and
customers so that it can improve the delivery flexibility and product quality of the production performance. IT
infrastructure can bring effects to increase ERP practice toward SCM practice as the ERP practice can integrate
company data so that information quality and information sharing can be done with business partners. Finally, IT
infrastructure can bring significant effects of ERP practice to production performance as the management can obtain
information on order fulfillment, due date data order, and production capacity in order to make proper decision,
which in the end can improve company performance.
REFERENCES
AL-Shboul, M. A., Garza-Reyes, J. A., & Kumar, V. (2018). Best supply chain management practices and high-
performance firms: The case of gulf manufacturing firms. International Journal of Productivity and
Performance Management, 67(9), 1482–1509.
Ahi, P., & Searcy, C. (2013). A comparative literature analysis of definitions for green and sustainable supply chain
management. Journal of Cleaner Production, 52, 329–341.
Arlbjørn, J. S., & Lüthje, T. (2012). Global operations and their interaction with supply chain performance.
Industrial Management & Data Systems, 112(7), 1044–1064.
Chae, H-C., Koh, C. E., & Park, K. O. (2018). Information technology capability and firm performance: Role of
industry. Information and Management, 55(5), 525–546.
Chen, C. J. (2018). Developing a model for supply chain agility and innovativeness to enhance firms’ competitive
advantage. Management Decision. doi:10.1108/MD-12-2017-1236.
Chong, A. Y. L., Chan, F. T. S., Ooi, K. B., & Sim, J. J. (2011). Can Malaysian firms improve organizational/
innovation performance via SCM? Industrial Management & Data Systems, 111 (3), 410–431.
Devaraj, S., Krajewski, L., & Wei, J. C. (2007). Impact of e-business technologies on operational performance: The
role of production information integration in the supply chain. Journal of Operations Management, 25(6),
1199–1216.
Dezdar, S. (2012). Strategic and tactical factors for successful ERP projects: Insights from an Asian country.
Management Research Review, 35(11), 1070–1087.
Zeplin J. H. T., Hotlan S., Widjojo S., and Sautma R. B.
138
Gandhi, A. V., Shaikh, A., & Sheorey, P. A. (2017). Impact of supply chain management practices on firm
performance: Empirical evidence from a developing country. International Journal of Retail & Distribution
Management, 45(4), 366–384.
Gawankar, S. A., Kamble, S., & Raut, R. (2017). An investigation of the relationship between supply chain
management practices (SCMP) on supply chain performance measurement (SCPM) of Indian retail chain
using SEM. Benchmarking: An International Journal, 24(1), 257–295.
Gorane, S. J., & Kant, R. (2016). Supply chain practices: An implementation status in Indian manufacturing
organisations. Benchmarking: An International Journal, 23(5), 1076–1110.
Hamister, J. W. (2012). Supply chain management practices in small retailers. International Journal of Retail &
Distribution Management, 40(6), 427–450.
Hsu, C-C., Tan, K. C., & Laosirihongthong, T. (2014). Antecedents of SCM practices in ASEAN automotive
industry: Corporate entrepreneurship, social capital, and resource-based perspectives. The International
Journal of Logistics Management, 25(2), 334–357.
Huang, F., Gardner, S., & Moayer, S. (2016). Towards a framework for strategic knowledge management practice:
Integrating soft and hard systems for competitive advantage. VINE Journal of Information and Knowledge
Management Systems, 46(4), 492–507.
Prasetyo, A. (2019). Jawa kontributor terbesar bagi pertumbuhan eknomi nasional. Media Indonesia, senin, 6 mei
2019. https://mediaindonesia.com/read/detail/233732.
Reitsma, E., & Hilletofth, P. (2018). Critical success factors for ERP system implementation: A user perspective.
European Business Review, 30(3), 285–310.
Sundram, V. P. K., Bahrin, A. S., Munir, Z. B. A., & Zolait, A. H. (2018). The effect of supply chain information
management and information system infrastructure: The mediating role of supply chain integration towards
manufacturing performance in Malaysia. Journal of Enterprise Information Management, 31(5), 751–770.
Skotnes, R. Ø. (2015). Management commitment and awareness creation – ICT safety and security in electric
power supply network companies. Information & Computer Security, 23(3), 302–316.
Tarigan, Z. J. H. (2018). The impact of organization commitment to process and product innovation in improving
operational performance. International Journal of Business and Society, 19(2), 335–346.
Ya’kob, S. A., & Jusoh, W. J. W. (2016). The effect of supply chain linkage on micro and small enterprises’
performance. International Journal of Business and Society, 17(1), 99–112.

139
3rd International Conference on Management & Entrepreneurship (3rd i-CoME) ISBN 978-602-5446-15-3
Phuket, 25th – 27th July 2019
THE EFFECT OF ENTERPRISE RESOURCE PLANNING ON
COMPETITIVE ADVANTAGE THROUGH SUPPLIER RELATIONSHIP
MANAGEMENT
Hotlan Siagian
1, Zeplin Jiwa Husada Tarigan
2
1,2 Petra Christian University, Surabaya, Indonesia
Email: [email protected]; [email protected]
2
ABSTRACT This study examines the effect of enterprise resource planning (ERP) system on the competitive advantage with the mediating
role of supplier relationship management. The study used 59 samples from the executive level of the export-oriented manufac-
turer in the region of East Java, Indonesia. Data collection used questionnaires designed with a five-point Likert scale. Data
analysis used the partial least square technique with smartPLS software. The empirical study result revealed that the ERP system
used by the corporate affects the improvement of the supplier relationship management significantly. The ERP system used by
the company has a direct impact on strengthening its competitive advantage. Furthermore, supplier relationship management also
affects the competitive advantage directly and significantly. To sum up, the ERP system significantly influences the competitive
advantage, directly and indirectly, as indicated by the path coefficient of 0.865. A new finding suggests that supplier relationship
management mediates the effect of ERP on a competitive advantage. These results provide a significant contribution to the
supply chain theory and practice. The export-oriented manufacturer, therefore, may refer to this result in enhancing the
competitive advantage.
Keywords: Enterprise resource planning, competitive advantage, supplier relationship management.
INTRODUCTION
In recent years, there has been an increasing interest in the role of supply chain management in enhancing the
competitive advantage of an organization. The reason is that the organization should go international for either
acquiring raw materials or selling their finished product. The supply chain management, consequently, plays an
essential role in achieving superior competitive advantages in terms of lower cost, shorter lead-time, and higher
quality. The supply chain management also becomes more complicated due to the broader coverage regarding the
geographical location and the culture of the organization involved in the network. The export-oriented manufacturer
domiciled in the region of East Java, Indonesia, are also facing the same constraint as they are looking for imported
raw materials. In the context of the supply chain management, many studies suggested several factors which
contributed to enhancing the competitive advantages of an organization such as the implementation of enterprise
resource planning (ERP) system and the establishment of the supplier relationship management (SRM).
Many researchers have examined that ERP system has an impact on the competitive advantage (Abdelghaffar,
2012; Bin Che Rose, 2009; Egdair, Rajemi, & Nadarajan, 2015; Hidayat & Akhmad, 2016; Hsu & Chen, 2004; Li
& Lin, 2006; Prasojo, 2015). The ERP system can provide integrated information and a more efficient
administrative system for the company. ERP system enables the organization to integrate the related units in such a
way that that the process becomes more efficient and has a shorter lead-time and faster new products development
than that carried out by the competitor. The studies also have been conducted over a different sector of industry and
countries, and they have a conclusion in common that ERP creates and enhances the competitive advantage.
Other researchers also reveal that supplier relationship management (SRM) affects the competitive advantage of an
organization (Cousineau, Lauer, & Peacock, 2004; Jap, 2001; Thatte, 2007). Those researchers indicate that SRM
plays an essential role in cost reduction and creates a competitive advantage for the companies. The manufacturer
enjoys the benefits from the relationship, such as having a shorter lead time, lower cost, and higher quality.
Therefore, it is essential for a manufacturer to establish an excellent relationship with suppliers.
Furthermore, it is also found from the literature review that the ERP system also influences the SRM. The use of
ERP in SRM can lower production costs and produce higher product quality. An appropriate relationship with
suppliers supported by ERP systems will be highly helpful in improving the competitive advantage (Al-Abdallah,
Abdallah, & Hamdan, 2014; Larson & Kulchitsky, 2000). All previous studies have primarily concentrated on the
direct impact of the ERP system and SRM on the competitive advantage of an organization. However, to the best of
the author's knowledge, there is no study presenting the mediating role of the SRM over ERP system and
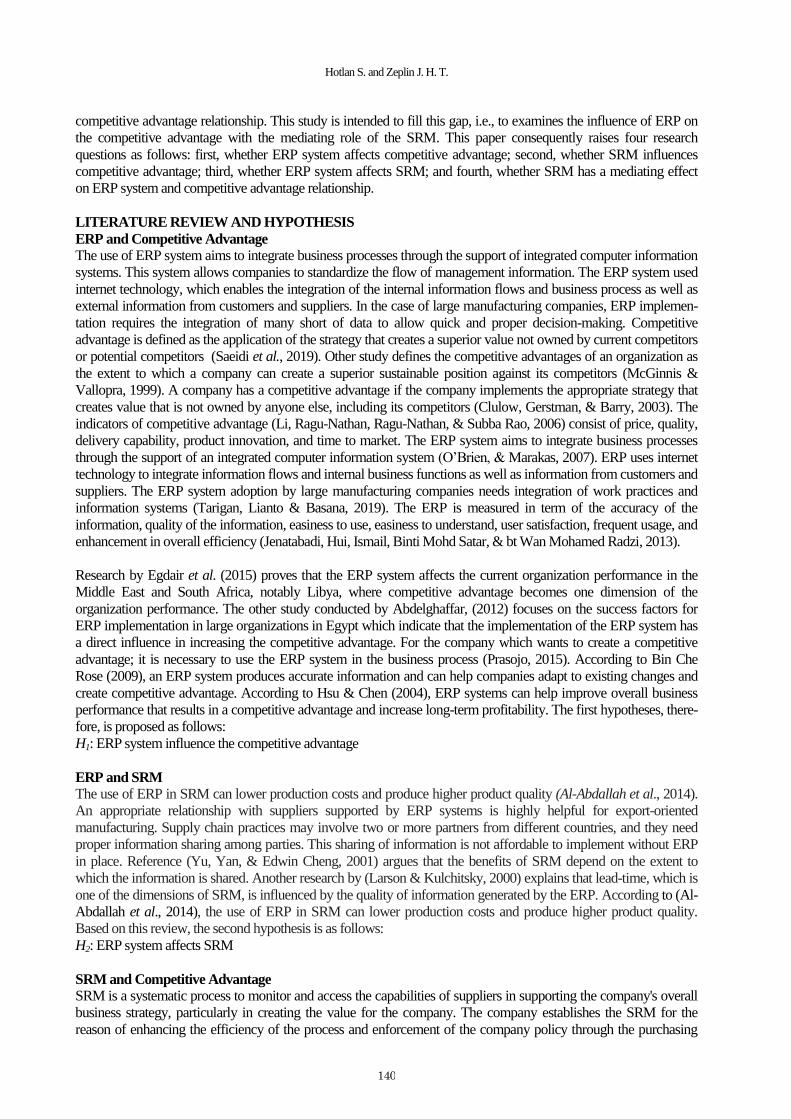
Hotlan S. and Zeplin J. H. T.
140
competitive advantage relationship. This study is intended to fill this gap, i.e., to examines the influence of ERP on
the competitive advantage with the mediating role of the SRM. This paper consequently raises four research
questions as follows: first, whether ERP system affects competitive advantage; second, whether SRM influences
competitive advantage; third, whether ERP system affects SRM; and fourth, whether SRM has a mediating effect
on ERP system and competitive advantage relationship.
LITERATURE REVIEW AND HYPOTHESIS
ERP and Competitive Advantage
The use of ERP system aims to integrate business processes through the support of integrated computer information
systems. This system allows companies to standardize the flow of management information. The ERP system used
internet technology, which enables the integration of the internal information flows and business process as well as
external information from customers and suppliers. In the case of large manufacturing companies, ERP implemen-
tation requires the integration of many short of data to allow quick and proper decision-making. Competitive
advantage is defined as the application of the strategy that creates a superior value not owned by current competitors
or potential competitors (Saeidi et al., 2019). Other study defines the competitive advantages of an organization as
the extent to which a company can create a superior sustainable position against its competitors (McGinnis &
Vallopra, 1999). A company has a competitive advantage if the company implements the appropriate strategy that
creates value that is not owned by anyone else, including its competitors (Clulow, Gerstman, & Barry, 2003). The
indicators of competitive advantage (Li, Ragu-Nathan, Ragu-Nathan, & Subba Rao, 2006) consist of price, quality,
delivery capability, product innovation, and time to market. The ERP system aims to integrate business processes
through the support of an integrated computer information system (O’Brien, & Marakas, 2007). ERP uses internet
technology to integrate information flows and internal business functions as well as information from customers and
suppliers. The ERP system adoption by large manufacturing companies needs integration of work practices and
information systems (Tarigan, Lianto & Basana, 2019). The ERP is measured in term of the accuracy of the
information, quality of the information, easiness to use, easiness to understand, user satisfaction, frequent usage, and
enhancement in overall efficiency (Jenatabadi, Hui, Ismail, Binti Mohd Satar, & bt Wan Mohamed Radzi, 2013).
Research by Egdair et al. (2015) proves that the ERP system affects the current organization performance in the
Middle East and South Africa, notably Libya, where competitive advantage becomes one dimension of the
organization performance. The other study conducted by Abdelghaffar, (2012) focuses on the success factors for
ERP implementation in large organizations in Egypt which indicate that the implementation of the ERP system has
a direct influence in increasing the competitive advantage. For the company which wants to create a competitive
advantage; it is necessary to use the ERP system in the business process (Prasojo, 2015). According to Bin Che
Rose (2009), an ERP system produces accurate information and can help companies adapt to existing changes and
create competitive advantage. According to Hsu & Chen (2004), ERP systems can help improve overall business
performance that results in a competitive advantage and increase long-term profitability. The first hypotheses, there-
fore, is proposed as follows:
H1: ERP system influence the competitive advantage
ERP and SRM The use of ERP in SRM can lower production costs and produce higher product quality (Al-Abdallah et al., 2014).
An appropriate relationship with suppliers supported by ERP systems is highly helpful for export-oriented
manufacturing. Supply chain practices may involve two or more partners from different countries, and they need
proper information sharing among parties. This sharing of information is not affordable to implement without ERP
in place. Reference (Yu, Yan, & Edwin Cheng, 2001) argues that the benefits of SRM depend on the extent to
which the information is shared. Another research by (Larson & Kulchitsky, 2000) explains that lead-time, which is
one of the dimensions of SRM, is influenced by the quality of information generated by the ERP. According to (Al-
Abdallah et al., 2014), the use of ERP in SRM can lower production costs and produce higher product quality.
Based on this review, the second hypothesis is as follows:
H2: ERP system affects SRM
SRM and Competitive Advantage SRM is a systematic process to monitor and access the capabilities of suppliers in supporting the company's overall
business strategy, particularly in creating the value for the company. The company establishes the SRM for the
reason of enhancing the efficiency of the process and enforcement of the company policy through the purchasing

The Effect of Enterprise Resource Planning on Competitive, pp. 139–145
141
strategy in cooperation with the supplier. SRM provides access to the supplier base to help companies improve the
business value that ultimately enhances the company's competitiveness. SRM has long-term goals and short-term
goals. Long-term goals include creating value for customers, increasing profits, improving the efficiency of pro-
duction operations, and increasing markets (Williams, 2006). On the other hand, short-term goals include increasing
productivity, reducing cycle times, and reducing inventories (Wisner & Tan, 2000). According to Al-Abdallah et al.,
(2014), the SRM indicator is divided into five dimensions, namely: supplier quality improvement, supplier-based
trust, production time reduction, supplier collaboration in new product development, and partnership or develop-
ment with suppliers. SRM can also influence the competitive advantage of export companies. The firm needs to
establish a proper relationship with suppliers. It is also supported by Cousineau et al. (2004) who mentioned that the
relationship of cooperation between suppliers and companies could be a strategy for increasing the competitive
advantage of a company. Thatte (2007) also explained that supplier relationships with companies create competitive
advantages that result in profitability and differentiation for the company. Thus, the third hypothesis is as follow:
H3: Supplier relationship management affects competitive advantage
The Mediating Role of SRM over the ERP System and Competitive Advantage Relationship SRM allows both parties, buyer, and supplier, to cooperate in a mutually beneficial way. They gain benefits because
they support each other in term of their respective goals. The cooperation between buyer and supplier need
information sharing, which enables both parties to understand their partner requirement. As discussed previously,
the ERP system supports the establishment of supplier relationship by connecting both sides to the same infor-
mation, which means that the ERP system affects the SRM (Al-Abdallah et al., 2014; Larson & Kulchitsky, 2000;
Yu et al., 2001). Similarly, SRM provides the benefit to a buyer in term of lower cost, better quality, and shorter
time delivery, which at the end enhances a competitive advantage of the organization. By looking at these two
relationships together, it can be concluded that ERP influences the SRM and subsequently affects the competitive
advantage. Concerning this discussion, it can be postulated that SRM mediates the relationship between ERP system
and competitive advantage. The following last hypotheses are proposed:
H4: SRM mediates the effect of ERP on competitive advantage
RESEARCH METHOD
Sampling and Data Collection
The population of this study is 63 export-oriented manufacturers located in the region of East Java, Indonesia. Of the
63, 43 manufacturers are public or listed, while the rest, 20 firms, are private or unlisted. Those firms were
interviewed by using a self-administered questionnaire, and each firm was represented by one respondent from top
management levels, such as CEO or General Manager as they are considered to be the most knowledgeable persons
of their firm. An interview and discussion were conducted with particular respondents when considered necessary.
The questionnaire was designed using subjective assessment with a five-point Likert scale. From 63 firms, 59 have
correctly completed the questionnaires representing a response rate of 93.6%. Data were analyzed using Partial least
square (PLS) technique using smartPLS software ver.3.0 to analyze the data. PLS is an appropriate tool for
analyzing the data mainly in the case of small sample size [21, 22] and limited theoretical knowledge (Moreno &
Casillas, 2008).
Operational Definition of the Constructs
This study assesses three constructs using the definition proposed by previous researchers. The ERP measures the
extent to which the system provides the information to the user. Seven indicators are used, i.e., 1) accuracy of
information, 2) quality of information, 3) easiness to use, 4) frequency used to retrieve the information, and 5)
satisfaction of the user in respect to the information obtained, 6) easiness to understand the information received, and
7) increased overall efficiency. SRM measures the extent to which the supplier gives benefits to the firm by
assessing whether supplier: 1) participates in increasing productivity, 2) reduces the production cost, 3) believes the
firm upon what has been promised; 4) delivers the part quickly, 5) engages in new product development, and 6) has
a mutually beneficial long-term relationship. Finally, competitive advantage measures the competitiveness of the
manufacturer by assessing the extent to which the firm: 1) provides products at competitive prices, 2) produces
products with superior quality, 3) delivers products promptly, 4) introduces new products to the customer's needs,
and 5) introduces new products faster than competitors.
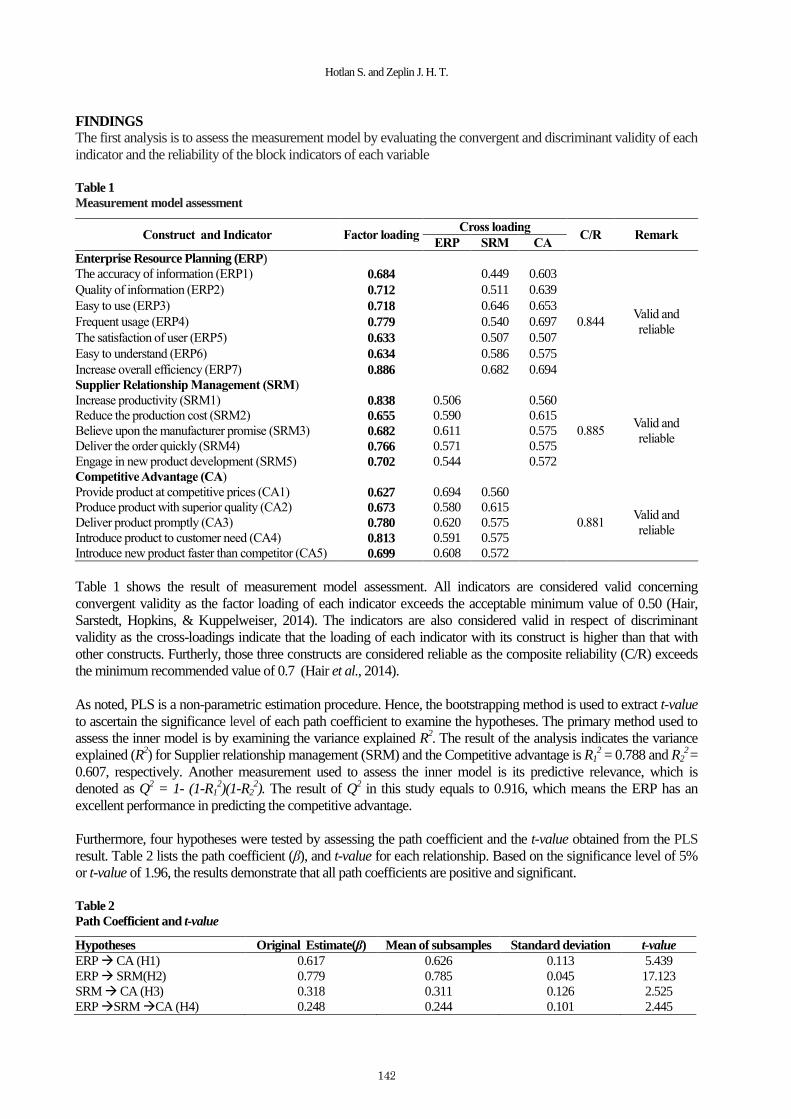
Hotlan S. and Zeplin J. H. T.
142
FINDINGS
The first analysis is to assess the measurement model by evaluating the convergent and discriminant validity of each
indicator and the reliability of the block indicators of each variable
Table 1
Measurement model assessment
Construct and Indicator Factor loading Cross loading
C/R Remark ERP SRM CA
Enterprise Resource Planning (ERP)
The accuracy of information (ERP1) 0.684 0.449 0.603
0.844 Valid and
reliable
Quality of information (ERP2) 0.712 0.511 0.639
Easy to use (ERP3) 0.718 0.646 0.653
Frequent usage (ERP4) 0.779 0.540 0.697
The satisfaction of user (ERP5) 0.633 0.507 0.507
Easy to understand (ERP6) 0.634 0.586 0.575
Increase overall efficiency (ERP7) 0.886 0.682 0.694
Supplier Relationship Management (SRM)
Increase productivity (SRM1) 0.838 0.506 0.560
0.885 Valid and
reliable
Reduce the production cost (SRM2) 0.655 0.590 0.615
Believe upon the manufacturer promise (SRM3) 0.682 0.611 0.575
Deliver the order quickly (SRM4) 0.766 0.571 0.575
Engage in new product development (SRM5) 0.702 0.544 0.572
Competitive Advantage (CA)
Provide product at competitive prices (CA1) 0.627 0.694 0.560
0.881 Valid and
reliable
Produce product with superior quality (CA2) 0.673 0.580 0.615
Deliver product promptly (CA3) 0.780 0.620 0.575
Introduce product to customer need (CA4) 0.813 0.591 0.575
Introduce new product faster than competitor (CA5) 0.699 0.608 0.572
Table 1 shows the result of measurement model assessment. All indicators are considered valid concerning
convergent validity as the factor loading of each indicator exceeds the acceptable minimum value of 0.50 (Hair,
Sarstedt, Hopkins, & Kuppelweiser, 2014). The indicators are also considered valid in respect of discriminant
validity as the cross-loadings indicate that the loading of each indicator with its construct is higher than that with
other constructs. Furtherly, those three constructs are considered reliable as the composite reliability (C/R) exceeds
the minimum recommended value of 0.7 (Hair et al., 2014).
As noted, PLS is a non-parametric estimation procedure. Hence, the bootstrapping method is used to extract t-value
to ascertain the significance level of each path coefficient to examine the hypotheses. The primary method used to
assess the inner model is by examining the variance explained R2. The result of the analysis indicates the variance
explained (R2) for Supplier relationship management (SRM) and the Competitive advantage is R1
2 = 0.788 and R2
2 =
0.607, respectively. Another measurement used to assess the inner model is its predictive relevance, which is
denoted as Q2 = 1- (1-R1
2)(1-R2
2). The result of Q
2 in this study equals to 0.916, which means the ERP has an
excellent performance in predicting the competitive advantage.
Furthermore, four hypotheses were tested by assessing the path coefficient and the t-value obtained from the PLS
result. Table 2 lists the path coefficient (β), and t-value for each relationship. Based on the significance level of 5%
or t-value of 1.96, the results demonstrate that all path coefficients are positive and significant.
Table 2
Path Coefficient and t-value
Hypotheses Original Estimate(β) Mean of subsamples Standard deviation t-value
ERP CA (H1) 0.617 0.626 0.113 5.439
ERP SRM(H2) 0.779 0.785 0.045 17.123
SRM CA (H3) 0.318 0.311 0.126 2.525
ERP SRM CA (H4) 0.248 0.244 0.101 2.445

The Effect of Enterprise Resource Planning on Competitive, pp. 139–145
143
As expected ERP influences competitive advantage (β = 0.617 and t-value = 5.439). This finding supports the
hypothesis H1 and confirms the previous research that ERP has an impact on the competitive advantage
(Abdelghaffar, 2012; Bin Che Rose, 2009; Egdair et al., 2015; Hsu & Chen, 2004; Li & Lin, 2006). The result
shows that the ERP system influences the competitive advantage of export companies in East Java. In today rapidly
changing technological era, the export companies must be able to adapt to the existing technology. In the current,
technology is also beneficial to create a competitive advantage. The implementation of the ERP system in the export
company provides various benefits, such as the integration of functions and quality information. The ERP system
improves the supply chain performance and ultimately creates a competitive advantage, and increase profits for the
company. Export companies generally have a large variety of competitors scattered around the world, so it is not
easy for export companies in maintaining their superiority. The requirement of a technology or ERP system is
mandatory in maintaining or creating a competitive advantage for the export companies in East Java.
Furthermore, ERP also has a direct impact on SRM (β=0.779 and t-value=17.132).This result is consistent with
previous research on the relationship between ERP and SRM (Al-Abdallah et al., 2014; Larson & Kulchitsky, 2000;
Yu et al., 2001). The ERP system, hence, influences the supplier relationship management. The ERP system used
by manufacturing or company will support the long-term relationship with the suppliers. One of the benefits of
supplier relationship management is information sharing. Sharing of quality information (Al-Abdallah et al., 2014;
Larson & Kulchitsky, 2000; Yu et al., 2001), One dimension of the ERP system, is highly useful in improving
relations among export companies.
Figure 1. Research model
Figure 1 demonstrated the relationship of the constructs with its path coefficient, respectively. The result also
indicates that SRM affects competitive advantage as shown by the path coefficient of 0.318 and the t-value of 2.252.
Supplier relationship management has a positive influence on the competitive advantage. An excellent relationship
among companies and their suppliers create a competitive advantage for the export companies. With a good
relationship, the supplier will seriously provide a higher quality product and of course, at a more affordable cost. It is
not easy for an export company to launch a new product quickly if a flexible supplier does not support it.
This result is consistent with previous research by (Al-Abdallah et al., 2014; Cousineau et al., 2004; Thatte, 2007;
Williams, 2006). The last finding is that SRM mediates the influence of ERP on the competitive advantage, as
shown by the path coefficient of 0.248 and the t-value of 2.445. This result indicates that supplier relationship
management directly affects the competitive advantage and also mediates the relationship between ERP and
competitive advantage. In summary, all hypotheses H1, H2, H3, H4 are supported as expected.
The level of uncertainty faced by export companies in East Java is relatively high and diverse, such as the number of
uncertain requests, and constantly changing prices. This situation is becoming more uncertain since the export
companies are also selling their products overseas where the competitive environment is continuously changing. If
the company is not flexible, it will be difficult for the company to maintain the existence or competitive advantage
of the export company itself.
DISCUSSION
The present study was designed to examine the effect of ERP system on the competitive advantage and the
mediating role of SRM in that relationship. The findings indicate that the results are in agreement with the previous
study. ERP affects the competitive advantage directly and indirectly. This finding coincides with previous research
arguing that the ERP system is a central system for integrating all related function within the supply chain network.
Once a system is integrated, an organization will perform much better in terms of shorter lead time, reduced cost,
and better quality. The ERP also affects the SRM, which means that with the integrated system in place, the
Hotlan S. and Zeplin J. H. T.
144
relationship between firm and supplier is getting better, and both parties will gain mutual benefit. The most
interesting finding was that SRM mediates the influence of ERP system on the competitive advantage. When a
relationship between supplier and company is well established, both parties will gain a higher mutual benefit from
the indirect effect of the ERP system implementation. The result also demonstrated that the SRM, as expected,
influences the competitive advantage. As the supplier support, the firm will be able to provide the product needs
such as better quality, shorter lead time, and reduced cost, the relationship with the supplier, will improve the
competitive advantage.
CONCLUSION
The primary aim of the present research is to examine the mediating role of the SRM in improving the competitive
advantage. The study reveals that SRM mediates the influence of ERP on a competitive advantage. The findings
also support the other three hypotheses. ERP influences the competitive advantage directly. An establishment in
ERP system enables the firm to integrate all related function either externally or internally such that they can
collaborate in a much better manner. This study, as expected, has also shown that the ERP influence the SRM
directly and the competitive advantage indirectly. The firm, therefore, is necessary to invest in the ERP resources in
the pursuit of superior competitive advantage. This work contributes to the current research in the supply chain
management, particularly to the relationship of the ERP with the competitive advantage. This work also suggests an
implication that managers should invest in an ERP system and establish an excellent SRM to enhance the
competitive advantage of the firm
REFERENCES
Abdelghaffar, H. (2012). Success factors for ERP implementation in large organizations: The case of Egypt. The
Electronic Journal of Information Systems in Developing Countries, 52(1), 1–13.
Al-Abdallah, G. M., Abdallah, A. B., & Hamdan, K. B. (2014). The impact of supplier relationship management on
competitive performance of manufacturing firms. International Journal of Business and Management, 9(2),
192–202.
Bin Che Rose, R. (2009). A conceptual framework of the relationship between organizational resources, capabi-
lities, systems, competitive advantage and performance. Research Journal of Internatıonal Studıes, 12, 45–58.
Clulow, V., Gerstman, J., & Barry, C. (2003). The resource‐based view and sustainable competitive advantage: The
case of a financial services firm. Journal of European Industrial Training, 27(5), 220–232.
Cousineau, M., Lauer, T. W., & Peacock, E. (2004). Supplier source integration in a large manufacturing company.
Supply Chain Management: An International Journal, 9(1), 110–117.
Egdair, I., Rajemi, M. F., & Nadarajan, S. (2015). Technology factors, ERP system and organization performance in
developing countries. International Journal of Supply Chain Management, 4(4), 82–89.
Hair, J. F., Sarstedt, M., Hopkins, L., & Kuppelweiser, V. (2014). Partial least squares structural equation modeling
(PLS-SEM) an emerging tool for business research. European Business Review, 26(2), 106–121.
Hidayat, R., & Akhmad, S. (2016). Effect of the enterprise resource planning (ERP) on competitive advantage and
performance of manufacturing firms in Indonesia. Journal of Engineering and Applied Science, 11(10), 2298–2303.
Hsu, L. L., & Chen, M. (2004). Impacts of ERP systems on the integrated‐interaction performance of manufacturing
and marketing. Industrial Management & Data Systems, 104(1), 42–55.
Jap, S. D. (2001). Perspectives on joint competitive advantages in buyer–supplier relationships. International
Journal of Research in Marketing, 18, 19–35.
Larson, P. D., & Kulchitsky, J. D. (2000). The use and impact of communication media in purchasing and supply
management. Journal of Supply Chain Management, 36(3), 29–39.
Li, S., & Lin, B. (2006). Accessing information sharing and information quality in supply chain management.
Decision Support Systems, 42(3), 1641–1656.
Li, S., Ragu-Nathan, B., Ragu-Nathan, T. S., & Subba Rao, S. (2006). The impact of supply chain management
practices on competitive advantage and organizational performance. Omega, 34(2), 107–124.
Moreno, A. M., & Casillas, J. C. (2008). Entrepreneurial orientation and growth of SMEs: A causal model.
Entrepreneurship: Theory and Practice, 32(3), 507–528.
O’Brien, J. A., & Marakas, G. M. (2007). Management information systems. Tenth Edition. New York, NY:
McGraw-Hill/Irwin.
Prasojo. (2015). Surabaya di banjiri hotel bintang 3. Retrieved from www.housing-estate.com/read/2015/01/28
/surabaya-dibanjiri-hotel-bintang-3/.
The Effect of Enterprise Resource Planning on Competitive, pp. 139–145
145
Jenatabadi, H. S., Hui, H., Ismail, N. A., Binti Mohd Satar, N., & bt Wan Mohamed Radzi, C. W. J. (2013). Impact
of supply chain management on the relationship between enterprise resource planning system and
organizational performance. International Journal of Business and Management, 8(19), 107–121.
Saeidi, P., Saeidi, S. P., Sofian, S., Saeidi, S.P., Nilashi, M., & Mardani, A. (2019). The impact of enterprise risk
management on competitive advantage by moderating role of information technology. Computer Standards &
Interfaces, 63, 67–82.
Tarigan, Z. J. H., Lianto, & Basana, S. R. (2019). The impact of organizational commitment on upgrading ERP for
maintaining the quality of information and the ERP performance. IOP Conf. Series: Materials Science and
Engineering, 473, 1–7.
Thatte, A. A. (2007). The competitive advantage of a firm through supply chain responsiveness and SCM practices.
Doctoral dissertation. The University of Toledo.
Williams, S. J. (2006). Managing and developing suppliers: Can SCM be adopted by SMEs? In International
Journal of Production Research, 44(18–19), 3831–3846.
Wisner, J. D., & Tan, K. C. (2000). Supply chain management and its impact on purchasing. The Journal of Supply
Chain Management, 36(3), 33–42.
Yu, Z., Yan, H., & Edwin Cheng, T. C. (2001). Benefits of information sharing with supply chain partnerships.
Industrial Management & Data Systems, 101(3), 114–121.
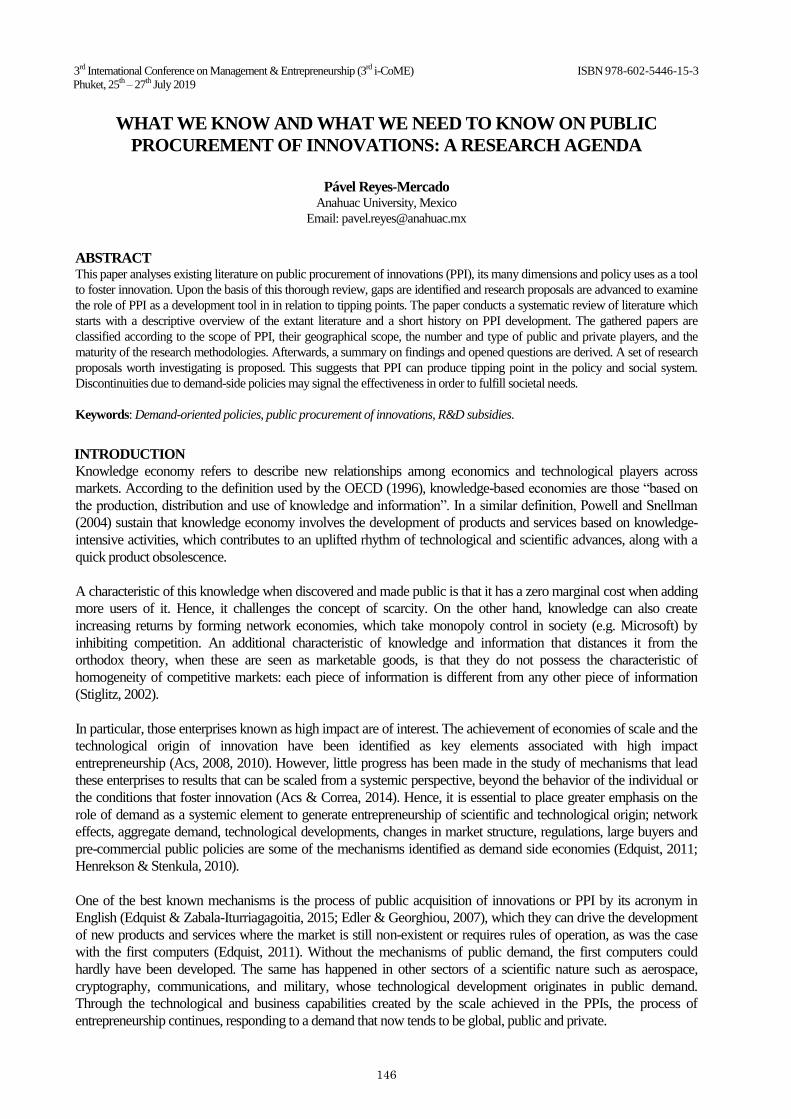
146
3rd International Conference on Management & Entrepreneurship (3rd i-CoME) ISBN 978-602-5446-15-3
Phuket, 25th – 27th July 2019
WHAT WE KNOW AND WHAT WE NEED TO KNOW ON PUBLIC
PROCUREMENT OF INNOVATIONS: A RESEARCH AGENDA
Pável Reyes-Mercado
Anahuac University, Mexico
Email: [email protected]
ABSTRACT This paper analyses existing literature on public procurement of innovations (PPI), its many dimensions and policy uses as a tool
to foster innovation. Upon the basis of this thorough review, gaps are identified and research proposals are advanced to examine
the role of PPI as a development tool in in relation to tipping points. The paper conducts a systematic review of literature which
starts with a descriptive overview of the extant literature and a short history on PPI development. The gathered papers are
classified according to the scope of PPI, their geographical scope, the number and type of public and private players, and the
maturity of the research methodologies. Afterwards, a summary on findings and opened questions are derived. A set of research
proposals worth investigating is proposed. This suggests that PPI can produce tipping point in the policy and social system.
Discontinuities due to demand-side policies may signal the effectiveness in order to fulfill societal needs.
Keywords: Demand-oriented policies, public procurement of innovations, R&D subsidies.
INTRODUCTION
Knowledge economy refers to describe new relationships among economics and technological players across
markets. According to the definition used by the OECD (1996), knowledge-based economies are those ―based on
the production, distribution and use of knowledge and information‖. In a similar definition, Powell and Snellman
(2004) sustain that knowledge economy involves the development of products and services based on knowledge-
intensive activities, which contributes to an uplifted rhythm of technological and scientific advances, along with a
quick product obsolescence.
A characteristic of this knowledge when discovered and made public is that it has a zero marginal cost when adding
more users of it. Hence, it challenges the concept of scarcity. On the other hand, knowledge can also create
increasing returns by forming network economies, which take monopoly control in society (e.g. Microsoft) by
inhibiting competition. An additional characteristic of knowledge and information that distances it from the
orthodox theory, when these are seen as marketable goods, is that they do not possess the characteristic of
homogeneity of competitive markets: each piece of information is different from any other piece of information
(Stiglitz, 2002).
In particular, those enterprises known as high impact are of interest. The achievement of economies of scale and the
technological origin of innovation have been identified as key elements associated with high impact
entrepreneurship (Acs, 2008, 2010). However, little progress has been made in the study of mechanisms that lead
these enterprises to results that can be scaled from a systemic perspective, beyond the behavior of the individual or
the conditions that foster innovation (Acs & Correa, 2014). Hence, it is essential to place greater emphasis on the
role of demand as a systemic element to generate entrepreneurship of scientific and technological origin; network
effects, aggregate demand, technological developments, changes in market structure, regulations, large buyers and
pre-commercial public policies are some of the mechanisms identified as demand side economies (Edquist, 2011;
Henrekson & Stenkula, 2010).
One of the best known mechanisms is the process of public acquisition of innovations or PPI by its acronym in
English (Edquist & Zabala-Iturriagagoitia, 2015; Edler & Georghiou, 2007), which they can drive the development
of new products and services where the market is still non-existent or requires rules of operation, as was the case
with the first computers (Edquist, 2011). Without the mechanisms of public demand, the first computers could
hardly have been developed. The same has happened in other sectors of a scientific nature such as aerospace,
cryptography, communications, and military, whose technological development originates in public demand.
Through the technological and business capabilities created by the scale achieved in the PPIs, the process of
entrepreneurship continues, responding to a demand that now tends to be global, public and private.

What We Know and What We Need to Know on Public Procurement, pp. 146–151
147
From the scientific-academic perspective, there is little research on policies related to the generation of demand for
innovation (Edquist & Zabala-Iturriagagoitia, 2015). Additionally, when it comes to global markets as elements of
demand, little attention has been given to the study of international entrepreneurship from developing countries,
especially from Latin America (Felzensztein, Ciravegna, Robson, & Amorós, 2015).
From the above background, this paper aims at developing a comprehensive literature review on demand-oriented
policies to assess which dimensions merits more further research. Given the development and implementation of
demand-oriented policies mainly in Europe, United Kingdom, and China, this paper contributes with a summary of
what is known about demand-oriented policies and pertinent research avenues in relation to tipping points.
The paper is structured as follows: The method to conduct a comprehensive review of literature is firstly explained
as well as the descriptive findings on innovation policies and features of emerging countries are discussed.
Afterwards, a conceptual discussion is presented along with research propositions that merits further research.
Implications for policy makers and researchers are discussed. The paper closes with study limitations and call to
academic debate.
LITERATURE REVIEW
This section presents the method utilized to gather existing literature on demand-oriented innovation policies. The
policy instruments are discussed according to the case studies, qualitative, and quantitative studies found in
literature.
Demand-Oriented Policies and Energy Transition
The most researched aspect of demand-oriented industries is embedded into environmental and energy issues.
Papers converge in that public purchase of innovations has become an effective instrument to foster green product
innovation. For example, Stucki, Woerter, Arvanitis, Peneder, and Rammer (2018) analyze the role of taxes,
regulations and voluntary agreements as supply-oriented instruments on product innovation activities as well as the
interaction effect of such instruments and demand-side policies. Using firm-level data from Austria, Germany, and
Switzerland, they find that taxes and regulations are negatively related with green product innovation (controlling
for demand-side effects), i.e. they decrease the propensity to innovate. Moreover, subsidies and voluntary
agreements are found to be positively related to green product innovation. Similarly, Groba and Cau (2015) analyze
the role of policy, innovation policy, and markets on exports of renewable energy technologies in China and finds
that policy structure has a role on importing renewable technologies from China. Specifically, by differentiating
between incentive tariffs, obligations, and taxes, countries with incentive tariffs import more solar photovoltaic
technologies that countries that only implement taxes and obligations. Regarding the role of R&D policy and
innovation, while provincial spending has a positive effect on Chinese exports, central government R6D spending
seems to be non-significant. One of the reasons is that spending has not been associated to innovation incentives.
Another example of the role of demand-side instruments is in the electric vehicle industry in Taiwan. Su, Lin, and Li
(2016) analyzes similarities and differences among policies on electric vehicle industry in Taiwan, United States,
Germany, and China. Through an analytical hierarchy process, the authors analyze supply- environment- and
demand-side instruments across countries. This study found that the demand side was the most relevant dimension
of overall policy. From all factors analyzed, ‗procurement‘, ‗legal and regulatory‘, and ‗public enterprise‘ ranked as
the highest priorities for Taiwan‘s electric vehicle industry. In Japan and United States, demand-side instruments
scored in first and second place in the ‗environment‘ dimension of innovation policy. Finally, ‗demand‘ policy in
Taiwan was found to influence at a greater extent development of electric vehicles.
Demand-Side Instruments and Innovation Diffusion
One of the topics which has attracted academic attention is to analyze the role of demand-side instruments in the
innovation process. This process refers to the critical activities deployed mainly by enterprises to ideate, filter,
launch and diffuse innovations into the market. As demand-side instruments involve the participation of
government, industry, and other participants, the need to understand the interplay of policies become critical. For
example, Raiteri (2018) provides evidence on the positive impact of public procurement of innovations on the
generality of upstream technologies in United States. A direct implication of this finding is that stimulus of public
demand can foster the development of early technologies, which are characterized by uncertainty and high risks.
Broad policies and political-economic systems are more prone to endure long investment returns when corporate
participants focus on short term returns. In line with the effectiveness of demand-side instruments, Bugge, Coenen,
Pável R. M.
148
and Branstad (2018) analyzes a program for assisted living for elder and argue that, for these instruments to be
effective there is a need to include requires from setting clear directionality of results rather than relying on a self-
organizing system. Moreover, they suggest the orchestration of stakeholders in articulating public demand of
solutions for the elder. Such mobilization of stakeholders would lead to the generation of platforms in which
participants coordinate, i.e. end users and suppliers. One of the challenges to govern demand-side projects refers to
stakeholders learning and reflexivity that allows them to coordinate according to the policy mix established. In
another study, Li and Georghiou (2016) explore the use of signaling and accrediting catalogues as demand-side
instruments that impact commercialization of innovations in China. Accreditation catalogues refer to catalogues
which contain information on technologies new to the country that needs to be commercialized whereas signaling
catalogues contain information on suppliers needed to develop non-existing technologies. By analyzing the cases of
e-learning classroom, tunnel boring machine, and water recycling technologies, they find a general impact of
catalogues on the development of lead markets. However, there is also a risk that technology being developed can
be seen as nationally protected from the participation of foreign companies. Another example is the analysis of
government subsidies in R&D and their impact on manufacturing of new vehicles in China, conducted by Jian
Zhang, Bu, and Liu (2018). They find that such subsidies have a significant impact on assembly enterprises and
non-significant effect on supporting enterprises. Interestingly, this study also shed light on the fact that demand-side
instruments are more effective to handle disruptive innovations instead of incremental innovation.
Demand-Side Instruments and Broad Issues
While innovation is regularly conducted by large companies, an important topic is if small and medium enterprises
(SMEs) should engage in demand-side processes. Saastamoinen, Reijonen, and Tammi (2018) explore managerial
preferences regarding adoption of innovation policies and find that SMEs are inclined to network with other firms to
develop products for private and public organizations rather than directly engage in demand-side processes. This
raises doubts on how well demand-side instruments can be effective without other industry configurations and
arrangements. In this line, through the analysis of the case of Dutch water construction sector, Wesseling and
Edquist (2108) derive an iterative stage process to successfully conduct projects on public purchase of innovations.
The PPI 5-stage process starts with the Emergence of user-lead or policy-led societal needs that leads to the
Initiation. In this stage, the need is articulated and stakeholders set a PPI organization so the PPI tender can be
announced. In the Design and selection stage, functional requirements and consortia propose innovative solutions to
the need; one proposal is then selected by an expert group. The Implementation stage involves activities of
innovation development, testing, and implementation. In the finalization stage, operations are started and post
implementation activities as risk transfers and evaluation are deployed.
Preliminary Appraisal of Literature
Extant literature on demand-side innovation policies has evolved from seminal –and sometimes normative
frameworks on how policy should be implemented- towards case studies in a variety of European countries, China,
and United States. The available studies have become more positivists in nature to describe and find directionalities
in the policies implemented. While there are also quantitative studies in the reviewed database, there is a need to
continue with the assessment of causal issues derived from the varying innovation policies and country profiles.
While more research is needed to understand directionality, effect sizes, and even externalities generated by
demand-side instruments, the socio-economic and political landscape of countries may introduce confounding
variables that make analysis more complex. Therefore, general theoretical models from disciplines different to
policy analysis may be useful to gain nuanced knowledge on patterns of implementations and effectiveness of
innovation policies. One of such models refers to tipping points.
Introducing Tipping Points to Demand-Side Policies
Linear relationships capture phenomena in which a gradual change in an antecedent variable produces a
proportional change in a consequence variable. Quantitative studies found in the scooping review share this feature.
In contrast with this paradigm, non-linear relationships can be useful to understand social phenomena in which a
gradual change in an antecedent variable leads to a discontinuous jump in the consequence variable, i.e. a tipping
point (Lamberson and Page, 2012). While a trivial example of a tipping point could be de number of articles
published in Wikipedia, this is misleading. Although the explosion of articles in Wikipedia can be considered as
disproportionate, the important question to ask is if there was a discontinuous jump in such number. When a social
system is under certain conditions, equilibrium is present. However, when some conditions change, equilibrium is

What We Know and What We Need to Know on Public Procurement, pp. 146–151
149
broken and the system can go towards another equilibrium point or even to an unstable equilibrium. These
conditions are unable to produce tipping points. A system tips when a discontinuity is present in the system. This
leads to an abrupt change in some variables and represents a tipping point. Such tip can be produced through
positive feedback loops, similar to the suggested by Wesseling and Edquist (2108). It is important to distinguish
between direct tips and contextual tips. The former occurs if a change of a variable, produces a change of such
variable in the future whereas a contextual tip occurs when a change in a variable lead to change in some other
variable.
Following, I advance research propositions on demand-side policies by intertwining the policy process with the
concepts of tipping point – a generalist framework that may be useful to derive general patterns of policy dynamics.
RESEARCH METHOD
Since their inception in medical sciences in, scooping reviews have become more popular in social sciences as a
way to summarize existing literature in order to deliver enough depth and breadth about a specific discipline (Davis,
Drey, & Gould, 2009). On one hand, while systematic reviews of literature aim at comprehensively assess the
internal quality of studies, a scooping review can include varying degrees of quality and grey literature. On the other
hand, scooping reviews provide a more comprehensive approach than narrative reviews since the former includes
analysis and synthesis of literature instead of only providing a –sometimes cherry-picked- listing of research studies.
In this way, scooping reviews provide the nature, extent, and features of existing literature to summarize what is
known about the field and, particularly interesting, to identify apparent research gaps to further inquiry.
This study utilized the methodological framework by Arksey and O‘Malley (2005) and enhanced by Levac,
Colquhoun, and O'Brien (2010). This framework includes the following six steps: (1) identify the research question,
in a rather broad way so it can deliver enough breath, (2) identify relevant studies, seek strategies and terms should
be explicitly stated in terms of sources of information, time span, and language, (3) study selection, both inclusion
and exclusion criteria should be made explicit; these criteria are prone to be refined according to new findings and
familiarity with the field, (4) chart the data, a description of the gathered literature is presented as a starting point for
further analysis, (5) collate, summarize, and report results, a thematic construction of the literature is conducted to
provide a broad overview of the field, (6) consultation, an optional step in which practitioner input is sought. This
paper excluded the final step from the scooping review.
1) Identify the research question, in a rather broad way so it can deliver enough breath
This paper assumes that policy makers can be better informed on the effects of demand-oriented instruments on
development and commercialization of innovations. Given that the field is still emerging and existing reviews on
demand-oriented policies only summarize other studies, this paper aims at identifying information to discuss policy
demand-oriented instrument effectiveness and advancing research proposals. The research question guiding the
scoping review refers to what is the effectiveness to which demand-oriented policies and instruments are utilized to
foster innovation?
2) Identify relevant studies
To identify research articles, time span, language, sources of literature, and search terms were set beforehand. The
time span ran from 2000 to 2018. Preliminary readings on the topic informed on the publishing of seminal studies
on demand-oriented instruments and policies. Previous studies exist but they do not refer to the innovation focus that
guides the review. Language of choice was English to assure replicability of the review. Search on only academic
journals was conducted in the digital databases Scopus and Web of Knowledge since they include more high-
quality journals than other databases and journal listings. The search terms were set to reflect the broad aspects of
the demand-oriented perspective, innovation, and policy. The search term ‗demand-‘ was particularly challenging
since initial searches resulted in extensive searches in the broad discipline of economics beyond the focus on
innovation policies. According to the discussed inclusion criteria, the search resulted in 446 articles.
3) Study selection
Articles were screened using title, abstract, and key words, 368 articles were excluded kept since article domain was
in the scope of the review –innovation policy. This led to a final database of 78 peer-reviewed research articles1.
1 Full list of papers in the scooping review is available from the author upon request.

Pável R. M.
150
4) Chart the data
From the 78-articles final database, 25 are conceptual papers that advance different models and frameworks to
assess a number of policy and instruments in a number is industries. From the remaining 53 empirical papers, 31
papers refer to qualitative studies while only 20 papers include quantitative methodologies. Qualitative research
mainly involves case studies. Two papers involve mixed methods. After thematic classification of the 53 empirical
research papers by industry, 10 paper addresses energy issues, five papers analyze environmental technologies, five
papers analyze innovations in the pharmaceutical sector, three papers analyze innovations related to electric
automobiles, and three papers refers to IT innovations. Urban issues are addressed in five papers and government
policies are analyzed in by eight papers. The remaining 14 papers analyze issues in R&D as well as macroeconomic
issues related to such policies.
5) Collate, summarize, and report results
According to the available information in the papers, most of research on demand-oriented policies has been
conducted in European countries with 22 papers while studies in China and other Asian countries include six and
four papers, respectively. Five papers have been conducted with data of United States, and six papers conduct
comparative policy studies. The scooping review shed light on the nature of research conducted in the field of
demand-oriented innovation policies and instruments.
DISCUSSION
Tipping Points and Public Purchase of Innovations
From a procedural standpoint of demand-side policies, the policy process starts with the initialization of projects
which involve the participation of government, enterprises, and civil society in some cases. These projects depart
from the articulation of societal demand of innovation to solve problems across countries. Particularly, PPI
instruments shape the say to conceptualize, develop, and launch innovations. For tipping points to occur at this
stage, need to focus on the disruptive dimensions of innovations to meet societal needs. Contrary to incremental
innovations, disruptive innovations change previously set industry metrics and encroach from fringe markets
towards mainstream markets. Therefore:
Proposition 1: Demand-side instruments create tipping point during the initialization stage by linking societal
needs with disruptive innovations.
Designing innovations involve the participation of stakeholders beyond on supply and demand sides of markets.
Articulating demands and linking them to societal challenges requires the setting of expectative as well as ways of
interacting. The role of government is crucial to handle organizational and relational frictions but other participants
as academia of civil society may also interact in the ideation, design, and launch of innovative solutions. Given that
demand-side instruments initiate a project in pre-commercialization stages, involvement become higher than with
traditional innovation development activities inside a single organization. The new market structure can create
contextual tipping points in variables other than the innovation solution. Hence,
Proposition 2: Designing innovations using demand-side instruments create tipping points by creating new
market structures.
Once an innovation has launched to the market to fulfill a societal need, end-user start adopting the innovation and,
thus, the innovation diffuses. Diffusion process starts when the lead market has adopted the innovation. When
slower users start adopting the innovation, there is a disproportionate change in adoption due to a small change in
the number of products in the market. As the innovation has been designed and launched to the market following the
process of demand-side instruments, the likelihood of adoption is higher. As the innovation is adopted, a tipping
point may appear in the transition from lead market to the massive market. Therefore,
Proposition 3: Implementing and evaluating disruptive innovations by all stakeholders create tipping points at
the diffusion stage.
CONCLUSION
The scooping review of literature has revealed some well-researched areas of demand-side innovation policy across
industries and countries but in the overall, has lacked building upon a generalist social science models. This paper
introduces tipping point models as a way to build upon a model that allows researchers to find general patterns that
go beyond the idiosyncratic variables and local contexts.

What We Know and What We Need to Know on Public Procurement, pp. 146–151
151
This paper comes with some limitations. First, scooping review should be taken as preliminary since it lacks inter-coder reliability that assures replication of the review. Second, although the literature on tipping points is vast from a formal mathematical standpoint, this paper has kept the notation in narrative form. Third, the concept of demand-side policy is taken from the procedural point of view. Given the multiple definitions of demand-side instruments, other definitions can equally be considered. Future research can work on finding tipping points according to different perspectives ranging from the case studies to formal mathematic studies. Above all, the debate on innovation policies remains open and I wish other researchers engage in fruitful academic debates.
REFERENCES Acs, Z. J. (2008). Foundations of high impact entrepreneurship. Foundations and Trends in Entrepreneurship, 4(6),
535–620. ---------- (2010). High-impact entrepreneurship. In Z. J. Acs, & D. B. Audretsch (Eds.), Handbook of entrepreneur-
ship research: An interdisciplinary survey and introduction (pp. 165–182). New York, NY: Springer New York.
Acs, Z. J., & Correa, P. G. (2014). Identifying the obstacles to high-impact entrepreneurship in Latin America and the Caribbean. GMU School of Public Policy Research Paper, 5.
Arksey, H., & O'Malley, L. (2005). Scoping studies: Towards a methodological framework. International Journal of Social Research Methodology, 8(1), 19–32.
Bugge, M. M., Coenen, L., & Branstad, A. (2018). Governing socio-technical change: Orchestrating demand for assisted living in ageing societies. Science and Public Policy, 45(4), 468–479.
Davis, K., Drey, N., & Gould, D. (2009). What are scoping studies? A review of the nursing literature. International Journal of Nursing Studies, 46(10), 1386–1400.
Edler, J., & Georghiou, L. (2007). Public procurement and innovation—Resurrecting the demand side. Research Policy, 36(7), 949–963.
Edquist, C. (2011). Design of innovation policy through diagnostic analysis: Identification of systemic problems (or failures). Industrial and Corporate Change, 20(6), 1725–1753.
Edquist, C., & Zabala‐Iturriagagoitia, J. M. (2015). Pre‐commercial procurement: A demand or supply policy instrument in relation to innovation? R&D Management, 45(2), 147–160.
Felzensztein, C., Ciravegna, L., Robson, P., & Amorós, J. E. (2015). Networks, entrepreneurial orientation, and internationalization scope: Evidence from Chilean small and medium enterprises. Journal of Small Business Management, 53(1), 145–160.
Groba, F., & Cau, J. (2015). Chinese renewable energy technology exports: The role of policy, innovation and markets. Environmental and Resource Economics, 60(2), 243–283.
Henrekson, M., & Stenkula, M. (2010). Entrepreneurship and public policy. In Z. J. Acs, & D. B. Audretsch (Eds.), Handbook of entrepreneurship research: An interdisciplinary survey and introduction (pp. 595–637). New York, NY: Springer New York.
Jiang, C., Zhang, Y., Bu, M., & Liu, W. (2018). The effectiveness of government subsidies on manufacturing innovation: Evidence from the new energy vehicle industry in China. Sustainability, 10(6), 1692, 1–11.
Lamberson, P. J., & Page, S. E. (2012). Tipping points. Quarterly Journal of Political Science, 7(2), 175–208. Levac, D., Colquhoun, H., & O'Brien, K. K. (2010). Scoping studies: Advancing the methodology. Implementation
Science, 5(69),1–9. Li, Y., & Georghiou, L. (2016). Signaling and accrediting new technology: Use of procurement for innovation in
China. Science and Public Policy, 43(3), 338–351. OECD (1996). The knowledge-based economy. Paris: OECD. Powell, W. W., & Snellman, K. (2004). The knowledge economy. Annual Review of Sociology, 30, 199–220. Raiteri, E. (2018). A time to nourish? Evaluating the impact of public procurement on technological generality
through patent data. Research Policy, 47(5), 936–952. Saastamoinen, J., Reijonen, H., & Tammi, T. (2018). Should SMEs pursue public procurement to improve
innovative performance? Technovation, 69, 2–14. Stiglitz, J. E. (2002). Globalization and its discontents. New York, NY: W. W. Norton & Company, Inc. Stucki, T., Woerter, M., Arvanitis, S., Peneder, M., & Rammer, C. (2018). How different policy instruments affect
green product innovation: A differentiated perspective. Energy Policy, 114, 245–261. Su, Y. S., Lin, C. J., & Li, C. Y. (2016). An assessment of innovation policy in Taiwan's electric vehicle industry.
International Journal of Technology Management, 72(1–3), 210–229. Wesseling, J. H., & Edquist, C. (2018). Public procurement for innovation to help meet societal challenges: A
review and case study. Science and Public Policy, 45(4), 493–502.

152
3rd International Conference on Management & Entrepreneurship (3rd i-CoME) ISBN 978-602-5446-15-3
Phuket, 25th – 27th July 2019
EARNINGS QUALITY AND IPO UNDERPRICING IN INDONESIA
Billy Purnawan
1, Stevanus Pangestu
2
1Faculty of Economics and Business, Atma Jaya Catholic University of Indonesia, Indonesia
2Faculty of Economics and Business, Atma Jaya Catholic University of Indonesia, Indonesia
Email: [email protected]
ABSTRACT The purpose of this research is to analyze the influence of earnings quality on IPO underpricing in Indonesia Stock Exchange.
Earnings Quality is measured with earnings management, which is computed using Modified Jones model. A high level of
discretionary accruals indicates a lower quality of earnings. A number of 115 IPOs from 2013 until 2018Q3 were examined. Our
cross-sectional OLS analysis on Eviews econometric package finds that earnings quality negatively influences underpricing, i.e. a
lower quality of earnings leads to higher underpricing. This finding corresponds with Spence‟s Signaling theory. Other regressors
that statistically affect underpricing include firm age, offer price, and offer size. Finally, we can conclude that the Indonesian
stock market is not efficient.
Keywords: Earnings quality, underpricing, initial public offering, discretionary accrual.
INTRODUCTION
The capital market is a medium for corporations to sell financial instruments, e.g. equity shares and bonds. The
proceeds from the conducted transactions are used by the issuers to finance daily operations, capital expenditure, or
strengthen capital structure. One of the popular alternatives to raise capital is by executing initial public offering
(IPO). It is the first sale of stock issued by a corporation to the general public. IPO increases corporations‟ value,
reputation, and sustainability, while also enabling them to obtain tax incentives1. In the event of an IPO, a
corporation employs the services of an underwriter to execute the offering process. Their collaboration would
produce a legal document called as prospectus. According to Law No. 8 of 1995 on Capital Market, a prospectus is
prepared to provide potential investors with written information related to the IPO, such as company profile, future
use of IPO funds, business risk, information on creditors, financial statements, and business projections. Stock
subscription form is also provided inside the prospectus.
As displayed in Figure 1, the number of IPOs in Indonesia fell from 2014 to 2016. It rebounded in 2017 with more
than double the number of IPOs in the preceding year. As of September 2018, 36 corporations have gone public
during the year. The number of IPO is still predicted to grow, particularly when we consider the number of growing
Indonesian start-ups. Indonesia has 1,706 start-ups, which is 4th most in the world
2. Additionally, the Indonesia
Stock Exchange plans to facilitate start-ups that are planning to go public3.
Lowry, Michaely, and Volkova (2017) found that a third of IPOs in the United States underperformed and (at the
end) delisted due to various risks. In spite of this, IPO is still the best financing activity to raise capital, compared to
its alternatives such as acquisitions. Therefore, it is important to measure the success of an IPO. One of the apparent
IPO phenomena is underpricing, which occurs when the IPO offer price is lower than the stock‟s closing market
price. It is in the best interest of the company that underpricing does not occur because it indicates that the obtained
funds are not optimal. We can use underpricing as a measure of IPO performance from the perspective of the
offering corporation.
1 https://gopublic.idx.co.id/2016/06/22/manfaat-go-public/ 2 https://www.liputan6.com/tekno/read/3276742/indonesia-punya-startup-terbanyak-di-dunia-setelah-as-dan-inggris 3 https://www.cnnindonesia.com/ekonomi/20180830134840-92-326160/bei-permudah-startup-dalam-mencatatkan-saham-baru
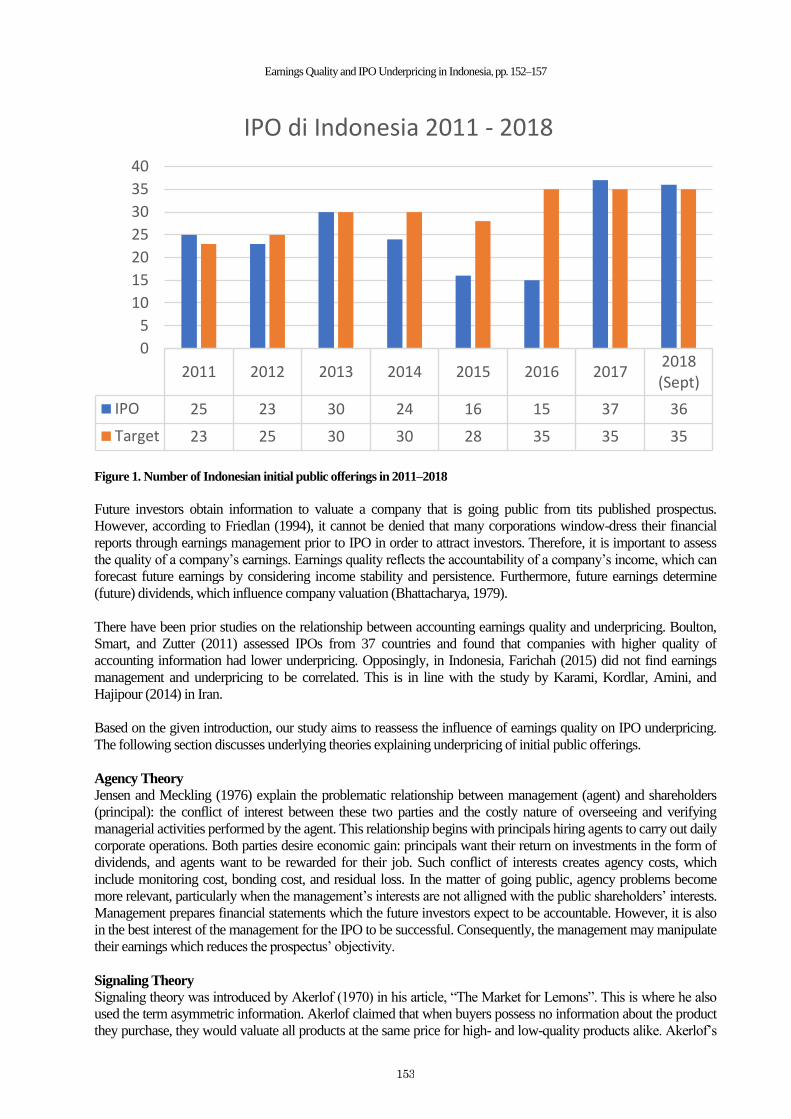
Earnings Quality and IPO Underpricing in Indonesia, pp. 152–157
153
Figure 1. Number of Indonesian initial public offerings in 2011–2018
Future investors obtain information to valuate a company that is going public from tits published prospectus.
However, according to Friedlan (1994), it cannot be denied that many corporations window-dress their financial
reports through earnings management prior to IPO in order to attract investors. Therefore, it is important to assess
the quality of a company‟s earnings. Earnings quality reflects the accountability of a company‟s income, which can
forecast future earnings by considering income stability and persistence. Furthermore, future earnings determine
(future) dividends, which influence company valuation (Bhattacharya, 1979).
There have been prior studies on the relationship between accounting earnings quality and underpricing. Boulton,
Smart, and Zutter (2011) assessed IPOs from 37 countries and found that companies with higher quality of
accounting information had lower underpricing. Opposingly, in Indonesia, Farichah (2015) did not find earnings
management and underpricing to be correlated. This is in line with the study by Karami, Kordlar, Amini, and
Hajipour (2014) in Iran.
Based on the given introduction, our study aims to reassess the influence of earnings quality on IPO underpricing.
The following section discusses underlying theories explaining underpricing of initial public offerings.
Agency Theory
Jensen and Meckling (1976) explain the problematic relationship between management (agent) and shareholders
(principal): the conflict of interest between these two parties and the costly nature of overseeing and verifying
managerial activities performed by the agent. This relationship begins with principals hiring agents to carry out daily
corporate operations. Both parties desire economic gain: principals want their return on investments in the form of
dividends, and agents want to be rewarded for their job. Such conflict of interests creates agency costs, which
include monitoring cost, bonding cost, and residual loss. In the matter of going public, agency problems become
more relevant, particularly when the management‟s interests are not alligned with the public shareholders‟ interests.
Management prepares financial statements which the future investors expect to be accountable. However, it is also
in the best interest of the management for the IPO to be successful. Consequently, the management may manipulate
their earnings which reduces the prospectus‟ objectivity.
Signaling Theory
Signaling theory was introduced by Akerlof (1970) in his article, “The Market for Lemons”. This is where he also
used the term asymmetric information. Akerlof claimed that when buyers possess no information about the product
they purchase, they would valuate all products at the same price for high- and low-quality products alike. Akerlof‟s
2011 2012 2013 2014 2015 2016 20172018(Sept)
IPO 25 23 30 24 16 15 37 36
Target 23 25 30 30 28 35 35 35
0
5
10
15
20
25
30
35
40
IPO di Indonesia 2011 - 2018

Billy P. and Stevanus P.
154
work was advanced by Spence (1973), who declares that a good firm would be able to differentiate itself from the
rest by sending a “good” or positive signal about its quality to the market. This signaling process enables financial
instruments to become the media for showcasing the value of the firm. Financial statement numbers are the medium
for managers to send signals to prospective investors during IPO. A good financial performance is a positive signal
from the perspective of investors, indicates potential growth.
Efficient Market Hypothesis
Market efficiency, developed by Fama (1970), refers to how stock prices reflect their underlying value through the
available information in the market. There are three forms of market efficiency: (i) weak form; current stock prices
reflect past prices, (ii) semi-strong form; current prices reflect all publicly available information, and (iii) strong
form; current prices reflect all available information, whether they are published or not (public or private).
Hypothesis Development
A priori, corporations that are going public want their offered shares to be completely sold. To attract investors,
corporations hire underwriters to assist them in book-building, determining the optimum IPO offer price, as well as
prospectus-writing. Financial information, which may be of the most interest to stakeholders, is included in the
prospectus. Managers are enabled to transmit positive signal to potential investors through accounting information,
specifically earnings. Furthermore, Boulton et al. (2011) find that corporations experience lower underpricing when
they generate quality accounting information.
H1: Earnings quality significantly influences underpricing
RESEARCH METHODS
Dependent Variable: Underpricing
Underpricing (UP) is defined as a condition where stock offer price is lower than the stock‟s closing price at the
secondary market on its first day of trade. Its formula, according to Gunther and Rummer (2006) is:
UP =
where CPFD is the closing price at first day of trade and PIPO is the IPO price. If the value of UP is positive, then the
occurrence of underpricing is determined.
Independent Variable The regressor in this study is Earnings Quality (EQ). It refers to the quality of the number of earnings presented in
the IPO prospectus. EQ is measured with Discretionary Accruals (Jones, 1991). It reflects the portion of accruals
that are due to management‟s choices. It is a proxy for earnings management. Low earnings management indicates
higher quality of earnings, vice versa. The following is the formula to measure Discretionary Accruals, as developed
by Kothari, Leone, and Wasley (2005):
[
] [
] [
] [
]
where DA is Discretionary Accruals, TAit is the total accruals (difference between net income and operating cash
flow) of company i in year t, Ait-1 is the total assets of company i in the year preceding year t, ∆REVit is the change in
Sales of company i from year t-1 to t, ∆RECit the change in Receivables of company i from year t-1 to t, PPEit is the
total ofixed assets of company i in year t, and ROAit is the return on assets rate of company i in year, and Ꜫit is the
residuals, i.e. the discretionary accruals itself.
Control Variables
We also control for variables that are empirically demonstrated to influence underpricing: company size (Boubaker
& Mezhoud, 2011), company age (Lowry, Officer, & Schwert, 2010), leverage, IPO price, offer size, and
underwriter reputation:
1. Company Size (SIZE)= Natural logarithm of a company‟s total assets
2. Company Age (AGE)= IPO year – Establishment year
3. Leverage, measured with debt-to-equity ratio (DER)= Long Term Liabilities / Total Equity.
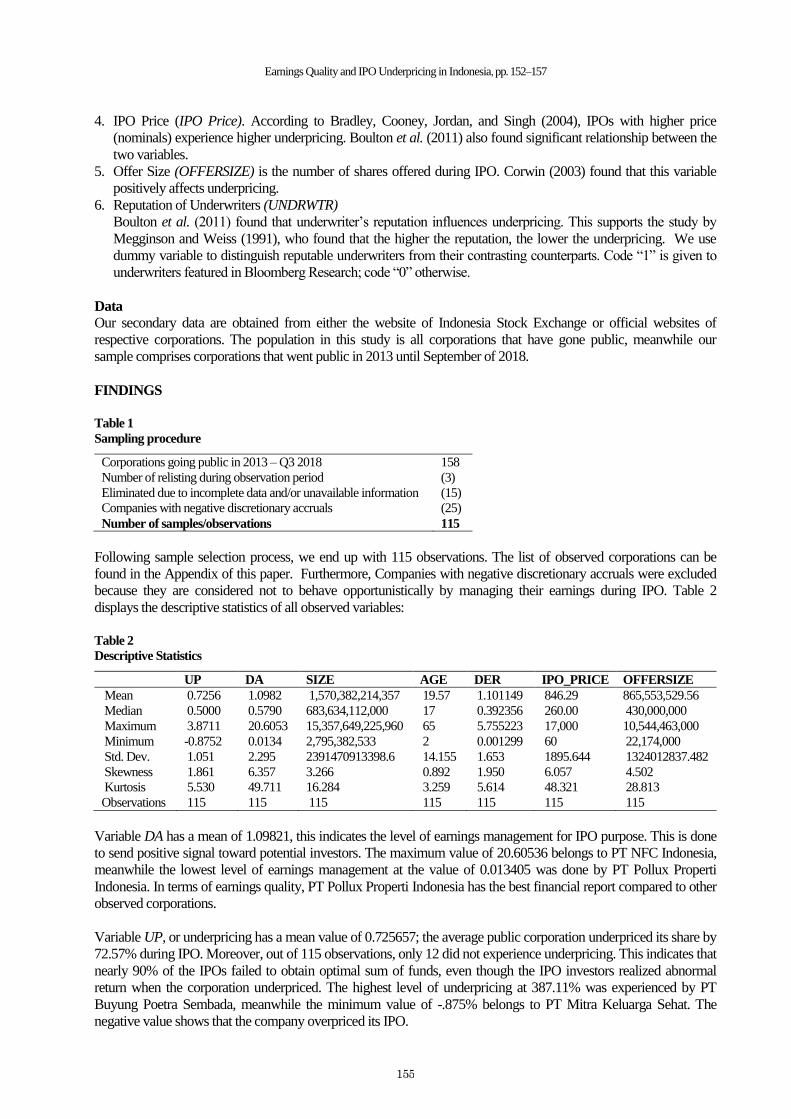
Earnings Quality and IPO Underpricing in Indonesia, pp. 152–157
155
4. IPO Price (IPO Price). According to Bradley, Cooney, Jordan, and Singh (2004), IPOs with higher price
(nominals) experience higher underpricing. Boulton et al. (2011) also found significant relationship between the
two variables.
5. Offer Size (OFFERSIZE) is the number of shares offered during IPO. Corwin (2003) found that this variable
positively affects underpricing.
6. Reputation of Underwriters (UNDRWTR)
Boulton et al. (2011) found that underwriter‟s reputation influences underpricing. This supports the study by
Megginson and Weiss (1991), who found that the higher the reputation, the lower the underpricing. We use
dummy variable to distinguish reputable underwriters from their contrasting counterparts. Code “1” is given to
underwriters featured in Bloomberg Research; code “0” otherwise.
Data
Our secondary data are obtained from either the website of Indonesia Stock Exchange or official websites of
respective corporations. The population in this study is all corporations that have gone public, meanwhile our
sample comprises corporations that went public in 2013 until September of 2018.
FINDINGS
Table 1
Sampling procedure
Corporations going public in 2013 – Q3 2018 158
Number of relisting during observation period (3)
Eliminated due to incomplete data and/or unavailable information (15)
Companies with negative discretionary accruals (25)
Number of samples/observations 115
Following sample selection process, we end up with 115 observations. The list of observed corporations can be
found in the Appendix of this paper. Furthermore, Companies with negative discretionary accruals were excluded
because they are considered not to behave opportunistically by managing their earnings during IPO. Table 2
displays the descriptive statistics of all observed variables:
Table 2
Descriptive Statistics
UP DA SIZE AGE DER IPO_PRICE OFFERSIZE
Mean 0.7256 1.0982 1,570,382,214,357 19.57 1.101149 846.29 865,553,529.56
Median 0.5000 0.5790 683,634,112,000 17 0.392356 260.00 430,000,000
Maximum 3.8711 20.6053 15,357,649,225,960 65 5.755223 17,000 10,544,463,000
Minimum -0.8752 0.0134 2,795,382,533 2 0.001299 60 22,174,000
Std. Dev. 1.051 2.295 2391470913398.6 14.155 1.653 1895.644 1324012837.482
Skewness 1.861 6.357 3.266 0.892 1.950 6.057 4.502
Kurtosis 5.530 49.711 16.284 3.259 5.614 48.321 28.813
Observations 115 115 115 115 115 115 115
Variable DA has a mean of 1.09821, this indicates the level of earnings management for IPO purpose. This is done
to send positive signal toward potential investors. The maximum value of 20.60536 belongs to PT NFC Indonesia,
meanwhile the lowest level of earnings management at the value of 0.013405 was done by PT Pollux Properti
Indonesia. In terms of earnings quality, PT Pollux Properti Indonesia has the best financial report compared to other
observed corporations.
Variable UP, or underpricing has a mean value of 0.725657; the average public corporation underpriced its share by
72.57% during IPO. Moreover, out of 115 observations, only 12 did not experience underpricing. This indicates that
nearly 90% of the IPOs failed to obtain optimal sum of funds, even though the IPO investors realized abnormal
return when the corporation underpriced. The highest level of underpricing at 387.11% was experienced by PT
Buyung Poetra Sembada, meanwhile the minimum value of -.875% belongs to PT Mitra Keluarga Sehat. The
negative value shows that the company overpriced its IPO.

Billy P. and Stevanus P.
156
SIZE shows a mean value of Rp1.570 trillion, a maximum value of Rp15.35 trillion (PT Tugu Pratama Indonesia),
and minimum value of Rp2.79 billion (PT MAP Aktif Adiperkasa. AGE shows that the average company had been
in operation for 19.57 years before performing IPO. The oldest corporation that went public PT Malacca Trust
Wuwungan Insurance at 65 years old, and the youngest corporation was PT Waskita Beton Precast, PT Alfa Energi
Investama, and PT Kioson Komersial at just two years of age. Finally, the variable DER shows that during IPO, the
highest-leveraged corporation was PT Sarana Meditama Metropolitan (5.755223) and the lowest-leveraged
corporation (.001299) was PT Sido Muncul. Meanwhile the average DER value is 1.101149; prior to going public,
the average corporation relied more on debt for its financing.
Table 3
Frequency of underwriters’ reputation
Variable Value Frequency Percent (%)
UNDRWRTR 1 94 81.73
0 21 18.26
IPO_Price shows that the average offer price is Rp846. The highest price at Rp17.000 was offered by PT Mitra
Keluarga Karyasehat, meanwhile the cheapest IPO was offered by PT Prima Cakrawala Abadi at Rp60 per share.
Control variable OFFERSIZE shows that the average IPO offered 865.5 million shares. The greatest number of
shares was offered by PT Waskita Beton Precast at 10.54 billion shares and the least number was offered by PT
MAP Boga Adiperkasa at 22.17 million shares. Lastly, UNDRWRTR shows that 94 out of 115 corporations
employed reputable underwriters for their IPOs (refer to Table 3).
Regression Analysis
Prior to conducting multiple regression test, the model was tested for OLS classical assumptions and we can
conclude that: (i) the residuals of the regression model are normally distributed, (ii) there are no multicollinearity and
autocorrelation problems, and (iii) the model is homoskedastic. Therefore, BLUE is achieved and the following
table displays the results of the regression analysis:
Table 4
Regression Results, Predicted Variable: Underpricing (UP)
Estimation OLS
C 7.094721(3.071474)
LN_DA 0.129187(1.732700)*
SIZE 0.042348 (0.978457)
LN_AGE -0.234254 (-2.114467)**
DER -0.055137 (-0.961470)
IPO_PRICE -0.343827 (-3.701686)***
LN_OFFERSIZE -0.235805 (-2.203848)**
UNDRWRTR 0.336740 (1.291816)
Adjusted R-Squared 0.123650
F-Statistic 3.297856***
S.E. of regression 0.984282
We measure earnings quality with discretionary accruals. A positive number of discretionary accruals indicates that
a company dilates its earnings figure. Therefore, a higher value of discretionary accruals reveals a lower quality of
earnings. Table 4 shows LN_DA to be a positive and statistically significant regressor of UP at .1 level of
significance. This signifies that the higher the discretionary accruals, the lower the earnings quality, and the higher
the underpricing. Thus, earnings quality has a negative relationship with underpricing. This supports the finding of
Boulton et al. (2011), who found that underpricing is lower for corporations with higher quality of accounting
information.
The causal relationship between earnings quality and underpricing signifies that the signal sent by companies have
been caught and responded by the general investors. High profitability attracts investors; it is a sign of probable
future growth. An IPO investor valuates the financial fundamentals of IPO companies through their prospectuses.
However, the financial performance, specifically the earnings (or net income), is the result of window-dressing

Earnings Quality and IPO Underpricing in Indonesia, pp. 152–157
157
performed by corporate directors. IPO is a landmark for any corporation, and it is in the best interest of all
stakeholders for the process to succeed. Descriptive statistics show that 82% of Indonesian firms going public in
2013 until 2018Q3 managed their earnings. Moreover, 89.5% of the IPO companies underpriced their shares;
enabling investors to gain abnormal return.
CONCLUSION
In summary, earnings quality negatively influences underpricing; the lower the quality of earnings, the higher the
underpricing. Our finding further supports Signaling theory. During the IPO process, corporate directors manage
their earnings to transmit positive signal to the public regarding the company‟s future prospects, in order to
completely sell the IPO shares. Additionally, control variables (i) firm age, (ii) IPO price, and (iii) offer size are
shown to influence IPO initial return. Finally, the underpricing phenomenon also shows that investors experience
from IPO events. We can conclude that the Indonesian capital market is not efficient.
REFERENCES
Akerlof, G. A. (1970). The markets for „lemons‟: Quality uncertainty and the market mechanism. The Quarterly
Journal of Economics (The MIT Press), 84(3), 488–500.
Bhattacharya, S. (1979). Imperfect information, dividend policy, and “the bird in the hand” fallacy. The Bell Journal
of Economics, 10(1), 259–270.
Boubaker, A., & Mezhoud, M. (2011). Impact of managerial ownership on operational performance of IPO firms:
French context. International Journal of Management Science and Engineering Management, 6(3), 191–197.
Boulton, T. J, Smart, S. B., & Zutter, C. J. (2011). Earnings quality and international IPO underpricing. The
Accounting Review, 86(2), 483–505.
Bradley, D. J, Cooney, J. W., Jordan, B. D., & Singh, A. K. (2004) Negotiation and the IPO offer price: A
comparison of integer vs. non-integer IPOs. Journal of Financial and Quantitative Analysis, 39(3), 517–540.
Corwin, S. A. (2003). The determinants of underpricing for seasoned equity offers. The Journal of The American
Finance Association, 58(5), 2249–2279.
Fama, E. F. (1970). Efficient capital markets: A review of theory and empirical work. Journal of Finance, 25(2),
383–417.
Farichah. (2015). Hubungan manajemen laba, reputasi underwriter, dan reputasi auditor dengan besaran
underpricing serta pengaruh besaran underpricing pada volume perdagangan saham perdana selama
periode stabilisasi. Unpublished doctoral dissertation, Universitas Gadjah Mada, Yogyakarta, Indonesia.
Friedlan, J. M. (1994). Accounting choices of issuers of initial public offerings. Contemporary Accounting
Research, 11(1), 1–31.
Gunther, S. & Rummer, M. (2006). The hot-issue period in Germany: What factors drove IPO underpricing? In
initial public offerings: An international perspective. 1st Edition. Burlington: Elsevier.
Jensen, M. C., & Meckling, W. H. (1976). Theory of the firm: Managerial behavior, agency cost, and ownership
structure. Journal of Financial Economics, 3, 305–360.
Jones, J. J. (1991) Earnings management during import relief investigations. Journal of Accounting Research, 29(2),
193–228.
Karami, G., Kordlar, A. E., & Amini, Y. & Hajipour, S. (2014). Earnings management and underpricing of initial
public offerings (IPO), evidence from Iran. International Business Research, 7(7), 156–163.
Kothari, S. P., Leone, A. J., & Wasley, C. E. (2005). Performance matched discretionary accrual measures. Journal
of Accounting and Economics, 39(1), 163–197.
Lowry, M., Michaely, R., & Volkova, E. (2017). Initial public offerings: A synthesis of the literature and directions
for future research. Foundations and Trends in Finance, 11(3–4), 154–320.
Lowry, M., Officer, M. S., & Schwert, G. W. (2010). The variability of IPO initial returns. The Journal of Finance,
65(2), 425–465.
Megginson, W. L., & Weiss, K. A. (1991). Venture capitalist certification in initial public offerings. The Journal of
Finance, 46(3), 879–903.
Spence, M. (1973). Job market signaling. The Quarterly Journal of Economics, 87(3), 355–374.