a rechargeable battery employing a reduced polyacetylene anode and a titanium disulfide cathode
TRANSCRIPT

doi: 10.1149/1.21154001984, Volume 131, Issue 12, Pages 2744-2750.J. Electrochem. Soc.
Josip Caja, Richard B. Kaner and Alan G. MacDiarmid Polyacetylene Anode and a Titanium Disulfide CathodeA Rechargeable Battery Employing a Reduced
serviceEmail alerting
click herethe box at the top right corner of the article or Receive free email alerts when new articles cite this article - sign up in
http://jes.ecsdl.org/subscriptions go to: Journal of The Electrochemical SocietyTo subscribe to
© 1984 ECS - The Electrochemical Society

2744 J. Electrochem. Soc.: E L E C T R O C H E M I C A L
38. R. G. Burns, "Battery Material Symposium, Vol. I," A. Kozawa, and M. Nagayama, Editors, p. 197, Brussels 1983, published by BMRA, Cleveland, OH (1984).
39. R. G. Burns and V. M. Burns, in "Proceedings of the Manganese Dioxide Symposium," Vol. 1, Cleveland 1975, A. Kozawa and R. J. Brodd, Editors, paper 16, p. 306, I.C. Sample Office, Cleveland, OH, "Proceed- ings of the Manganese Dioxide Symposium," Vol. 2, Tokyo 1980, B. S c h u m m , H. M. Joseph, and A. Kozawa, Editors, paper 6, p. 97, I.C. Sample Office, Cleveland, OH.
40. S. Turner and P. R. Buseck, Nature, 304, 143 (1983). 41. J. P. Brenet, J. P. Gabano, and M. Seigneurin, 16.
Congr~s. Int. de Chimie Pure et Appliqu6e, Sedes, Paris 1957. D. 69.
42. P. M. de Wolff, J. W. Visser, R. Giovanol i , and R. Brtitsch, Chimia, 32, 257 (1978).
43. R. D. Shannon,Acta CrystaItogr.,Sect.A, 32, 751(1976). 44. J. Brenet, P. Malesson, and A. Grund, C.R. hebd. S~-
ances Acad. Sci., 242, 111 (1956). 45. W. Fe i tknech t , H. R. Oswald, and U. Fe i tknech t -
Steinmann, Helv. Chim. Acta~ 43, 1947 (1960).
S C I E N C E A N D T E C H N O L O G Y December 1984
46. R..Giovanoli and U. Leuenberger, ibid., 52, 2333 (1969), m particular p. 2345.
47. W. C. Maskell, J. E. A. Shaw, and F. L. Tye, EIectrochim. Acta, 26, 1403 (1981).
48. W. C. Maskell, J. A. E. Shaw, and F. L. Tye, J. Appl. Electrochem., 12, 101 (1982).
49. P. Ruetschi, ibid., 12, 109 (1982). 50. R. Giovanoli and B. Balmer, Chimia, 37, 424 (1983). 51. S. B. Kanungo, K. M. Parida, and B. R. Sant, Electro-
chim. Acta, 26, 1147 (1981). 52. H. Kahil, F. Dalard, J. Guitton, and J. P. Cohen-Addad,
Surf. Technol., 16, 331 (1982). 53. A. M. Bystr6m, Acta Chem. Scand., 3, 163 (1949). 54. W. C. Maskell, J. E. Shaw, and F. L. Tye, Electrochim.
Acta, 28, 225 (1983). 55. K. J. Euler and T. Harder, ibid., 26, 1661 (1981). 56. S. Atlung and T. Jacobson, ibid., 26, 1447 (1981). 57. W. C. Maskell, J. E. Shaw, and F. L. Tye, J. Power
Sources, 8, 113 (1982). 58. A. Kozawa, "Power Sources," Vol. 7, J. Thompson, Edi-
tor, p. 485, Academic Press, London (1979). 59. T. Ohzuku and T. Hirai, Private communication.
A Rechargeable Battery Employing a Reduced Polyacetylene Anode and a Titanium Disulfide Cathode
A
Josip Caja, *,~ Richard B. Kaner,* and Alan G. MacDiarrnid* Department of Chemistry, University of Pennsylvania, Philadelphia, Pennsylvania 19104
ABSTRACT
Novel rechargeable battery cells have been constructed using a reduced form of the conducting organic polymer, po]yacetylene, as the anode, the inorganic intercalating material, t i tanium disulfide as the cathode, and either 1.0M LiC104 in THF or 1.0M NaPF~ in THF as the nonaqueous electrolyte. A feasibility study of the cells is described. It in- cludes constant current discharge characteristics, stability, and rechargeability. The cells exhibited good stability and reversibility. Their performance was cathode limited, owing to the method used for fabricating the TiS~ electrode.
Considerable interest has been shown during the past four years in the use of conducting organic polymers as electroactive materials (1). The prototype conducting polymer, polyacetylene, (CH)~, can be reversibly oxidized or reduced electrochemically and has been studied pri- marily as a cathode-active material in rechargeable cells employing a lithium anode (2). Since the reduced form of (CHL, e.g., [Li,+(CH)-Y]~, is stable up to a reduction level of -10 mole percent (m/o), i.e., y = 0.1, in an electrolyte of 1.0M LiC104 in tetrahydrofuran (3), it has potential for use as an anode-active material, in conjunction with a suitable cathode, in a rechargeable battery.
Inorganic intercalating materials, primarily t i tanium disulfide, TiS2, have also been extensively studied as the cathode in rechargeable li thium cells (4, 5). The feasibility of combining an inorganic intercalating cathode, such as TiS~, with a conducting organic polymer anode, such as reduced (CH).~., is reported in the present study. A cell of this type has the advantage of avoiding the major prob- lems associated with a l i thium anode, specifically, reac- tion of the lithium electrode with the organic electrolyte and inadequate cycle life due to the growth of l i thium dendrites.
The terms "doping," "intercalation," and "oxidation/re- duction" have often been used interchangeably when referring to the process which increases the conductivity of an organic polymer, such as (CH)~., by introducing small quantities of foreign species into the organic poly- mer matrix. In order to avoid confusion, it is desirable to distinguish between these three terms. The doping of an organic polymer, such as (CH)~, is different from the doping of a classical semiconductor, such as silicon. If,
Present address: Oak Ridge Precision Industries, Incorpora- ted, Oak Ridge, Tennessee 37830.
* Electrochemical Society Active Member.
for example, a crystal of silicon is n-doped by replacing a silicon atom with a phosphorus atom (which has one val- ence electron more than Si), the phosphorus represents a negative site in so far as the crystal lattice is concerned, even if no charge transfer between silicon and phospho- rus were to occur. However, the n-doping of a conducting organic polymer, such as (CH).r, refers to the addition of a given number of electrons to the polymer chains together with a corresponding number of counter cations needed to maintain electrical neutrality. Conducting polymers generally require much higher doping levels than clas- sical inorganic semiconductors in order to effect compa- rable electronic changes. Intercalation refers to the or- derly insertion of a molecule or ion into the crystal lattice of a layered "host" material. Oxidation or reduction of the host material by either chemical or electrochemical means may occur during this process. Intercalation of l i thium or sodium into TiS~, for example, has been shown (5) to involve an almost complete electron transfer from the alkali metal with concomitant reduction of the TiS~ to give species such as M,+(TiS~) -" (y < 1; M = Li or Na). Throughout this paper, the incorporation of l i thium or so- dium cations into TiS.~ will be termed "intercalation," while the incorporation of lithium or sodium cations into (CH).x. will be termed "reduction."
When carrying out electrochemical studies on trans- polyacetylene, a semiconductor, it is important to note that pure, neutral (CHL. can exhibit an open-circuit volt- age, Vow, lying in the range between 1.8V, below which significant reduction begins to occur, and 3.1V, above which significant oxidation begins to occur (6). These po- tentials are given with respect to the Li~/Li couple in 1.0M LiC10~ in THF for the reduction reaction and in 1.0M LiC104 in propylene carbonate for the oxidation reaction. This variation in potential results from the slightly differ-

Vol. 131 ,No . 12
ent ways in which the film has been previously stored or handled. The sensitivity of the potential to the previous history of the film is caused by the extremely small num- ber of molecular orbitals (i.e., density of states) lying be- tween the highest filled pi bonding molecular orbital (at the top of the valence band) and the lowest empty pi antibonding molecular orbital (at the bOttom of the con- duction band) with which reduction or oxidation pro- cesses are associated. Thus, the transfer of an infinites- imally small number of coulombs into or out of the (CH)~ can lower its potential toward 1.8V or raise its potential toward 3.1V, respectively.
Experimental Materials and reagents.--cis-Rich (CH)~ film was pre-
pared as previously described (7). Tetrahydrofuran (THF) (Fisher Scientific Company) was freshly distilled from sodium benzophene in vacuo and was used to make a 1.0M solution of LiC10~ and a 1.0M solution of NaPF~. An- hydrous LiC104 (Alfa Ventron) was dried by melting un- der a dynamic vacuum. Anhydrous NaPF6 (Aldrich Chemical Company) was dried by heating at 120~ under a dynamic vacuum for 24h. Titanium disulfide, TiS~, was synthesized directly from elemental t i tanium and sulfur in an evacuated, sealed silica hot/cold tube at 500~176 by chemical vapor transport (8). Lithium metal (Alfa Ventron) and sodium metal (J. T. Baker Company) were scraped with a knife in a dry argon atmosphere immedi- ately before use. Glass filter paper (Reeve Angel 934AH), dried at 600~ for 24h, was employed as the separator.
Cell construction.--All measurements were performed using celis, shown in Fig. 1, constructed in a dry argon at- mosphere by placing separators between the electrodes, squeezing the assembly into 4 x 10 x 50 mm rectangular glass tubing (Vitro Dynamics, Incorporated), adding the electrolyte, freezing the cell contents with liquid N~, and sealing the cell under vacuum across the protruding elec- trode leads. The (CH)~ electrode was made from a 2.5 -+ 0.1 mg strip of (CH)~ film (-0.7 cm 2) mechanically pressed onto 52 mesh platinum gauze, to which had been spot welded a platinum wire lead. The lithium or sodium electrode was made by pressing a (~0.7 cm 2) piece of 0.13 mm thick lithium ribbon or a (~0.7 cm 2) strip of sodium into a 189 mesh nickel grid (Delker Corporation), to which had been spot welded a nickel-chromium wire lead. The TiS2 electrode was made by pressing a TiSJTeflon mix- ture in the form of a flat sheet (~0.1 mm thick) into the center of a nickel grid, to which had been spot welded a nickel-chromium wire lead. The TiSJTeflon flat sheet was made by mixing and then pressing a two-to-one mix- ture, by weight, of TiS2 powder and Teflon powder onto the bottom of a mortar by means of a pestle. The (CH)x electrode was placed in the center of the cell with the TiS~ electrode on one side and the alkali metal electrode on the other side. The electrodes were separated from each other by the glass filter paper separators.
Fig. 1. Construction of the [Mo.,,~(CH)-~"~ cell. Lithium or so- dium metal serves as a reference electrode:
RECHARGEABLE BATTERY 2745
Preparation of the reduced polyacetyIene anode.--The [Mo, lo~(CH)-~176 (M = Li or Na) anode was prepared in situ in a cell of the type described above by electro- chemically reducing the cis-rich (CHL. to [M0.,0~(CH)-0.'0]~. at a constant current of 0.1 mA (-2 m/o reduction/h) ap- plied between the (CH)x electrode and the alkali metal electrode, cis-Rich (CH)~ was used in the cell construction since it is more flexible than the trans-rich isomer. The reduced (CH)x was then oxidized at a constant current of 0.1 mA until a voltage of -2.4V (vs. Li), characteristic of neutral (CH)~, was reached. Electrochemical reduction followed by oxidation back to neutral (CH)x converts cis- rich (CH)x to the more thermodynamically stable trans- rich (CH)~ (9). The trans-rich (CH)~ so formed was then re- duced to a 10.0 m/o reduction level using the same conditions as described above and was permitted to stand for 12h, in order to permit diffusion of the alkali metal cations throughout the 200A diam (CH)x fibrils, before commencing with the electrochemical studies.
The [-M0.,0~(CH)-0.~0]~ (M = Li or Na) obtained in this way and the TiS2 electrode constituted the cell in its charged state. The alkali metal electrode thus served a dual role: first in the preparation of the reduced (CH)~ anode, and second as a reference electrode during the studies de- scribed below. All discharge studies were carried out to 0 V between the (CH)~ anode and the TiS2 cathode and were performed at room temperature. All voltages are given with respect to a lithium or sodium reference elec- trode. The first discharge/charge cycle of each cell was ignored.
Results Discharge~charge characteristics of [LiQ.~o~(CH)-O.lO]~/
TiS2 cells.--These studies were carried out on two [Lio.,0+(CH)-~176 cells containing different molar ra- tios of [Lir176176 and TiS2. The use of different mo- lar ratios permitted the final intercalation level, y, in Li~+(TiS2) -y, obtained after discharge, to be varied as de- sired. Cells of this type displayed an open-circuit voltage, Vow, of ~1.65V.
Use of a 1:1 molar ratio [Lio.,o+(CH)-~176 cell .--The net electrochemical reaction taking place during the dis- charge process is given by Eq. [1]
[Li(,.,0+(CH)-~176 + xTiS., ~ (CH)~ + xLi0.,o+(TiS,) -0-~o [l]
The relationship between cell discharge voltage, Vd, and time for representative discharges to 0 V at constant cur- rents of 0.2 and 0.1 mA are shown in Fig. 2, curves 1 and 2, respectively. Each charge was carried out first at a con- stant current to 1.8V and then at a constant applied poten- tial of 1.8V for 48h. The 1.8V charging potential was used to complete the conversion of the electrode material to [Li0.~0~(CH)-~176 and TiS~. Each cell discharge was com- pletely reversible, as can be seen from Table I by comparing the coulombs involved in a discharge process,
2.0
1.5
I I
> 1.0
>--o 0.5 1 2 _
0 l o o 2 0 0 5 0 0
TIME (rnin) Fig. 2. Relationship between the discharge voltage, Vd and time, dur-
ing the discharge of a 1:1 molar ratio [Lio.,o+(CH)-~176 cell at 0.2 mA (curve 1) and 0.1 mA (curve 2).
2746 J. Electrochem. Soc.: E L E C T R O C H E M I C A L S C I E N C E A N D T E C H N O L O G Y December 1984
Table I. Electrochemical characteristics of [My+(CH)-Y]x/TiS~ cells
Extent Calculated of cell Specific coulombs reaction Average energy of
Constant i Current for 100% Discharge when V~ = Charge discharge reactant Molar ratio discharge density ~ discharge b Q(out) c 0 V b Q c J voltage Vd materials
[M0.~j(CH)-~176 Cell discharge reaction (mA) (A/kg) (C) (C) (%) (C) (V) (Wh/kg) ~
1:1 [Li0.1.+(CH)-~176 + xTiS, -~ 0.1 4.3 1.79 1.40 78 1.39 0.83 13.8 (CH)., + xLi..,,,~(TiS.,) -~176 0.2 8.6 1.79 1.15 64 1.12 0.56 7.5
10[Li,.,)+(CH)-('.'~ + xTiS~ 10:1 0.1 16.6 1.86 0.91 49 0.89 0.65 27.1
10(CH)~ + xLi+(TiS~) -
4:1 4[Na,).,o§176176 + xTiS_, ~ 0.05 5.0 1.93 1.23 64 1.17 1.03 33.9 4(CH)x + xNa,)40+(TiS2) -'-4~ 0.2 19.9 1.93 0.96 50 0.73 1.00 26.5
Per kg of [M,§ ~]~ and TiS~ used in constructing a cell. b Based on the weights of [M,S(CH) -~] ~ and TiS._, used in constructing a cell. The number of moles of [Mj(CH) ~]., used in constructing each
cell was approximately the same. c Q(out) is the number of coulombs liberated during constant current discharge of the cell to 0 V. " The [Li(, ij(CH)-~176 ~ cells were charged at a constant potential of 1.8V for 48h; the [Na,, ,,,XCH)-~176 cell was charged at a constant poten-
tial of 1.9V for 48h.
Q(out~, to t he c o u l o m b s i n v o l v e d in a c h a r g e process , Q,,,. No te however , f r om t he e x t e n t of a g iven cell r eac t ion (Tab le I), t h a t the d i s cha rge r eac t ions were no t en t i r e ly c o m p l e t e w h e n 0 V h a d b e e n reached . A d d i t i o n a l dis- c h a r g e / c h a r g e cycles at 0.1 a n d 0.2 m A gave s imi lar resul ts .
Use of a 10:1 molar ratio [Lio.Io~(CH)-~176 cell.--The e l e c t r o c h e m i c a l r eac t i ons t a k i n g p lace at t he TiS2 cath-
�9 § - - O J O ode, t he [Llojo (CH) ]x anode , a n d t he n e t cell r e ac t i on d u r i n g t he d i s c h a r g e p r oce s s of th i s cell are g iven b y Eq. [2], [3], [4], r e spec t ive ly
TiS2 + Li ~ + e - --> Li~(TiS2)- [2]
10[Li0.,J(CH)-~176 --* 10(CHL. + xLi ~ + xe- [3]
10[Lio.,o§176176 + xTiS~ --~ 10(CH)x + xLi~(TiS2) - [4]
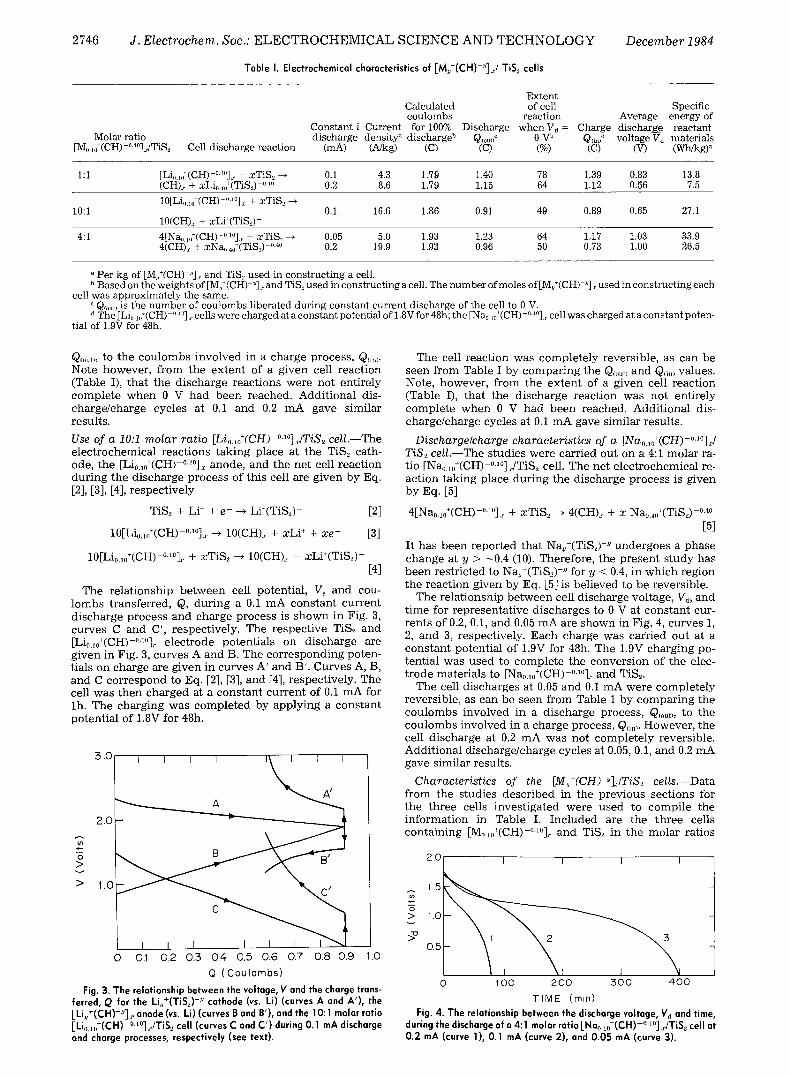
The r e l a t i onsh ip b e t w e e n cell potent ia l , V, a n d cou- l o m b s t r ans fe r red , Q, d u r i n g a 0.1 m A c o n s t a n t c u r r e n t d i s cha rge p rocess a n d c h a r g e p roces s is s h o w n in Fig. 3, c u r v e s C and C', r espec t ive ly . The r e spec t ive TiS2 a n d [Lio.,J(CH)-~176 e l ec t rode po ten t i a l s on d i s c h a r g e are g i v e n in Fig. 3, c u r v e s A a n d B. T he c o r r e s p o n d i n g po ten- t ials on cha rge are g i v e n in c u r v e s A ' a n d B' . C u r v e s A, B, a n d C c o r r e s p o n d to Eq. [2], [3], a n d [4], r espec t ive ly . The cell was t h e n c h a r g e d at a c o n s t a n t c u r r e n t of 0.1 m A for lh . The c h a r g i n g was c o m p l e t e d by a p p l y i n g a c o n s t a n t p o t e n t i a l of 1.8V for 48h.
3 .O I I I I I I~k I I I
\
2.o!
> 1.C -
0 0.1 0.2 0.3 0.4 0.5 0.6 0.7 0.8 0.9 1.0
Q ( C o u l o m b s )
Fig. 3. The relationship between the voltage, Y and the charge trans- ferred, Q for the I-i,+(TiS~) -y cathode (vs. Li) (curves A and A'), the [Li,+(CH)-']x anode (vs. Li) (curves B and B'), and the 10:1 molar ratio [/io.,u§176176 cell (curves C and C') during 0.1 mA discharge and charge processes, respectively (see text).
The cell r eac t ion was c o m p l e t e l y revers ib le , as c an be s een f rom Tab le I by c o m p a r i n g t he Q(ouu a n d Q(in~ values . Note, howeve r , f r om the e x t e n t of a g i v e n cell r eac t ion (Tab le I), t h a t t he d i s c h a r g e r eac t ion was no t en t i re ly c o m p l e t e w h e n 0 V h a d b e e n reached . A d d i t i o n a l dis- c h a r g e / c h a r g e cycles at 0.1 m A gave s imi la r resul ts .
Discharge~charge characteristics of a [Nao.,o§176176 TiS2 cell.--The s tud ies were ca r r i ed ou t on a 4:1 m o l a r ra- t io [Nao.10+(CH) -~176 flTiS2 cell. The ne t e l e c t r o c h e m i c a l re- ac t ion t a k i n g p lace d u r i n g t he d i scha rge p roce s s is g iven b y Eq. [5]
4[Nao.~o+(CH)-~176 + xTiS~ ~ 4(CH)x + x Nao.40~(TiS~) -~176 [5]
I t h a s b e e n r e p o r t e d t h a t Na~+(TiS~) -U u n d e r g o e s a p h a s e c h a n g e at y > ~0.4 (10). Therefore , the p r e s e n t s t udy has b e e n r e s t r i c t ed to N a S ( T i S D -~ for y < 0.4, in w h i c h reg ion the r e a c t i o n g iven b y Eq. [5] is be l i eved to be revers ib le .
The r e l a t i onsh ip b e t w e e n cell d i s cha rge vol tage, Vd, a n d t ime for r e p r e s e n t a t i v e d i s c h a r g e s to 0 V at c o n s t a n t cur- r e n t s of 0.2, 0.1, a n d 0.05 m A are s h o w n in Fig. 4, cu rves 1, 2, a n d 3, respec t ive ly . E a c h cha rge was ca~'ried ou t at a c o n s t a n t po t en t i a l of 1.9V for 48h. The 1.9V c h a r g i n g po- t en t i a l was u s e d to c o m p l e t e the c o n v e r s i o n of the elec- t r o d e ma te r i a l s to [Na0.,o+(CH)-~176 a n d TiS.,.
The cell d i s cha rges at 0.05 a n d 0.1 m A were c o m p l e t e l y revers ib le , as c an be s een f rom Tab le 1 b y c o m p a r i n g the c o u l o m b s i nvo lved in a d i s c h a r g e process , Q(o,~, to the c o u l o m b s i nvo lved in a c h a r g e process , Q~n,. However , t he cell d i s c h a r g e at 0.2 m A was no t c o m p l e t e l y revers ib le . A d d i t i o n a l d i s c h a r g e / c h a r g e cycles at 0.05, 0.1, a n d 0.2 m A gave s imi la r resul ts .
Characteristics of the [M,~+(CH) ~]~/TiS2 cells.--Data f rom the s tud ies d e s c r i b e d in t he p r e v i o u s s ec t ions for the t h r e e cells i n v e s t i g a t e d were u sed to c o m p i l e the i n f o r m a t i o n in Tab le I. I n c l u d e d are the t h r e e cells c o n t a i n i n g [Mo.,o+(CH)-~176 a n d TiS~ in t he m o l a r ra t ios
2.0 I I
1.0
1 2 0.5
0 100
> v
I I
2 0 0 5 0 0 4 0 0
T I M E (mm)
Fig. 4. The relationship between the discharge voltage, Vd and time, during the discharge of a 4:1 molar ratio [Nao.lo+(CH)-~176 cell at 0.2 mA (curve 1), 0.1 mA (curve 2), and 0.05 mA (curve 3).

Vol . 131, No . 12 R E C H A R G E A B L E B A T T E R Y 2747
1:1, 10:1, and 4:1 and their corresponding discharge reac- tions together with the number of coulombs calculated for 100% discharge, Q(out, oa,c.), of a cell if all the [M0.10+(CH)-~176 and TiS2 employed in the cell construc- tion underwent reaction. The coulombs liberated in the experimental discharge, Q(o~t), is given next, followed by the extent of the cell reaction, [Q(ouJQ(out, calca]100. An aver- age discharge voltage, Vd was calculated by integrating the area under each discharge curve, (V~ • Q(out/), (Fig. 2, curves 1 and 2; Fig. 3, curve C; Fig. 4, curves 1 and 3) and dividing this value by Q(out). Energy densities given in the table were obtained by integrating the area under each discharge curve, (Vd • Qcout)) and dividing this value by the combined weight of []VIy+(CH)-']~. and TiS2 employed in each cell construction. This value was then divided by 3600 to convert W-s/kg to W-h/kg.
S t a b i l i t y . - - A f t e r the discharge/charge cycles de- scribed above were completed, the relationship between Voc and t ime for the 4:1 molar ratio [Na0.10+(CH)-~176 cell was monitored and is shown in Fig. 5, curve 1. The cell showed an initial decrease from 1.75 to 1.64V during the first 15 days, followed by a very gradual decrease to 1.59V after 3 months. Its capacity on discharge after this t ime was 69% of that obtained from a discharge carried out immediate ly after complet ion of a charge cycle. The relationship be tween Voc and. t ime for the 10:1 molar ra- tio [Li0.,o+(CH)-0.'~ cell is shown in Fig. 5, curve 2. This cell showed an initial decrease from 1.65 to 1.50V after 5 days, followed by a much more gradual decrease to 1.43V after 20 days. Its capacity on discharge after this t ime was 88% of that obtained from a discharge carried out immediate ly after complet ion of a charge cycle.
Discussion Since, as described above, neutral (CH)~ can have a po-
tential in the range 1.8-3.1V (vs. Li) and since Li+(TiS2) - has a potential of 1.9V (vs. Li), it is apparent that when a 10:1 molar ratio [Li0.~0~(CH)-~176 cell is completely discharged to 0 V such that the electrodes attain the com- positions (CH).~. and Li+(TiS2) -, as given by Eq. [4], both electrodes will have a potential of 1.9V (vs. Li). Experi- mentally, this can be seen in Fig. 3, for the discharge of this cell to 0 V, by the intersection of curve A (the poten- tial of the Li,+(TiS2) -~ cathode vs. Li) and curve B (the po- tential of the [Li0.1o(,_,)+(CH)-~176 anode vs. Li), which occurs at 1.9V (vs. Li). Although the potential of 1.9V (vs. Li) is consistent with the formation of Li+(TiS2)- and neu- tral (CH)x the reaction is only 49% complete based on Q(out), the coulombs liberated during cell discharge and the weights of TiS., and [Li0.,0+(CH)-~176 employed in the cell construction (see Table I). This is due to polarization of the Li,+(TiS~) -~ and [Liy+(CH)-~]~ electrodes under the applied current densities and to incomplete diffusion of Li + ions from the surface of the TiSz to its interior and from the interior of the (CH)~ fibrils to its surface during the t ime in which the discharge studies were performed. These effects can readily be seen, for example, after the
2 . 0 I I I I I I I
> 1.5
10
0.1"
0
1 X ' x ' x ~ " ~ " ' x ~ X ~ x ~ x - x X ~ ~ x
Xx -...... 2 x -----.• __._ x
I I I I I I I 10 20 50 4 0 50 6 0 7 0
T I M E (days)
Fig. 5. Relationship between the open-circuit voltage, Voc and time for o [Nao.,o~(CH)-~ cell (curve 1) and a ILl o ,o+(CH)-'b"~ cell (curve 2).
10:1 molar ratio [Lio.10+(CH)-~176 cell was discharged to 0 V and then disconnected for 1 min. The Vo~ increased to 0.3V as Li § ions diffused into the interior of the TiS.~ and toward the surface of the (CH)x fibrils. These effects may be related, at least in part, to the fabrication of the TiS, electrodes' being poorer than that obtainable by the best state of the art procedures.
When comparing discharge cycles at different current densities for a given cell, it can be seen from Table I that the extent of cell reaction decreased with increasing discharge current density. This is consistent with in- creased polarization and less complete diffusion at higher current density discharges, which occurred in a shorter t ime period. Comparing the 1:1 and 10:1 molar ratio [Lio.,0§176176 cells at the same discharge current density (0.1 mA for 0.7 cm 2 of (CH).r), it can be seen that the extent of the cell reaction (78% vs. 49%, respectively) is less complete for the 10:1 molar ratio cell. This is con- sistent with the fact that both cells employed approxi- mately the same amount of (CH)x so that the 10:1 molar ratio cell contained only one-tenth the amount of TiS2. The correspondingly smaller surface area of TiS2 will, therefore, increase the effects due to polarization.
The 1:1 and 10:1 molar ratio cell reactions were essen- tially reversible, as can be seen in Table I by comparing Q(ou,, the number of coulombs liberated during discharge, to Q(in), the number of coulombs involved during the charging process. Since these quantities were nearly the same in all cases, these reactions are considered to be es- sentially reversible even though they do not proceed to completion. The incompleteness of these reactions is be- lieved to be due to incomplete diffusion during the time of the discharge, so that, in effect, the interior portions of the TiS2 particles and the interior portions of the (CH)~ fibrils do not actively enter into the reaction processes.
Since the value of Q(out) for the 0.05 mA discharge of the 4:1 molar ratio [Na0.,o+(CH)-0.'0]~./TiS2 cell, whose reaction is given by Eq. [5], was close to the value of Q(m~ (see Table I) obtained in the subsequent charge, this reaction may also be considered essentially reversible. However, when the discharge was carried out at the higher current of 0.2 mA, the value of Q~out) w a s significantly larger than the value of Q(~,). This may be due to the formation of some Na,+(TiS~) -~ (y > 0.4) phase at the surface of the TiS2, during the rapid discharge process, from which it is believed Na § ions may not be readily removed during the charging process (11).
In order to better understand the discharge curve shown in Fig. 3, curve C for the 10:1 molar ratio [Lio.,0*(CH)-~176 cell, whose reaction is given by Eq. [4], a theoretical curve based on equilibrium data has been constructed. This theoretical curve, shown in Fig. 6, curve C, was constructed from (i) Fig. 6, curve A, which gives the equilibrium Voc values of a Li/Li,~+(TiS~) -y cell as a function of increasing intercalation of Li § ions into the Li,+(TiS2) -y (0 < y ~< 1) electrode as reported by Whittingham (12) and (it) Fig. 6, curve B, which gives the equil ibrium Vo~ values of a Li/[Lio.,,+(CH)-~176 cell as a function of decreasing reduction, i.e., removal of Li ~ ions from the [Li,+(CH)-~]~. (0.1 /> y /> 0) electrode, as we have reported previously (3). Curves A, B, and C in Fig. 6 corre- spond to the equilibrium potentials for the reactions given by Eq. [2], [3], and [4], respectively. The calculated equil ibrium cell potential (Fig. 6, curve C) is thus based on the difference between curves A and B as given by Eq. [6]
Ycell : Ycathodic Vanodic [6]
Figure 6, curve C represents a hypothetical discharge carried out under no load, infinitely slowly, thus eliminating polarization and diffusion effects.
Figure 6, curve B' is an experimental curve obtained from a Li/[Li,).,o+(CH)-~176 cell (employing 3.1 mg of (CH)x), when the [Li0.,~+(CH)-~176 electrode was oxidized at a constant current of 0.17 mA/cm 2 of (CH)j. (3). If curve B' is combined with curve A using Eq. [6], then curve C'

2748 J . E l e c t r o c h e m . Soc . : E L E C T R O C H E M I C A L S C I E N C E A N D T E C H N O L O G Y D e c e m b e r 1984
~ in [Li~(CH)-Y] x (Curves B and B/)
3010 9 8 7 6 5 4 3 2 I 0 " I I I I I I I I I
A /
2.0 - B/
2
1.0 >
0 10 20 30 40 50 60 70 80 90 100 % DISCHARGE (Curves CandC/)
~ Li in L i y ( T i S 2 ) -y (CurveA)
Fig. 6. Potential of: (A) Li,+(TiS2) -" cathode vs . Li at equilibrium [Ref. (4)]; (B) [Lio.~o,_,)~(CH)-~176162 anode vs. Li at equilibrium [Ref. (3)]; (B') [Lio.~o(~_z)§ -~176162 ")].~ electrode vs. Li during oxida- tion of [Lio.~o~(CH)-~176 to (CH).~ [Ref. (3)]; (C) [L io . io~_ , )~ (CH) -~ '~~ - " cell calculated at equilibrium; (C') [L io . io~ ,_ , )~ (CH) -~176247 - " cell calculated for dis- charge (see text).
is obtained. This gives a closer approx ima t ion than curve C to what could be expec t ed exper imenta l ly dur ing dis- charge of the 10:1 molar ratio [Li0.~0~(CH)-~176 cell, s ince one of the curves (curve B') represen ts a d ischarge unde r actual load condi t ions.
Curve C in Fig. 6 is r ep roduced as curve 2 in Fig. 7. For compara t ive purposes , the expe r imen ta l d ischarge curve for the 10:1 molar ratio [Li0.~o+(CH)-~176 cell (Fig. 3, curve C) is r ep roduced as curve 1 in Fig. 7. It can be seen that these curves have a similar general shape, but that, owing to polarizat ion and diffusion effects, the observed cell d ischarge react ion (curve 1, Fig. 7) is only 49% comple te .
A theoret ica l V vs. Q curve based on equ i l ib r ium data has also been cons t ruc ted for the 4:1 mola r ratio [Nao.~o+(CH)-~176 cell. This theoret ical curve shown in Fig. 8, curve 2 is cons t ruc ted f rom (i) equ i l ib r ium Vo~ va lues of a Na/Na~+(TiS~) -" cell as a funct ion of increas ing in tercala t ion of Na ~ ions into the Na,+(TiS2) -~ (0 ~< y ~< 0.4) e lec t rode as repor ted by W i n n e t al. (10) and (ii) equil ib- r ium Vo~ values of a Na/[Na0.,0+(CH)-~176 cell as a func t ion of decreas ing reduct ion, i.e., r emova l of Na § ions f rom the [Na,+(CH)-'].~ (0.1 /> y /> 0) e lec t rode (13).
For compara t ive purposes , the expe r imen ta l d ischarge curve for the 4:1 mola r ratio [Na~.io~(CH)-~176 cell (Fig. 4, curve 3) is r ep roduced as curve 1 in Fig. 8. F r o m Fig. 8, it can be seen that the expe r imen ta l curve also fol- lows the general shape of the theoret ical curve for the [Na~.,u~(CH)-~176 cell, but, again, owing to polariza- t ion and diffusion effects, the observed cell d ischarge re- act ion (curve 1, Fig. 8) is only 64% complete .
Compar ing the 10:1 molar ratio [Li,,.,,,+(CH)-~176 TiS, cell data g iven in Fig. 7 wi th the 4:1 molar ratio [Na,~.,0+(CH)-".'~ cell data g iven in Fig. 8, it is appar- ent that the potent ia l of the [Lio.,0+(CH)-~176 cell falls cont inual ly as the d ischarge react ion proceeds to comple- tion, whi le the potent ia l of the [Nao.,o~(CH)-~176 cell decreases more gradual ly and then falls rapidly dur ing the last ~10% of its discharge. This dif ference in the be- havior of the cell potent ia ls is consis tent wi th the fact that the equ i l ib r ium potent ia l of the M,+(TiS2) -" e lec t rode for differ ing values of y is d e p e n d e n t on the in tercalant used wi th respect to a c o m m o n reference (e.g., vs. Li) (10, 12), whi le the potent ia l of the [M,+(CH)-~]r e lec t rode for dif- fer ing values of y is i ndependen t of the dopan t used (3, 13). S ince the potent ia l of Na,,+(TiS~) -~ is greater than the potent ia l of Li,+(TiS2) -~ for y ~< 0.4 vs. a c o m m o n ref-
2 " 0 1 1 I I I I I [ I I I
1.5
2 O
> l o
>
0.5
0 10 20 30 40 50 60 70 80 90 100
%Li in Li~(Ti $2) y
Fig. 7. Change in voltage of a 10:1 molar ratio [Lio.~o+(CH) -~176 flTiS.., cell as a function of percent Li intercalation in Liy+(TiS2)-~ during a 0.1 mA discharge (curve 1) and at equilibrium (curve 2).
erence e lec t rode (10, 12), the Na,+(TiS2) - , e lec t rode would therefore be expec ted to exhib i t a larger potent ia l than the Li,+(TiS2) -y electrode, vs. a [M,+(CH)-~]~ electrode. For example , at y = 0.4, the potent ia l of a Na,+(TiS2) -y elec- t rode is 2.00V (vs. Na), i.e., 2.33V (vs. Li), 2 whi le the poten- tial of the co r respond ing Li~+(TiS2) -y e lec t rode is 2.20V (vs. Li). Also note that w h e n y = 0, the Vor of TiS2 vs. Na is 2.3V, i.e., 2.63V (vs. Li), 2 whi le the cor respond ing Vo~ of TiS2 vs. Li is 2.45V (see Table II).
The Voc, theoret ical energy density, and specific energy of reac tant materials are g iven in Table II for each of the fo l lowing cells: the 10:1 molar ratio [Li0.~0~(CH)-~176 cell, the 4:1 molar ratio [Na0.~0~(CH)-".~~ cell, a Li/Li,+(TiS.,) -" cell, a Na/Na~+(TiS~) -~ cell, a Li/[Li,+(CH) "]~ cell, and a Na/[Na,+(CH)-Y],. cell. The theoret ica l energy densi t ies are based on the area under the equ i l ib r ium Vo~ vs. Q curves for each react ion d iv ided by the total we igh t of anode and ca thode mater ia l employed in the cell con- struction. For example , the theoret ica l energy densi t ies for the 10:1 molar ratio [Li0.,0~(CH)-~176 cell and the 4:1 molar ratio [Na0.~0~(CH)-0.~OlJTiS~ cell are obta ined f rom the area under curve 2, Fig. 7 and curve 2, Fig. 8, re- spect ively, and f rom the weights of [Mo.t0+(CH)-~176 and TiS2 emp loyed in each cell. The exper imenta l energy den- sities are based on the area under a Vd vs. Q curve dur ing a cons tan t current d ischarge and the total weight of an-
2 Assuming that the difference in the E~d ~ potential between Na (2.711V vs. SHE) and Li (3.045V vs. SHE), i.e., 0.334V, will have approximately the same value in the electrolytes used in the present studies.
> >
2.0
1.5
1.0
0.5
I [ I I I I I I [ [
2
I I 1 I I I I I 0 10 20 30 40 50 60 70 80 90 I00
%Na in No;(Ti $2) -y
Fig. 8. Change in voltage of a 4:1 molar ratio [Na..1,)~(CH)-~'IL~].,./TiS.2 cell as a function of percent Na intercalation in Na~+(TiS2) --~ during a 0 .05 mA discharge (curve 1) and at equilibrium (curve 2).

Vot. 131, No. 12 R E C H A R G E A B L E B A T T E R Y
Table II. Energy densities of selected cells employing polyacetylene and titanium disulfide electrodes
2749
Specific energy Theoretical energy Discharge current of reactant materials
Cell discharge reaction V~ (V) density (Wh/kg) density (mA/cm 2) (Whlkg)
10[Lio.,0+(CH)-~176 + xTiS., -~ 10(CH)~ + xLi§ - 1.65 110.9 a 0.14 27.P
4[Na~.~(CH)-~176 + xTiS2 --~ 4(CH)~ + xNao.4o+(TiS._,) -~ 1.80 78.9 ~ 0.14 30.1 ~
Li + TiSz ~ Li*(TiS~) - 2.45 480 b 0.3 342 g
0.40 Na + TiS., --. Na0.,0~(TiSz) -''.4~ 2.3 166 ~, 199 d 2.5 153 h
0.10x Li + (CH)~. --> [Li0.~o~(CH)-~176 1.80 232 ~ 0.17 201 ~ 0.10x Na + (CH)~ --~ [Na0.~o*(CH)-~ ~ 1.45 144 f 0.17 115 f
This work. b Ref. (4). c Calculated from data in Ref. (10). d Calculated from data in Ref. (14). e Ref. (3). f Ref. (13). g Ref. (15). h Calculated from data in Ref. (11).
ode and cathode material employed in the cell construc- tion. For example, the experimental energy densities for the 10:1 molar ratio [Li0.10+(CH)-~176 cell and the 4:1 molar ratio [Nao.lo§ cell are obtained from the area under curve 1, Fig. 7 and curve 1, Fig. 8, respec- tively, and from the weights of [M0.10§176176 and TiS2 employed in each cell.
The Li/TiS2 and the Li/(CH)x cells have significantly higher experimental energy densities than the corre- sponding Na]TiS2 and Na/(CH)x cells (see Table II). This is due to the lower atomic weight and higher reduction po- tential of l i thium as compared to sodium. However, the [Nao.lo~(CH)-~176 cell has an experimental energy density (30.1 Wh]kg, close to that of the [Lio.~o§ TiS~ cell (27.1 Wh/kg). This is due to the higher potential of the [Nao.~o~(CH)-~176 cell during discharge, as dis- cussed above.
As can be seen in Fig. 3, curve C', the charging of the 10:1 molar ratio [Li0.10~(CH)-~176 cell could not be completed at a constant current of 0.1 mA. From Fig. 3, curve A', it can clearly be seen that the main cause of this is polarization of the TiS2 electrode, resulting in a cathode-limited reaction. Thus, the applied charging cur- rent caused the Li,+(TiS~) -~ electrode potential to rise rap- idly; the charging was therefore completed at a constant potential of 1.8V applied between the anode and the cathode.
Improved methods for constructing TiS2 electrodes have allowed others to successfully cycle TiS.2 cathodes at high current densities (16, 17). Adopting some of these methods to the present cells could (i) improve the [M0.z0§176176 cells by enabling complete charging at high current densities and (ii) improve the energy den- sities by enabling the cell reactions to proceed further to completion. Improvements in fabricating the TiS2 elec- trodes include a hot bonding technique (11), improved binders such as ethylenepropylene-diene terpolymer (16), and employing a reduced weight ratio of binder to TiS2. All these improvements have been shown to reduce po- larization effects at the TiS., electrode and to improve its overall performance in a battery cell.
Improved electrolytes could be useful in the [M,+(CH)-~]~J TiS~ cells. For example, 1.0M LiAsF8 in 2Me-THF has been shown to increase the recyclability of LiITiS2 cells (17). Since this electrolyte is compatible with the [Li,+(CH)-~]~ electrode (18), it could be advantageously employed in a [Lio.10~(CH)-~176 cell.
Other intercalating inorganic materials might be substi- tuted for TiS~ as the cathode-active material in these cells. For example, the electrochemistry of the sulfides and sel- chides of vanadium, niobium, and tantalum and transi- tion metal oxides such as V~Os, MOO3, and MnO.,, has been investigated (4). To determine which materials could be used in practical cells, theoretical V vs. Q curves, such as
those given in Fig. 7, curve 2 and Fig. 8, curve 2, should be constructed, and the electrochemical characteristics of those showing the most promise could be investigated.
Analogously, other conducting organic polymers might be substituted for polyacetylene as the anode-active material in these cells. Polyparaphenylene (19) and polyquinolines (20), both of which can be reduced electrochemically, are the most promising candidates.
Conclusions This feasibility study of cells comprised of the con-
ducting organic polymer anode--reduced polyacetylene and the inorganic intercalating cathode-- t i tanium disulfide has shown some promise for practical ceils. The major problems associated with li thium anodes are avoided. Two cells employing differing molar ratios of [Lio.~o+(CH)-~176 and TiS2 as anode- and cathode-active materials, respectively, and one cell employing a [Nao.10§176176 anode and TiS.~ cathode have exhibited promising energy densities and electrochemical reversi- bility. Improvements in the fabrication of the TiS2 elec- trode are needed to overcome the observed cathode limi- tations of the present cells. Other modifications, such as the use of new conducting organic polymer anodes or other inorganic intercalating cathodes, may show even greater technological promise.
Acknowledgments The authors would like to thank Dr. T. Uchida and Dr.
W.L. Worretl for preparation of the t i tanium disulfide and many helpful discussions. This study was supported by the Department of Energy, Contract No. DE-AC02-81-ER10832.
Manuscript submitted March 28, 1984; revised manu- script received July 20, 1984. This was Paper 145 pre- sented at the Cincinnati, OH, Meeting of the Society, May 6-11, 1984.
The University of Pennsylvania assisted in meeting the publication costs of this article.
REFERENCES 1. P. J. Nigrey, A. G. MacDiarmid, and A. J. Heeger, J.
Chem. Soc. Chem. Commun., 594 (1979); K. Kaneto, K. Yoshimo and Y. Unuishi, Jpn. J. Appl. Phys., 22, L567 (1983); see also Ref. (2, 3, 6, 13, 19, 20).
2. P. J. Nigrey, D. MacInnes, Jr., D. P. Nairns, A.G. MacDiarmid, and A. J. Heeger, This Journal, 128, 1651 (1981); K. Kaneto, M. Maxfield, D.P . Nairns, A. G. MacDiarmid, and A. J. Heeger, J. Chem. Soc. Faraday Trans. I, 78, 3417 (1982); G. C. Farrington, B. Scrosati, D. Frydrych, and J. DeNuzzio, This Journal, 131, 7 (1984).
3. R. B. Kaner and A. G. MacDiarmid, J. Chem. Soc. Fara-

2750 J. Electrochem. Soc.: E L E C T R O C H E M I C A L S C I E N C E A N D T E C H N O L O G Y December 1984
day Trans. I, 8@, 2109 (1984). 4. M. S. Whittingham, Prog. Solid State Chem., 12, 41
(1978). 5. B. G. Silbernagel and M. S. Whittingham, J. Chem.
Phys., 64, 3670 (1976); B. S. Silbernagel and M. S. Whittingham, Mater. Res. Bull., 11, 29 (1976).
6. J .H. Kaufman, J. W. Kaufer, A. J. Heeger, R. B. Kaner, and A. G. MacDiarmid, Phys. Rev. B, 26, 2327 (1982).
7. H. Shirakawa and S. Ikeda, Polym. J., 2, 231 (1971); H. Shirakawa, T. It@, and S. Ikeda, ibid., 4, 460 (1973); T. It@, H. Shirakawa, and S. Ikeda, J. Polym. Sci. Polym. Chem. Ed., 12, 11 (1974); ibid., 13, 1943 (1975).
8. M. S. Whittingham and J. A. Panella, Mater. Res. Bull., 16, 37 (1981).
9. T.-C. Chung, A. G. MacDiarmid, A. Feldblum, and A. J. Heeger, J. Polym. Sci. Polym. Lett., 20, 427 (1982).
10. D. A. Winn, J. M. Shemilt, and B. C. H. Steele, Mater. Res. Bull., 11, 559 (1976).
11. G. H. Newman and L. P. Klemann, This Journal, 127, 2097 (1980).
12. M. S. Whittingham, ibid., 123, 315 (1976). 13. R. B. Kaner and A. G. MacDiarmid, J. Chem. Soc. Fara-
day Trans. I, To be published. 14. A. S. Nagelberg and W. L. Worrell, J. Solid State Chem.,
29, 345 (1979). 15. G. L. Holleck and J. R. Driscoll, Electrochim. Acta, 22,
647 (1977). 16. S .P.S. Yen., D. H. Shen, and R. B. Somoano, This Jour-
nal, 13@, 1107 (1983). 17. K. M. Abraham, J. L. Goldman, and D. L. Natwig, ibid.,
129, 2404 (1982). 18. R. B. Kaner and A. G. MacDiarmid, Unpublished
results. 19. L. W. Shacklette, R. L. Elsenbaumer, R. R. Chance,
J. M. Sowa, D. M. Ivory, G. G. Miller, and R. H. Baughman, J. Chem. Soc. Chem. Commun., 361 (1982).
20. A.H. Schroeder, Y. S. Papir, and V. P. Kurkov, Abstract 544, p. 822, The Electrochemical Society Extended Abstracts, Vol. 83-1, San Francisco, CA, May 8-13, 1983.
Methodology for Predictive Testing of Fuel Cells D. N. Patel, H. C. Maru,* M. Farooque,* and C. H. Ware 1
Energy Research Corporation, Danbury, Connecticut 06810
ABSTRACT
A perturbation testing method has been developed and tested for predictive testing of fuel cells. This method in- volves application of small changes to the operating conditions of the cell in a predetermined sequence. The resultant response of the cell is then measured and statistically correlated with the corresponding test conditions. This method has been applied to the phosphoric acid fuel cell, and the effect of operating and cell-component variables on cell- performance degradation has been studied. A strong effect of the cell temperature and cathode potential on fuel-cell- performance degradation has been observed. A cell-performance degradation model has been formulated, and the un- known parameters in the model have been estimated by a regression analysis of the experimental data. A reasonable agreement between the fuel cell performance predicted by this model (derived from the perturbation experiments) and the unperturbed test data supports the applicability of the perturbation method.
The phosphoric acid fuel cell being developed for elec- tricity generation is expected to have a long operating life (typically 40,000h for use in utility power plants). A fuel cell aging model is therefore very useful in a cost- effective component evaluation and an optimization of design conditions minimizing the life-cycle cost. The techniques used most often in electrochemical studies for developing aging models are steady-state life testing and accelerated testing. Steady-state life testing of fuel cells offers limited information, is very expensive, and is time consuming. In accelerated testing, the cell is run at very severe operating conditions (e.g. a cell temperature of 200~ and a cathode voltage of 0.9V) to accelerate decay, and the large changes made in operating conditions to ac- celerate decay may cause a shift in the decay mechanism. Hence, the decay mechanism during accelerated testing may not be representative of design conditions. Acceler- ated testing is also expensive, as a large number of tests are required. This paper describes an alternative predic- tive testing approach--the perturbation testing techni- que- -and describes its application to the phosphoric acid fuel cell (PAFC).
Theoretical
Perturbation testing technique.--This technique in- volves the investigation of a system response, utilizing small, careful changes in the operating conditions to en- sure the representative behavior of the decay mechanism. It is an adaptation of "Evolutionary Operation" (EVOP) (1, 2), originally applied to optimization of plant opera- tion. In this technique, changes are made in important variables of the plant to find conditions that would in-
*Electrochemical Society Active Member. 1Present address: World Energy Systems, Rocky Mount, VA
24151.
crease its performance and provide the direction for fur- ther improvement. The changes are kept small to permit plant operation with an acceptable product. Because in the perturbation testing technique several perturbations in operating variables are applied to a single cell, fewer tests are required than in accelerated testing. Further- more, perturbations on the same cell enable cell-to-cell, variation-free estimation of model parameters. Thus, the perturbation testing technique is cost effective, quick, and reliable.
Decay modes.--In this study, the perturbation testing technique is applied to phosphoric acid fuel cells (PAFC). The PAFC are operated in the temperature range of 165~176 At temperatures lower than 165~ the poison- ing of the Pt catalyst by CO in the fuel increases, and at temperatures higher than 200~ the material stability is affected. The basic reactions occurring in the PAFC are
at anode H2 ~ 2H + + 2e- at cathode 2H ++ 1 /202+ 2 e - ~ H 2 0
overall H2 + I/2 02 ~- H20 + electricity + heat
The PAFC electrodes consist of platinum, carbon, and Teflon. The carbon support provides a conductive and highly dispersive base for the Pt (catalyst) crystallites; the Teflon mainly imparts hydrophobicity to the structure. The phosphoric acid (electrolyte stored in the matrix layer) provides a conductive path for H + ions, and electric- ity is produced by an electrochemical reaction be- tween H2 from fuel and O2 from air. The primary fuel for the PAFC is pure hydrogen. However, impure hydrogen (containing CO2) may also be used as fuel.
Knowledge of possible decay modes and important pa- rameters affecting the decay is desirable (and even essen- tial to predict relative contributions of various decay