infrared transmission of heavily doped polyacetylene
TRANSCRIPT

HAL Id: jpa-00209715https://hal.archives-ouvertes.fr/jpa-00209715
Submitted on 1 Jan 1983
HAL is a multi-disciplinary open accessarchive for the deposit and dissemination of sci-entific research documents, whether they are pub-lished or not. The documents may come fromteaching and research institutions in France orabroad, or from public or private research centers.
L’archive ouverte pluridisciplinaire HAL, estdestinée au dépôt et à la diffusion de documentsscientifiques de niveau recherche, publiés ou non,émanant des établissements d’enseignement et derecherche français ou étrangers, des laboratoirespublics ou privés.
Infrared transmission of heavily doped polyacetyleneC. Benoit, Olivier Bernard, M. Palpacuer, M. Rolland, M. J. M. Abadie
To cite this version:C. Benoit, Olivier Bernard, M. Palpacuer, M. Rolland, M. J. M. Abadie. Infrared trans-mission of heavily doped polyacetylene. Journal de Physique, 1983, 44 (11), pp.1307-1316.�10.1051/jphys:0198300440110130700�. �jpa-00209715�

1307
Infrared transmission of heavily doped polyacetylene
C. Benoit (*), O. Bernard (*), M. Palpacuer (*), M. Rolland (*) and M. J. M. Abadie (**)
(*) Groupe de Dynamique des Phases Condensées (LA 233)(**) Laboratoire de Chimie Macromoléculaire,
U.S.T.L., 34060 Montpellier Cedex, France
Résumé. 2014 Dans ce travail nous présentons des résultats de mesures de transmission et réflexion dans le domaineinfrarouge (4 03BCm-25 03BCm) effectuées sur des films de polyacétylène. Les mesures ont été faites sur des échantillonsde polyacétylène [CH(I3-)Y]x de diverses épaisseurs pour des taux Y de dopage à l’iode allant de 0 à 7 %. La méthodeutilisée permet d’obtenir des spectres sur des films libres de tout support. De plus contrairement aux techniquesusuelles elle permet de travailler, à fort dopage sur des échantillons assez épais, pour lesquels il est possible dedéterminer l’épaisseur avec précision et également le taux de dopage par pesée. Les résultats confirment que, bienque le dopage à l’intérieur des fibrilles ne soit pas uniforme, le système est complètement isomérisé. De plus notreanalyse prouve que le mode (03C92 à 900 cm-1 qui apparait sous l’action du dopage ne peut pas être le mode d’ancrage.
Abstract - This report presents the results of measurements of transmission and reflexion spectra of polyacety-lene films in the infrared range 4-25 03BCm. [CH(I3-)Y]x samples were used with various thickness for iodine dopinglevel Y up to 0.07. We used a high detectivity spectrometer which permitted us to obtain spectra with very highlydoped free-standing films. In this way, we could measure both the relatively large thicknesses of samples withaccuracy and also directly measure the doping level by weight uptake. The results show that, although intrafibrildoping is nonuniform, the material is quite isomerized. In addition, our analysis demonstrates that the 03C92 band(900 cm-1) induced upon doping cannot be the pinned mode.
J. Physique 44 (1983) 1307-1316 NOVEMBRE 1983, :
Classification
Physics Abstracts33. 20E - 63.20M - 63.20P
1. Introduction.
A considerable amount of work has been done on the
physical properties of undoped and doped polyacety-lene film in the past few years [1]. Such interest was
enhanced by the potential applications of semiconduct-ing or conducting (CH)x as an electronic material.The essential characteristic of this polymer is theexistence of two isomeric forms : the cis and the trans
(Fig. la, b), the first being unstable, while the second
Fig. 1. - (a) Chemical structure of cis polyacetylene; (b) Chemical structure of trans polyacetylene ; (c) Schematic patternof the pinning potential V(x) due to a charged impurity.
Article published online by EDP Sciences and available at http://dx.doi.org/10.1051/jphys:0198300440110130700

1308
is stable. Furthermore the trans isomer has a groundstate twofold degenerate : two different senses ofisomerization are possible, one in which even number-ed atoms move to the right (A phase), the other inwhich they move left (B phase). A soliton is the boun-dary between a region of A phase and B phase. Inundoped or lightly doped polyacetylene there is asmall number of neutral solitons. Upon doping, thecharge is transferred from the dopant to the poly-acetylene chain either by changing the occupancy of apreexisting soliton, or by the induced creation of anew charged soliton. Recently the possibility of thecreation of a pair of solitons (polaron) has beenevocated for light doping. Experimental results of
magnetic [2, 3] infrared [4, 5] optical [6] and trans-port [7, 8] measurements on doped (CH)x supportthe soliton mechanism for doping, while photocon-ductivity, light scattering and modulation spectro-scopy experiments are consistent with a decay orthe creation of soliton pairs [9, 10]. In the series ofexperiments with various dopants, Fincher et al. [11]found that upon dilute doping two new absorptionmodes appeared in the IR region at 1 370 and900 cm-1. Their intensity is very strong and increasesin proportion to the dopant level. These modes wereobserved for iodine, AsFS [11], SbFs [12], Mods,WCl6 [13, 14] (p-type doping) and for Na [11] (n-typedoping). The same kind of behaviour has been observ-ed with (CD)x [4,15].Thus these intense absorptions are not due to
specific vibrations of dopant molecules but are intrin-sic features of the doped (CH), chain. A theory wasdeveloped by Mele and Rice [16] concerning thelattice dynamics of solitons in (CH)x. The presenceof the defect alters significantly the character ofnormal modes of vibration of the chain and induceslocalized modes. With a charged soliton, two of thesemodes were found to be strongly infrared active, deriv-ing their oscillator strengt from interaction withTc-electrons. In addition, the oscillation of the chargedsoliton bound to an ionized impurity should beassociated with its own characteristic infrared acti-
vity. Zannoni and Zerbi [17] interpreted the infraredspectra with a model of a one dimensional crystalcontaining a structural disorder. Rabolt et al. conclud-ed, by comparison with infrared spectra of chargetransfer salts, that these new modes are due to thevibronic activation of Raman active Ag modes [18].Recently Horowitz [19] and Maki [20] showed that.in continuum model, phase fluctuations of order
parameter give rise to new localized modes which areinfrared active [19] or Raman active [20]. In theHorowitz model the infrared absorption is indepen-dent, of the charge configuration when the doping islight. In this model one of the strong IR active modes,is the pinned mode.
Many of these results concern only models orsamples with light doping. On the other hand, theore-tical calculations of the stability of chain [21] ] show
that, up to a small percentage of doping level solitonsare not stable.
It was very interesting to measure, with greataccuracy the behaviour of the infrared spectra withthe doping level, from undoped material to materialin metallic regime. Our aim, in this paper is to deter-mine the behaviour of the background and infraredactive bands with various doping level and discussthe results.
2. Experimental techniques.
2.1 SAMPLE PREPARATION AND DOPING. - Poly-acetylene films were obtained by the method describedby Ito et al. [22]. The solvant is pentane, the molarratio Al/Ti = 4 with a Ti concentration of 0.4 mole/litre, at, - 78 OC and the acetylene pressure 0.1 atmo-sphere. The iodine doping was performed in liquidphase using pentane solutions of iodine at variousconcentrations. The dopant content was measuredby film weight uptake and is always given in 13/CHpercents
2.2 APPARATUS. - We used two types of spectro-meters :
- a Perkin Elmer 577 down to a 10 - 2 transmissionlevel;- an infrared compact grating spectrometer espe-
cially built in order to measure transmission as lowas 10-6. This apparatus is extensively describedelsewhere [23] so we only report here its essentialcharacteristics. In the middle infrared range, the300 K background emission is often the greatestlimitation of photoconductive detectors. To reducethis effect, a grating spectrometer was built, cooledwith liquid nitrogen, incorporating a Ge : Cu detectorcooled with liquid helium. The main characteristic ofthis spectrometer is the noise equivalent power cor-responding to the total radiation noise evaluated as10-12 W.Hz- 1/2, which is approximately 2 ordersof magnitude lower than the Golay detector. Thisapparatus works in the range of 400 to 2 500 cm-’ andallows an ultimate transmittance measurement of5 x 10 -’ near 1 500 cm-1. The spectrometer reso-lution is 7 x 10- 3 at 1 000 cm-1. It was essentiallyused to determine the transmittance of highly doped(CH)x films.
Utilization of free-standing films allows eliminationof dispersion effects of substrates and thus an easierquantitative interpretation of the spectra. Measure-ments using commercial spectrometers require extre-mely thin doped films, because the transmissiondecreases exponentially with thickness. In this case,it is very difficult to know the exact thickness of filmsand whether or not it is constant.On the other hand, the doping level cannot be
directly measured within accuracy by weight uptake.

1309
Therefore it is necessary to employ indirect qualitativemethods using measurements of conductivity.
Unfortunately these methods are useless when theI g doping level is greater than 0.01 because the conduc-tivity slowly changes.
Techniques as Tanaka’s [24] make it possible toobtain excellent qualitative results, but cannot, in anycase, allow a quantitative interpretation of the results.The utilization of films thick enough to be easily
manipulated that still give a measurable transmissioneven for high doping levels, permits better analysisof results.
In this work, three thicknesses of films were used :1.3, 2.5 and 6.5 J.1m.
3. Experimental results.
3 .1 Cis-trans ISOMERIZATION. - Logarithm of absorp-tion and reflection curves are shown in figures 2and 3 for 2.5 J.1m thickness films, with different dopinglevels. Cis-trans isomerization can be induced byheating or doping. Detailed study of the behaviourof the cis-bands thermally isomerized has shownthat it was not possible to interpret the isomerizationprocesses with a single time constant, but it was
necessary to discuss in detail the behaviour of eachcis-band [25]. We observe a similar behaviour withisomerization induced upon doping.The 740 cm-1 band associated with C-H out of
plane deformation [26] depends mainly on the interac-tion of its nearest neighbours, while the 446 cm -1
band associated with angular deformation of thecarbon chain, involves long range interaction. So forshort cis-sequences the first band persists while thesecond disappears. With thermally induced isomeriza-tion 446 cm-1 (and 1 329 em - 1) bands disappearvery quickly, while 740 cm -1 (and 1 249 cm -1 ) bandspersist With isomerization induced by doping the446 cm-1 band disappears when the dopant concen-tration reaches Y - 0.007 while 740 cm-1 disappearswhen Y > 0.04 (Fig. 2). These Y values depend onthe thickness of the film, and to obtain total isomeriza-tion the required doping level increases with thethickness value [27].The spectrometer resolution is too low to permit a
study of the behaviour of 1 329 and 1 249 cm -1 bands.The relative sensibility of« lattice » mode (446 cm - ’)
and « local » mode (740 cm-1) is well explained bydynamical model [28, 29]. Calculations demonstratethat the 446 cm -1 cis-band disappears when the
length ofci§-sequeoces of the chain becomes shorterthan 12-16 (CH-CH) units.The disappearence of 446 cm-1 when the dopant
concentration reaches 0.007 signifies that cis-sequencesno longer exist in any part of the polymer. RecentT.E.M. studies of doping mechanisms in films [30, 33]have shown that dopant nonuniformity is significant.Moses et al. [34] have shown the importance ofmacroscopic nonuniform doping on physical pro-perties. Nonuniform doping has also been studied byRolland [31], Janossy [33], Epstein [35], Montaner [12].The origin of the concentration gradients throughthe films, has been discussed by Benoit et al. [32].
Fig. 2. - Infrared transmission spectra of a 2.5 J.1m thick cis (CH)x film iodine doped up to Y = 0.07.

1310
Using dopant in liquid phase does not greatly changethe mechanisms.
Calculations show that the diffusion constant D is ofthe order 10- 8 cm2 s -1. Thus, for the thin samplesused here the macroscopic doping rapidly becomesuniform. This does not mean that the material pro-perties are uniform. because it is well known that thedensity and the texture vary from one side to the other.With thin materials it is not necessary to use a slow
doping technique to obtain a macroscopic uniformdoping, however there is no indication as to wetheror not the fibrils are uniformly doped. Recent X-raydiffraction measurements [36] show that, althoughthe fibrils are not uniformly doped, the isomerizationis pratically total.The results are interpreted using a model in which
the fibrils are only doped on the surface. The dopinginduces a cis-trans isomerization. Trans-chains beinglonger than cis-chains ( ~ 10 % longer) a strain isinduced that produces the isomerization of chainsdeeper in the fibril.Our infrared results are not contradictory to such a
model as they confirm that the isomerization can betotal. But in order to be quite isomerized thick samplesmust be doped more heavily than thinner ones. Thisresult can be explained by supposing that the stressexercised by external doped trans-layers of the fibrilshas a limited extent An elementary estimation can bemade, of trans/cis ratio n(r) at the distance r from thedeeper quite isomerized layer. Supposing that n(r) is alinear function of stress, and stress a linear function of
strain, n(r) is then an exponential function of r, with
the exponential coefficient depending on the materialmorphology. An increase in the doping induces totalisomerization of the inner layers and propels theisomerization to penetrate deeper.
Total isomerization will be obtained easier forsmall diameter fibrils than large diameter fibrils.
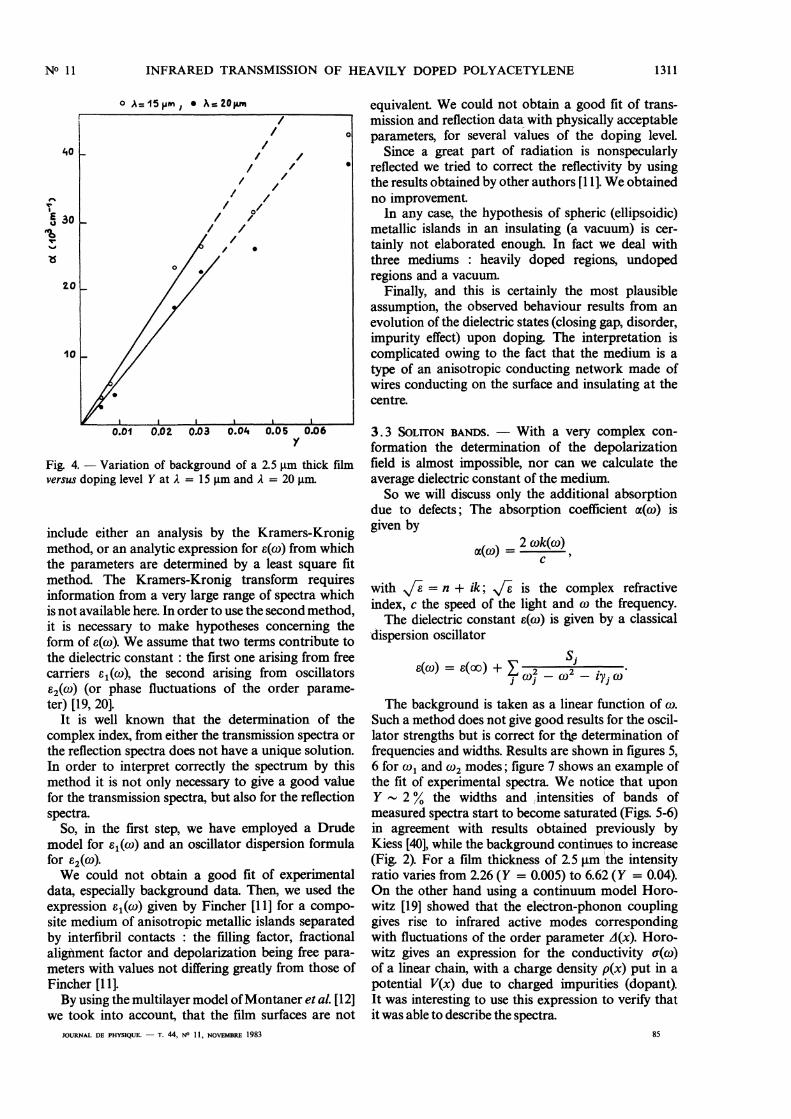
3.2 BACKGROUND: - It is noted that the back-
ground augments regularly with the doping level
(Fig. 4) and begins to become saturated at approxima-tely 6-7 %. This comportment is similar to that of thedc conductivity [34]. The analysis of spectra showsthat, at low doping levels the background transmis-sion decreases as the frequency decreases, whereas,with high doping levels, it is the opposite : the back-ground transmission increases as the frequency de-creases.
Such a result for high doped samples completelyagrees with the experimental results of Fincheret al. [11] and with Galtier’s results in far infrared [37]showing a frequency linearly dependent conductivityin doped (CH)x.The behaviour of the conductivity disagrees with a
single Drude model. Fincher et al. interpret their databy hypothesizing that doped (CH)x is a compositemedium with semi-conducting islands separated byinterfibril contacts. However, other authors : Grant [38]and Epstein [39] found that the conductivity wasfrequency independent down to 500 MHz, Moseset al. [34] concluded that the proposed metallic islandsdo not exist in trans (CH)x.
Possibilities of interpreting an infrared spectra
Fig. 3. - Infrared reflection spectra of a cis (CH)x film iodine doped up to Y = 0.07.
1311
Fig. 4. - Variation of background of a 2.5 um thick filmversus doping level Y at A = 15 um and A = 20 um
include either an analysis by the Kramers-Kronigmethod, or an analytic expression for e(w) from whichthe parameters are determined by a least square fitmethod The Kramers-Kronig transform requiresinformation from a very large range of spectra whichis not available here. In order to use the second method,it is necessary to make hypotheses concerning theform of 6(ct)). We assume that two terms contribute tothe dielectric constant : the first one arising from freecarriers e1(w), the second arising from oscillators
e2(w) (or phase fluctuations of the order parame-ter) [19, 20].
It is well known that the determination of the
complex index, from either the transmission spectra orthe reflection spectra does not have a unique solution.In order to interpret correctly the spectrum by thismethod it is not only necessary to give a good valuefor the transmission spectra, but also for the reflectionspectra.
So, in the first step, we have employed a Drudemodel for 81(ro) and an oscillator dispersion formulafor 82((0)’We could not obtain a good fit of experimental
data, especially background data. Then, we used theexpression B 1 (ro) given by Fincher [11] for a compo-site medium of anisotropic metallic islands separatedby interfibril contacts : the filling factor, fractionalalignment factor and depolarization being free para-meters with values not differing greatly from those ofFincher [11].By using the multilayer model of Montaner et al. [12]
we took into account, that the film surfaces are not
equivalent We could not obtain a good fit of trans-mission and reflection data with physically acceptableparameters, for several values of the doping level.
Since a great part of radiation is nonspecularlyreflected we tried to correct the reflectivity by usingthe results obtained by other authors [11]. We obtainedno improvement.
In any case, the hypothesis of spheric (ellipsoidic)metallic islands in an insulating (a vacuum) is cer-
tainly not elaborated enough. In fact we deal withthree mediums : heavily doped regions, undopedregions and a vacuum.
Finally, and this is certainly the most plausibleassumption, the observed behaviour results from anevolution of the dielectric states (closing gap, disorder,impurity effect) upon doping. The interpretation is
complicated owing to the fact that the medium is atype of an anisotropic conducting network made ofwires conducting on the surface and insulating at thecentre.
3.3 SOLITON BANDS. - With a very complex con-formation the determination of the depolarizationfield is almost impossible, nor can we calculate theaverage dielectric constant of the medium.So we will discuss only the additional absorption
due to defects; The absorption coefficient a(co) is
given by
with /~ = n + ik; ,/-e is the complex refractive
index, c the speed of the light and co the frequency.The dielectric constant e(ro) is given by a classical
dispersion oscillatorn
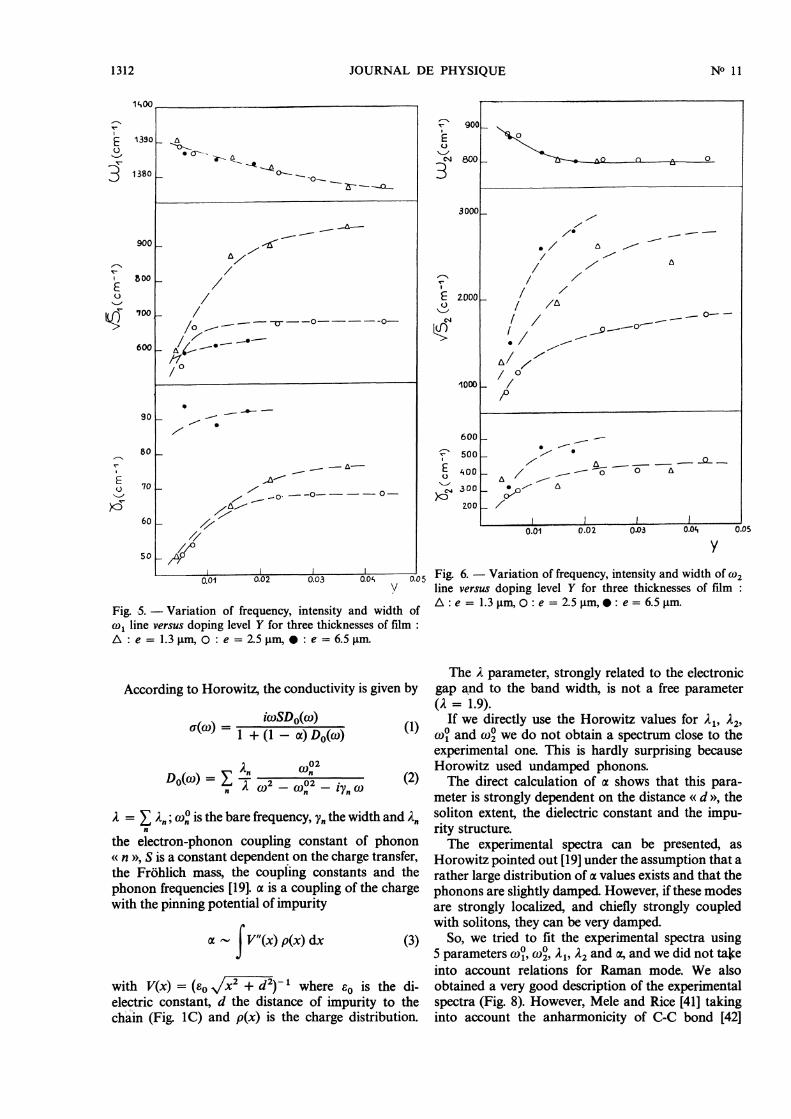
The background is taken as a linear function of co-Such a method does not give good results for the oscil-lator strengths but is correct for the determination offrequencies and widths. Results are shown in figures 5,6 for w1 and C02 modes; figure 7 shows an example ofthe fit of experimental spectra. We notice that uponY - 2 % the widths and intensities of bands ofmeasured spectra start to become saturated (Figs. 5-6)in agreement with results obtained previously byKiess [40], while the background continue to increase(Fig. 2). For a film thickness of 2.5 flm the intensityratio varies from 2.26 ( Y = 0.005) to 6.62 ( Y = 0.04).On the other hand using a continuum model Horo-witz [19] showed that the electron-phonon couplinggives rise to infrared active modes correspondingwith fluctuations of the order parameter A(x). Horo-witz gives an expression for the conductivity a(co)of a linear chain, with a charge density p(x) put in apotential V(x) due to charged impurities (dopant).It was interesting to use this expression to verify thatit was able to describe the spectra.
1312
Fig. 5. - Variation of frequency, intensity and width of(01 line versus doping level Y for three thicknesses of film :A : e = 1.3 tim, 0 : e = 2.5 gm 0 : e- = 6.5 gm.
According to Horowitz, the conductivity is given by
). = E A.; co’ is the bare frequency, Y. the width and A.n
the electron-phonon coupling constant of phonon« n », S is a constant dependent on the charge transfer,the Frohlich mass, the coupling constants and thephonon frequencies [19]. a is a coupling of the chargewith the pinning potential of impurity
with V(x) = (BoX2 + d2)-1 where so is the di-electric constant, d the distance of impurity to thechain (Fig. 1 C) and p(x) is the charge distribution.
Fig. 6. - Variation of frequency, intensity and width of w2line versus doping level Y for three thicknesses of film :A : e = 1.3 gm, 0 : e = 2.5 gm, 0 : e = 6.5 gm.
The A parameter, strongly related to the electronicgap and to the band width, is not a free parameter(A = 1.9).
If we directly use the Horowitz values for Å,1’ A2,coo and w02 we do not obtain a spectrum close to theexperimental one. This is hardly surprising becauseHorowitz used undamped phonons.The direct calculation of a shows that this para-
meter is strongly dependent on the distance « d», thesoliton extent, the dielectric constant and the impu-rity structure.The experimental spectra can be presented, as
Horowitz pointed out [19] under the assumption that arather large distribution of a values exists and that thephonons are slightly damped However, if these modesare strongly localized, and chiefly strongly coupledwith solitons, they can be very damped.
So, we tried to fit the experimental spectra using5 parameters a)o, 1 a)o, 2 All A2 and a, and we did not takeinto account relations for Raman mode. We alsoobtained a very good description of the experimentalspectra (Fig. 8). However, Mele and Rice [41] takinginto account the anharmonicity of C-C bond [42]

1313
Fig. 7. - Infrared transmission spectra of a 2.5 ym thick film for Y = 0.023. Full curve : experimental spectra. Dashedcurve : calculated spectra using a classical oscillator model with following values. col = 1382 cm-’; /S-i = 703 cm - I ;)’1 = 71 cm -1 ; W2 = 819 cm-’;.,/s2 = 1800 cm- i ; y2 = 436 cm-1. Extra bands at 730,1050 and 1250 cm-1 have beentaken into account by classical dispersion oscillator.
Fig. 8. - Infrared transmission spectra of a 2.5 um thick film for Y = 0.023. Full curve : experimental spectra. Dashedcurve : calculated spectra using the Horowitz model with following values. wi = 1381 cm-1; A, = 0.037 A; yi = 67 cm-1;wi = 782 cm -1 ; Å.2 = 0.963 Å.; 12 = 489 cm-1; a = 1.29; A = 0.19. Extra bands at 730,1050 and 1250 cm-1 have beentaken into account by classical dispersion oscillator.
introduce a linear dependence of C-C force constantwith the bond lengths.The presence of a defect modifies the distance of
C-C bonds, so, even without electron-phonon coupl-ing, there exist localized modes, for which the barefrequency would be found lower than 900 cm -1.
Simple calculations show that, if a soliton typedefect is present in a linear chain with a « great exten-sion », I, a localized mode is obtained with a frequency
close to w1 = (J)ma,,’ where wmax is the frequency2 of optical mode of the perfectly dimerized chain [43].

1314
Therefore, in the case of a trans-chain it would belikely to obtain, one or more localized modes whosefrequency is lower than 900 cm -1. These modes arealso coupled with electrons and it would be necessaryto consider them in the calculations of the responseof the system to the electric held
Horowitz, taking into account the Raman fre-
quencies, found a value for a equaling 0.24.Since, the lowest frequency lattice mode found by
Mele and Rice has a frequency value of 1 100 cm-1,Horowitz deducted that the 900 cm-1 mode (w2)could only be the pinned mode.
Indeed, in his model the lowest frequency infraredmode approaches zero when a --.> 0, as it can directlybe seen in expression 1.
In fact, the strong a dependence of w2 permits totest that this mode is either a pinned mode or notIndeed, it is easy to predict that, with increasing dopantconcentration, the dopant distribution will becomemore and more uniform along the chain, V"(x) willapproach zero for all values x and then the w2 fre-quency will also approach zero. To estimate thisvariation we can calculate a by a discret summationon sites.From Su et al. [45] the charge distribution p is given
by
Taking so = 14 [11]; d = 4 A [44]; l = 6 [45] andevenly distributed 13 molecules, parallel to the chain,as impurities, we obtain for a a value of 0.24 consistentwith the value obtained by Horowitz [19].We have done calculations with a chain with
1 000 (C-H) units from Y = 0.001 to Y = 0.15.Results are shown in figure 9. a is constant for lowdoping, then decreases rapidly as doping increases.This behaviour is easy to understand : invariance bytranslation will be restored in the limit of a continuedistribution of charged impurities, then Y"(x) = 0for all values x, thus a = 0 and w2 = 0 giving rise to aFrohlich type of conductivity. Figure 9 shows that asthe doping level increases, the frequency of w2 modedecreases drastically, which is inconsistent with expe-rimental data. So the w2 mode cannot be the pinnedmode. Recent results obtained by Tanaka [24] showthat, at low temperature, some other absorption bandsappear in the low frequency range. It is possible thatone of these bands correspond to the pinned mode,this, however, remains to be verified. ,,
Finally, we note that, according to the theory, thew1 mode frequency should only begin to vary for highdoping levels. In the other models, also, the varyingfrequencies of the localized modes becomes important,only at high doping level at which the soliton-solitoninteraction is strong. The fact that a rapid variationof the soliton frequencies is experimentally foundfrom low doping levels, shows that the doping is
extremely inhomogeneous. It also shows that, when
Fig. 9. - Variation of the coupling a with the pinningpotential of impurities, and frequencies of infrared activemodes m and w2 versus doping level Y.
we determine an average doping level from 0.5 % to 1 %there are, in fact, much more heavily doped regions(two or three times heavier) as well as undopedregions. The simplest model is one in which fibrils aredoped on the surface and lightly doped on the inside.The width of the 900 cm-1 and 1370 cm -1 is very
large and increases with doping. The most elementaryexplanation is to assume that there is disorder dueto a distribution of defects having slightly differentcharacteristics (soliton position and extent, dopantposition) Zerbi [17] Horowitz [46]. In another hypo-thesis, already mentionned by Mele and Rice [16] thewidth would arise from the coupling of the localizedmode with the soliton. It is evident that a strong coupl-ing must exist and produce a rather strong diminua-tion of the localized modes. Lastly, when the dopingincreases, the frequency decreases and the dampingincreases. Measurements of the widths of these modeswith decreasing temperature should make it possibleto choose from the different assumptions.
4. Conclusion.
Our measurements show :
That even in metallic state (Y > 0.06) the solitonbands persist (Fig. 2) and the chains with defects are

1315
stable, which is not in accordance with Bulka’sresults [21].That the doping is certainly not uniform in the
fibrils and it is difficult to interprete the results underthe assumption of a composite medium made bymetallic islands in an insulating medium.That the pinned mode frequency depends greatly
on the a coupling coefficient, which also dependsgreatly on the dopant charge localization, the polari-zability and the size of the ion, the electronic deloca-lization on the ion (I3, I5), therefore, we do notunderstand why, experimentally this frequency alwayshas the same value whatever the dopant species. So,the (02 mode cannot be the pinned mode. The w1and (02 bands are certainly localized excitations.That the Horowitz model clearly exhibits the
system’s properties, hypothesizing that col and w2are localized modes. Nevertheless, it is evident thatit will be necessary, in such a model, to introduce athird mode corresponding to a pinned mode, thefrequency of which approaches zero when the dopingincreases. The introduction of such a mode is neces-
sary to recognize the weak dependence of the w2 modeon the doping. It will also be necessary to take intoaccount the anharmonicity of a-bond which will giverise to localized excitation with bare frequencies
900 cm-1. It is difficult to explain the saturationof intensity values of the 900 cm-1 and 1370 cm-1bands. The presented calculations give only a relativevalue but it is obvious that beginning at a certainvalue, the intensity becomes practically constant whilethe background continues to increase.
It would seem that above a certain doping level,new soliton type defects no longer occur. This wouldimply that above 2 % the species no longer dopes newregions, which is in accordance with Robin’s X-raydiffraction measurements.
Besides, the method of analysis used, does notgive good absolute values for oscillator strength. Weonly interpreted the spectra with the additionalabsorption due to defects. In order to interpret themit would be necessary to precisely take into accountthe absorption due to free carriers and the absorptiondue to defects.
Lastly, it will be necessary to remake experimentswith much more accuracy especially as a function ofthe doping level, for Y values up to 0.01. Our work,only reports results concerning iodine doping andcannot extended without care, to other dopants.However recent infrared experiments dealing withMods dopant exhibit similar behaviour.
References
[1] For a review Proceedings of the International Confe-rence on Low-Dimensional Conductors. Les Arcs,1982 (J. Physique Colloq. 44 (1983) C3).
[2] IKEHATA, S., KAUFER, J., WOERNER, T., PRON, A.,DRUY, M. A., SIVAK, A., HEEGER, A. J. andMAC DIARMID, A. G., Phys. Rev. Lett. 45 (1980)1123.
[3] BERNIER, P., ROLLAND, M., GALTIER, M., MONTANER,A. REGIS, M., CANDILLE, M., BENOIT, C., ALDISSI,M., LINAYA, C., SCHUE, F., SLEDZ, J., FABRE,J. M., GIRAL, L., J. Physique Lett. 40 (1979)L-297.
[4] FINCHER, C. R. Jr, OZAKI, M., HEEGER, A. J. andMAC DIARMID, A. G., Phys. Rev. B 19 (1979)4140.
[5] ETEMAD, S., PRON, A., HEEGER, A. J., MAC DIARMID,A. G., MELE, E. J. and RICE, R. J., Phys. Rev.B 23 (1981) 5137.
[6] SUZUKI, N., OZAKI, M., ETEMAD, S., HEEGER, A. J.and MAC DIARMID, A. G., Phys. Rev. Lett. 45(1980) 1209, 45 (E) (1980) 1983.
[7] PARK, Y. W., DENENSTEIN, A., CHIANG, C. K., HEEGER,A. J. and MAC DIARMID, A. G., Solid StateCommun. 29 (1979) 747.
[8] PARK, Y. W., HEEGER, A. J., DRUY, M. A. and MACDIARMID, A. G., J. Chem. Phys. 73 (1980) 946.
[9] ETEMAD, S., MITANI, M., OZAKI, M., CHUNG, T. C.,HEEGER, A. J. and MAC DIARMID, A. G., SolidState Commun. 40 (1981) 75.
[10] LAUCHLAN, L., ETEMAD, S., CHUNG, T. C., HEEGER,A. J. and MAC DIARMID, A. G., Phys. Rev. B 24(1981) 3701.
[11] FINCHER, C. R. Jr, OZAKI, M., TANAKA, M., PEEBLES,D., LAUCHLAN, L., HEEGER, A. J. and MAC
DIARMID, A. G., Phys. Rev. B 20 (1979) 1589.[12] MONTANER, A., GALTIER, M., BENOIT, C., ALDISSI, M.,
Phys. Status Solidi 66 (1981) 267.[13] ROLLAND, M., ALDISSI, M., SCHUE, F., Polymer 23
(1982) 834.[14] BENOIT, C., GALTIER, M., MONTANER, A., E.P.S.
Conference Manchester, mars (1982).[15] FRANÇOIS, B., BERNARD, M. and ANDRE, J. J., J. Chem.
Phys. 75 (1981) 4142.[16] MELE, E. J. and RICE, M. J., Phys. Rev. Lett. 45 (1980)
926; Phys. Rev. B 23 (1981) 5137.
[17] ZANNONI, G. and ZERBI, G., Chem. Phys. Lett. 87
(1982) 50.[18] RABOLT, J. F., CLARKE, T. C., STREET, G. B., J. Chem.
Phys. 71 (1979) 4614.[19] HOROWITZ, B., Solid State Commun. 41 (1982) 729.
[20] NAKAHARA, M., MAKI, K., Phys. Rev. B 25 (1982)7789.
[21] BULKA, B. R., Phys. State Solidi (b) 107 (1981) 359.[22] ITO, T., SHIRAKAWA, H., IKEDA, S., J. Polym. Sci.
Polym. Chem. Ed. 12 (1974) 11 and 13 (1975) 1943.
[23] BERNARD, O., DELOUPY, C., PALPACUER, M., J. Phys.E. Sci. Inst. 14 (1981) 299.
[24] TANAKA, M., Les Arcs (1982) (J. Physique Colloq. 44(1983) C3).
[25] MONTANER, A., GALTIER, M., BENOIT, C. and ALDISSI,M., Solid State Commun. 39 (1981) 99.
[26] SHIRAKAWA, H. and IKEDA, S., Polymer J. 2 (1971) 231.
1316
[27] PALPACUER, M., BERNARD, O., DELOUPY, C., ROL-LAND, M., ABADIE, M. J. M., Polymer 23 (1982)1847.
[28] GALTIER, M., BENOIT, C., MONTANER, A., Proceedingsof the International Conference on Low-Dimen-sional Conductors Boulder U.S.A. 1981.
[29] BENOIT, C., GALTIER, M., MONTANER, A., Physicsand Chemistry of Solid to be published.
[30] ROLLAND, M., CADENE, M., BRESSE, J. F., ROSSI, A.,RIVIERE, D., ALDISSI, M., BENOIT, C., BERNIER, P.,Mat. Res. Bull. 16 (1981) 1045.
[31] ROLLAND, M., ALDISSI, M., CADENE, M., BRESSE, J. F.,BENOIT, C., Revue Phys. Appl. 17 (1982) 373.
[32] BENOIT, C., ROLLAND, M., ALDISSI, M., ROSSI, A.,CADENE, M., BERNIER, P., Phys. Status Solidi 68(1981) 209.
[33] JANOSSY, A., POGONY, L., PEKKAKA, S., SWIETLEK, R.,Private communication.
[34] MOSES, D., DENENSTEIN, A., CHEN, J., HEEGER, A. J.,Mc ANDREW, P., WOERNER, T., MAC DIARMID,A. G., PARK, Y. W., Phys. Rev. B 25 (1982) 7652.
[35] EPSTEIN, A. J., ROMMELMANN, H., DRUY, M. A.,HEEGER, A. J. and MAC DIARMID, A. G., SolidState Commun. 38 (1981) 683.
[36] ROBIN, P., POUGET, J. P., COMES, R., GIBSON, H. W.,EPSTEIN, A. J., International Conference on Low-Dimensional Conductors. Les Arcs (1982) to bepublished in J. Physique Colloq. 44 (1983) C3.
[37] CHARBONNEL, M., GALTIER, M., MONTANER, A., Pri-vate communication.
[38] GRANT, P. M., KROUNBI, M., Solid State Commun.36 (1980) 291.
[39] EPSTEIN, A. J., GIBSON, H. W., CHAIKIN, P. M., CLARK,W. G., GRUNER, G., Phys. Rev. Lett. 45 (1980)1730.
[40] KIESS, H., BAERISWYL, D., HARBEKE, G., Mol. Cryst.Liq. Cryst. 77 (1981) 147.
[41] MELE, E. J. and RICE, M. J., Solid. State Commun.34 (1980) 339.
[42] KAKITANI, T., Prog. Theoret. Phys. 51 (1974) 656.[43] BENOIT, C., Communication. R.C.P., Polymères Con-
ducteurs. Strasbourg (1983).[44] BAUGHMAN, R. H., International Conference on Low-
Dimensional Conductors. Les Arcs (1982) andpreprint (J. Physique Colloq. 44 (1983) C3).
[45] SU, W. P., SCHRIEFFER, J. R., HEEGER, A. J., Phys.Rev. B 22 (1980) 2099.
[46] HOROWITZ, B., Mol. Cryst. Liq. Cryst. 77 (1981) 285.