a presentation to iea ghg/ imperial college 11 november 2009 workshop/04_flexibility workshop...
TRANSCRIPT

The impact of intermittency
A presentation to IEA GHG/ Imperial College
11 November 2009

Agenda
1. About Pöyry
2. Introduction to study
3. Thoughts on an intermittent world
2

Pöyry Plc – global consulting and engineering company
Energy Forest Industry Transportation Water & Environment
Construction Services
(c) grafikdienst.com
3

Pöyry Energy Consulting
Strategy
Business Operation
Pöyry officesPöyry officesValuation & Financing
Over 250 energy market experts
(c) grafikdienst.com
Pöyry Energy Consulting offices
(c) grafikdienst.com
Pöyry Energy Consulting offices
Financing
in 15 offices across Europe:– Copenhagen – Düsseldorf – Helsinki – London – Madrid – Milan– Moscow – Oslo – Oxford
Sustainability
4
– Paris – Stockholm – Stavanger– Vienna – Villach – Zurich

Agenda
1. About Pöyry
2. Overview of study
3. Thoughts on an intermittent world
5

Study objectives
‘How could the impact of intermittent generation, required to meet targets for renewables and decarbonisation ofmeet targets for renewables and decarbonisation of generation, affect the wholesale energy markets in GB and Ireland?’
Specific areas of investigation• Market prices• Plant operation• New thermal generation• Wind revenue• Wind revenue• Reserve and response• Interconnection and transmissionte co ect o a d t a s ss o• Market arrangements• Security of supply
6

Study summary
• Almost £1m budget • 2 8 million wind records
Overview Sophisticated computer modelling…
• Almost £1m budget• Nov 2008 – May 2009• 5 Workstreams• 4 Steering Group meetings
• 2.8 million wind records
• Each model run generates 50 million records, 840,000 prices and a 1.5GB database
• 2 major presentations• Final report • A total of 150GB of data generated from
the study
Study membership
6 Founders• Centrica • ESB/I
Study membership
4 t b di• DONG• EirGrid
• National Grid• RES
10 Members
• 4 government bodies
• 3 grid operators
• 4 established players/ incumbents
• Bord na Mona • Committee on Climate
Change• DECC
• EDF Energy• Premier Power• Scottish Power• CER/NIAUR
• 2 wind power operators
• 3 new entrants
7
CC• Bord Gais• RWE
CER/NIAUR• Premier Power• SWS Energy

Summary of modellingZephyr has been designed specifically to answer the key questions about how
Principles Platform
Zephyr has been designed specifically to answer the key questions about how intermittency could affect the GB wholesale market
• Detailed underlying wind dataH l d t f 8 f
Principles Platform
N b ild fDemand module Prices
N b ild fDemand module Prices
– Hourly data for 8 years for 36 sites
• History as basis
New build of generation
moduleWind/ Wave/ Tidal (WWT)
moduleAvailability
moduleValue of C it
Load factors
New build of generation
moduleWind/ Wave/ Tidal (WWT)
moduleAvailability
moduleValue of C it
Load factors
History as basis– Wind, availability and
demand– 8 historical simulations for
h f t
External border module
Capacity module
Zonal data
InterconnectionZephyrZephyrExternal border module
Capacity module
Zonal data
InterconnectionZephyrZephyr
each future year
• Zonal analysis
• 8760 hours per year
• Mixed integer linear program
• Plant dynamicsPlant data
Commodity price data
Reserve data
Plant revenue• 8760 hours per year
• Mixed integer linear program
• Plant dynamicsPlant data
Commodity price data
Reserve data
Plant revenue
• Value of capacity
• System security standard
• Zonal analysisPlant data Constraints
• Zonal analysisPlant data Constraints
8
y y

Agenda
1. Introduction to study
2. Overview of study
3. Thoughts on an intermittent world
9

Summary of ‘Core scenario’The study was focused around a Core scenario It does not represent a base case but
Fuel and demand assumptionsInstalled capacity assumptions in GB
The study was focused around a Core scenario. It does not represent a base case but instead provides a ‘stress-test’ with a high percentage of generation from renewables.
11
120
Fuel and demand assumptionsInstalled capacity assumptions in GB
• Demand was assumed to grow at around 0 4% p a
6
2929
26
5
32
11
80
100
GW
)
Peaker
CCGT
Coal
around 0.4% p.a.
• Oil price ~$70/bblC l i $70/t
248
11
2
2
3
7
8
9
1912
2731
31
60
led
capa
city
(G
C
CHP
CCSCoal
• Coal price ~$70/tonne• Carbon price ~€37/tCO2
N b ild f CCGT d l i k t
4249
2
4 4
4
472
5
6 6
2723 19 1
1
5720
40Inst
al Nuclear
Biomass
Renewables
• New build of CCGT and coal is market determined
N b ild f bl l d15 17
344 4
6
11
1210
0
20
2010 2015 2016 2020 2025 2030
Renewables
Wind +marine
• New build of renewables, nuclear and coal CCS is ‘non-market determined’
10

The study assumed wind generation build patterns across the UK and the ROI Hourly historical wind speed data for each region was used to simulate wind generationHourly historical wind speed data for each region was used to simulate wind generation
Installed capacity by region: 2030Installed capacity by region: 2020
GB Capacity: 32.7GW GB Capacity: 43.1GW
1111Installed capacity (MW):
SEM Capacity: 6.1GW SEM Capacity: 7.9GW
5000 80001000
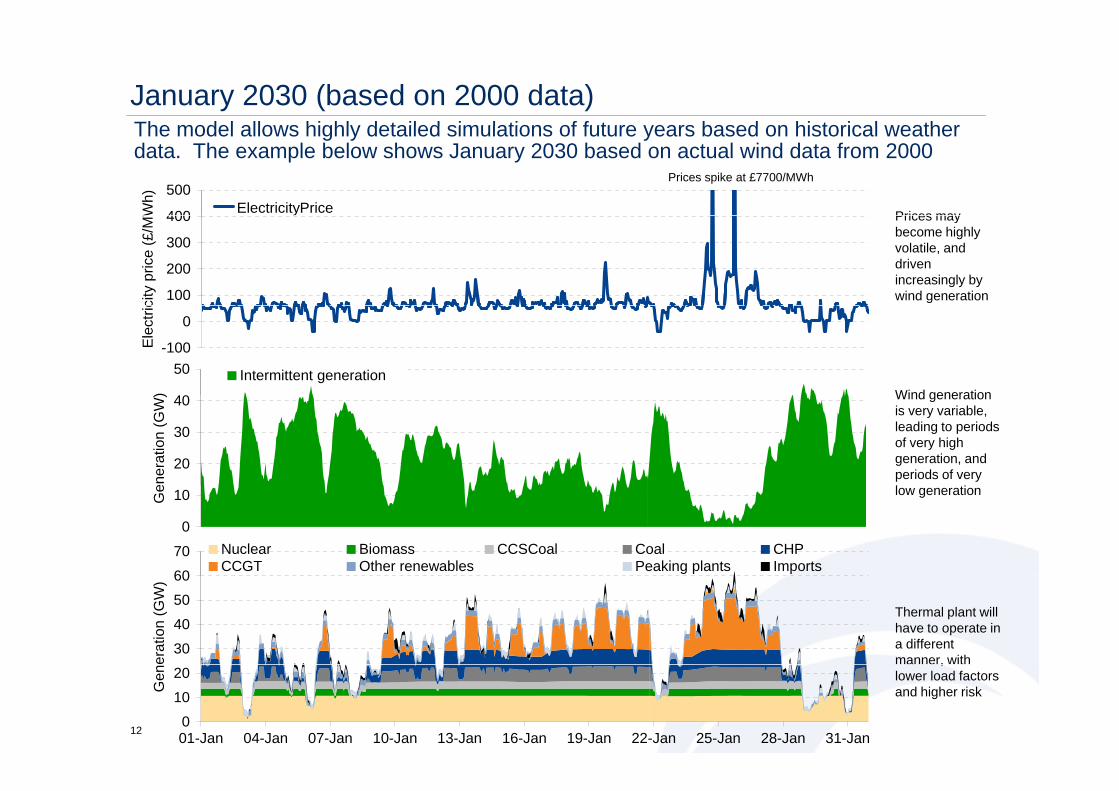
January 2030 (based on 2000 data)The model allows highly detailed simulations of future years based on historical weather
Prices spike at £7700/MWh
The model allows highly detailed simulations of future years based on historical weather data. The example below shows January 2030 based on actual wind data from 2000
Prices may400
500
Wh)
ElectricityPrice Prices may become highly volatile, and driven increasingly by wind generation100
200
300
400
city
pric
e (£
/MW
Wind generation
-100
0
Ele
ctric
40
50
)
Intermittent generationWind generation is very variable, leading to periods of very high generation, and periods of very
20
30
40
ener
atio
n (G
W)
low generation
60
70 Nuclear Biomass CCSCoal Coal CHPCCGT Other renewables Demand Peaking plants Imports
0
10Ge
Thermal plant will have to operate in a different manner, with
30
40
50
60
erat
ion
(GW
)
12
,lower load factors and higher risk
0
10
20
01-Jan 04-Jan 07-Jan 10-Jan 13-Jan 16-Jan 19-Jan 22-Jan 25-Jan 28-Jan 31-Jan
Gen

GB – January 2010 (based on year 2000)200)
100
150
200
rice
(£/M
Wh)
Electricity Price
60
50
100
Ele
ctric
ity p
3
4
5
6
on (G
W) Intermittent generation
0
1
2
3
Gen
erat
i
50
60
70
(GW
)
Nuclear Biomass Coal CHP CCGT Other renewables Demand Peaking plants Imports0
10
20
30
40
Gen
erat
ion
13
0
10
01-Jan 04-Jan 07-Jan 10-Jan 13-Jan 16-Jan 19-Jan 22-Jan 25-Jan 28-Jan 31-Jan

Understanding the ‘demand net wind’Operating space for thermal plant will decrease
Demand and demand net wind duration curve for GB in 2030
Operating space for thermal plant will decrease
• At present, there is a continuous requirement of
d 30GW
2030
65 000
75,000Demand
Demand net Windaround 30GW
• In the core scenario demand net wind varies
55,000
65,000
demand net wind varies between 0-65GW
• Less need for base load35,000
45,000
MW
• Less need for base load generation
15 000
25,000
5,000
15,000
14
-5,000 0%20%40%60%80%100%

Plant operation profiles will change radicallyNot only will thermal plant load factors be squeezed by intermittent and
L d f t b l t t GB
Not only will thermal plant load factors be squeezed by intermittent and baseload generation, but operating regimes will change
Starts per yearLoad factor by plant type – GB
100%
Starts per year
160CCGT E
70%
80%
90%
acto
r
Nuclear
CCSCoal
100
120
140CCGT_E
CCGT_F
Coal
40%
50%
60%
ual a
vera
ge lo
adfa Biomass
CHP
CCGT_F 60
80
100
10%
20%
30%Ann
u
Coal
CCGT_E
0
20
40
0%2010 2015 2016 2020 2025 2030
Peaker02010 2015 2016 2020 2025 2030
15 Data from Core scenario

Sensitivity of prices year on yearIf security of supply is maintained prices will become very peaky with prices over
20302020
If security of supply is maintained, prices will become very peaky – with prices over £7000/MWh and less than zero by 2030
Prices spike at £7700/MWh
16

GB faces an investment conundrumE i th t b l ill b i i l diffi lt th it lEarning the returns below will become increasingly difficult, as the scarcity value has to be captured in a smaller number of hours
C it i i GB
30%
Capacity margins in GB• LCPD and (possibly)
the IED will retire old mid-merit and peaking
20%
25%2030
2016
mid merit and peaking generation
• With a continuation of
10%
15%
paci
ty m
argi
n
2006
• With a continuation of BETTA, the capture of capacity revenue will become more difficult
5%
0%
5%
0% 5% 10% 15% 20%
Cap
2007
become more difficult
• Differences in t b t
-10%
-5%
% of periods
2008outcomes between a BETTA and SEM market are stark
17

Summary
• A high wind world will look very different to currently
• The thermal system will flex in response to the wind• Extremes will become more importantp• Spiky prices• Uncertainty and risk• Changing operating patterns• Investment conundrum in GB
• Is CCS well suited to this environment?
• Potential effect on gas network?
18

Gas intermittency projectA multi client gas intermittency project began in September investigating the
Areas of investigationDaily gas demand
A multi-client gas intermittency project began in September, investigating the implications on the gas network
• Market and investment120Projected power gen. gas demand 2030
Areas of investigationDaily gas demand
• Value of storage and flexibility80
100Actual power gen. gas demand 2007
• System operation40
60
MC
M
• Regulation
0
20
01- 08- 15- 22- 29- 05- 12- 19- 26- 03- 10- 17- 24- 31-Oct Oct Oct Oct Oct Nov Nov Nov Nov Dec Dec Dec Dec Dec
19

Pöyry Energy ConsultingKing Charles HousePark End Street
James Cox [email protected]
Oxford, UKOX1 1JD
+44 (0)1865 722660www.poyry.comwww.ilexenergy.com
Pöyry Energy (Oxford) Ltd. Registered in England No. 2573801. King Charles House, Park End Street, Oxford OX1 1JD.