a perspective on the u.s. construction industry luke m. snell director, concrete industry management...
TRANSCRIPT
A PERSPECTIVE ON THE U.S. CONSTRUCTION
INDUSTRY
Luke M. SnellDirector, Concrete Industry Management
Del E Webb School of ConstructionArizona State University
Tempe, Arizona

U.S. CONSTRUCTION INDUSTRY
Estimated Value of Construction in Place (2004): $1,009 Billion
Private Sector $ 773 Billion Public Sector $ 236 Billion Total $1,009 Billion
Private Sector
Residential Construction $549 Billion Non-Residential Construction $224 Billion Total $773 Billion

CONSTRUCTION INDUSTRY
Construction Management/Design Build approaches have become popular in the
Private Sector Non-Residential Projects.
Public Sector has just started using these methods.

CONSTRUCTION INDUSTRY IS A MAJOR CONTRIBUTOR TO THE U.S. ECONOMY
Representing 8 % of the Gross Domestic Product (GDP)
Gross Domestic Product equals the Value of Goods and Services Produced in a Country.

GDP OF THE
LEADING COUNTRIES IN 2003
U.S. $11 Trillion China $6.5 Trillion Japan $3.6 Trillion India $3 Trillion Germany $2.3 Trillion

GDP PER CAPITA
OF THELEADING COUNTRIES
IN 2003
Luxembourg $55,100U.S. $37,800Norway $37,700 San Marino $34,600Denmark $31,200China $5,000 India $2,900

U.S. CONSTRUCTION INDUSTRY
Employees – 6 Million Workers equaling 5 percent of the workforce.
Construction Growth in the last 30 years has been poor.
Record Year was 1972 (11.2% of the GDP).

U.S. CONSTRUCTION INDUSTRY
6%
8%
10%
12%
1966 1970 1980 1990 2000
1966-2003 PERIOD
An
nu
al C
onst
ruct
ion
As
% o
f G
DP
67 68 69 71 72 73 74 76 77 78 79 81 82 83 84 86 87 88 89 91 92 93 94 96 97 98 99 01 02 03
Annual Construction as % Of Gross Domestic Product (GDP)(Source: U.S. Department of Commerce)
1975 1985 1995
10.9%
10.2%
9.4%9.8%
9.6%
8.2%
8.1%
8.4%
11.2%
7.9%

U.S. CONSTRUCTION INDUSTRY
REASONS FOR SLOW GROWTH
Quality ProblemsConstruction Accidents/InjuriesSchedule/Cost OverrunsLack of Research/InnovationsPoor ManagementExcessive RegulationIncreasing LitigationLack of Resources (Materials, Skilled Labor)

1
Southern Illinois University at Edwardsville: Bodapati/Kay
Year Market Share
1980 50%
1986 31%
1989 23%
1996 18%
2003 19%
U.S. Share in International Construction

DECLINING U.S. SHARE IN FOREIGN MARKETS
Reasons
High overhead (competing with Korea, China, Japan and others)
Lack of knowledge of how work in foreign countries is bid and executed.
Language problems
Unfamiliarity with Metric Measurement.
Reluctance on the part of the U.S. constructors to work abroad.

COST INCREASES
EXAMPLE PROJECT #1
Denver International Airport, Denver, Colorado
Cost Overrun: $3 BillionSchedule Delay: 18 months

EXAMPLE PROJECT #2
St. Louis Airport – East Terminal
Cost Estimate 1994 - $61 Million Cost Estimate 1997 - $97 Million Cost Estimate 1999 - $106 Million
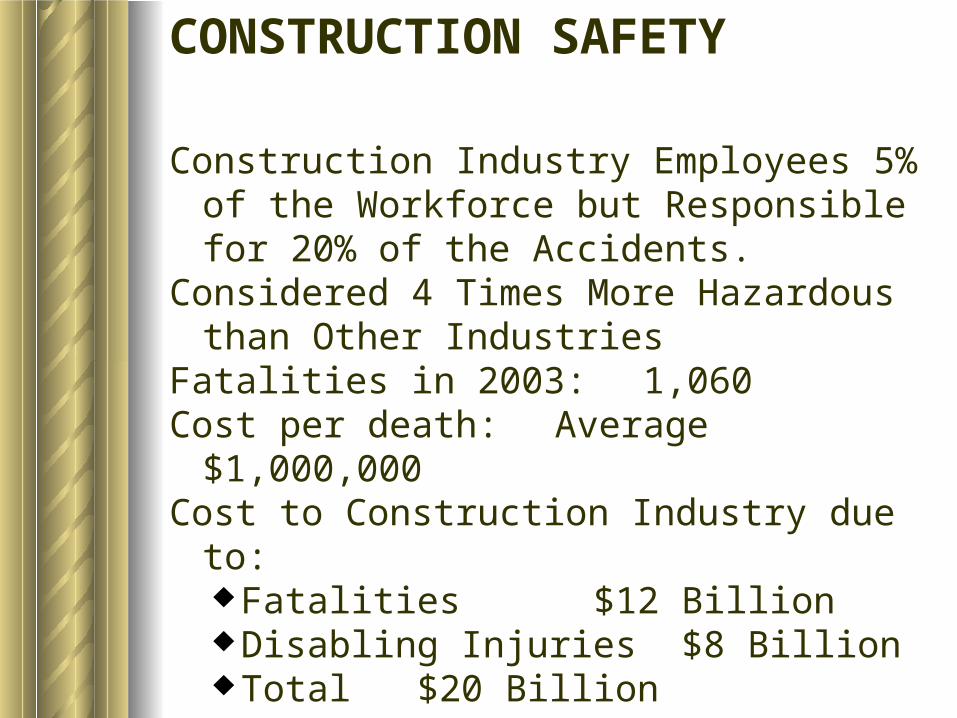
CONSTRUCTION SAFETY
Construction Industry Employees 5% of the Workforce but Responsible for 20% of the Accidents.
Considered 4 Times More Hazardous than Other Industries
Fatalities in 2003: 1,060Cost per death: Average $1,000,000Cost to Construction Industry due to:
Fatalities $12 Billion Disabling Injuries $8 Billion Total $20 Billion

Construction Industry Fatalities 1984-2003
0
500
1000
1500
2000
2500
YEAR
FATA
LITI
ES
Fatalities
2,200
1,060

Construction Industry Disabling Injuries 1984-2003
0
100000
200000
300000
400000
500000
YEAR
DISA
BLIN
G IN
JURI
ES
Disabling Injuries
220,000390,000

Work-Related Deaths and Injuries in 2003
Industry Deaths Disabling Injuries
All Industries 4,500 3,400,000
Agriculture 710 110,000
Mining, Quarrying 120 20,000
Construction 1,060 390,000
Manufacturing 490 460,000
Transportation 770 320,000
Trade 380 710,000
Services 550 890,000
Government 420 500,000
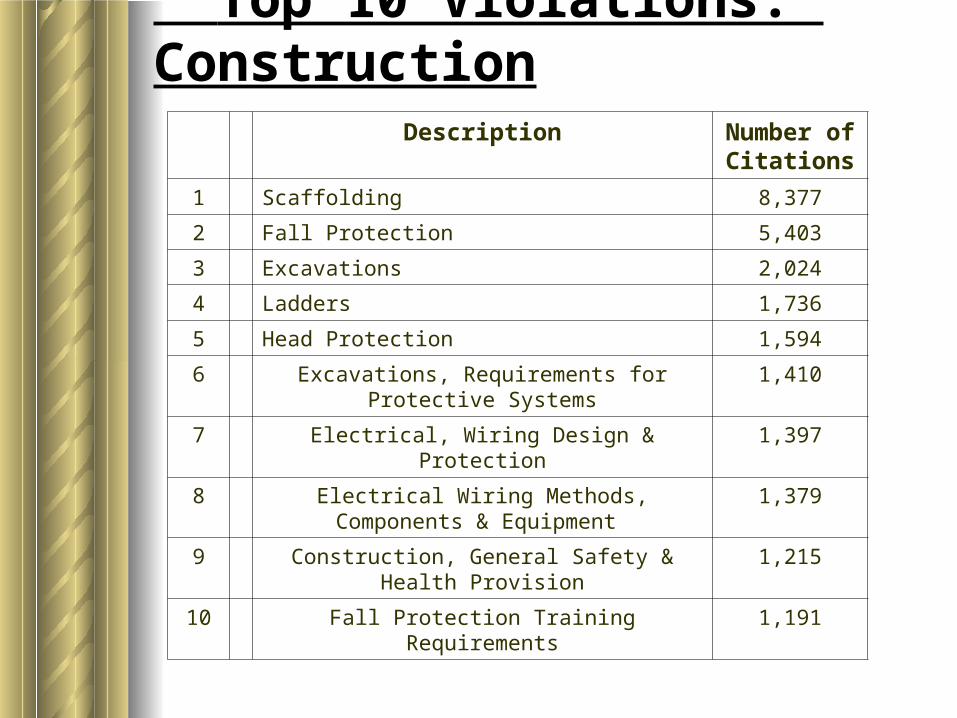
Top 10 Violations: Construction
Description Number of Citations
1 Scaffolding 8,377
2 Fall Protection 5,403
3 Excavations 2,024
4 Ladders 1,736
5 Head Protection 1,594
6 Excavations, Requirements for Protective Systems 1,410
7 Electrical, Wiring Design & Protection 1,397
8 Electrical Wiring Methods, Components & Equipment
1,379
9 Construction, General Safety & Health Provision 1,215
10 Fall Protection Training Requirements 1,191

CONCLUSIONS
Construction Industry has to:Improve the project delivery process to:
Improve QualityManage Costs and ScheduleControl Construction Accidents/Injuries
Increase Research SpendingPromote Training of Construction SkillsEncourage Undergraduate/Graduate Education
in Construction