(a) personal details role name affiliation
TRANSCRIPT

1
(A) Personal Details
Role Name
Affiliation
Principal Investigator Prof. Masood Ahsan Siddiqui
Jamia Millia Islamia New Delhi
Paper Coordinator Prof. Aslam Mahmood Jawaharlal Nehru University New
Delhi
Content writer/Author
(CW)
Dr. Madhushree Das Geography, Gauhati University,
Guwahati
Content Reviewer (CR) Prof. Aslam Mahmood Jawaharlal Nehru University New
Delhi
Language Editor (LE)
(B) Description of Module
Items Description of Module
Subject Name Geography
Paper Name Quantitative Techniques in Geography
Module Name Measurement and Analysis of Planar Network System
Module ID QT 27
Pre- Requisites Basic knowledge of measurements of simple algebra and
concept of network are necessary to understand the
Network analysis
Objectives (i) to understand the procedure of calculation of
different indexes related to planar network system, and
(ii) to show its uses with relevant examples.
Key words Planar network system, network design, connectivity, alfa
index, detour index, Pi index, Diameter of network, eta
index

2
Measurement and Analysis of Planar Network System
Madhushree 1.0: Introduction:
Network analysis is an important aspect of spatial organization of socio economic activities.
groups, organizations and circuits of networkwhich are associated with graph theory, are part of
network analysis. Such aspects are useful for study of diffusion of innovations, spread of
diseases, political movements, traffic analysis, drainage network and computer networking.
Graph theory is mostly based of two elements of space: Vertex of network (that is called
nodes)and edge(or arcs) which connects two vertexes in the network. Network problems that
involve finding an optimal way of doing something are analysed through graph theory.
2.0: Network Description
The analysis of transport network has become an important part of geographical studies only in
relativity recent years. Formerly transport network tended to develop in a somewhat random and
often unrelated fashion but post-war changes and developments in transport focused attention
upon the analytical study of networks; for instance, in Britain (and indeed, elsewhere in the
world), the construction of motor ways the nationalization of railways and growth in air transport
as well as development in communications, led to the development of network analysis, if only
because of economic considerations. When route ways such as motor ways cost much as $ 1
million per kilometer to construct; it becomes especially important that the proposed motor way
network pattern should be subjected to careful and critical scrutinyto ensure costs and maximum
benefits should be achieved.
Networksvary greatly. For example, they must geometrically be planar (two-dimensional) or
non-planar (three dimensional). They vary in their size, connectivity, and complexity; they may
have relatively fixed channels of movement, such as railways, or relative freedom of movement,
as with ships or aircrafts. The figure below shows the topological classification of networks
(after P. Haggett).

3
NETWORKS
PLANER NETWORKS NON-PLANAR NETWORKS
PATHS TREESCIRCUITS CELLS
LINEAR FLOW SYSTEM LINEAR BARRIER
Fig.-1: Topological Classification of Networks
Network description involves the description of the disposition of nodes and their relationship
and line or linkage distribution. Such a description is valuable not only because it helps to
measure accessibility but also it allows comparisons to be made between regional networks
within a country and between one country’s networkswith another. Such variations may be
related to other variation, i.e. mean income per head, and thus it becomes possible to use them as
indicators of economic development. Fitzeraldhas said that variations in the characteristics of
networks may be considered to reflect certain spatial aspects of the socio economic system.
It is possible to describe networks in a variety of ways and here we may consider:
i. The connectivity of networks
ii. Centrality within networks
iii. The spread and diameter of networks
iv. Detours
3.0 The Connectivity of Networks
The connectivity of a network may be defined a degree of completeness of the links
between node. It will be clearly apparent that the more areas there are in any transportation
network, the more complete will be the linkage between the various nodes. The greater the
degree of connectivity within a transportation network, the more efficient will be the system. In
studying real transportation systems it becomes necessary for the transport geographer to be able
to measure the degree of connectivity of the network in an order that constitute comparisons of
efficiency vis-à-vis different networks and also consider and elicit the reasons for the difference
between them.

4
K.J. Kansky, an American scientist who has studied the structure of transportation networks
developed different indices for measuring the connectivity of networks, which includes a.
cyclomatic number, b. alpha index, c. beta index and d. gamma index. These structural elements
of network are interpreted below.
3.1 Cyclomatic Number: Aunique way of measuring connectivity is by means of cyclomatic
number. The cyclomatic number may be formulated as:
Cyclomatic Number = a-(n-1), … … …(1)
Where a= number of arcs and n= number of nodes.
This equation is more commonly written as (a-n+1) as it is algebraically a simple term of the
same. Thus, the cyclomatic number may be formed by subtracting the number of nodes from the
no. of arcs. This formula can also bewritten substituting 1 by x in order to connect it to graph,
where there happens to be two or more sub graphs, x.Then the formula for the cyclomatic
number is written as:
Cyclomatic Number = a- n+x, … …(2)
where,x= no. of sub graphs.
The cyclomatic number is of little value in distinguishing between networks possessing low
levels of connectivity. But where the networks are more complex nature, the cyclomatic numbers
tells how many fundamental circuits are present in the transportation network.
3.2Alpha Index:It shows the degree of connectivity.The alpha index ( ) is the ratio of the
actual number of circuits in a network to the maximum possible number of circuits in that
network. It is of the most useful and perhaps the best measure of connectivity of a network,
particularly a fairly complex network. This consists of the ratio of the number of fundamental
circuits to the maximum possible number of which may exist in a network. This index is also
called Meshedness Coefficient in the literature on planar networks. The formula of alpha index
is:
𝑎−𝑛+1
2𝑛−5
If the index is multiplied by 100, this will be converted into percentage thereby giving the
number of fundamental circuits as the percentage of maximum number possible.

5

6
1.Arunachal Pradesh
2. Assam
3. Manipur4. Meghalaya
5. Mizoram
6. Nagaland
7. Tripura
Fig.-2: Road map of North East India for the calculation of connectivity indices
The value of alpha index ranges from 0 to 1, or from 0 to 100 if it is converted into percent. The
higher the index, the greater is the degree of connectivity in the network and vice versa. Here, 0
indicates no circuits and value of 1 or 100 percent indicates completely interconnected network
in which every possible link between various nodes exists. Simple network such as tree network
has nil value.
Let us examine the degree of road connectivity in North East India using the Alpha Index.

7
Table-1:Calculation of alpha index for the states of North-East
States Arcs Nodes Alpha Index
Assam 37 19 57.57
Arunachal Pradesh 4 3 200
Nagaland 7 4 133.3
Manipur 8 5 80
Mizoram 8 5 80
Tripura 6 4 100
Meghalaya 9 5 100
Figure 3: Degree of road network connectivity in North East India using Alpha Index
3.3Beta Index:It indicates arcs of road network per node. The beta(β) index is a simple measure
of connectivity whichiscalculated by dividing the total number of area in a network by the total
number of nodes. Thus,
Beta index () = 𝑎𝑟𝑐𝑠
𝑛𝑜𝑑𝑒𝑠 . … … (4)
The beta index is very useful for measuring the connectivity of simple networks. The beta index ranges
from 0.00 for network which consists just of nodes with no arcs through 1.00 and greater where networks

8
are well connected. For instance very simple networks and trees possess values less than 1.0, a connected
network involving a single circuit has a rule of 1.0, while networks of greater complexity which include
several circuits have higher than 1.0. The beta index is of less value for complex networks than for simple
ones. Now let us examine the degree of road connectivity in North East India using the Beta Index.
Table-2:Calculation of beta index for the states of North-east
States Arcs Nodes Beta Index
Assam 37 19 1.95
Arunachal Pradesh 4 3 1.33
Nagaland 7 4 1.75
Manipur 8 5 1.6
Mizoram 8 5 1.6
Tripura 6 4 1.5
Meghalaya 9 5 1.8
Fig.-4: Degree of road network connectivity in North East India using Beta Index

9
3.4 Gamma Index: The Gamma () index describes in numerical terms the connectivity of a
network. It is a measure of connectivity that considers the relationship between the number of
observed links and the number of possible links. The value of gamma is between 0 and 1 where a
value of 1 indicates a completely connected network and would be extremely unlikely in reality.
Gamma is an efficient value to measure the progression of a network in time. The formula for
gamma index is:
Gamma index () = 𝑎𝑟𝑐𝑠
3(𝑛𝑜𝑑𝑒𝑠−2) . … … …(5)
Now let us examine the degree of road connectivity in North East India using the Gamma Index.
Table-3:Calculation of gamma index for the states of North-east
States Ar
cs
No
des
Gam
ma
Inde
x
Assam 37 19 72.5
4
Aruna
chal
Prades
h
4 3 133.
33
Nagala
nd
7 4 116.
66
Manip
ur
8 5 88.8
8
Mizor
am
8 5 88.8
8
Tripur
a
6 4 100
Megha
laya
9 5 100
10
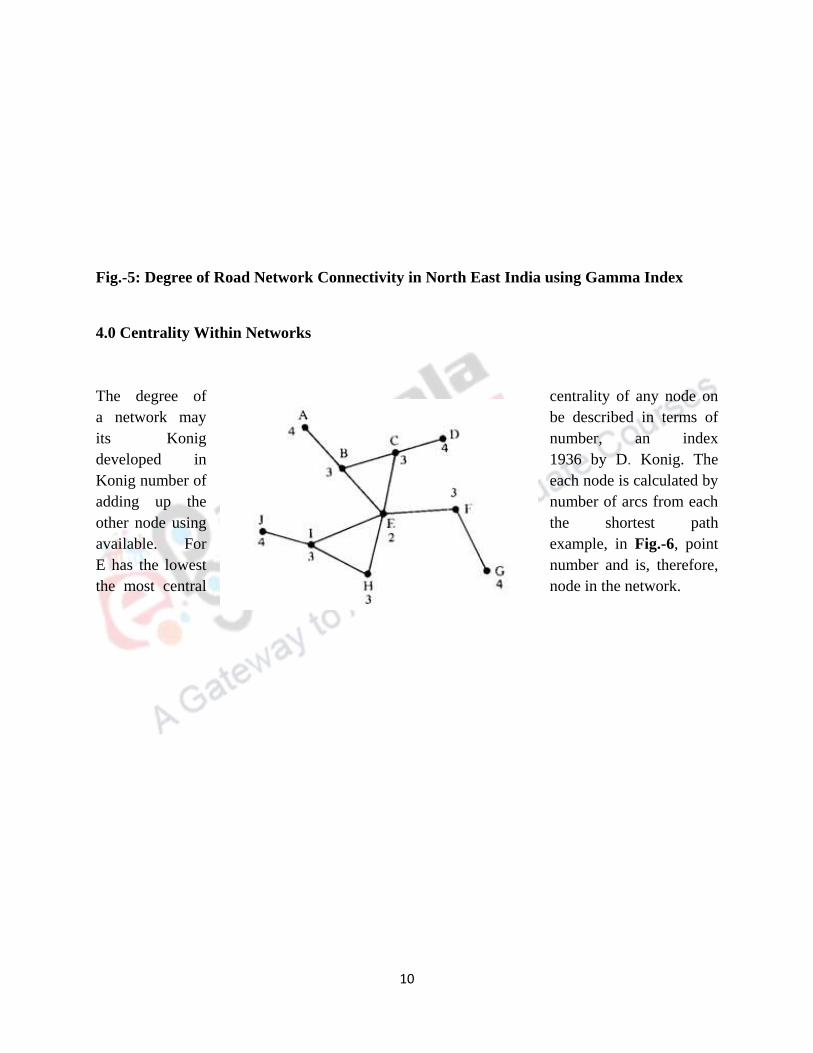
Fig.-5: Degree of Road Network Connectivity in North East India using Gamma Index
4.0 Centrality Within Networks
The degree of centrality of any node on
a network may be described in terms of
its Konig number, an index
developed in 1936 by D. Konig. The
Konig number of each node is calculated by
adding up the number of arcs from each
other node using the shortest path
available. For example, in Fig.-6, point
E has the lowest number and is, therefore,
the most central node in the network.

11
Fig.-6: The centrality of nodes on a network in terms of their Konig number ( E has the
lowest Konig number thus is the most central)
5.0 The Spread And Diameter of the Network
The diameter of network was examined by Kansky who developed two useful indices to measure
the spread of network. The description of a network in terms of its diameter involves the
counting of the number of arcs on the shortest possible path between the two nodes lying farthest
apart on the network. In general terms, the diameter increases with increasing size of the
network, although any addition of connecting areas may result in the diameter being decreased.
These two indices are: a. Pi () Index and b. Eta (Index.
a. Pi Index: It shows the relationship between the total length of the graph (c) and the distance
along its diameter (d). It is labeled as Pi because of its similarity with the real Pi value
(3.14), which is expressing the ratio between the circumference and the diameter of a circle.
A high index shows a developed network. It is a measure of distance per units of diameter
and an indicator of the shape of a network. It is expressed as:
=𝑐
𝑑 , … … …(6)
where c is the total length of the network and d is the distance along its diameter
b. Eta Index: The Eta () Index a similar index to the index of Kansky, which also gives
some idea of the spread of the network. Average length per link. Adding new nodes will
cause a decrease of Eta as the average length per link declines. The eta index is given by the
formulae:
𝑐
𝑎
Where c is total distance of the network and a is the number of arcs
6.0 Detour Index
In the opinion of Robinson and Bamford (1978), owing to topography and other obstacles
the direct paths are deflected or deviated. Such deviations can be measured with the help of the
Detour Index. Thus, we can use route distances and straight line distances to determine the
efficiency of a specific route as compared with another. The formula is:
Detour Index = 𝐴𝑐𝑡𝑢𝑎𝑙𝑟𝑜𝑢𝑡𝑒𝑑𝑖𝑠𝑡𝑎𝑛𝑐𝑒
𝑆𝑡𝑟𝑎𝑖𝑔ℎ𝑡𝑙𝑖𝑛𝑒𝑑𝑖𝑠𝑡𝑎𝑛𝑐𝑒×
100
1 . … …(8)

12
Such a detour index may be compared with various aspects of physical geography, such as the
degree of dissection or drainage density of an area over which the routes run.The detour index
may also be used to give some comparison between routes before and after improvement has
taken place.For example, let us calculate the relative road transport accessibility from the district
head quarters of Assam to Guwahati City using the detour index.
Table-4:Actual and Straight road distances of the district headquarters of Assam from Guwahati to
Different District Headquarters
District headquarters Actual road distance
(km)
Straight line distance
(km)
Detour index
Dhubri 290 180 161
Kokrajhar 236 147.5 160
Bongaigaon 210 122.5 171.4
Barpeta 140 75 186.6
Goalpara 150 112.5 133.3
Nalbari 71 47.5 149.4
Mangaldoi 68 42.5 160
Tezpur 181 117.5 147.7
Lakhimpur 396 260 152.3
Dhemaji 462 312.5 148
Morigaon 78 62.5 124.8
Nagaon 123 95 129.4
Golaghat 288 222.5 129.4
Jorhat 304 247.5 122.8
Sibsagar 363 297.5 122.01
Dibrugarh 443 340 130.3
Tinsukia 591 390 151.5
Diphu 271 165 164.2
Haflong 368 165 223.0
Silchar 343 177.5 193.2
Hailakandi 336 180 186.6
Karimganj 338 152.5 221.6
13
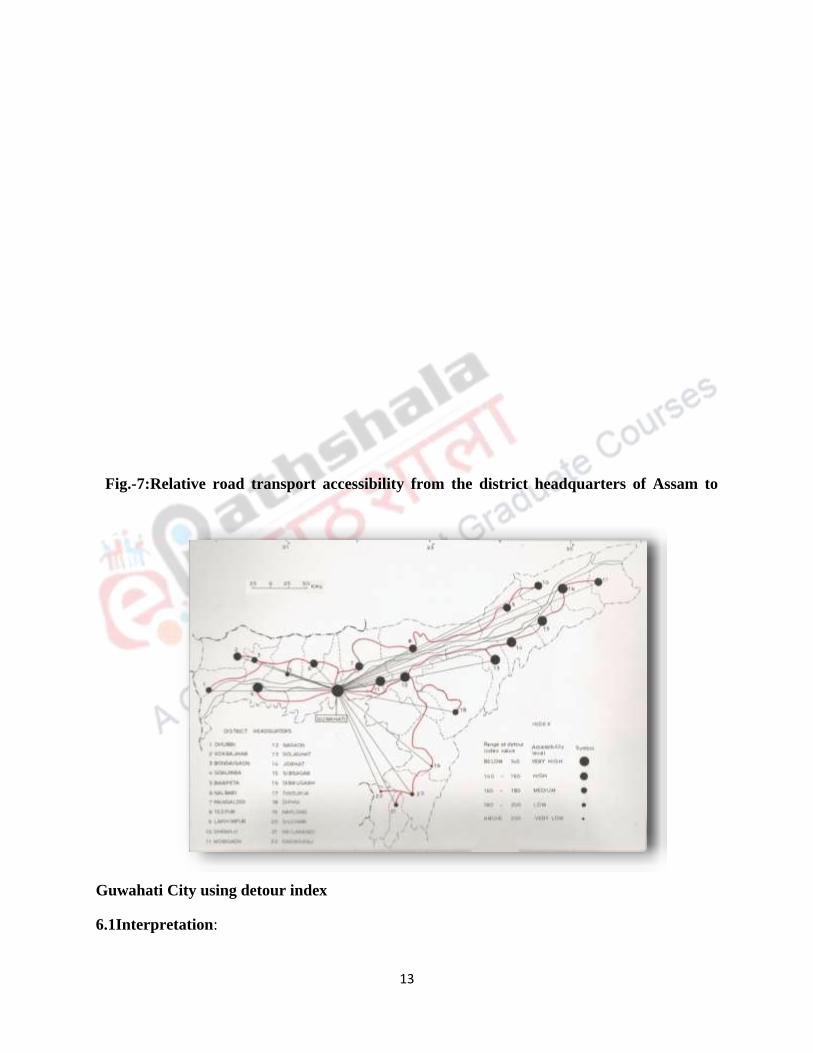
Fig.-7:Relative road transport accessibility from the district headquarters of Assam to
Guwahati City using detour index
6.1Interpretation:
14
Detour between Guwahati and Haflong districts is the highest as 223 percent. It isdue to
undulating topography and higher density of drainage network between them which enhances the
actual road distance. On the other hand, in the upper plains of Brahmaputra especially between
Guwahati and Jorhat and between Guwahati and Sibsagar towns, the detour is very low as 122
and 123 percents respectively. It means that the curve-linearity in the road length is only the 22
percent due to gentle slope topography. Thus, topography and relief features of landscape are
major factors for detour of road transport network in Assam.
7.0: Summary
In planar network system which is analysed by two-dimension graphs, the nodes and arcs are
mail elements through which the physical aspects of network like connectivity, diameter and
detour indexes are analysed. Cyclomatic number and alpha, beta, gamma are indexesrelated to
network analysis. These are helpful in selecting the optimal routes and paths. However, the
issues of optimal route designing and network impact on urban as well as agricultural landscapes
are important aspects to be addressed separately in the next module.