a performance analysis of a digital pll based mpsk demodulator
TRANSCRIPT

Purdue UniversityPurdue e-Pubs
ECE Technical Reports Electrical and Computer Engineering
5-1-1994
A Performance Analysis of a Digital PLL BasedMPSK DemodulatorMichael P. FitzPurdue University School of Electrical Engineering
R. Jean-Marc CramerPurdue University School of Electrical Engineering
Follow this and additional works at: http://docs.lib.purdue.edu/ecetr
This document has been made available through Purdue e-Pubs, a service of the Purdue University Libraries. Please contact [email protected] foradditional information.
Fitz, Michael P. and Cramer, R. Jean-Marc, "A Performance Analysis of a Digital PLL Based MPSK Demodulator" (1994). ECETechnical Reports. Paper 187.http://docs.lib.purdue.edu/ecetr/187

A PERFORMANCE ANALYSIS OF A
DIGITAL PLL BASED MPSK DEMODULATOR
TR-EE 94-18 MAY 1994

Performance Analysis of a Digital PLL Based MPSK Demodulator
Corresponding Author Michael P . Fitz*
School of Electrical Engineering Purdue University
West Lafayette, IN 47907-1285 (3 17) 494-0592
email: [email protected]
R. Jean-Marc Cramer** TRW Inc.
One Space Park Redondo Beach, CA 90278
(310) 812-1658 email: [email protected]. tr-w.com
Abstract This paper presents a generalized nonlinear (Markov) analysis technique that is used to
evaluate the statistical performance of uniforn~ly sampled digital phase-locked loop (DPLL) demodulators. Although the rigorous analysis of the statistical performance of the analog PLL for digitally modulated signals (i.e., Costas loops) remains an open problem, the discrete time analysis for MPSK modulation is tractable. This paper characterizes the first-order, decision- directed DPLL based demodulator as a Markov chain. Traditional analytical techniques are used to evaluate the steady-state statistical performance. Numerical results for the steady-state density function are derived for BPSK, QPSK, and 8PSK. The resulting steady-state bit error probabilities for these modulations are also calculated. Traditional Markov analytical techniques (absorbing boundaries) permit a numerical evaluation of the transient characteristics of the DPLL. The numerical work focuses on loops for both unmodulated and BPSK, QPSK, andl 8PSK modulated input signals. The transient characteristics are shown to be a function of the loop bandwidth but converge to those predicted by a diffusion analysis as the loop bandwidth decreases. The susceptibility of small bandwidth loops to hangup is shown to be the largest reason for the acquisition performance difference. The cycle slipping characterization for 'MPSK modulated signals is also a function of the loop bandwidth and each increase (doubling) of the modulation alphabet size reduces the slipping performance by approximately 6dB.
* This work partially supported by the National Scicnce Foundation under Grant NCR-9115820. * * This work was supported by a TRW ESG Masters Degrec Fellowship Award.
1

I. Introduction
Synchronization of communication systems has been and continues to be an area of active
research. Carrier synchronization or phase estimation is important for achieving the optimal
demodulator performance. Although the literature in this area is rich [ l , 21, the evolution of
technology continues to produce new research problems. Advances in digital circuit fabrication
have produced communication system implementations that routinely employ large amounts of
digital signal processing for synchronization and demodulation, often with gate arrays. Gate
arrays are advantageous because of the increased reliability, increased processing capabilities,
reduced size compared to an equivalent analog implementation, and reduced design cycle duration.
This paper presents a statistical characterization of a uniformly sampled, first-order,
decision-directed (DD), digitally implemented, phase-locked loop (DPLL) for MPSK modulations.
This architecture is built in a simple fashion and has near ideal coherent performa~nce at moderate to
high SNR. The phase detector (PD) considered for the receiver presented in this paper has an ideal
sawtooth form, but the analysis is easily modified to obtain results for the generalized Costas loops
[3], the Mth power loop [4], or other loops for modulated signals. A discrete time Markov chain
characterizes the DPLL. Similar work has been previously reported [5-71, but the uniformly
sampled DD-DPLL for MPSK modulated signals has not been investigated.
The work in this paper provides many of the perfomlance measures (and several new ones)
obtained with the Fokker-Planck techniques, but the approach is fundamentally different. The
traditional Markov analysis of an analog PLL subsystem [ I , 2 ,4] models the noise in the PLL as a
diffusion process and uses the Fokker-Planck equation to characterize the statistical performance.
This analytical technique is predicated on the assumption that the dynamics of the loop are much
slower than the dynamics of the noise [8], or equivalently, that the loop bandwidth is much less
than the symbol rate. An analysis of the DPLL is possible using similar techniques [9], but the
restriction on the bandwidth of the loop is still the same. This paper is motivated by the desire to
characterize the DPLL with wideband operation (e.g., burst mode synchronization) and to
characterize 'how symbol to symbol phase reference variations affect systems performance (e.g.,
coded communications).
The uniformly sampled DPLL based demodulator is accurately modeled \with a discrete time
Markov chain. We assume Nyquist signaling, perfect symbol timing, and syrn~bol rate sampling;
these assumptions are typical of camer loops with digitally modulated inputs [4] and are especially
appropriate for a steady-state analysis. Any Markov chain is completely characterized by the state A A
transition probability density function (pdf), p,(B,+,IB,), and an initial state pdf, p(60),
Considering Fig. 1, the state transition pdf is given by a transformation of random variables on the
matched filter output. This transformation is particularly simple for MPSK m'odulations and the
resulting DPLL characterization is the subject of this paper.
This paper is organized as follows. Section I1 presents the signal and demodulator models.
Section 111 develops the Markov chain describing the DD-DPLL operation. Section IV derives the
steady-state performance of the DPLL for BPSK, QPSK, and 8PSK. Secticln V characterizes
acquisition in the uniformly sampled DPLL and Section VI characterizes the "cycle" slipping
performance. Section VII concludes.
11. System Models A. Signal Models
Fig. 1 shows the general communications system under investigation. In this figure, z(t)
represents the complex baseband transmitted signal and is given as
where u(t) is the transmitted unit energy pulse shape, T is the symbol time, Ems is the energy per
symbol, and BT(n) is the transmitted phase of the nth symbol
work assumes that u(t) satisfies Nyquist's criterion for zero ISI1. The channel corrupts the
transmitted signal with additive white complex Gaussian noise, and a multiplicative distortion
(MD) of the form explj01. This MD represents the random received phase with 0 typically
assumed to be uniformly distributed on [-n,n]. With known symbol timing at the receiver and the
absence of intersymbol interference, the complex baseband signal at the output of the matched filter
can be represented as
X. = exp[jv.] + v,
where vn=O~(n)+O, and vn is a zero-mean, delta correlated (white), discrete time complex
Gaussian random process with a variance of No. Since the quantification of the carrier phase
synchronization process is the ultimate goal of this work, the pdf of 5, = arg{xn} is important in
the sequel. This pdf is given in [lo] as
This paper provides numerical results for BPSK, QPSK, and 8PSK demodulators, but the
techniques presented herein are general enough to apply to any PSK signal. The information bits are
assumed in this paper to be mapped to OT(n) by Gray coding [4].
B. Demodulator Models
Optimum demodulation requires an accurate estimate of the received carrier phase. A
commonly used recursive, constant gain carrier synchronization architecture is given as A
en+, = Bn + K[S, - O.,(n) - B,] A
= 0, + Kp,
where i),, is the phase estimate, i),(n) is the demodulated phase, pn2 is the measured phase error
and K is a constant gain term (O<KIl). Equation (4) represents a DD-DPLL with a sawtooth PD.
Note that the performance of this demodulator is dependent on the type of quantization employed.
Any addition or subtraction of phase angles in this paper is taken to be modulo-2n.

This paper presents results in a general framework, but slight modifications of the development are
necessary to model the different types of quantization accurately.
At this point the effects of DD processing on the input signal phase must be further
examined. The output of the DD processor, in, is of the form
where v!' is the additive noise modified by the decision-directed processing,. When the correct
symbol is demodulated, x, is a complex sinusoid in noise that can be tracked by any phase
estimation algorithm. This paper presents a Markov characterization of the DD-I>PLL that accounts
for all decisions (correct or incorrect).
A characterization of <,=arg{ x,} is now accomplished. In general,
A
with characterized by (3) and the decoded phase being a function of 5, and 8,. A density
function of 5, conditioned on 6, and y, is fundamental to the Markov analysis developed in this
paper. When using MPSK decision rules, given as
,. 2 ni (1 - 1)n - (1 + 1)n e,(n) = M if 6. +- 55, <en +- for i=O,M-1,
M M
to produce 8,(n), one gets
and a conditional pdf of
elsewhere
where Pk(a(Wn) is given in (3). Note that 6, determines the region over which 5, is defined. The
M terms in the summation in (9) correspond to the M possible decisions. Elxamination of (9)
shows that the pdf of 5, and the performance of the loop are not functions of the specific
transmitted symbols (i.e., this analysis is valid for coded or uncoded MPSK modulations). The

DPLL performance is also not a function of 0 because of the rotational symmetry of v,. For these
reasons and notational convenience, the development in the remainder of this paper does not
specifically indicate the conditioning on vn. Fig. 2 is a plot of the conditional pdf of 5. conditioned
on 6,=450, vn=OO, and Et,/Ng=ZdB for BPSK modulation.
It is instructive to discuss the linear analysis of the DPLL, based upon Z-transform
techniques. The fundamental result of interest is a representation of the equivalent double-sided
loop noise bandwidth of the DPLL given for the first-order DPLL as [ I 11
where K is the loop gain. Equation (10) finds its greatest utility in the fact that the reciprocal of BN
is a good first-order approximation to SNR gain obtained i n processing signals through the DPLL.
111. Markov Analysis
A. General Theory A
Examining Fig. 1 provides the following description for en+l:
,. e n + , = K(<,, - 6.) + i n ,
A and realizing that 5, is a function of vn and 0(n) and not 0 ~ ( n ) gives
6 n + l = ~ ( 6 " ,vn).
A Since Vn is a white, discrete time process, 0, is a first-order, discrete-time, continuous variable
Markov process. Furthermore, since the noise perturbing the system is assumed to be stationary,
the phase estimate is also a homogeneous random process. The Markov characteristic implies [12,
131 that the Chapman-Kolmogorov (CK) equation and an initial distribution function are sufficient
to produce a statistical description of the loop's behavior. The CK equation i.n its most general
form is
where:
= pdf of the phase estimate at time n conditioned on the initial distribution

P S ( ~ = state transition pdf
00 = initial phase estimate
i 2 = the probability space of the phase estimate.
To apply the CK equation to the model under consideration, the state transition pdf must be defined
in terms of known quantities. Along these lines, (1 1) is solved for En, yielding
A A Equation (14) shows the transition from 8, to On+1 is related to 5,. By a transformation of
random variables (with (14) as the inverse transformation), we have
= 0 elsewhere.
Note that p-(a), given by (9), has M terms corresponding to the M possible decoded symbols. 5
Consequently the state transition pdf is a weighted sum of these M different functions. It is
important to note that the state transition density function is invariant in tirne because of the
homogeneity of the underlying random process. The CK equation governing the phase estimate of
the first-order DPLL is now written as
B. Numerical Considerations A
To this point, and for the sake of generality, the development has assumed that On is a
continuously distributed random variable. In practice, however, any signal processed by a digital
system must undergo some level of cluantization, reducing the process to one with a finite number
of states. In the case of a Markov process, i t becomes a Markov chain that is represented by a state
transition diagram. The state transition pdf becomes the state transition matrix, S, and the phase
density functions become probability mass functions (pmf). The integraI in the CK equation
becomes a summation over the states of the Markov chain, and the CK equation is represented as

The CK equation can be represented in the finite state space case by matrix multiplication,
~(4,~) = s x ~(6,)~ (18)
where the left hand side represents the pmf associated with the phase estimate at time n+l, and S
the state transition matrix. A pmf is represented here by an N x 1 column vector, and the state
transition matrix has dimensions N x N.
Using the relations developed in Section 111-A, the development of the entries in the state
transition matrix is straightforward. In general, the i, j th element of the state transition matrix is
given by
The entries in S are dependent on the implementation, but to again maintain generality by
considering (15) and that 5, is a continuous random variable, the entries in the state transition pdf
are accurately approximated for large N by
elsewhere
where A is a constant proportional to the phase step size that guarantees that the columns of S sum
to unity. This state transition matrix has characteristics that converge to that of the continuous
space model when the phase step size is small.
Several characteristics of the Markov chain characterizing the DD-IIPLL can now be
established. First, because of quantization effects, there are a finite number of st:ates in the Markov
chain that characterize the DPLL. Every state in the chain co~nmunicates with every other state. All
states therefore belong to the same class and the Markov chain is irreducible. Furthermore, the
states of the Markov chain that characterize the DPLL are positive recurrent. The final property of
the Markov chain that must be established is that it is aperiodic. Aperiodicity is apparent since
there exists a non-zero probability of remaining in the same phase state over an iteration. With
these foundations laid, the Perron-Frobenius theorem [12, 131 guarantees both the existence of a

steady-state density function and the uniqueness of that density function. This theorem extends
also to the continuous state space presented in Section 111-A since the state space is compact [14].
In conjunction with (18), it also inherently gives one method for arriving at this steady-state pmf.
A steady-state pmf is obtained by iterating the CK equation (17) until the resulting pmf ceases to
change by more than a prescribed amount. This iteration method is also useful for examining the
transient characteristics of the DPLL.
A second method of determining the phase pmf is the use of an eigenvalue/eigenvector
decomposition. An eigen-decomposi tion of the state transition matrix produces
where X is the mamx of eigenvectors and A is a diagonal matrix containing the eigenvalues. The
k-step pmf is then given as [13]
where sc is the eigenvector for h=l (steady-state pmf), x(i) is the ith eigenvector (ith column of X),
f(i) is the i h row vector of X-1, and ~ ( 6 , ) is the initial phase error distribution.
C. Absorbing Boundary Techniques
Absorbing boundary techniques are a traditional tool for transient Markov analysis.
Normally an absorbing boundary is placed around a set of states of interest. The states of interest
for acquisition are states near any stable attractor or lock point, while for slipping the states of
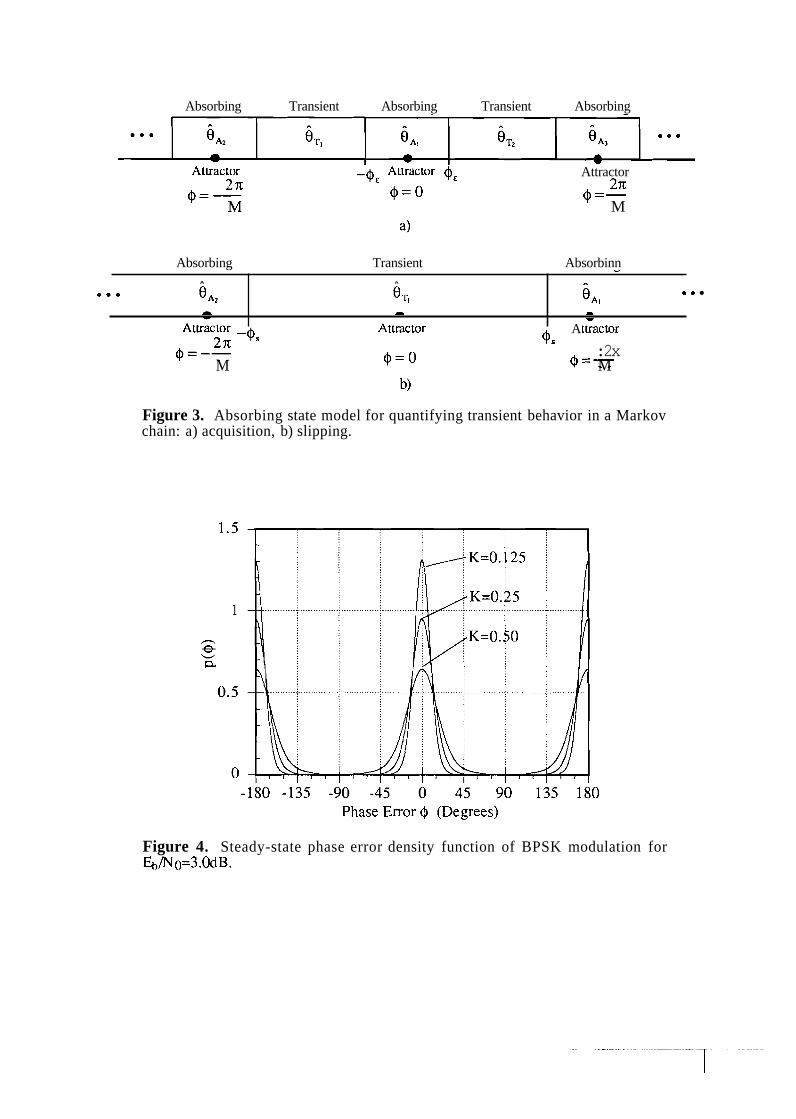
interest are near the adjacent attractor points. Fig. 3 shows the general Markov chain with
absorbing states or boundaries for both an acquisition analysis and a slipping analysis. The
modified chain now has both transient and recurrent states and a steady-state analysis is not
applicable. The following theorem is important in characterizing these modified chains.
Theorem: For a finite state Markov chain with a state transition matrix S containing sets
of recurrent classes R and transient classes T, the mean time to absorption in one of the
recurrent classes is given as

and the variance of the time to absorption is
v a r [ ~ , ] = 2[1'(1- 2S,. + s:)-' - E[T,](I + E[T,]) (24)
where ST is the reduced state transition matrix that corresponds to only transient states, I is
the identity matrix, 1=[1,1, ...., llT, and po is the initial distribution of the chain.
Proof: The proof is in [15].
This theorem characterizes the mean and variance of the time to acquire and the time to slip as a
simple function of the state transition pdf.
IV. Steady-State Performance
A. Phase Error Distributions
This section examines the steady-state pdf of the phase estimate produced by the DPLL for
MPSK modulation. Since the performance of the DPLL is independent of the actual true carrier
phase, the work in this paper will be restricted to assessing the statistical characterization of the A
phase error, Qn=8-en. A DPLL for MPSK modulated signals has M stable attractors located at
Q=2nm/M, m=O, M-1 which produces a potential phase ambiguity. Before attempting coherent
demodulation, an MPSK demodulator must resolve this phase ambiguity. The steady-state pdf of
a DPLL for unmodulated signals has been well characterized in the literature [ l l ] so results for this
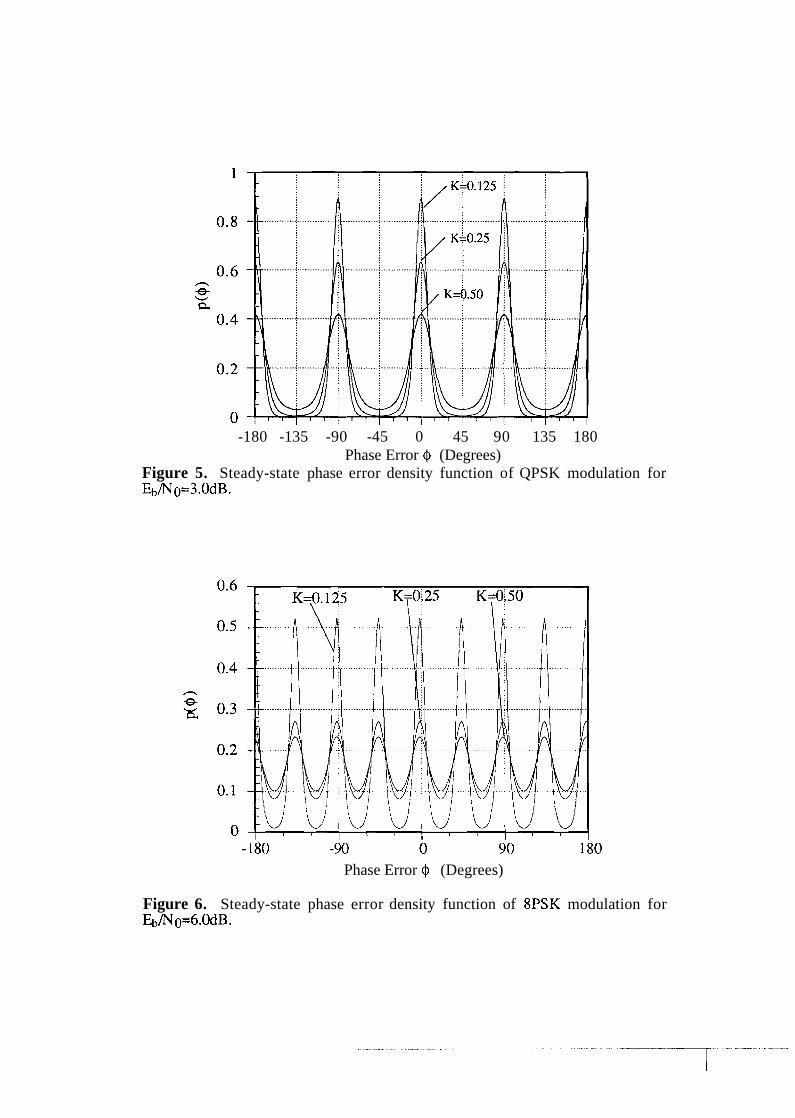
case are not presented. The steady-state phase error pdf for BPSK, QPSK, and 8PSK is seen in
Figs. 4, 5, and 6, respectively (N=500 states). As expected the phase error variance around the
stable lock points is proportional to the loop bandwidth.
B. Bit Error Probabilitv Performance
In practice, the phase ambiguity of estimates derived by DD processing is resolved either
by a unique word preamble or by differential encoding. This section analyzes the bit error
probability (BEP) of DPLL based demodulators for MPSK modulation assuming unique word
decoding. One simplifying assumption makes the analysis tractable. This analysis assumes that

once the unique word decoding determines the proper phase, the DPLL does not slip from one
stable lock point to another. Obviously this assumption is not valid at low SNR, but several
practical situations (e.g., burst mode communication) exist where this assumption is approximately
satisfied. With this assumption the steady-state BEP of the DPLL based demodulator is given by X -
where P,(E~@) is the BEP conditioned on a fixed @. Note that the numerical results obtained in this
paper use a quantized phase space so the integral in (25) is in reality a summation. The integral
form is maintained for generality. This equation reflects the symmetry of the density functions
since M different symmetric regions or modes of the phase error density function are in [-x,x].
The BEP is easily calculated from (25) if P,,(E~@) is identified. The form of P,(E~@) is
well known for BPSK and QPSK [4, 161, i.e.,
1 pB ( ~ 1 , ) = - 2 , r f c [ E cos(@)] (BPSK)
I (26)
1 = - e r f c [ ~ ( c o s ( @ ) 4 - sin(@)) + sin(@)) (QPSK).
Fig. 7 is a plot of the steady-state BEP of BPSK parameterized by K. In these plots near ideal
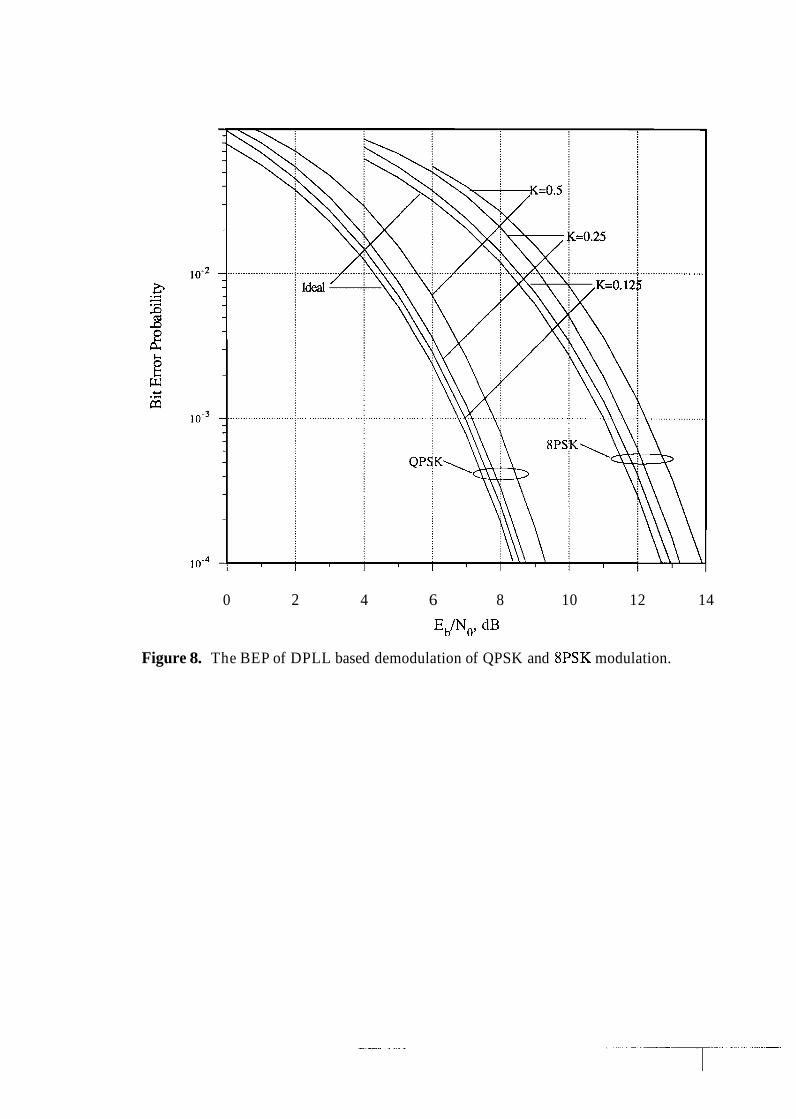
performance is achieved at a moderate even with a large BN. Fig. 8 shows plots of the BEP
for QPSK modulation. Note the increased sensitivity to phase errors compared to BPSK.
Obtaining an expression for the BEP given a fixed phase offset for 8PSK modulation takes
a bit more work. A key step in finding the steady-state BEP for the case considered in this paper is
the realization that the phase error pdf of an unstressed loop is an even function, i.e., n x - -
8
j P, (El@)P(@)d@ =j[p,, (El@) + PO (El-@)I P(@) do- n . - 0
Now the symmetry of the problem can be more fully exploited (see the Appendix) and (A-4) gives
a result for the integrand in (27) for Gray coded 8PSK. Fig. 8 also shows BIZP plots for 8PSK.
As expected, 8PSK is more sensitive to a noisy phase reference than either QPSK or BPSK.
V. Acquisition Performance
A. Acquisition Characteristics
Since the DPLL is characterized by a discrete time Markov chain, a complete transient
analysis of the loop is possible. Acquisition can be analyzed by modifying the Markov chain
description of the DPLL to include absorbing states near the attractor points. This classic technique
permits the acquisition process to be characterized for arbitrary loop bandwidths and digital
modulations. The acquisition characteristics of PLL synchronization subsystems for modulated
signals have not been previously analyzed.
The probability of phase acquisition as a function of time is one performance index of a
synchronization subsystem. The acquisition performance of the constant gain DPLL is analyzed in
this section as a function of the loop bandwidth and input symbol energy to noise spectral density
ratio, EJNo, for the phase estimation of an unmodulated sinusoid as well as BPSK, QPSK, and
8PSK modulated signals. To characterize acquisition, an acquisition time distribution is of greatest
utility. In an acquisition analysis, the state space in Fig. 3 is [-n, n] and absorbing states are
For MPSK input signals, $, is chosen so that the BEP at Eb/N0=6 dB is degraded by 0.5 dB
when $= QE ($,=19.2' for BPSK, $,=6.6" for QPSK, and $,=3.1° for 8PSK:).
A linear analysis provides some insight into the acquisition characteristics of the DPLL.
The phase error step response of the first-order DPLL is given as [ l 11
0, = Qo(l - K)". (29)
Approprialcl y mapped into I-n, nl .

Equation (29) demonstrates that for a constant gain loop, acquisition speed and K are directly
proportional and (considering (10)) acquisition speed and steady-state BE]? performance are
inversely proportional. This linear analysis con-elates well with the form of (22) since the second
largest eigenvalue of the state transition matrices is h2=l-K. Hence considering (22), a linear
acquisition analysis only accounts for the first-order effects of the loop.
Equation (29) can be rearranged in a more traditional manner to give
n In(]-K) $, = $0 e
The acquisition time constant is -I/ln(l-K), which is simplified with
where A j is a constant less than unity. As expected, for small K the loop bandwidth is
approximately inversely proportional to the time constant. This characteristic matches well the time
constant derived for the analog loop [17].
B. Acquisition Time Distribution
The acquisition time distribution is a function of three parameters: the initial phase error
distribution, p(@o), the E D o , and the loop bandwidth, BN. First we will consider a DPLL for an
unmodulated signal for some insight. Fig. 9 is a plot of the DPLL's normalized rms phase error
learning curve for SNRL4 = 6dB, N=500, and a uniform initial phase error distribution. An
important characteristic of this plot is that the normalized accluisition time is not constant for all BN.
This is contrary to the results in [ 171 for acquisition in the analog loop. The discirete time nature of
the DPLL combined with some nonlinear interactions produce this effect. Section C discusses

these characteristics in more detail. The acquisition characteristics of the DPLI, converge to those
given by the diffusion approximation as K gets small.
The acquisition time distribution function for MPSK signals is easily computed given
~ ( $ 0 ) ~ EJNo, N, and K using the numerical techniques discussed in Sestion 111. The phase error
process, due to the assumed lack of ISI, is independent of the transmitted symbols, so an all ones
transmitted sequence is used without loss of generality for the numeric work presented in this
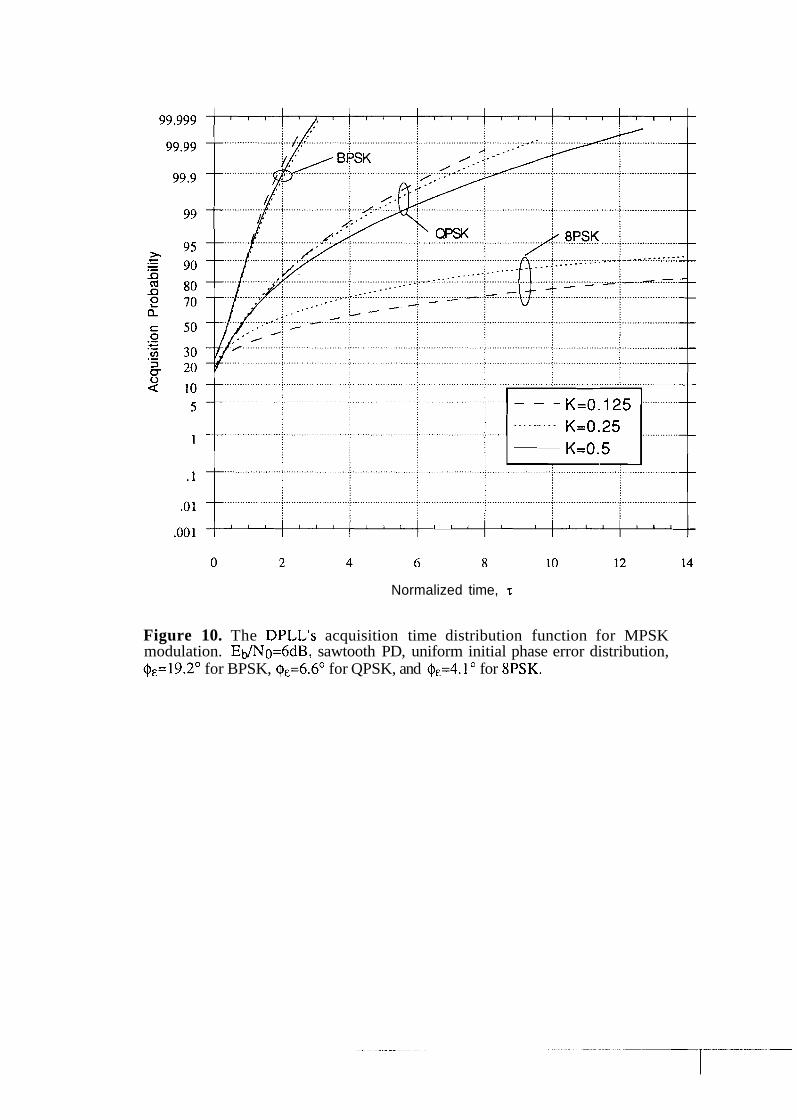
paper. Section V-A discusses the absorbing boundary locations. Fig. 10 plots the normalized
acquisition time distribution functions for BPSK, QPSK, and 8PSK with Eb/No = 6dB and
various values of K for a uniform initial phase error distribution. It should be noted that the results
in Fig. 10 have Eb/No fixed, producing a varying SNRL with K. The most significant
characteristic of acquisition with MPSK signals is that a larger M produces longer acquisition time.
As mentioned above, the inherent phase ambiguity is often resolved using unique word
decoding. To guarantee good performance with ~ ~ n i q u e word decoding one must be sure that the
loop is near one of the stable attractor points when the unique word arrives. Fig. 10 aids in
preamble design and demonstrates the benefit of an unniodulated preamble.
C. Hangup
For a loop with a smaller gain, the increased susceptibility to remaining in the hangup
region is the principle reason for the differences in the acquisition performance. Examination of
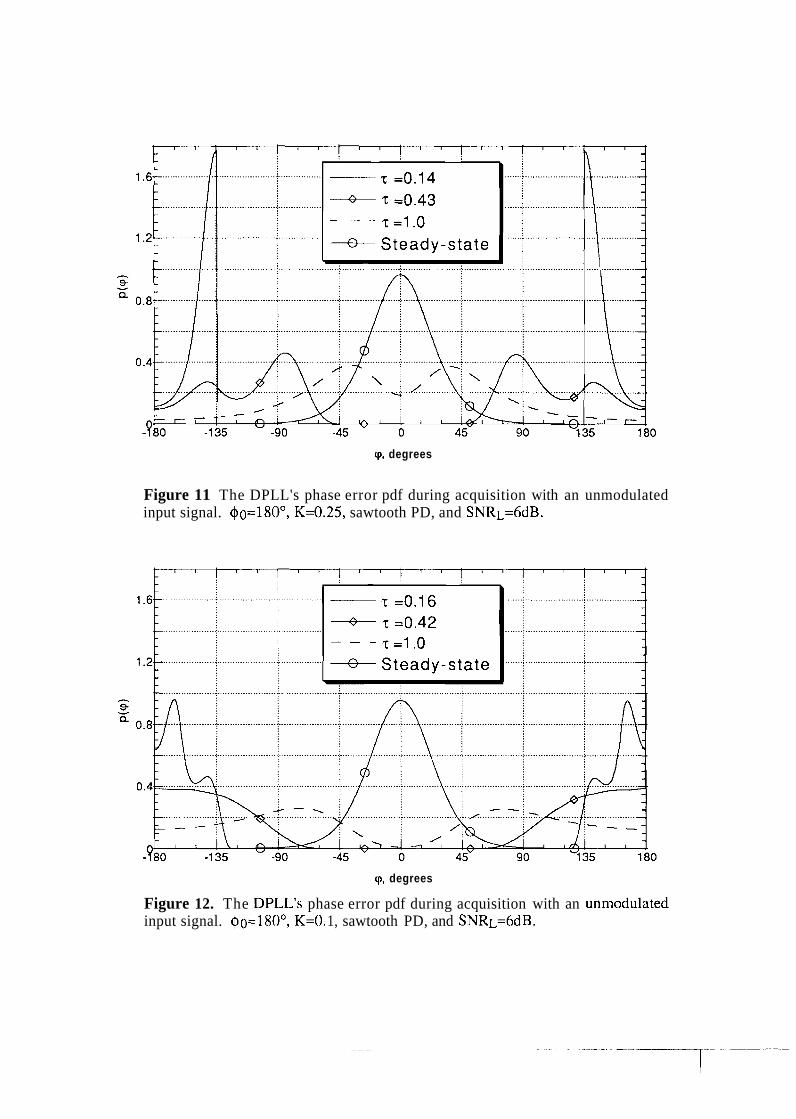
the phase error pdf during acquisition demonstrates this characteristic. Figs. 11 and 12 show the
DPLL's phase error pdf with M = l (unniodulated input) during the acquisition for K=0.25
( B ~ = 1 / 7 ) and K=0.1 (BN= 111 9), respectively, with $0 = 180' (the hangup point). These figures
show the dynamics of the phase error pdf during acquisition from hangup. Note that at roughly
the same normalized time (z = ~ " B N ) the higher gain loop has moved more of the probability mass
away from the hangup point and closer to the atuactor point ($=(I). This has occurred because the
higher gain loop is less likely to dwell around the unstable attractor.
The principle reason for this difference in the accluisition behavior is that a larger value of K
enables the loop to make bigger steps in phase. If a loop is in the hangup region (near an unstable

equilibrium point), cpn takes positive and negative values (cp,=+n for the sawtooth PD) with near
equal probability. This phenomenon, termed equivocation [17-191, is the reason the hangup point
is an unstable equilibrium point. A DPLL with a large gain can make a large step away from this
unstable equilibrium point. This large phase change moves the loop phase error a significant
distance from the hangup point and makes one polarity more probable for $,+I and equivocation
less likely. A DPLL with a small gain cannot make a large change in phase so that the next
iteration will again be likely to equivocate.
This idea can be demonstrated by examining Figs. 11 and 12. In Fig. 11 with K=0.25 the
~ = 0 . 4 3 curve corresponds to n=3 symbols after the start of acquisition. In exarnining the positive
portion of this pdf, two humps are apparent. The larger hump (smaller phase error) corresponds to
phase error trajectories that have not equivocated (i.e., three straight positive values for cp,). The
smaller hump (larger phase error) corresponds to trdjectories that did equivocate (two positive and
one negative value for 9,). For K=0.25 equivocation is less likely since the initial step moves the
phase error a significant distance (=4S0) from the hangup point. For comparison, in Fig. 12 where
K=O. 1, the ~ = 0 . 1 6 curve also corresponds to n=3. Again examining the positive portion of this
pdf, two humps are apparent. The hump that corresponds to trajectories that do not equivocate is
much smaller than the hump that corresponds to trajectories that do equivocate. The smaller gain
loop's phase does not leave the hangup region rapidly (the maximum step size is 18") so it is more
likely to dwell near the unstable equilibrium or hangup point. This demonstrates that a smaller
value of K limits how fast the loop can exit the hangup region and tends to prolong acquisition time
in a nonlinear fashion.
Hangup affects acquisition with MPSK modulated input signals in a similar fashion as with
an unmodulated signal. The major difference between the loops with modulated input signals and
those with unmodulated inputs are that there are more (M instead of one) hangup points (or
unstable equilibrium points) and the maximum measured phase error is reduced (Icpnl<n: for the
unmodulated input and I q n l < ~ / M for the modulated input with the sawtooth PD). These
characteristics produce slower acquisition i n a DPLL with NIPS K modulated input signals. More

hangup points imply that the initial phase error is in a hangup region with higher probability.
Being in the hangup region slows the acquisition. The smaller maximum step size implies that
when the loop is in the hangup region it cannot make as large of a step away from the hangup
region. A smaller maximum step size is similar to reducing the gain in terms of acquisition
performance. Consequently the loop has a higher probability of dwelling in the hangup region for
longer periods of time and this is reflected in the proportionally slower acquisition in Figs. 11-13.
VI. Cycle Slipping Analysis
The Markov chain model of the DPLL also permits an accurate characterization of slipping
in MPSK DPLL based demodulators. Since the MPSK constellation is rotationally symmetric, M
attractor points will exist in [-n, n1. Noise can cause the loop to slip from the domain of one
attractor to the domain of an adjacent attractor. The occurrence of a slip in either a system using
coded signals or a system with unique word decoding can cause a long burst of errors. Statistical
characterization of this slip phenomenon is important for the system designer. No closed form
solutions are reported in this work as in the case of the analog loop with an unmodulated signal
[2]. This work is also fundamentally different from the large deviations approach used in [20]
since the method is valid for both the large and small noise case5.
The cycle slipping performance of the uniformly sanlpled DPLL is again evaluated using
the Markov chain characterization. Cycle slipping is characterized by keeping the same loop model
near an attractor ($=(I) and placing absorbing states at the chain boundaries in the vicinity of the
adjacent attractors (@=+2n/M). The boundary between the absorbing states and the transient state
is designated as +Qs. Since a cycle slip produces degraded pel-fornlance in dem~odulators for both
uncoded or coded signals, the choice of qs was made in this paper to accurately measure the time
to when this degradation becomes significant. 'The absorbing boundary must be far enough away
from the unstable attractor ($=+n/M) to ensirre that trajectories with large phase errors that
properly relock are not inadvertently absorbed. Likewise the boundaries must be far enough from
The numerical computations presented herein become sensitive with extremely small noise so that the large deviations approach might be needed for characterization in this case.
the adjacent attractor such that the analysis does not consider the reacquisition process in addition
to the slipping process. To satisfy these constraints the absorbing boundaries were chosen to be
$s=1500, 75O, 35' for M=2,4,8 respectively.
The state transition matrix with absorbing boundaries, Sa, is then given as
where ST is the reduced state transition matrix for the transient states and pai is the absorption
probability vector for the absorbing state i. ST is just a subpartition of the state transition matrix
given in Section 111 while the components of p;~; are
- - . p i = ~ ( 6 . * , = aile,, = 9:).
(33)
This chain with absorbing boundaries now completely characterizes the cycle slipping
performance. The probability of slipping at time L is given as [13]
P(T, = L) = iT(s:-I - s ) ) ~ , , (34)
the mean time to slip is given as (23) and the variance of the tinie to slip is given as (24). In this
work the initial phase error distribution, po, is the steady-state distribution calculated by the eigen-
decomposition discussed in Section IT1 over the range [-x/M,x/M] and zero e1se:where. Using this
initial distribution provides the mean tinie to cycle slip that would be seen in steady-state operation.
The mean time to slip can be numerically eva1u:ited for the DPLL with an MPSK modulated
input signal. Fig. 13 is a plot of the DPLL's normalized mean time to cycle slip as a function of
the SNRL obtained by evaluating (23). The calculations in (23) leading to Fig. 13 are not
numerically6 a function of the SNR but are numerically sensitive at high SNR.
Four points are of interest i n these numerical results. First, the performance of the DPLL is
not independent of the loop bandwidth as with the analog loop. Since the loop with a large K can
make relatively large steps i n phase each symbol tinie, it takes less bad noise samples to make the
i.e., computer run time is constant w.r.t. the SNR.

loop slip. The normalized mean time to slip in the high SNR region is much smaller for large
values of K than predicted by the diffusion approximation. The reasons for the significantly worse
cycle slipping performance are analogous to the reasons for the significantly better acquisition
performance with larger K. The second characteristic of note is that the mean time to slip for the
DPLL asymptotically flattens out as the SNR becomes small. This again is in contrast to the
analog loop and is due to the DPLL making only one update per symbol. This discrete innovation
time and the restricted step size limit how fast the loop can slip even with a very noisy input. The
DPLL loops for MPSK modulated signals are much more likely to slip than the loop for
unmodulated signals. This characteristic is caused by the attractor points being closer together.
Since the attractor points are closer, a lower "potential" barrier exists between the attractor points,
making it easier for noise to cause phase error trajectories to exceed these barriers. In fact the
potential bamer has been cut by 1/M (e.g., 180" for the DPLL with an unmodulated input
compared to 90" for BPSK) and the resulting performance difference between each value of M is
approximately 6dB (3dB in terms of EblNr~). Finally, it is known that the time to cycle slip
becomes exponentially distributed for large SNR (2, 41. These calculations match this heuristic
well since the mean and standard deviation, obtained using (24), converge at moderate SNR as
would be the case for an exponentially distributed random variable.
VII . Conclusion
This paper characterizes the steady-state phase error pdf and the resulting BEP for a
decision-directed, uniformly sampled first-order DPLL. The behavior of the demodulator is
completely characterized by the Chapman-Koln~ogorov equation and an initial density function.
The steady-state phase error density fiinctions were determined to depend on the loop bandwidth,
the order of the modulation, and the input SNR. Further, the BEP for the demodulator was
calculated for BPSK, QPSK, and 8PSK. Higher order modulations require smaller loop
band widths to achieve near coherent BEP performance.
This paper also characterizes the transient behavior of a DPLL based MPSK demodulator.
In particular, the acquisition and "cycle" slipping performance of the DPLL were studied using a

Markov chain model. This paper demonstrates that this Markov chain characterization provides a
more accurate model of the DPLL over a wider range of loop parameters than the traditional
diffusion approximation. The numerical results show that the acquisition performance improves in
a nonlinear fashion as the gain is increased. This improvement was determined to be due to the
reduced susceptibility to dwelling in the hangup region. The numerical results also show that the
"cycle" slipping performance degrades in a similar nonlinear fashion as the gain is increased. The
cycle slipping performance also degrades by approximately 6dB for each doubling of the
modulation alphabet size. This follows intuition since the potential barrier between each attractor is
cut in half with the doubling of the modi~lation alphabet size.
The analysis techniques developed in this paper are sufficiently general to apply to many
other systems described by first-order Markov processes. Along these lines, the algorithms
described in this paper have been successfully modified for the analysis of a Costas loop in the
NASA ATDRS (advanced tracking and data relay satellite) synchronization syste:m.
Appendix A
Conditional BEP of 8PSK Demodulation
This section derives the conditional BEP for 8PSK modulation when the phase error pdf is
an even function by extending [21]. Assume, without loss of generality, that the symbol
corresponding to 1 I 1 is transmitted. Then this BEP is derived by examining Fig. 14 to realize that
where the Ai denote the decision regions. The decision regions have a mirror symmetry with
respect to the phase error, i.e.,
P(A,I@) = P(A,~-@) P(A&) = P(A,I-@) ~ ( ~ ~ l e ) = P(A,I--@) (A-2)
producing

and
1 + - 3 . . f c [ F cos(' + .I]{+ + i e r f [ F sin + .)I}. References
[I.] W.C. Lindsey, Synchronization Systems in Commlmication and Control, Prentice-Hall, Englewood Cliffs, NJ, 1972.
[2] H. Meyr and G. Ascheid, Synchronization in Digital Communications, John Wiley & Sons, New York, 1990.
[3] M.K. Simon, "On the Optimality of the MAP Estimation Loop for Carrier Phase Tracking BPSK and QPSK Signals," IEEE Trarzs. Commun., vol. COM-27, January 1979, pp. 158- 165.
[4] W.C. Lindsey and M.K. Simon, Telecomm~lnications Systems Engineering, Prentice- Hall, Englewood Cliffs, NJ, 1973.
[5] W.C. Lindsey and C.M. Chie, "Acquisition Behavior of a First-Order Digital Phase-Locked Loop," IEEE Trans. Commun., vol. COM-26, September 1978, pp. 1364-1370.
[6] G.M. Bernstein, M.A. Lieberman, and A.J. Lichtenberg, "Nonlinear Dynamics of a Digital Phase Locked Loop," IEEE Trans. Commnn., vol. COM-37, October 1989, pp. 1062- 1070.
[7] A. Weinberg and B. Liu, "Discrete Time Analyses of Nonuniform Sampling First- and Second-Order Digital Phase Locked Loops," IEEE Trans. Commun., vol. COM-22, February 1974, pp. 123-137.
[8] H.J. Kushner, "Diffusion Approximation to Output Processes of Nonliriear Systems with Wide-Band Inputs and Applications," IEEE Trarzs. Inform. Theory, vol. IT-26, November 1980, pp. 7 15-725.
[9] A. Benveniste, M. Metivier, and P. Priouret, Adaptive Algorithms and Stochastic Approximations, Springer-Verlag, New York, 1990.
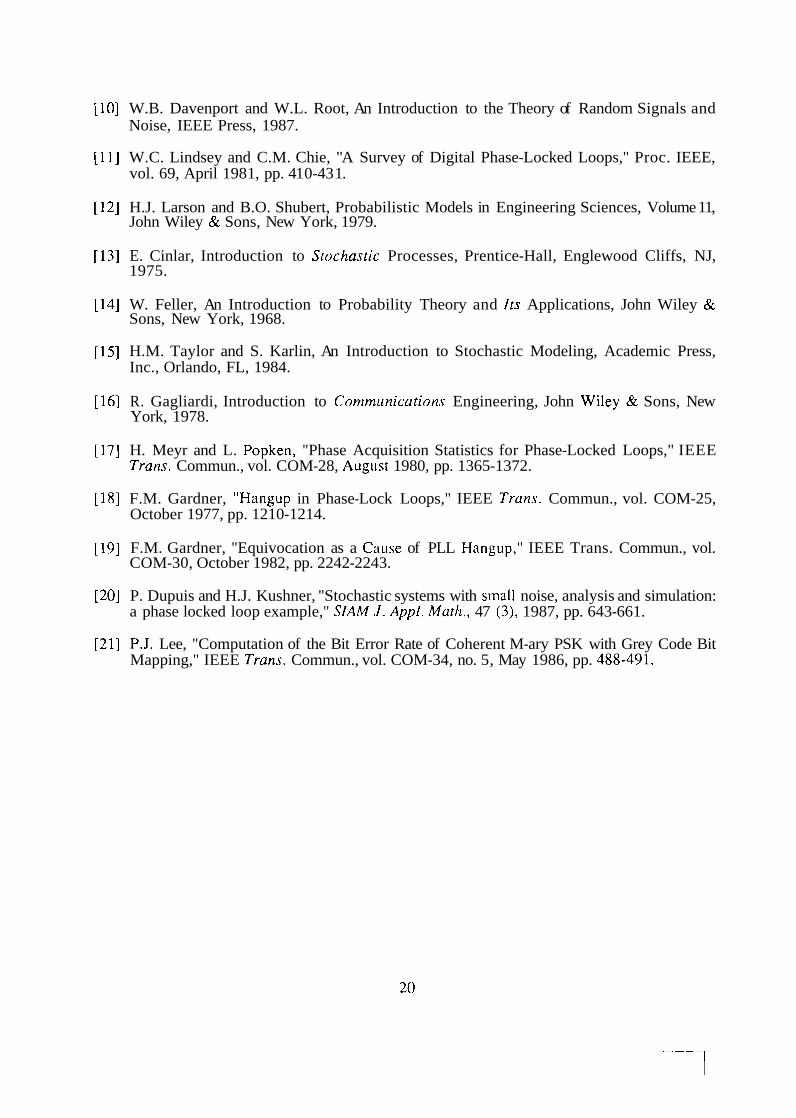
[lo] W.B. Davenport and W.L. Root, An Introduction to the Theory of Random Signals and Noise, IEEE Press, 1987.
[I:\.] W.C. Lindsey and C.M. Chie, "A Survey of Digital Phase-Locked Loops," Proc. IEEE, vol. 69, April 198 1, pp. 41 0-43 1.
[12] H.J. Larson and B.O. Shubert, Probabilistic Models in Engineering Sciences, Volume 11, John Wiley & Sons, New York, 1979.
[13] E. Cinlar, Introduction to Stochastic Processes, Prentice-Hall, Englewood Cliffs, NJ, 1975.
[14] W. Feller, An Introduction to Probability Theory and Its Applications, John Wiley & Sons, New York, 1968.
[15] H.M. Taylor and S. Karlin, An Introduction to Stochastic Modeling, Academic Press, Inc., Orlando, FL, 1984.
[16] R. Gagliardi, Introduction to C~mmunication~s Engineering, John Wiley & Sons, New York, 1978.
[17] H. Meyr and L. Popken, "Phase Acquisition Statistics for Phase-Locked Loops," IEEE Trans. Commun., vol. COM-28, Aug~lst 1980, pp. 1365-1372.
[18] F.M. Gardner, "Hangup in Phase-Lock Loops," IEEE Trans. Commun., vol. COM-25, October 1977, pp. 1210-1214.
[19] F.M. Gardner, "Equivocation as a Cause of PLL Hangup," IEEE Trans. Commun., vol. COM-30, October 1982, pp. 2242-2243.
[20] P. Dupuis and H.J. Kushner, "Stochastic systems with srnall noise, analysis and simulation: a phase locked loop example," SIAM .I. Appl. Math., 47 (3), 1987, pp. 643-661.
[21] P.J. Lee, "Computation of the Bit Error Rate of Coherent M-ary PSK with Grey Code Bit Mapping," IEEE Trans. Commun., vol. COM-34, no. 5, May 1986, pp. 488-491.
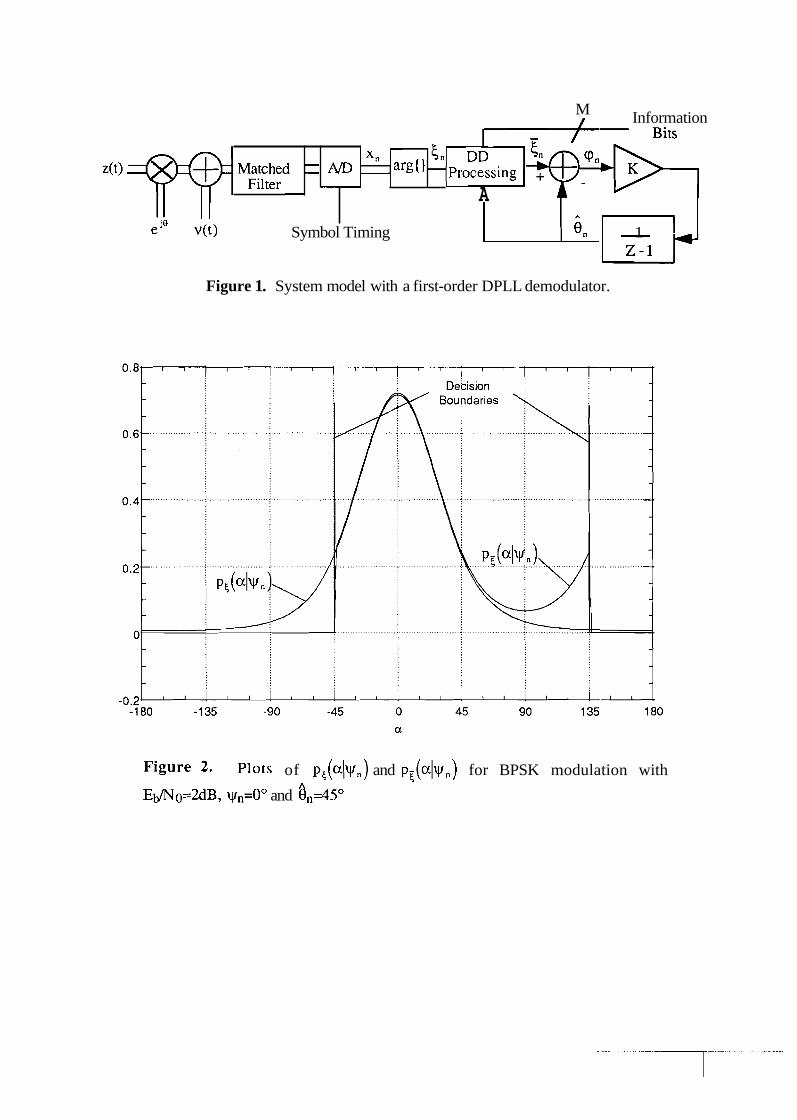
Figure 1. System model with a first-order DPLL demodulator.
M Information
Figure 2. Plots of p,(alyn) and pi(nlyn) for BPSK modulation with
Eflo=2dB, yn=Oo and &=450
M;:;;d G/D = z xn -6. D-b
- A A
~ ( t ) Symbol Timing On - 1 2-1
- argO -Processing
Absorbing Transient Absorbing Transient Absorbing
Attractor -@& Attraclor QE
@ = O Attractor
2n: @ :=-
M
Absorbing Transient Absorbinn
Figure 3. Absorbing state model for quantifying transient behavior in a Markov chain: a) acquisition, b) slipping.
-
Figure 4. Steady-state phase error density function of BPSK modulation for Eb/No=3.0dB.
A
* * * O A 2
A - Atuactor - 0 s Attractor
4)s A tua.ctor
2x @=-- :2x @ = O @=- M M
b)
A
€l TI - A
oh * *
* -
-180 -135 -90 -45 0 45 90 135 180 Phase Error Q (Degrees)
Figure 5. Steady-state phase error density function of QPSK modulation for Eb/No=3.0dB.
Phase Error Q (Degrees)
Figure 6. Steady-state phase error density function of 8PSK modulation for Eb/No=6.0dB.

Figure 7. The BEP of DPLL based demodulation of BPSK modullation.
0 2 4 6 8 10 12 14
EdN,, dB
Figure 8. The BEP of DPLL based demodulation of QPSK and 8PSK modulation.

Sample Number*(%,)
Figure 9. The DPLL's RMS phase error learning curve for an unmodulated input signal. S N R L = ~ ~ B , sawtooth PD, uniform initial phase error distribution.
Normalized time, .r
Figure 10. The DPLL's acquisition time distribution function for MPSK modulation. EdNo=6dB, sawtooth PD, uniform initial phase error distribution, QE=19.20 for BPSK, QE=6.60 for QPSK, and qE=4.1 for 8PSK.
cp, degrees
Figure 11 The DPLL's phase error pdf during acquisition with an unmodulated input signal. @0=180°, K=0.25, sawtooth PD, and S N R L = ~ ~ B .
cp, degrees
Figure 12. The DPLL's phase error pdf during acquisition with an unmodulated input signal. $0=1 80°, K=O. 1, sawtooth PD, and S N R L = ~ ~ B .

0 5 10 1 5 20 25 3 0 Loop SNR,dB
Figure 13. The normalized mean time to cycle slip for the first-order DPLL with MPSK modulation. Sawtooth PD.
Figure 14. Diagram representing the 8PSK signal space.