a. p. a. l
TRANSCRIPT

Stanford Geothermal Program
Tnterdisciplinary Research
in Engineering and Earth Sciences
Stanford University
Stanford, California
A LABORATORY MODEL OF STWLATED GEOTHERMAL
RESERVOIRS
by A. Hunsbedt
P. Kruger A. L. London
February 1975
This research was carried out
under Research Grant GI-34925
by the National Science Foundation

ABSTRACT
A laboratory model (the chimney model) of a fractured rock chimney
created by artificial stimulation of geothermal reservoirs has been con-
structed. The model has been used to study the behavior of a water/rock
system resembling that created by fracturing of an originally dry hot
rock geothermal region at maximum initial temperature and pressure of
500°F and 790 psia, respectively. The water/rock system is contained
inside a steel vessel which constitutes an artificial environment,
therefore, initial efforts were directed at obtaining calibration data
to be used in correcting this "wall effect." A detailed presentation of this effort is given in the present report. The results show that
the wall effect can be accounted for and meaningful experiments can be
run with the model.
for two systems, one had water only in the chimney and the other had a
granite rock loading consisting of rocks with an average equivalent
diameter of approximately one inch with drainage porosity of 4 3 . 7 per-
cent. Prelimi-
nary results of these experiments show that the thermal energy stored in the hot rock can be extracted efficiently by reducing system pressure
and letting the flash front recede into the rock matrix. More than 90
percent of the energy in the rocks available between the temperature
limits during these tests was extracted.
rock increased the fraction of original water in the system that could
be produced by roughly a factor of two for the water/rock system under
the conditions of these experiments.
Fluid production/pressure depletion tests were run
One run was made with partial recharge of cool water.
The energy extracted from the
ii

ACKNOWLEDGMENTS
The support by the National Science Foundation under Grant No.
GI-34925 during both the construction phase and early experimental
phase of this program is gratefully acknowledged.

c
TABLE OF CONTENTS
page
ABSTRACT . . . . . . . . . . . . . . . . . . . . . . . . . . . . iii ACKNOWLEDGMENTS.. . . . . . . . . . . . . . . . . . . . . . . . iv
LIST OF FIGURES . . . . . . . . . . . . . . . . . . . . . . . . . vii
LIST OF TABUS . . . . . . . . . . . . . . . . . . . . . . . . . ix NOMENCLATURE . . . . . . . . . . . . . . . . . . . . . . . . . . X
CHAPTER
3 TRANSIENT ANALYSIS AND CALIBRATION OF MODEL . . . . . . 18 3 . 1 General Transient Model . . . . . . . . . . . . . . . . . . . . . . . . . . . 19
3.1.1 Definition of Weighted Metal Temperatures -- 22 3 . 1 . 2 Heatup Transient Experiments --------------- 24 3 . 1 . 3 Cooldown Transient Experiments ------------- 3 2
4 ROCK CMFUCTERIZATION . . . . . . . . . . . . . . . . . 38
4 . 1 I;,ock Statistics ................................... 38
4 . 2 Sampling Techniques ............................... 40
4 . 3 Preliminary Results of Rock Statistical Analysis -- 40
4.4 Dietermination of Rock Matrix Parameters ----------- 5 1
4 . 5 Description of Instrumented Rocks ----------------- 5 4
5.2 Diata Reduction Procedure .......................... 5 9
5 . 2 . 1 Specific External Heat Transfer Parameter -- 5 9 5 . 2 . 2 Chimney Exit Enthalpy ...................... 60 5 . 2 . 3 Chimney Flash Front Location --------------- 6 1 5 . 2 . 4 VoidISteam Quality Relationships ----------- 61
5 . 3 Fluid Production Model ............................ 6 3
V

page
CHAPTER 6 EXPERIMENTAL RESULTS . . . . . . . . . . . . . . . . . .
Specific External Heat Transfer Parameter --------- Fluid Production and Recharge Characteristics -----
6.1 6.2 6.3 Pressure Depletion . . . . . . . . . . . . . . . . . . . . . . . . . . . . . . . . 6.4 Fraction Produced ................................. 6.5 Flash Front Position .............................. 6.6 Chimney Temperatures ..............................
6.6.1 Water/Rock Temperature Distribution -------- 6.6.2 Rock Energy Extraction Efficiency ---------- 6.6.3 Chimney Exit Steam Quality -----------------
6.7 Thermodynamic Path of Production Process ----------
66 66
70
70 75
79 79
82 89 90
92
APPENDIX A Derivations for Two-Mass Lumped Parameter Transient
Model . . . . . . . . . . . . . . . . . . . . . . . . . 111 B Derivations for Data Reduction Procedures . . . . . . . 120
REFeRENCES . . . . . . . . . . . . . . . . . . . . . . . . . . . 127
vi

LIST OF FIGURES
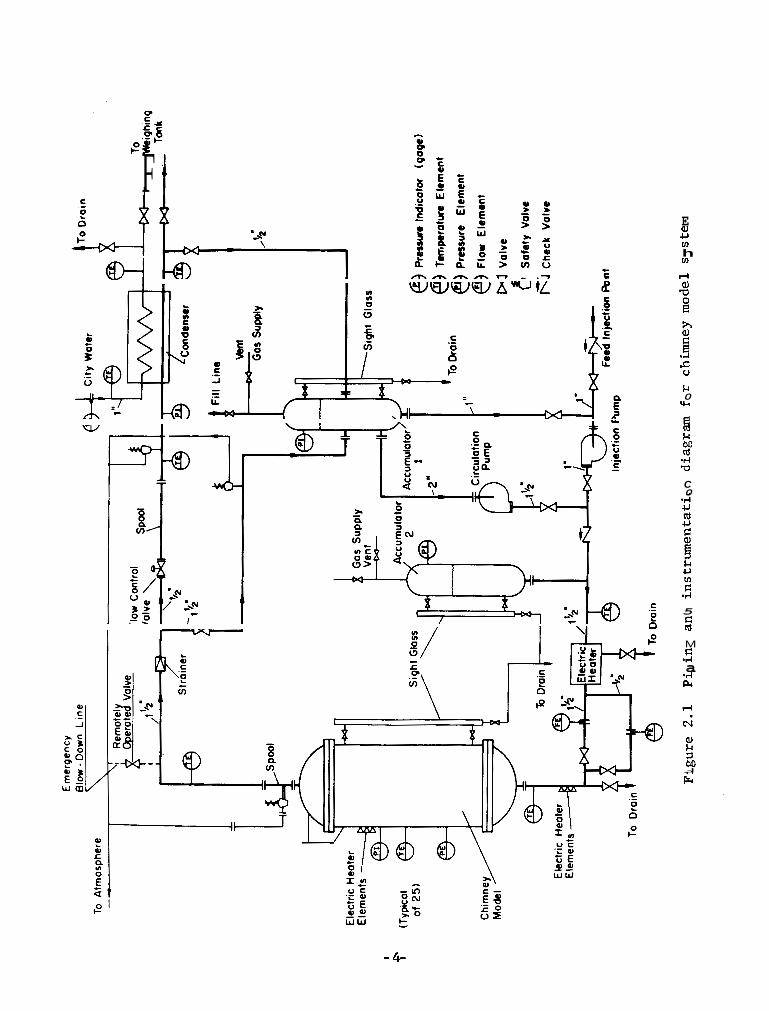
page Piping and instrumentation diagram for chimney model system 4
5
View of chimney and support structure upon construction completion . . . . . . . . . . . . . . . . . . . . . . . . . . . . . . . . . . . . . . . . . . . . . . . . . 6
Diagram of flow distribution baffle arrangement ------------ 8 View of low side of flow distribution baffle --------------- 9
Side view of chimney model system with the electric circula- tion heater in the foreground prior to installation of insulation . . . . . . . . . . . . . . . . . . . . . . . . . . . . . . . . . . . . . . . . . . . . . . . . . 10
View of circulation pump prior to installation of insulation . . . . . . . . . . . . . . . . . . . . . . . . . . . . . . . . . . . . . . . . . . . . . . . . . 12
Diagram of chimney model system - heating mode operation --- Diagram of chimney model system - fluid production mode
Diagram showing locations of thermocouples for measurement of chimney model temperature conditions ....................
View of chimney model system upon construction completion --
13
14
17
20 Typical heatup transient with water and rock in the chimney 25
Predicted water temperature transients for different heat loss conductances . . . . . . . . . . . . . . . . . . . . . . . . . . . . . . . . . . . . . . . . . . 30 Heatup transient with water only in the system - comparison of experiment and prediction . . . . . . . . . . . . . . . . . . . . . . . . . . . . . . . 31
34
operation . . . . . . . . . . . . . . . . . . . . . . . . . . . . . . . . . . . . . . . . . . . . . . . . . .
Diagrams of 2-mass lumped parameter model - --- --------------
Typical chimney cooldown transient .........................
1941; Pettijohn, 1951) . . . . . . . . . . . . . . . . . . . . . . . . . . . . . . . . . . . . . 39 Zingg classification system for rock shapes (from Krumbein,
Cumulative distribution and probability density functions for rock length dimension . . . . . . . . . . . . . . . . . . . . . . . . . . . . . . . . . . 42
Cumulative distribution and probability density functions for rock breadth dimension . . . . . . . . . . . . . . . . . . . . . . . . . . . . . . . . . 43
Cumulative distribution and probability density functions for rock thickness dimension . . . . . . . . . . . . . . . . . . . . . . . . . . . . . . . 44 Cumulative distribution and probability density functions
45 Cumulative distribution and probability density functions for rock equivalent diameter ............................... 46
Cumulative distribution and probability density functions 47
Cumulative distribution and probability density functions for breadth/length ratio . . . . . . . . . . . . . . . . . . . . . . . . . . . . . . . . . . . 48
for rock weight . . . . . . . . . . . . . . . . . . . . . . . . . . . . . . . . . . . . . . . . . . . .
for rock area . . . . . . . . . . . . . . . . . . . . . . . . . . . . . . . . . . . . . . . . . . . . . .
c
Figure 2.1 2.2
2.3
2.4 2.5 2.6
2.7
2.8 2.9
2.10
3.1
3.2 3.3
3.4
3.5 4.1
a. 2
4.3
4.4
4.5
4.6
4.7
4.8
4.9

Fimre page 4.10 Cumulative distribution and probability density functions
for roundness factor . . . . . . . . . . . . . . . . . . . . . . . . . . . . . . . . . . . . . . . 50
4.11 Classification of rocks using breadth/length and thickness/ length ratios as coordinates . . . . . . . . . . . . . . . . . . . . . . . . . . . . . . . 52
4.12 View of a few of the instrumented rocks .................... 57
6.1 Diagram of energy quantities in the external heat transfer parameter for Run 3 . . . . . . . . . . . . . . . . . . . . . . . . . . . . . . . . . . . . . . . . 68
6.2 Diagram of energv auantities in the external heat transfer
6.3
6.4 6.5
6.6
6.7
6.8
6.9 6.10
6.11
6.12 6.13 6.14 6.15
6.16 6.17
6.18
6.19
7.1
7.2
B. 1 B . 2
B. 3
Cumulative fluid productions for first test series --------- Cumulative recharge and recharge rate for Run 9 ------------ Illustration of compressed liquid region during early phase
Illustration of compressed liquid region during early phase
Pressure depletion histories for all runs of the first test
Fraction produced for water and water/rock systems --------- Flash front position during production Run 4 --------------- Chimney temperature histories for all runs of the first test
Centerline water/rock temperature history for Run 4 -------- Centerline water/rock temperature history for Run 5 -------- Centerline water/rock temperature history for Run 6 -------- Centerline water/rock temperature history for Run 7 -------- Centerline water/rock temperature history fur Run 8 -------- Centerline water/rock temperature history for Run 9 -------- Effect of steam flow rate on steam quality at the pressure
Void fraction and steam quality variation with production
Temperature- entropy diagram showing thermodynamic production
Comparison of independent chimney pressure measurements for
Comparison of measured chimney exit temperature to satura- tion temperature corresponding to measured pressure -------- Control volume for condenser heat balance ------------------ Diagram of chimney and sight glass showing nomenclature for
Diagram of chimney and inlet/outlet piping showing nomencla-
of production cycle for Run 3 . . . . . . . . . . . . . . . . . . . . . . . . . . . . . .
of production cycle for Run 4 . . . . . . . . . . . . . . . . . . . . . . . . . . . . . .
series . . . . . . . . . . . . . . . . . . . . . . . . . . . . . . . . . . . . . . . . . . . . . . . . . . . . .
series . . . . . . . . . . . . . . . . . . . . . . . . . . . . . . . . . . . . . . . . . . . . . . . . . . . . .
control valve . . . . . . . . . . . . . . . . . . . . . . . . . . . . . . . . . . . . . . . . . . . . . .
time for Run 4 . . . . . . . . . . . . . . . . . . . . . . . . . . . . . . . . . . . . . . . . . . . . .
path for Run 4 __------------------____________s_______-----
Run 3 . . . . . . . . . . . . . . . . . . . . . . . . . . . . . . . . . . . . . . . . . . . . . . . . . . . . . .
level density correction . . . . . . . . . . . . . . . . . . . . . . . . . . . . . . . . . . .
ture used for level analysis _-------------------_I_________
71 72
73
74
76 78 80
81 83
84 85 86 87
88
91
93
94
100
101 122
123
125
viii

LIST OF TABLES
Tab le
2 . 1
2 . 2
3 . 1
3 . 2
3 . 3
3 . 4
3 . 5
3.6
3.7
3 . 8
4 . 1
4 . 2
4 . 3
6.1
6 . 2
6 . 3
7 . 1
Chimney Model System Operating Parameters --------------- Summary of Measured Parameters .......................... Tabulation of Chimney Metal Mass Fractions - Estimated from Dimensions and Adjusted Using Experimental Thermal
Tabulation of System Metal Mass Fractions - Estimated from Dimensions and Adjusted Using Experimental Thermal
Tabulation of Numerical Data Used i n Evaluating System
Heatup Transient Data Evaluation ........................ S e n s i t i v i t y of Computed System Metal Mass t o Variat ion i n
Input Data f o r Heatup Transient Predict ions (Run I D No.
Behavior . . . . . . . . . . . . . . . . . . . . . . . . . . . . . . . . . . . . . . . . . . . . . . . .
Behavior . . . . . . . . . . . . . . . . . . . . . . . . . . . . . . . . . . . . . . . . . . . . . . . . Metal Mass . . . . . . . . . . . . . . . . . . . . . . . . . . . . . . . . . . . . . . . . . . . . . .
System Loss Conductance ................................. 070974) ................................................. Summary of Data from Cooldown Experiments --------------- Tabulation of Chimney Parameters ........................ Summary of Data f o r the F i r s t Rock Load ----------------- Data on Instrumented Rocks .............................. Comparison of Selected Mean Q u a n t i t i e s f o r the S ix
Charac te r i s t i c s of Fluid Production Runs i n the Chimney
Numerical Data for Speci f ic H e a t Transfer Parameter
Summary of Chimney Rock Energy Extract ion Efficiency
Summary of Estimated Measurement Uncertaint ies ----------
Instrumented Rocks ...................................... Model --------_--------_--____________L_______-----------
Evaluation . . . . . . . . . . . . . . . . . . . . . . . . . . . . . . . . . . . . . . . . . . . . . . Cc,mputations . . . . . . . . . . . . . . . . . . . . . . . . . . . . . . . . . . . . . . . . . . . .
page 3
15
2 3
2 3
26
27
28
29
36
37
5 4
55
56
67
7 0
90
102

NOMENCLATURE
English Letter Symbols
A = area ( f t2 )
a = length dimension of rock (cm)
al,a2,a3 = parameters i n t r ans ien t model--defined i n t e x t ( l / h r )
b - breadth dimension of rock (cm)
C = s p e c i f i c heat capacity (Btu/lbm '?F)
= mul t ip l i e r s i n system t rans ien t solution--defined i n t e x t ( O F )
c = thickness dimension of rock (cm)
D 4 d/dt = d i f f e r e n t i a l operator ( l / h r )
d = rock equivalent diameter (cm) e = s p e c i f i c i n t e r n a l energy (Btu/l&)
e = 2.71...basis of na tu ra l logarithm (dimensionless)
H - height dimension ( in)
h = heat t r ans fe r coef f i c ien t (Btu/hr f t 2 OF)
h - height of rock matrix ( in)
i = s p e c i f i c enthalpy (Btu/lbm)
k - s t a t i s t i c a l parameter - peakedness (dimensionless)
R = t rue f l a s h f ron t pos i t ion measured from top ( in)
'i j
A' - indicated f l a sh f ron t pos i t ion ( in)
M - mass (lb,)
A = mass flow rate (lbm/hr)
M* - mass f rac t ion - normalized t o i n i t i a l mass (dimensionless)
m1,2 - inverse t i m e constants , defined by Eq. (A.lO) ( l /h r )
n = s t a t i s t i c a l sample s i z e (dimensionless)
P = pressure (psia)
P* = nondimensional pressure - normalized t o i n i t i a l pressure
= t o t a l ex te rna l heat t r ans fe r from m e t a l chimney (Btu)
(dimensionless)
s, = s p e c i f i c external heat t r ans fe r parameter ( B t u / l h )
S1 = e l e c t r i c power supply - c i r c u l a t i o n heater (Btu/hr)
S2 = e l e c t r i c power supply - tape heaters (Btu/hr)
Sk = s t a t i s t i c a l parameter - skewness (dimensionless)
s = spec i f i c entropy (Btu/ lh , OF)
s = Laplace transform var iab le ( l /h r ) s2 = statist ical parameter - variance (cm 2
T - temperature (OF)
X
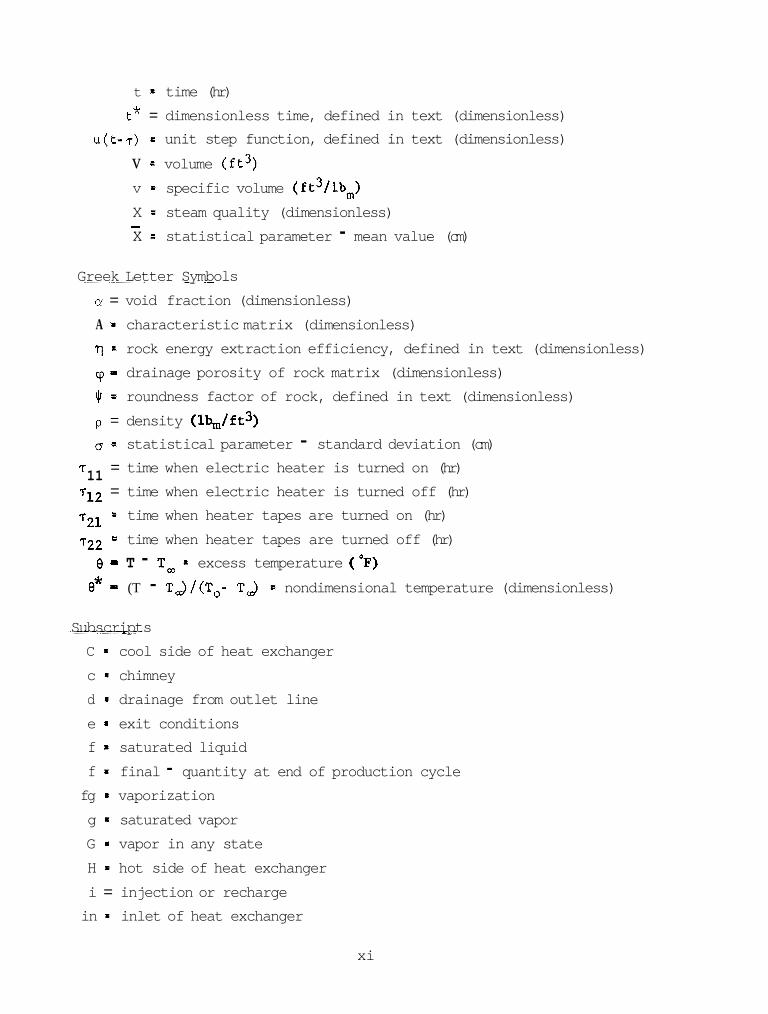
t = time (hr) t* = dimensionless time, defined in text (dimensionless)
u(t-7) .D unit step function, defined in text (dimensionless)
v = volume (ft3) v = specific volume (ft3/lbm) X = steam quality (dimensionless) x = statistical parameter - mean value (cm) -
Greek Letter Symbols CY = void fraction (dimensionless) A = characteristic matrix (dimensionless) q = rock energy extraction efficiency, defined in text (dimensionless) v = drainage porosity of rock matrix (dimensionless) $ = roundness factor of rock, defined in text (dimensionless) p = density (l&/ft3) 0 = statistical parameter - standard deviation (cm)
T
T~~ = time when electric heater is turned off (hr) T~~ = time when heater tapes are turned on (hr) T~~ = time when heater tapes are turned off (hr)
= time when electric heater is turned on (hr) 11
e = T - T~ = excess temperature (OF)
e* = (T - TJ/(To- TJ = nondimensional temperature (dimensionless)
Subscripts C = cool side of heat exchanger c = chimney d = drainage from outlet line e = exit conditions f = saturated liquid f = final - quantity at end of production cycle fg = vaporization g - saturated vapor G = vapor in any state H - hot side of heat exchanger i = injection or recharge in = inlet of heat exchanger
xi

L = l iqu id of any state
o - i n i t i a l - quant i ty a t start of production cycle (t - 0) ou t = o u t l e t of heat exchanger
p = production
r = rock
SC = steam cap
SG s i g h t glass
w = water i n chimney
1 = lumped mass of water and rock of (1) t o t a l system, o r (2) chimney
2 = lumped mass of (1) t o t a l system metal, o r (2) of chimney metal
co = surroundings
only
Special Symbols - - average value
( ) ' = der ivat ive with respect t o pressure
A = Laplace transformed var iab le
= quant i ty on a rate bas is
( ) o - quant i ty a t s tar t of production cycle (t = 0)
c) = mean value of enclosed quant i ty

CHAPTER 1
INTRODUCTION
Geothermal energy s t o r e d i n the e a r t h ' s c r u s t has been u t i l i z e d on
a l imi t ed scale f o r cen tu r i e s . However, i t s conversion f o r e l e c t r i c
power product ion i n i t i a t e d i n 1913 i s c u r r e n t l y r ece iv ing cons iderable
a t t e n t i o n i n view of t he shor tages of convent ional energy sources and
the environmental concerns and cons t ruc t ion problems a s soc i a t ed wi th nu-
c l e a r power s t a t i o n s .
e a r t h ' s c r u s t can e a s i l y be demonstrated (Kruger and O t t e , 1973), how-
eve r , t he problem i s how t o e x t r a c t t h e energy economically. White ( i n
Kruger and O t t e , 1973) p r e d i c t s t h a t only a n i n s i g n i f i c a n t amount of t h e
a v a i l a b l e geothermal energy sources w i l l be developed over t he next two
decades wi th p re sen t technologies . I f t h i s energy source i s t o become a
s i g n i f i c a n t p o r t i o n o f the energy supply development of new technologies
i s needed. One promising technology i s t h e s t imu la t ion of geothermal
resources .
The ex i s t ence of v a s t energy p o t e n t i a l s i n the
S t imula t ion of n a t u r a l resources is n o t a new concept, f o r example
experiments on s t imu la t ion of n a t u r a l gas resources have been underway
f o r s e v e r a l years (Atkinson and Ward, 1967). However, t he a p p l i c a t i o n
of t h i s technology t o geothermal resources has only r e c e n t l y been con-
s ide red (Kruger and Otte, 1973). Geothermal resources conta in ing h o t
water wi th l o w p o r o s i t y and permeabi l i ty may be made more product ive by
a r t i f i c i a l f r a c t u r i n g of the h o s t rock (s t imula t ion) us ing proposed s t i m -
u l a t i o n techniques such as nuclear o r convent ional explos ives , hydro-
f r a c t u r i n g , o r thermal f r a c t u r i n g . Also, a r t i f i c i a l f r a c t u r i n g of dry
h o t rock and in t roduc t ion of water which i s heated by the cracked rock
may g r e a t l y en large p o t e n t i a l geothermal resources .
How much of t he thermal energy s to red i n t h e rock can be ex t r ac t ed
by resource s t imu la t ion i s n o t clear.
ques t ion and o t h e r r e l a t e d quest ions a l abo ra to ry model of a s t imula ted
geothermal r e s e r v o i r (chimney model) w a s cons t ruc ted .
To he lp provide answers t o t h i s
The chimney model p r o j e c t i s p a r t of t he Stanford Geothermal Program
which comnenced as an i n t e r d i s c i p l i n a r y program a t Stanford Univers i ty
- 1-

during the 1972-1973 academic year .
volved the design and cons t ruc t ion of t h e labora tory model wi th a s soc i a t ed
a u x i l i a r y loops and equipment f o r heatup and product ion opera t ions . The
major test o b j e c t i v e s of the program are t o ob ta in experimental d a t a on
the processes o f in- place b o i l i n g , moving f l a s h f r o n t s , and two-phase
flow i n ho t porous media, as w e l l as chemical and radiochemical d a t a f o r
f l u i d s product ion. S p e c i f i c a l l y t he s t u d i e s include: (1) optimum rock
energy e x t r a c t i o n , (2) c y c l i c and continuous recharge , (3) h e a t t r a n s f e r
c h a r a c t e r i s t i c s , (4) water q u a l i t y a s p e c t s , and (5) experimental da t a f o r
a n a l y t i c models.
The i n i t i a l phase of the p r o j e c t in-
The design and cons t ruc t ion of t he chimney model test system occurred
I n i - during 1973 and the system w a s placed i n opera t ion i n March of 1974. t i a l t e s t i n g was d i r e c t e d a t ob ta in ing c a l i b r a t i o n d a t a p r i o r t o loading
the chimney wi th rock.
g r a n i t e rock of approximately one inch equiva len t diameter rocks w a s
i n i t i a t e d . Experimental da t a have been obta ined f o r condi t ions similar
t o those of f r a c t u r e d h o t rock systems, most ly without recharge.
r e p o r t p re sen t s t he f i r s t r e s u l t s from the chimney model experiments t o
disseminate t he information a t the earl iest p o s s i b l e t i m e .
reviews the following achievements:
I n August 1974 t e s t i n g wi th the f i r s t load of
This
The r e p o r t
1. Design, procurement, and cons t ruc t ion o f the chimney model
system and a s s o c i a t e d instrument systems;
I n i t i a l checkout of the system and the a c q u i s i t i o n of c a l i -
b r a t i o n d a t a wi th water only i n t he chimney;
2.
3. Analysis of the system c a l i b r a t i o n d a t a and establ ishment of
t he system's l i m i t a t i o n s wi th r e spec t t o providing use fu l test
information.
Documentation f o r i t e m (1) above i s a v a i l a b l e (Kruger and Ramey,
1973; Kruger and Ramey, 1974) and t h e r e f o r e only a d e s c r i p t i o n of the
c u r r e n t chimney model system i s included here . The a n a l y s i s of t he ex-
periments f o r i t e m s (2) and (3) are considered as pre l iminary . Fur ther
a n a l y s i s w i l l be needed before a f i n a l r epo r t ing can be completed.

CHAPTER 2
DESCRIPTION OF TEST APPARATUS
2.1 Chimney Model System
The chimney model and a s soc i a t ed equipment, h e r e a f t e r r e f e r r e d t o
as the chimney model system o r simply as t h e system, i s loca t ed i n t he
Lloyd Noble Laboratory of Petroleum Engineering a t Stanford Univers i ty ,
Ca l i fo rn i a .
The p ip ing and ins t rumenta t ion diagram of t he system i s given i n
Fig. 2.1. Figure 2 .2 shows a s i d e view of t he chimney model system,
while Fig. 2 .3 shows a view of t he chimney model and a s soc i a t ed support
s t r u c t u r e .
i s designed t o ASME s tandards .
s a f e t y r e l i e f system t o ven t the h igh p re s su re f l u i d t o t he atmosphere
i n case of a c c i d e n t a l ove rp re s su r i za t ion .
t e m t h a t can be opera ted manually from a remote l o c a t i o n i s included.
The opera t ing parameters o f the chimney system model are l i s t e d i n
Table 2.1.
The system i s cons t ruc ted p r imar i ly from low carbon s tee l and
The system inc ludes a high p re s su re
Addi t iona l ly , a blowdown sys-
F
CD-1
-1
c .-
B
E P) 4J v)
h v)
rl
b 0
k 0 %I
C 0
5 C rd
M C .rl a .I4 PI
.-I

Figure 2.2 V i e w of chimney model system upon construction completion


2 . 1 . 1 Chimney Model The chimney model or steel vessel which simulates a fractured rock
chimney produced by explosive, hydraulic, or thermal-stress fracturing
is 2 feet I.D. and approximately 5 feet high. The lower head is connec- ted to the vessel shell by standard bolted flanges while closure at the
top end is accomplished using a "quick opening" head (Tube-Turn).
vessel shell has numerous nozzles for instrumentation entry for measure-
ment of chimney temperatures and pressures. A sight glass is installed
on the shell to observe water/steam level movements during operation of
the system.
The
The vessel is supported on an axis through its approximate center
of gravity by brackets which allow the vessel to be rotated 90 degrees from a vertical position to a horizontal position after inlet and outlet piping, instrumentation, and other connections are disconnected from the
vessel. This provides easy access to the lower section of the vessel
during rock loading and instrumentation of the rock load. The vessel shell has
power control sufficient to compensate for heat losses, or to provide energy to the water/rock system at a desired rate.
lated with approximately 4 inches of insulation.
tape heaters wrapped around the outside diameter with heating
The vessel is insu-
To assure uniform flow distribution at the lower end of the vessel
(inlet), a flow distribution baffle is installed in the lower head. A
diagram of the flow distribution baffle arrangement is shown in Fig. 2.4
and a view of the low side of the baffle prior to installation is shown
in Fig. 2.5.
2 .1 .2 Auxiliary Components
An electric heater in the circulation piping supplies the thermal
energy necessary to establish the initial temperature/pressure conditions
of the chimney system in an acceptable length o f time. It is also used
to preheat the recharge water to desired temperature conditions. The circulation heater, prior to installation of electrical supplies and in-
sulation, is shown in Fig. 2.6. The heater is controlled by an on/off
thermostat. A continuous automatic power control system is being in- stalled which will enhance the utility of the heater.
- 7-

Figure 2.4 Diagram of flow distribution baffle arrangement
- 8-

- 9-

Figure 2.6 S ide view of chimney model system w i t h t h e e l e c t r i : c i r c u l a - t i o n h e a t e r i n t h e foreground p r i o r t o i n s t a l l a t i o n o f i n s u l a t i o n
...
" 10-

.
A 15 gpm c e n t r i f u g a l pump provides 9 f e e t head f o r the c i r c u l a t i o n
flow. A view of t h i s pump p r i o r t o i n s t a l l a t i o n of i n s u l a t i o n i s shown
i n F ig . 2 .7 . The pump housing and p a r t s i n con tac t wi th water are made
from s t a i n l e s s s teel .
ney i s a p o s i t i v e displacement pump d e l i v e r i n g a m a x i m u m head of 800 p s i .
The i n j e c t i o n pump i s shown as the component i n the foreground i n F ig . 2 . 3
and i n the background i n Fig, 2 .7. The flow rate can be con t ro l l ed con-
t inuous ly by adjustment of t he p i s t o n displacement i n t he range 0-1 gpm.
P a r t s i n con tac t wi th water are made from s t a i n l e s s s tee l .
The 1 gpm i n j e c t i o n pump used t o recharge the chim-
The system has two accumulators f ab r i ca t ed from low carbon s t ee l ,
each wi th a water l e v e l s i g h t g l a s s .
proximately 1 .5 f t 3 . I ts primary funct ions are t o provide , (1) a n expan-
s ion volume during heatup, (2) a f r e e gas su r f ace f o r i n e r t gas p re s su r i -
za t ion of system t o avoid f l a sh ing during heatup, and
suc t ion supply f o r the c i r c u l a t i o n and i n j e c t i o n pumps.
Accumulator 1 has a volume of ap-
(3) a head tank
Accumulator 2
has a volume approximately 0.5 f t 3 . I t s func t ions are: (1) damping of
pu l se s o r i g i n a t i n g i n the p o s i t i v e displacement i n j e c t i o n pump, (2) i n e r t
gas p r e s s u r i z a t i o n of recharge w a t e r t o avoid f l a s h i n g i n the e l e c t r i c
h e a t e r during recharge, and (3) expansion volume during heatup.
The c i r c u l a t i o n loop i s cons t ruc ted from schedule 80 low carbon s tee l
p ip ing ( s i z e s 1 / 2 , 1, 1-1 /2 , and 2 inch) . Except f o r connect ions t o chim-
ney, pumps, e lec t r ic h e a t e r and var ious o t h e r components, the p ip ing i s
a l l welded (140 high pressure welds). The system can be emptied a t two
low po in t s by the d r a i n valves which release approximately 99 percent
of the system f l u i d s . The p ip ing system, accumulators and o t h e r p e r t i -
nent components are covered wi th 1-1/2 t o 2 inches of i n s u l a t i o n .
2 . 1 . 3 Chimney Model System Operation
The system ope ra t e s i n two primary modes; t he " heat ing mode" (see
Fig. 2.8) which e s t a b l i s h e s t he i n i t i a l r e s e r v o i r temperature and pres-
su re condi t ions i n a r e l a t i v e l y s h o r t time, and the " f l u i d product ion
mode" (see Fig. 2.9) during which product ion from a f r a c t u r e d geothermal
system i s s imulated. A summary of these modes he lps descr ibe the system
opera t ion . The system i s f i l l e d wi th w a t e r t o des i r ed l e v e l s through the
make-up water l i n e .
complished by a d d i t i o n of argon gas t o accumulators 1 and 2. The
P r e s s u r i z a t i o n of t he system t o 100-200 p s i g i s ac-
- 11-

- 12-

I
- 13-

- 1G

circulation pump starts the flow of water through the electric heater where it acquires its thermal energy with an approximately 10°F increase in temperature. ney where some of its energy is transferred to the vessel and the rock loading. via accumulator 1. Heatup circulation is continued until the desired tem- perature and pressure conditions are achieved and temperature equilibrium of the rock/water/metal system is established.
The water from the heater circulates through the chim-
Water at the chimney water mixture temperature is then returned
Fluid production is initiated by opening the pressure control valve. The produced fluids are passed through the condenser and subsequently
either: (1) removed from the system through the production discharge line into a weighting system, or (2) returned through accumulator 1. Re- charge of the system is accomplished by the injection pump which draws fluids from: (1) a make-up water line, or (2) accumulator 1, depending on the choice of production scheme.
The recharge water is preheated in the electric heater to the de- sired recharge temperature and enters the chimney uniformly through the flow distribution baffle.
2.2 Instrumentation The parameters measured during operation of the system are summa-
rized in Table 2.2.
TABLE 2.2 Summary of Measured Parameters
Temperature Terminal temperatures for chimney model, electric heater, condenser Water temperature distribution in chimney Rock temperature distribution Metal temperature distribution
Pressure Chimney Sensors Ac cumu la to r s
Condenser Flow Rate Circulation Meters Injection
Condenser cooling water Production flow rate (gravimetric measurement)
.. 15-

The locations of the loop pressure, temperature and flow measurement sensors are indicated in Figs. 2 s l , 2 . 8 , and 2 . 9 . Pressure indicators are installed on components according to ASME code requirements, and are not intended to be used for obtaining primary experimental data. Sensors for acquiring experimental data are discussed individually in the follow- ing.
2 . 2 . 1 Temperature and Pressure Measurements The thermocouples used for loop temperature measurement are all
1/8 inch diameter stainless steel sheathed (grounded) iron/constantan thermocouples (type J). measure the chimney water, rock and metal temperature conditions are shown in Fig. 2.10. ture measurement are 1/16 inch in diameter (type J). in typically shaped rocks to the approximate center of the rock, and the thermocouples are cemented in place with a high temperature porcelain- like cement. The water t2mperatures are measured adjacent to the "instrumented" rocks to obtain rock/water temperature differences, and at other points to obtain axial and radial profiles. are inserted through the vessel wall by Conax high pressure fittings. The metal temperatures are measured using unsheathed fine-gage(type J) thennocouples cemented to the metal surface with high temperature cement. All thermocouple measurements are recorded on multipoint recorders. The loop metal temperatures are measured at accumulators 1 and 2. The pres- sure in the chimney is measured with an electronic pressure transmitter employing a Bourdon-tube as the primary sensing element.
The positions of the thermocouples used to
The thermecouples used for water and rock tempera- Holes are drilled
All thermocouples
2 .2 .2 Flow Measurements The circulation flow rate during heating is measured using an ori-
fice designed to ASME standards and installed in a 1-1/2 inch line. measured pressure difference is converted to an electrical signal by an
electronic differential pressure transmitter which is fed to the multi- point recorders. The recharge flow is measured using another orifice installed in a 1/2 inch line. measured using an orifice installed in the 1 inch water line. The re- cording of the measurements is the same as for the circulation flow measurements. function of time from which the fluid production rate can be computed.
The
The condenser cooling water flow rate is
The produced fluid is weighed in the collection tank as a
- 16-

I N LE T/OUT LET PIPING
* Numbers refers to thermocouple numbers **Located in the 4 5 O plane relative to paper plane
where all other T k ' s are located
Figure 2.10 Diagram showing locations oir' thermocouples for measurement of chimney model temperature conditions
- 17 -
1

CHAPTER 3
TRANSIENT ANALYSIS AND CALIBRATION OF MODEL
The thermal c h a r a c t e r i s t i c s of t he s tee l vessel (chimney model) are
s u b s t a n t i a l l y d i f f e r e n t from those of a f r ac tu red rock system loca ted
underground.
conduction from the formation (region no t cracked) rock t o t he f r ac tu red
rock/water system would i n genera l be s m a l l . On the o t h e r hand the com-
bined e f f e c t of h e a t l o s ses t o the environment from the chimney metal can
r e s u l t i n cons iderable energy t r a n s f e r . These d i f f e r ences may complicate
the i n t e r p r e t a t i o n of the f l u i d product ion and p re s su re dec l ine behavior
of the s imulated water / rock system.
mine the magnitude of t h i s " w a l l e f f e c t" and, i f p o s s i b l e , o f f s e t i t by
supplying energy a t app ropr i a t e rates by a r t i f i c i a l means.
I n the n a t u r a l system the h e a t t r a n s f e r by convection and
Therefore, i t i s important t o de te r-
The magnitude of the i n t e r n a l energy s t o r e d i n the chimney metal
can be expressed i n terms of the mass, s p e c i f i c h e a t , and temperature
product as
e = M C T ,
where the temperature i s measured wi th r e spec t t o some r e fe rence l e v e l .
The temperature readings from the s ix thermocouples l oca t ed on the out-
s i d e w a l l of the chimney (see Fig . 2.10) can be used t o compute a mean
temperature of the metal wi th a n appropr i a t e weighting scheme.
s p e c i f i c h e a t of low carbon s tee l i s w e l l known b u t the mass of t he chim-
ney i s no t known.
w i th g r e a t accuracy because t h e chimney cannot be weighted i n p l a c e con-
ven ien t ly , and some of the mass i n the support ing s t r u c t u r e s are n o t
p a r t o f t he ' k f f ec t ive" mass, thus the i n t e r n a l energy cannot be measured
d i r e c t l y .
The
The "mass" o f t h e chimney model cannot be determined
The h e a t l o s s e s t o t he surrounding from the chimney can be expressed
i n terms of t he h e a t t r a n s f e r c o e f f i c i e n t , su r f ace area, and temperature
product as
- 18-

where aga in the temperature of t he chimney i s the weighed average of s i x
measurements wi th r e spec t t o a re ference l e v e l ( t he ambient temperature).
The h e a t loss conductance given by t h e hA product r ep re sen t s the cow
bined e f f e c t s of r a d i a t i o n and convection from the ou t s ide su r f ace and
conduction through the chimney model i n s u l a t i o n and support s t r u c t u r e ;
thus , i t i s an e f f e c t i v e heat loss conductance. This conductance cannot
be ca l cu la t ed wi th a n adequate accuracy because of t he complexity of the
sys t e m .
However, both t h e e f f e c t i v e chimney mass and the e f f e c t i v e h e a t
loss conductance can be est imated from such c a l i b r a t i o n experiments as
cool-down and heatup t r a n s i e n t s .
t o loading the rock i n t o the chimney during the e a r l y phases of the ex-
perimental program and a few have been made subsequent t o loading the
chimney. The r e s u l t s of t he se c a l i b r a t i o n experiments are given wi th
the d iscuss ion of the following t r a n s i e n t a n a l y t i c desc r ip t ion of the
chimney model system.
A number of such tests were made p r i o r
3.1 General Trans ien t Model
The chimney model i s a complex system of tanks, pumps, p ip ing , and
o t h e r components, and a d e t a i l e d a n a l y s i s of t he heatup and cooldown
t r a n s i e n t s would r e q u i r e a s u b s t a n t i a l e f f o r t . Therefore, one has t o
look f o r a s imp l i f i ed phys i ca l system which can be analyzed and which
r ep resen t s the behavior of t h e real system t o an adequate degree.
Lumped parameter models of the system c o n s i s t i n g of four masses and two
masses were examined previous ly (Kruger and Ramey, 1974). The adequacy
of t he lumped parameter approach w a s a l s o discussed and it was found t o
be s a t i s f a c t o r y f o r a l l m e t a l po r t i ons i n con tac t w i th water and f o r
s m a l l rocks (equivalent diameter of 1 inch o r less) subjec ted t o slow
t r a n s i e n t s . Comparisons showed t h a t t he 2-mass model represented the
behavior o f the phys i ca l system j u s t as w e l l as t h e &mass model, and
w a s more convenient t o use.
The 2-mass model i s shown schematical ly i n the upper p o r t i o n of
Fig. 3.1. It c o n s i s t s of one tank represent ing a l l metal (and insu la-
t ion) i n t he sys t e m undergoing temperature changes. The temperature of
t h i s metal lump i s
and i n s u l a t i o n . The tank conta ins water and rock a t mean temperature q. T2 and i s the mean temperature of a l l metal p a r t s

ELECTRIC POWER SUPPLY, s, ELECTRIC POWER
@ Water / Rock (Ti i @ Metal in chimney
and piping etc. (T2)
@ Surroundings (T,)
SOURCE (Sp 1
t = 7,21
SOURCE
‘s1)- t =
SINK
1
Figure 3 .1 Diagrams of 2-mass lumped parameter ,nodel
- 20-

Energy exchange occurs between the system and i t s surround I ngs a t con-
s t a n t -temperature
duct ion and r a d i a t i o n from the w t s i d e su r f ace , (2) e lec t r ic power supply,
S1 p l y , represent ing the tape hea t e r elements on t h e ou t s ide w a l l of t he
chimney, and (4) h o t water drainage during heatup ( requi red due t o
thermal expansion of the water).
T, , as follows: (1) h e a t t r a n s f e r by convection con-
represent ink the electr ic c i r c u l a t i o n h e a t e r , (3) e l e c t r i c power sup-
S2
The e l e c t r i c a l analog of the idea l i zed chimney model system i s shown
on the lower po r t ion of F ig . 3.1.
t i o n s , and the de r iva t ion of t he genera l s o l u t i o n are given i n Appendix A.
A summary of the assumptions are presented below:
Fur ther d i scuss ion of the model, assump-
1. All water and the rock are a t a uniform temperature,
2. All metal (and in su la t ion ) i s a t a uniform temperature,
3. The temperature of t he surroundings i s cons tan t a t
4. The e lec t r ic power (S1 and S2) i s suppl ied as r ec t angu la r pu lses ;
5 . The s p e c i f i c hea t s of rock, water and metal are cons tan t ;
6 . The h e a t t r a n s f e r conductances are cons tan t .
The genera l s o l u t i o n f o r the t r a n s i e n t temperature behavior of the
T1 ;
T2 ; Tm ;
system are presented below wi th 01 = TI - T, and 02 = T2 - T, . m l t m2t - - C12e
m l t m2t 02 = C21e - C22e
- 21-
I

Explanations of the symbols are given i n t h e Nomenclature and i n Appen-
d i x A .
The above s o l u t i o n i s spec i a l i zed f u r t h e r f o r two cases following a
d iscuss ion of how the mean o r weighted lump temperatures can be obtained
from experimental temperature da t a . These d a t a are then compared t o
model p r e d i c t i o n s .
3.1.1
It w a s observed during the heatup experiments wi th only w a t e r i n the
system t h a t the water i n the chimney remained a t e s s e n t i a l l y uniform tem-
pe ra tu re . Since, t he mass of water i n the chimney c o n s t i t u t e s about 80-90
percent of the water i n the system an adequate r ep re sen ta t ion of t he w a t e r
temperature (TI) i s obtained from the measured chimney e x i t temperature
(see Fig . 2.10). S imi la r observa t ions were made during the heatup exper-
iments with the water / rock load.
Def in i t i on of Weighted Metal Temperatures
On the o t h e r hand the s i x chimney metal temperature measurements on
the ou t s ide w a l l (see Fig. 2.10) showed v a r i a t i o n s of 10-20°F depending
on condi t ions . Therefore a weighting procedure w a s requi red t o ob ta in a
r ep resen ta t ive mean chimney metal temperature (T2).
nec t ing i n l e t and o u t l e t p ip ing extending t o n e a r e s t i s o l a t i o n va lves
were t h e r e f o r e divided i n t o s i x s e c t i o n s corresponding t o the s ix thermo-
couple l oca t ions . The mass of each s e c t i o n w a s es t imated using measured
dimensions and metal dens i ty . The b e s t estimate of t hese masses and the
corresponding mass f r a c t i o n s are given i n t he f i r s t and second columns
of Table 3.1.
The chimney and con-
The chimney model mass cannot be determined d i r e c t l y ; only the t o t a l
chimney model system m a s s can be determined experimental ly from heatup
t r a n s i e n t s . However, the chimney model mass is a l a r g e f r a c t i o n of the t o t a l
system mass. The masses of the p ip ing and o the r components were est imated
- 22-

TABLE 3.1
Tabulation of Chimr stima'ted from Dimensions and Ac
Section
Lower head and inlet piping to closest isolation valve Lower flanges with bolts Lower section of shell in- cluding 1/2 support struc- ture plus 1 / 2 sight glass
Upper section of shell in- cluding 1 / 2 support struc- ture plus 1/2 sight glass Jocks (closure device) Upper head and outlet piping to closest isolation valve
y Metal Mass Fractions-- usted Using Experimenl 1 Thermal Behavior
248
1435
480
656
756
370
Total Mass M2 = 3945 lbm
.ed Mass
Fraction '2 , i/M2 0.0629
0.3637
0.1217
0.1664
0.1916
0.0938
Experiment
2 16
1246
41 7
570
65 7
322 - 3428 lbm
and divided into sections where temperature measurements were available.
From these and metal temperature measurements a mean system metal tempera- ture (T2) was estimated. mass fractions are tabulated in the first and second columns of Table 3.2.
The estimated system masses and the corresponding
TABLE 3.2
Tabulations of System Metal Mass Fraction: stimated from Dimensions and Adlusted I Using Experimen
Section ~~
Chimney including inlet and 39 45 outlet pipe sections
Accumulator 1, connecting pip- 690 ing, and circulation pump
Accumulator 2 and connecting 165 piping Electric heater and connect- ing piping
430
System Mass = 5230 lb,,,
d Mass 'rac t ion '2 , i/M2
0.7543
0.1319
0.0315
0.0822
- .1 Thermal Behavior
Experiment
Mass, M2,i ( I'm)
3428
600
144
375
= 4547 lb,
- 23-

3.1.2 Heatup Trans ien t Experiments
A number of heatup t r a n s i e n t s were made both before and a f t e r load-
ing of rock and a few of these have been evaluated.
t r a n s i e n t wi th water and rock i n the chimney i s shown i n Fig. 3.2. The
water temperature r ep re sen t s t he chimney e x i t temperature and the mean
system metal temperatures were der ived using the mass f r a c t i o n s given i n
Tables 3.1 and 3.2 and experimental temperature da t a .
A t y p i c a l heatup
It i s observed from Fig. 3.2 t h a t during the f i r s t hour o f hea t ing
the re i s a s h o r t t i m e t r a n s i e n t during which an adjustment of the mean
temperatures of t h e two "lumps" takes p l ace . Once t h i s i n i t i a l adjustment
has occurred, t he mean temperature d i f f e r e n c e between the lumps remains
e s s e n t i a l l y cons tan t i n d i c a t i n g t h a t the d e r i v a t i v e s de /d t f o r both
lumps are the same a t each p o i n t i n time. Evaluat ion o f t h i s s lope from
heatup t r a n s i e n t d a t a can be used t o determine the t o t a l system h e a t
capaci tance us ing the following equat ion (see Appendix A f o r de r iva t ion )
MC 2 + h2A2e = S1 , (3.2a)
from which
(3.2b)
The average hea t ing rate, S1 , i s 22.5 kW
h e a t e r c u r r e n t and vo l t age during the heatup runs .
t r a n s f e r conductance (loss conductance) h2A2 i s no t known, however, i f
de /d t i s eva lua ted a t l o w system temperature where 8 i s r e l a t i v e l y
s m a l l the loss term may have l i t t l e e f f e c t a s i s ev iden t from Eq. (3.2b).
der ived from measurements of
The system h e a t
A value of h2A2 - 70 Btu/hr "F w a s t e n t a t i v e l y s e l e c t e d .
Once the t o t a l system h e a t capac i tance has been determined, the sys-
t e m m e t a l capaci tance can be obta ined i n t he case of water only i n the
chimney from
MC = %C1 + M2C2 ,
and i n t he case of water and rock i n the chimney from
MC = MwC1 4- M C + M2C2 . r r
(3.3a)
(3.3b)
- 24-

1 I I I
'e \
0 0 0 0 0 0 0 - 9 8 cu
- 25-

Several numerical va lues are requi red i n the above equat ions and the
values used i n t h i s ana lys i s along with re ference t o source are given
i n Table 3.3.
TABLE 3.3
Ta t U s e d 7
Quanti ty
M1 = pV = mass of water i n system (no rock i n system)
C1 = s p e c i f i c hea t of water
= pV = m a s s o f water i n system (rock i n s ys t e m )
MW
Mr - mass of rock i n chimney
C r - s p e c i f i c hea t of rock
C 2 = s p e c i f i c h e a t of s tee l
Lation of Numerica Evaluating System
Numerical Value
1153 lbm
1 .0 Btu/lbm "F
m 585 Ib
1640 lbm
0.2 Btu/lbm "F
0.117 Btu/lbm "F
Data e t a1 Mass
Source
Density p* (Kre i th , 1965) System volume computed
(Krei th, 1965)
Density p (Krei th, 1965) System volume computed
Measured p r i o r t o loading
(Krei th, 1965)
(Goldsmith e t a l . , 1961)
* All q u a n t i t i e s dependent on temperature were evaluated a t T = 200°F.
Using mean de /d t da t a between 2 and 3 hours hea t ing t i m e i n Eq. (3.2b),
the numerical da t a i n Table 3.3 and E q s . (3.3) , t he da ta l i s t e d i n Table
3.4 were obtained.
The mean value of the computed system metal mass as given i n
Table 3.4 i s 4784 lbm . a ted by t h i s procedure t o v a r i a t i o n i n the system loss conductance can
be obtained by using d i f f e r e n t values of h2A2 i n eva lua t ing
The r e s u l t s of t h i s ana lys i s are given i n Table 3.5.
The s e n s i t i v i t y of system metal mass as evalu-
M2 *
- 26-

I
k aJ U
k a, U
$
d !3 \ k a, U
d 2 \ k aJ
5 2 \ k a, U
E n d
* a3 h * D C cd 3
a, E .rl u M d .rl U
I c VI 0 m k
& m * C cd N
c al al 3 U aJ P a, k 7 U
a,
a, u C cd
g
2 B
k 8
E n d
c\l VI N
+I I
.rl u cd .rl E= a" a 3 C cd U m
a, .rl U
M C .rl U
& W 0
E
I
2 g c m a C cd N
c a, a, 3 U aJ P a, a 0 d m
C 8
k; 2 \ 7 U F9
0 h
W 0 a,
cd U
a
c)
m a 0 d
U cd
2
2 cd k 0
FI*
4
b-
- 27-

TABLE 3.5
S e n s i t i v i t y of Computed System Metal Mass t o Var ia t ion i n Svstem Loss Conductance I
System Heat Loss Conductance h A
(Btu/hr OF) 2 2
Computed System Mean Metal Mass, M2
(Ibm)
50 5273
I 4784 I 70 I 90 4310
Thus, a reduct ion of h2A2 from 70 t o 50 Btu/hr OF (28 percent ) r e s u l t s i n
an inc rease i n computed M2 of about 10 percent . S imi l a r ly , a 28 per-
cen t i nc rease i n hf i2
most 10 percent . This i s n o t i n s i g n i f i c a n t and i n o rde r t o r e so lve t h e
argument about what va lue of
t u r e o r decrease i n s lope of t he heatup temperature curves on Fig. 3.2
wi th increas ing temperature l e v e l can be used along wi th the a n a l y t i c
s o l u t i o n of t he two-mass model. For t he case of simple hea t ing from
room temperature t h i s s o l u t i o n becomes (see Appendix A)
r e s u l t s i n a decrease i n t he computed mass of al-
h2A2 i s c o r r e c t , t he c h a r a c t e r i s t i c curva-
‘2 ‘25 (em1t - 1) - c26(e m2t - 1) ,
( 3 . b )
(3.4b)
where
- - S a
.c Sla2 1 2 25 (ml-m2)ml ’ ‘26 (ml-m2)m2 *
Using these equat ions and the inpu t d a t a presented i n Table 3.6 below,
the e f f e c t of us ing 50, 70, and 90 Btu/hr OF f o r h2A2 (corresponding
va lues of M2 from Table 3.5) w a s i nves t iga t ed .
- 28-

TABLE 3.6
Input Data f o r Heatup Trans ien t P red ic t ions (Run I D N o . 070974)
A 1 M L C i h2Aa c2 Sl (Btujhr OF) (Btu/ F) (Btu/hr F) (Stu? "P) (Btu/hr)
5 800* 903 50 638 76,800
5 800 903 70 579 76,800
5800 903 90 521 76,800
* The i n s i d e su r f ace area i n con tac t wi th water, es t imated t o be 58 ft2. was determined t o be 100 Btu /hr - f t2 "F by a d j u s t i n g model p red ic t ions t o match experimental ly determined water/metal mean temperature d i f f e r e n c e s .
A1 , was The h e a t t r a n s f e r c o e f f i c i e n t , h l ,
1
The predic ted water temperature t r a n s i e n t s are shown i n Fig. 3.3 with
the corresponding measured water / rock temperature da t a . It appears t h a t
the most l i k e l y mean va lue of h2A2 i s between 70 and 90 Btu/hr O F .
The p red ic t ed t r a n s i e n t wi th
va lue o f
The agreement of p red ic t ions wi th experiment i s e x c e l l e n t .
h2A2 = 80 Btu/hr OF and a corresponding
M 2 = 4547 lbm are shown i n F ig . 3.2 f o r run I D N o . 070974.
I n order t o test f u r t h e r the p r e d i c t i o n method and the h2A2 and
PI2 t e m w a s s e l e c t e d . The r e s u l t s are shown i n Fig. 3.4 . The genera l
agreement between experiment and p red ic t ions i s very good except near
the end of the t r a n s i e n t . During the course of these experiments por-
t i o n s of the system i n s u l a t i o n w e r e removed and subsequently r e i n s t a l l e d .
It i s bel ieved t h a t degradat ion of i n s u l a t i o n c a p a b i l i t y r e s u l t e d .
Addi t iona l ly , room a i r - cond i t i on ing was i n s t a l l e d and i n use during the
l a t t e r p a r t o f the t e s t per iod when the c a l i b r a t i o n d a t a were obtained.
The e f f e c t s o f these i t e m s would r e s u l t i n higher l o s s conductance
f o r d a t a obtained during the l a t t e r p a r t of t he tes t per iod and a cor-
responding inc rease i n the mean va lue would r e s u l t . Thus, a run made
e a r l y would have a l o s s conductance lower than the mean f o r the complete
tes t per iod and e x h i b i t correspondingly less curva ture towards the end
of the t r a n s i e n t .
va lues one of the e a r l y heatup t r a n s i e n t s wi th water only i n the sys-
h2A2

C a k a
W %I .rl a k 0
W
m u c a
U
a k 7 u
cr)
cr)
a k 7 M 4 Erc
- 30-

LL 0
II II P?
I I 1 0 0 0 d- rr)
0 0 0 0 0 0
cu - 0 0 u3
(A) 0 '3tJfllWt33dW31 SS33X3

To assess the unce r t a in ty a s soc i a t ed wi t4 the computed mean va lue
of the system mass (M2 = 4547 lb,) one can c a l c u l a t e the s tandard devia-
t i o n a s soc i a t ed wi th M2 . The s tandard dev ia t ion i s - + 245 lb,,, which
corresponds t o approximately _+ 5 percent , w'iich w i l l be adapted as the
e r r o r sigma* f o r the e f f e c t i v e system mass.
There may be two explana t ions f o r M2 based on exppr imr i t being
lower than the es t imated va lue given i n Table 3 . 2 . The estim'ited va lue
may be biased towards the high s i d e , o r n o t a l l m a s s i n v o l w d i s e f fec-
t i v e , i . e . , does n o t "see" the f u l l temperature change. There a r e sev-
e r a l p laces where t h i s i s the case , e . g . , the s i g h t g l a s s e s , p a r t of the
chimney support s t r u c t u r e , and accumulator 2 were a l l observed t o remain
a t temperatures considerably lower than the mean due t o poorer insu la-
t i o n and water c i r c u l a t i o n . Despi te these observa t ions the re i s no
bas i s f o r changing the est imated mass f r a c t i o n s i n Table 3 . 2 . The cor-
responding ad jus t ed system masses are given i n the t h i r d column of
Table 3 . 2 .
It i s d i f f i c u l t t o estimate an e r r o r sigma f o r the mass f r a c t i o n s
given i n Table 3 . 2 and
propagation
chimney mass y i e l d s an est imated e r r o r sigma of a b o u t + 7 percent f o r
the e f f e c t i v e chimney mass.
_+ 5 percent has been assumed. Appropriate * of the e r r o r s a s soc i a t ed wi th system mass f r a c t i o n and the
-
The m a s s f r a c t i o n s a s soc i a t ed wi th the var ious sec t ions of the chim-
ney given i n t he second column of Table 3 . 1 were a l s o r e t a ined as o r ig in-
a l l y es t imated . These mass f r a c t i o n s are used t o determine the chimney
s e c t i o n masses from t o t a l chimney mass as l i s t e d i n t he t h i r d column of
Table 3 . 1 .
3 . 1 . 3 Cooldown Trans ien t Experiments
Severa l cooldown experiments without c i r c u l a t i o n were run with and
without rock i n the chimney t o estimate the e f f e c t i v e mean hea t loss
conductance f o r the chimney alone. I n t he previous s e c t i o n the l o s s
~~ ~ * Terms used t o i n d i c a t e u n c e r t a i n t i e s throughout t h i s r e p o r t are (1) s tandard dev ia t ion obta ined from s t a t i s t i c a l a n a l y s i s o f d a t a , and ( 2 ) es t imated unce r t a in ty based on b e s t estimate. The term e r r o r sigma i s used f o r the r e l a t i v e unce r t a in ty ( r e l a t i v e t o mean va lues o r e .g . s c a l e reading) .
Combined e r r o r computed from 2 2 112 Jwr B = (of +- o2 + .. . + on) .
- 32-

conductance f o r the complete system w a s determined t o be about 80 Btu/hr"F
and the 10SS conductance f o r t he chimney a lone i s somewhat lower.
A cooldown t r a n s i e n t i s shown i n Fig. 3.5. The cooldown curve i s
f a i r l y l i n e a r on semilog paper a f t e r an i n i t i a l adjustment per iod .
eve r , a f t e r about 20 hours of cool ing , dev ia t ion from t h i s l i n e a r behavior
occurs , be l ieved t o be due p r imar i ly t o non- l inear h e a t t r a n s f e r e f f e c t s
such as decreasing importance of r a d i a t i o n . The p red ic t ed cooldown tran-
s i e n t from s p e c i f i e d i n i t i a l condi t ions without e x t e r n a l hea t ing i s given
by the genera l t r a n s i e n t model s o l u t i o n from E q s . (3 . l a ) and (3 . lb) (see
Appendix A) as:
How-
m2t - C22e 
m l t 02 = C21e
where Cll through C22 are given by
(3.6a)
(3.6b)
elO(m2+a2+a3) + 8 a e10(~,+a2+~3) + eZ0al 20 1
ml - m2 ' c12 - cll - J ml - m2
ml and m are given by Eq. (A.lO) i n 2 and the inverse t i m e cons tan ts
Appendix A . I f real ist ic numbers are used t o c a l c u l a t e m i and m2 , one f inds t h a t Im21 >> l m l l . Moreover, m l and m2 are negat ive .
Thus, t he l a s t term i n E q s . (3.6a) and (3.6b) become r e l a t i v e l y small
a f t e r about one hour, and el becomes approximately
mlt f o r t 2 1 h r . =%le
Taking the n a t u r a l logari thm
I n el I n Cll + m l t ,
- 33-

600
500
- 4001 L L 0 Y
- 300 W LT 3 I- LT W 0,
I- cn cn W 0 X W
a
5 200
I I 1 I I ' 0 5 2 4 7
Symbol D escr i pt io n - 0 Mean Chimney Water Temperature
A I I Metal II
Predicted Water Temperature II Metal - - - II
8 8
IO0 0 10 20 3 0 40 50 60 70
COOLDOWN TIME (h r )
Figure 3.5 Typical chimney cooldown t r a n s i e n t
- 34-

and eva lua t ion a t two times tl and t2 gives t h e s lope
Thus, from d a t a t h a t p l o t approximately as a s t r a i g h t l i n e on semilog
paper , the dominant i nve r se time cons tan t , m i , can be determined from
the s lope between two p o i n t s i n t i m e . The mean s lope w a s eva lua ted be-
tween time 0 and 20 hours where the cooldown curves are r e l a t i v e l y l i n -
ear. This reg ion spans the temperature range o f i n t e r e s t during product ion
runs and i t i s the re fo re des i r ed t o p r e d i c t h e a t l o s s e s i n t h i s region wi th
the g r e a t e s t accuracy.
The e f f e c t i v e chimney h e a t t r a n s f e r loss conductance, hp12 , can be
derived from mean values of m l . The express ion f o r m l and m2
(Eq. A . lO) can be approximated using a binomial expansion of the square
r o o t term by the following expression:
S u b s t i t u t i n g f o r al , a2 , and a3 using the r e l a t i o n s ( A . 6 ) ,
The experimental ly determined va lues of ml and computed values of
us ing Eq. (3.9) and o t h e r p e r t i n e n t information are summarized i n
The h e a t capac i tances i n Eq. (3.9) w e r e eva lua ted a t a mean h2A2 Table 3.7.
temperature of 400°F.
used f o r t he heatup t r a n s i e n t , l i s t e d i n Table 3.3. Also, t he der ived
va lue of M2
water runs are s l i g h t l y higher than f o r t h e water / rock case. Although
the e f f e c t i s n o t pronounced, from a phys i ca l p o i n t of view t h i s i s t o
be expected due t o t he s l i g h l y lower (8.6 percent) t o t a l h e a t capaci-
tance of the water/rock system as compared t o t he water system.
va lue of the computed h e a t loss conductance i s 32.2 Btu/hr "F and the
The inpu t d a t a sources used are the same as those
given i n the previous s e c t i o n w a s used here .
From Table 3.7 i t can be seen t h a t the mean t i m e cons tan ts f o r t he
The mean
- 35-

I
L n o a m
m o m b d m m m N N N N 0 0 0 0 0 0 0 0
1 1 1 1
. . . .
- 36-
Y c)
k k M 0
N N
N d m H I c c
. .

standard dev ia t ion i s f 1 . 2 Btu/hr 9 , which corresponds t o an e r r o r
sigma of f 3 . 6 percent .
A comparison o f t he magnitudes of the t o t a l system h e a t l o s s t o t he
chimney model h e a t loss (80 vs 3 2 . 2 Btu/hr OF) shows t h a t the chimney
model h e a t l o s s i s about 40 pe rcen t of t h e t o t a l system h e a t loss .
i s as expected s i n c e the su r f ace area of t he chimney model i s about one
h a l f of the t o t a l system su r face area. Moreover, t he i n s u l a t i o n on the
chimney i s t h i c k e r than the mean f o r t he system wi th correspondingly
lower h e a t t r a n s f e r c o e f f i c i e n t f o r the chimney model.
This
The parameters ca l cu la t ed i n these s e c t i o n s , t he e f f e c t i v e chimney
mass and h e a t loss conductance and t h e i r es t imated e r r o r sigmas are sum-
marized i n Table 3 . 8 f o r later re ference .
TABLE 3 . 8
Tabulat ion of Chimney Parameters 1
Estimated
Parameter Value (percent) Mean Er ro r Sigma
I
E f f e c t i v e chimney model mass (M2) 3428 lbm 7 E f f e c t i v e chimney model h e a t loss conductance (h&) 3 2 . 2 Btu/hr "F 3 . 6
P E

CHAPTER 4
ROCK CHARACTERIZATION
To compare experiments with various types and sizes of rocks in the
chimney model, some uniform description or measurement of the rock is
needed. These measurements are useful when (1) the performances of the various rock types are to be compared, and
formance results are to be utilized in estimating the performance of real systems. However, the characteristics of rocks in a real system are
seldom known. Little information is available about rock statistical size
distributions resulting from hydraulic fracturing, thermal fracturing, and chemical explosive fracturing.
rubble chimnies resulting from contained underground nuclear explosions.
( 2 ) when the chimney per-
On the other hand, some data do exist for
4.1 Rock Statistics
Characteristics of rocks that appear to be significant for the present study includes linear length dimensions, shape and roundness
factors, volume, surface area, and surface roughness. Measurement of
rock characteristics such as shape and roundness is difficult; several
methods have been devised (Griffiths,l967; Krumbein, 1941; Pettijohn,
1951). A large number of measurements is required for a single rock to define its characteristics accurately. However, for a large assembly of
similar rocks a practical scheme is based on measurement of the three
orthogonal axis of the rocks illustrated on the upper portion of Fig.
4.1. Corresponding to the shape factors obtained from these three meas- urements ( b/a and c/a ) the verbal classification scheme shown on the
lower part of Fig. 4.1 has been utilized.
A measure of the roundness or a roundness factor, JI , (Griffiths, 1967), based on the three length dimensions is given by
2 1 / 3 JI A (bc/a ) . (4.1)
The equivalent diameter, d , of a rock is related to the volume deter- mined from weight and density measurements by
1 / 3 Equivalent diameter d a = (6V/rr) - - 38-

I .c
212
b/O
u - lcl lyll l
b = breadth c = thickness
I I I I I 0 I I
I ~.Tobulor or oblote Equant - - - -- -- -- -- -- ---- - --- --
I I I I I I I I I I I I
213 I .o C
0 a
10
Figure 4.1 Zingg classification system for rock shapes (from Krumbein, 1941; Prttijohn, 1951)
- 39-

Another method of characterizing rock is sieving. However, sieving
gives only an overall or mean measure of size, thus the method does not
provide any specifics about shape and roundness.
4 . 2 Sampling Techniques A major object of any statistical sampling procedure is to obtain
a representative or random sample of the population for reliable statis-
tical information. The sampling techniques considered for this study
include :
1.
2.
3 .
The
a method
as it is
The selection of a large sample (order of 10 percent of popula- tion) with no particular precautions taken to assure randomness
of the sample. Point counting, a method involving a relatively small sample
but where particular emphasis is on assuring randomness of
the sample. The selection of several smaller samples from various locations
in the rock pile, e.g., one shovel each from top, middle, bot-
tom and side of rock pile.
reason for considering all these methods is to attempt t o find
which will provide the maximum information with minimum effort,
important to find the most efficient method for use on future
rock loads.
sion ( a , b , and c ) and mass measurements on individual rocks ob-
tained using sampling procedure (1) progress on method ( 2 ) .
To date the analysis of the data consisting of length dimen-
has been completed and work is in
4 . 3 Preliminary Results of Rock Statistical Analysis The sample analyzed consisted of 1978 rocks (140 lb,) and were se-
lected from a population of 1100 lbm . over after the chimney had been loaded with 1640 lbm from the original
population of about 2700 lb,.
crushed and passed through a 1 .5 inch mesh.
rock were cleaned with water while located in a No. 8 sieve (1/4 inch mesh) to remove smaller particles that would be a danger to system compo-
nents such as the circulation pump. Each rock was measured to determine
dimensions a , b , and c and its weight. From these measurements the
This population was the rock left
The rock type was granite which had been
The sample and the chimney
- 40-

fol lowing u a n t i t i e s were computed f o r each rock:
Breadth l length r a t i o 4 b /a , Thickness/ length r a t i o = a c / a ,
Roundness f a c t o r (Eq. 4 .1))
Equivalent diameter (Eq . (4.2) )
Surface area 2*
A 4 n d
(4 .3 )
(4 .4 )
(4 .5 )
The rock volume, V , used i n Eq. (4.2) ,was computed us ing the mean dens-
i t y of t he chimney rock load which was determined to be
(see page 5 3 f o r f u r t h e r d i scuss ion o f t h i s measurement). For each of
the o r i g i n a l measurements and t h e q u a n t i t i e s der ived from them, Eqs. (4.1)
through (4.5) t he cumulative d i s t r i b u t i o n func t ions and the p r o b a b i l i t y
dens i ty func t ions were computed. For computation and i n p l o t t i n g of the
r e s u l t s , the range of each q u a n t i t y w a s divided i n t o 10 equal i n t e r v a l s .
The r e s u l t i n g cumulative d i s t r i b u t i o n and p r o b a b i l i t y dens i ty func t ions
are shown i n F igs . 4.2 through 4.10. A l s o , included i n t hese f i g u r e s
are the s t a t i s t i c a l parameters computed us ing the formulas l i s t e d below:
p = 2.79 g/cm3
n
Mean x p - 1 x i , n (4.6a)
i- 1
2 A 1 - 2 Variance s = - i (Xi - X) , n- 1
i=l
Standard dev ia t ion B = (s 2 ) 112 Y
n ._
1 - 3 3 Sk = - 1 (Xi - X) , S kewnes s
20 n izz l
1 - 4 4 a n
Peakedness k = - (Xi - X) . i=l
(4.6b)
( 4 . 6 ~ )
(4.6d)
(4.6e)
* This i s the s imples t (and least accu ra t e ) method f o r ob ta in ing su r f ace area. It i s recognized t h a t a more thorough approach i s d e s i r a b l e .
- 41-

r'
c 0
3i
m f: 0
.rl L,
v) f: € a 1)
P rd P
CI 0
0

cu 00 ni II
c 0 a 2
0 L n 0
00 0 - II
c 0
0 > a '13
U T3 c 0
m
.- c .-
-E
c
0 cu c\i 11
cn cn a c U a x U a n

0 - Ln 0 I
00 00 - II
c 0 Q) z
0 (D
0 II
01 0 c 0 .- L
P
b b 0 II
c 0
0 > 0) b U 0 U C 0
rn
.- 4-
.-
L
4-
0 0

0 Lo
- (D
m cj
I1
c 0 a, E
Lo * cu td
I 1
c 0
0 > Q) U
0 U c 0
m
.- t
.-
z
t
cu * 0
II
tn tn a, c 3 a Y v,
(D (D
rri I1
m tn a, c -0 a, Y 0 a, a
r- 0 Lo
3 3 N
3 n -
0 0 -
0 Lo
0
- 45-

I
0 0 00 8 0
c 0 Q) z
Q) 0 c 0
0 > .- L
c 0
0 > a U
0 TI c 0
cn
.- t
.-
e
t
fn cn Q) c 3 a x v)
fn fn Q) c U a3 x 0 Q) CL
r
0 0 -
0 0
€ 0
-0
- c L
t a a
a -0
t Q,
0 > 3 CT w
€ .- t
.-
- 46-

0 0 - 0
ln c
* ln
m prj, - I1
a, 0 c 0 .- L
P
- m pcj - II c 0
0 > a, -0 U 0 U c 0
cn
.- t
.-
L
4-
cu - 0
I 1
cn cn a, c 3 a, Y cn
I I
3 30
P
0 rD
0 In
0 d-
0 m
0 cu
0 -
0 0
- 47-

0 0 0 0 -I
* b 0 I 1
c 0 a z
N 0 0 I I
a 0 c 0 .- L
P
m - 0 I 1
c 0
0 > a '0 D 0 D c 0
m
.- t
.-
L
c
- 0 I
I 1
cn cn a c 3 a x m
0 0
0 In
00
n u n 3

0 In 0 I 1
c 0 a E
N 0 0 I 1
a 0 c 0
0 > .- L
N - 0 II
c 0
0 > a U
0 U c 0
cn
.- c
.-
2
c
0 ln 0
I
0 ln
0
m 0
0
b 0
(D
0
0 0
d- 0
m 0
CY 0
- 0

- 0 0
I1
a 0 c 0
0 > .- L
cn 0 0 II
c 0
0 > a rn
.- c .-
2 0 U t 0
m c
6 0 I
I1
v) cn a C 3 a Y cn
(0 cn a c ’D a Y 0 a n
3 1” 0 c i, a m m Q) t m t 3 0 CL:
rc-
3 W
0 4
- 50-
2 The u n i t s o f 2 and n are t h e same as f o r Xi . The u n i t s o f s
a re t h e u n i t s o f Xi squared . The l a s t two p a r a m e t e r s , Sk and lc are
d imens ion less .
The p r o b a b i l i t y d e n s i t y f u n c t i o n s o f F i g s . 4.2 through 4 . 4 f o r a , b , and c , show t h a t t h e d i s t r i b u t i o n s o f t h e s e q u a n t i t i e s are n o t
normal on t h e low s i d e b u t t h e y are f a i r l y normal on t h e h i g h s i d e .
It i s a p p a r e n t t h a t t h e r e i s a h i g h e r p r o b a b i l i t y o f e n c o u n t e r i n g rocks
w i t h v e r y s m a l l i n d i v i d u a l dimensions t h a n v e r y l a r g e . The p r o b a b i l i t y
d e n s i t y d i s t r i b u t i o n f o r we igh t (F ig . 4 .5) i n d i c a t e s t h a t a rock w i t h one
r e l a t i v e l y s m a l l dimension has t h e two o t h e r measurements o f t h e same
o r d e r . A d d i t i o n a l l y , a rock w i t h one dimension n e a r t h e mean h a s two
o t h e r measurements which are s u b s t a n t i a l l y d i f f e r e n t from t h e mean.
T h i s may be one e x p l a n a t i o n f o r t h e pronounced
p r o b a b i l i t y d e n s i t y f u n c t i o n . The p r o b a b i l i t y f u n c t i o n s o f t h e d e r i v e d
d imens ion less q u a n t i t i e s i n F i g s . 4 . 8 through 4.10 show a remarkable de-
g r e e o f normalcy, p a r t i c u l a r l y t h e roundness f a c t o r . The s t a t i s t i c a l
paramete r s o b t a i n e d f o r t h e f i r s t sample are used as r e p r e s e n t a t i v e o f
t h e f i r s t rock l o a d .
skewness o r t h e we igh t
The mean v a l u e s o f t h e d imens ion less r a t i o s b / a and c /a y i e l d
one p o i n t i n F i g . 4 .11. According t o t h e Zingg c l a s s i f i c a t i o n system on
F i g . 4 . 1 , t h e p r e s e n t rock sample i s c l a s s i f i e d as t a b u l a r ( o r o b l a t e )
i n shape ( b / a = .74, c/a = .50 ) .
4 . 4 Determina t ion o f Rock M a t r i x Paramete rs
The "bulk parameters" o f t h e rock a f t e r l o a d i n g i n t o t h e chimney
are a l s o o f importance f o r t h e i n t e r p r e t a t i o n o f t h e e x p e r i m e n t a l re-
s u l t s . The term "bulk parameters" refers t o such paramete rs as t o t a l
rock mass, mean d e n s i t y , volume o f v o i d , s u r f a c e area/volume r a t i o ,
p o r o s i t y , and p e r m e a b i l i t y f o r t h e chimney l o a d . The volume o f rock
w i t h a s s o c i a t e d v o i d space i s r e f e r r e d t o as t h e r o c k m a t r i x . The rock
m a t r i x ex tends from t h e flow d i s t r i b u t i o n b a f f l e a t t h e bottom t o t h e
f l a n g e f a c e a t t h e top o f t h e chimney (see F i g . 2.10). Thus, t h e r e are
spaces i n t h e chimney and i n t h e i n l e t / o u t l e t p i p i n g where t h e r e are no
r o c k s . C o n s i d e r a t i o n s i s needed f o r t h e d e f i n i t i o n o f t h e p o r o s i t y o f
t h e rock l o a d . On t h e one hand, one cou ld u s e t h e r a t i o o f t h e t o t a l
chimney v o i d between i s o l a t i o n v a l v e s n o t occupied by rock t o t h e t o t a l

I .o
.8
.6
.4
.2
n wO
I I I . I
I I 1 I I SAMPLE MEAN &, I
\ Rock no. iyn: 1 I
& I- - - ----
5 0
.2 .4 .6 .8 I .o Thickness/Length ratio, c/o
F i g u r e 4.11 C l a s s i f i c a t i o n of rocks using breadth / length and th ickness / length r a t i o s as coord ina tes
- 52-

chimney void between i s o l a t i o n va lves with no rock i n chimney.
d e f i n i t i o n f o r t he p o r o s i t y deemed more appropr i a t e i s t o use the rock
ma t r ix p o r o s i t y def ined as follows
Another
A Volume of void i n rock matrix c p " Volume of rock ma t r ix (4.7)
The fol lowing procedure w a s used t o o b t a i n the bulk parameters f o r
the f i r s t load:
(1) The volume of the space between the flow d i s t r i b u t i o n b a f f l e
and the i n l e t i s o l a t i o n va lve w a s determined by f i l l i n g i t wi th water
a t room temperature and weighting the q u a n t i t y of water a f t e r d ra in ing . *
(2) Rocks w e r e p u t on a No. 8 s i e v e and thoroughly hosed o f f t o
remove sand, d u s t , and small rock p a r t i c l e s .
(3) Each ba tch o f rock w a s weighted and emptied i n t o the chimney.
The t o t a l rock weight w a s determined from the sum of t he ba tch weights,.
( 4 ) Af te r loading of rock, s t e p (1) w a s repea ted , bu t t h i s t i m e the
water w a s f i l l e d t o t he top f lange face ( top of rock matr ix) and then
dra ined . The d i f f e r e n c e between volumes determined from s t e p ( 4 ) and (1)
i s the rock ma t r ix void.
(5) Equation (4 .7 ) w a s then used t o compute t h e rock ma t r ix p o r o s i t y .
This p o r o s i t y should be r e f e r r e d t o as the dra inage p o r o s i t y f o r t he rock
ma t r ix s i n c e a small amount of water w a s r e t a i n e d on the rock su r f aces .
( 6 ) The rock mat r ix mean d e n s i t y was then computed us ing volume of
rock (rock ma t r ix volume less void) and t h e measured rock mass.
The bulk rock ma t r ix permeabi l i ty has n o t been determined because
i t i s considered t o be i n f i n i t e l y l a r g e (no r e s i s t e n c e t o flow).
A chemical a n a l y s i s of t he rock has n o t been performed and determi-
n a t i o n of t he rock i n t r i n s i c p r o p e r t i e s of p o r o s i t y and permeabi l i ty
was n o t made.
are very small and of l i t t l e importance t o t hese experiments.
measurements on ind iv idua l rocks have n o t been made s i n c e i t i s a n t i c i -
pa ted t h a t t he bulk dens i ty determined f o r t he load i s adequate.
It i s a n t i c i p a t e d t h a t both these i n t r i n s i c p r o p e r t i e s
Densi ty
A summary of d a t a determined f o r the rock load c h a r a c t e r i s t i c s i s
presented i n Table 4.1. *
A d r a i n l i n e a t the low p o i n t of the i n l e t l i n e w a s used f o r f i l l i n g and d ra in ing opera t ions (see Fig. 2 . 1 ) .
-53-

TABLE 4.1
Summary of Data
Rock type Chemical analysis
Mass of rock in chimney
Overall volume of rock matrix
Volume of rock matrix void
Drainage porosity of rock matrix
Intrinsic rock porosity
Rock matrix permeability Mean bulk density
Intrinsic permeability
Mean length (a) of rocks
Mean breadth (b) of rocks
Mean thickness (c) of rocks
Mean weight of rocks
Mean equivalent diameter (d)
Mean surface area of rocks
Mean breadth/length ratio (b/a)
Mean thickness/length ratio (c/a
Mean roundness factor (4) Mean solid density of rock Specific heat capacity Thermal conductivity
Thermal diffusivity Surface area conditions
Surface area per unit volume
or the First Rock Loa
Granite, "1- 1 / 2 inch"
Not determined
1640 lbm
16.57 ft3 7.25 ft3
43.7 percent
Not determined(- 0)
Infinite
99 lbm/ft3 Not determined(- 0)
3.83 cm
2.82 cm
1.88 cm
32.61 g
2.52 cm
22.74 cm3
0.74 (dimensionless)
0.50 (dimensionless) 0.71 (dimensianless) 2.79 g/cm3
0.2 Btu/lbm "F
0.54 Btu/hr-ft "F 0.019 ft2/hr
Not defined
18.6 ft2/ft3
Source
-- - -
Weighing
Computed
Weighing
Computed -- --
* Mea sur emen t --
Mea s u remen t
Measurement
Measurement
Measurement
Measurement
Computed Computed
Computed
Computed
Mea s uremen t
(Kreith, 1965)
(Kreith, 1965)
(Kreith, 1965) --
Computed * Based on statistical analysis of measurements from first sample.
4.5 Description of Instrumented Rocks
Several "instrumented" rocks were positioned at various locations
in the rock matrix to measure the temperature behavior of a rock during
fluid production testing (see Fig. 2.10). The instrumentation consisted
o f 1/16 inch thermocouples inserted in 1/8 inch diameter holes drilled in selected rocks and cemented in place using a high temperature porce-
lain type cement. Data on the six instrumented rocks are tabulated in
Table 4.2. The last column in the table shows the thermocouple number
-54-

u 1
d !
I%- I
4 J \ m m Q - r l C n a p . . . . . . I%- -= lo * - * * *
I
U I
m m 0 m 0 m
rl
N
m 4
m VI
Q
VI
* a
N
4
- 55-

embedded in each rock. The location of each rock in the rock matrix can be inferred from this information and from Fig. 2.10. A photograph of some of the instrumented rocks is shown in Fig. 4.12. The dimens ion less ratios b/a and c/a for each of these rocks are plotted in
Fig. 4.11. A comparison of the mean quantities for the six instrumented rocks and for the larger sample are made in Table 4 . 3 .
from this comparison that the average shape of the instrumented rocks
are similar to the mean shape for the rock matrix while the mean weight is almost a factor of three larger. The instrumented rocks will there-
fore have somewhat larger thermal capacitance and smaller surface area/
volume ratio than the mean rock in the first rock load and will tend to
cool at a slower rate when located in an environment of decreasing
temperature.
It is apparent
TABLE 4.3 Comparison of Selected Mean Quantities for the Six Instrumented Rocks
Equivalent Weight diameter
b/a c/a $ (g) ( cm)
Mean of the six instrumented rocks .75 .54 .73 85.2 3.88 Mean of first large sample .75 .50 .71 32.6 2.54

E
Figure 4.12 View of a few of the instrumented rocks

CHAPTER 5
TEST AND DATA ANALYSIS PROCEDURES
5.1 T e s t Procedure
Test procedures f o r f l u i d product ion runs cons i s t ed of the follow-
ing s teps :
1. The system was f i l l e d wi th t a p water u n t i l de s i r ed water levels
were e s t ab l i shed .
t o e s t a b l i s h system p res su re of 100-200 ps ig . Chemicals f o r cor-
ros ion c o n t r o l were added a t the beginning of t he water f i l l .
During the e a r l y phase of t he tes t program hydrazin (H2NNH2) w a s
used; la ter sodium s u l f i t e (Na2S03) w a s p r e f e r r e d .
The c i r c u l a t i o n pump and the electr ic c i r c u l a t i o n h e a t e r were
turned on and heatup i n i t i a t e d . Heatup t o i n i t i a l f l u i d produc-
t i o n condi t ions of about 490 "F from room temperature w a s accomp-
l i s h e d i n about t e n hours . When the des i r ed temperature w a s
reached (ad jus ted by the hea t e r thermostat s e t p o i n t ) t he h e a t e r
would t r i p .
p e r a t u r e equi l ibr ium of t h e chimney water / rock/metal system.
Af t e r a few minutes the system had cooled enough so t h a t the
thermostat would switch the hea t e r back on aga in and t h i s cycl-
ing w a s repeated f o r about one h a l f hour. A l l r ecord ing equip-
ment w a s i n ope ra t ion during the heatup procedure.
Argon gas was added t o accumulators 1 and 2
2.
Pump c i r c u l a t i o n w a s maintained t o e s t a b l i s h tem-
3 . The c i r c u l a t i o n pump w a s turned o f f and the chimney w a s i s o l a t e d
by c los ing the i s o l a t i o n va lves on the i n l e t and o u t l e t l i n e s
(see Fig . 2 . 1 ) . P r i o r t o i n i t i a t i n g f l u i d product ion , t he cool-
ing water f o r the condenser w a s turned on and the i n i t i a l weight
(tare) of t he f l u i d product ion tank and the gage p re s su re were
recorded. F lu id product ion w a s i n i t i a t e d by opening t h e pres-
s u r e c o n t r o l va lve (see Figs . 2 .1 and 2 . 9 ) u n t i l the des i r ed
i n i t i a l product ion rate was e s t a b l i s h e d .
chimney gage p re s su re , weight of f l u i d product ion tank, and chim-
ney l i q u i d l e v e l were made i n i t i a l l y a t f requent i n t e r v a l s .
later t i m e s i n the product ion cyc le less f requent logging w a s
Manual logging of
A t
-58-

requi red . Automatic recordings were made of t he temperature
d a t a , chimney p re s su re , and condenser flow rate us ing mul t i-
p o i n t c h a r t r eco rde r s .
appl ied by the chimney tape h e a t e r s , c u r r e n t and vol tage were
a l s o logged.
In the cases of e x t e r n a l hea t ing being
4 . The two f l u i d product ion modes t e s t e d were (i) cons t an t Pres-
s u r e Cont ro l Valve (PCV) s e t t i n g , and (ii) cons tan t product ion
flow rate. In the f i r s t mode t h e PCV s e t t i n g w a s l e f t unchanged
during the product ion run while i n t he second mode the PCV set-
t i n g w a s ad jus t ed (based on p l o t s of cumulative f l u i d product ion
v s time) t o maintain an approximate cons t an t f l u i d product ion
rate.
F lu id product ion was continued u n t i l a low p res su re condi t ion
had been reached. The nominal o b j e c t i v e w a s t o produce t o
about 50 ps ig . Often, however, i t w a s decided t o d iscont inue
a t a higher p re s su re t o i n i t i a t e another run the same day.
a f i n a l s t e p the da t a from the recorder c h a r t s were t abu la t ed
i n convenient form f o r computer process ing .
5.
A s
-59-
5.2 Data Reduction Procedure
5 . 2 . 1
The term " spec i f i c e x t e r n a l h e a t t r a n s f e r parameter" i s used t o de-
S p e c i f i c Ex te rna l Heat Transfer Parameter
s c r i b e the t o t a l amount of energy t r a n s f e r r e d as h e a t t o t he water / rock
system contained i n s i d e the chimney, p e r pound of water o r i g i n a l l y in t he system. The term i s defined as
where
= s p e c i f i c e x t e r n a l h e a t t r a n s f e r parameter (Btu/l&) , qrn
pn = t o t a l e x t e r n a l h e a t t r a n s f e r (Btu) , and
(MW), = t o t a l amount of water i n chimney a t s tar t of product ion
( t = 0 1 Ubm) -

An express ion f o r t he q u a n t i t y Qm has been der ived from energy con- * s i d e r a t i o n s i n Appendix B and i s
" f t ,, f ,820 t
where the symbols are described i n t he Nomenclature.
Also, i t i s of i n t e r e s t t o o b t a i n a n equat ion f o r Qm on a rate
b a s i s .
t he f i n i t e t i m e i n t e r v a l t = tl t o t = t2 i s der ived i n Appendix B
and i s
An approximate express ion f o r t he mean va lue of t h i s q u a n t i t y i n
The numerical va lues f o r M2 and h$i2 given i n Table 3 . 8 are used i n
Eqs. (5.2) and (5.3) . I n eva lua t ing the chimney metal temperature t h e
weight ing f a c t o r s presented i n Table 3 . 1 are used as descr ibed i n
Chapter 3.
5.2.2 Chimney E x i t Enthalpy
It i s a n t i c i p a t e d t h a t when the f l a s h f r o n t has receded i n t o the
rock ma t r ix t he steam e x i t i n g from t h e chimney w i l l be e i t h e r s l i g h t l y
superheated steam o r s l i g h t l y w e t steam. from the top of t he rock matrix t o t he PCV (see Fig . 2.9) t he steam w i l l
be degraded due t o l i n e h e a t l o s s e s t o t he surroundings. The steam ex i t
condi t ion at the PCV can be eva lua ted by an energy balance on the con-
denser .
t i o n s involved are t h a t t he re are no h e a t l o s s e s from the condenser and
no energy s to rage e f f e c t s .
PCV i s given by
While the steam i s pass ing
The d e r i v a t i o n s are presented i n Appendix B. The major assump-
The equat ion f o r t he steam entha lpy a t the
L
i - i - T ) . e H,out +F (Tc,out c , i n P
* The i n t e g r a t i o n i n the second i n t e g r a l i n Eq. (5.2) can be c a r r i e d o u t d i r e c t l y t o y i e l d M2(C2020- C202f) .
- 60-

The terms on the r i g h t are known from temperature and flow rate
measurements. Since the a d i a b a t i c t h r o t t l i n g i n the PCV i s a cons tan t
en tha lpy process , i
the PCV. I f t he steam is w e t , the steam q u a l i t y i s computed from
i s a l s o the steam entha lpy j u s t upstream of e
i - if e P
5
f g 'e i (5 - 4 )
where the steam p r o p e r t i e s are eva lua ted a t the chimney p re s su re ( f o r
n e g l i g i b l e pressure drop i n l i n e upstream of the PCV).
5 .2.3 Chimney Flash Front Locat ion
The s i g h t g l a s s i n s t a l l e d on the chimney t o observe the e f f e c t i v e
f l a s h f r o n t p o s i t i o n during f l u i d product ion tests i s r a t h e r poorly in-
su la t ed and the re fo re t he water contained i n the g l a s s i s a t consider-
ab ly lower temperature than the water i n the chimney. This in t roduces
a dens i ty e r r o r i n the observa t ions which needs t o be co r r ec t ed .
formula f o r t h i s co r r ec t ion i s derived i n Appendix B and i s i n dimension-
less form
A
V a h
where
.L correc ted f l a s h f r o n t p o s i t i o n expressed as a f r a c t i o n of rock h
a' - - observed o r i nd ica t ed f l a s h f r o n t p o s i t i o n (dimensionless) , h
v L
v ,= mean s p e c i f i c volume of l i q u i d water i n the s i g h t g l a s s SG
ma t r ix he ight (dimensionless) ,
= mean s p e c i f i c volume of l i q u i d water i n t h e chimney ( f t3 / lbm) ,
( f t3 / lbm) .
5 .2 .4 Void/Steam Q u a l i t y Rela t ionships
During f l u i d product ion t e s t i n g the two phase mixture contained in-
s i d e the chimney w i l l pass through a series of states on the T- s dia-
gram. *
To determine the product ion pa th and p a r t i c u l a r l y the end s ta te ,
* T- s diagram r e f e r s t o temperature-entropy diagram.
-61-
I

two independent s ta te v a r i a b l e s a r e requi red .
a v a i l a b l e i s the chimney pressure .
determined i s the steam q u a l i t y . The steam q u a l i t y i s def ined by (see
the Nomenclature f o r explanat ion of symbols):
One s tate v a r i a b l e r e a d i l y
A second s tate v a r i a b l e t h a t can be
Mf x , a L ,A P 1 - - . M g + Mf Mw MW
M M
Another q u a n t i t y of i n t e r e s t i s the void f r a c t i o n defined by
( 5 . 7 )
An expression f o r t he void f r a c t i o n , cy , i n terms of the f l a s h f r o n t
p o s i t i o n ( R/h ) is derived i n Appendix B and i s given by
= (vd + vsc + Vc q<!/V 9 (5.9)
where the t o t a l volume occupied by steam and water between the chimney
i s o l a t i o n va lves i s
v = Vd + vsc + v c y + vi . (5.10)
Thus, when , /h i s a v a i l a b l e , e .g . from observa t -ms (see previous sec-
t i o n ) , the void f r a c t i o n can be computed.
A r e l a t i o n s h i p between the void f r a c t i o n and the steam q u a l i t y i n
terms of the void f r a c t i o n CY and the mass f r a c t i o n i s (der ived i n
Appendix B)
V X = 1 - - + ( 1 - or) ,
vL'w (5.11)
where v 6 V/(MW), = i n i t i a l s p e c i f i c volume ( t = 0 ) ( f t 3 / lbm) , 0
v = mean s p e c i f i c volume of l i q u i d s ( s a tu ra t ed o r s l i g h t l y sub- L cooled) ( f t3 / lbm) ,
M* 4 M ~ / ( M ~ ) . - mass f r a c t i o n remaining i n system a t t i m e = t W
(dimensionless) .
- 62-
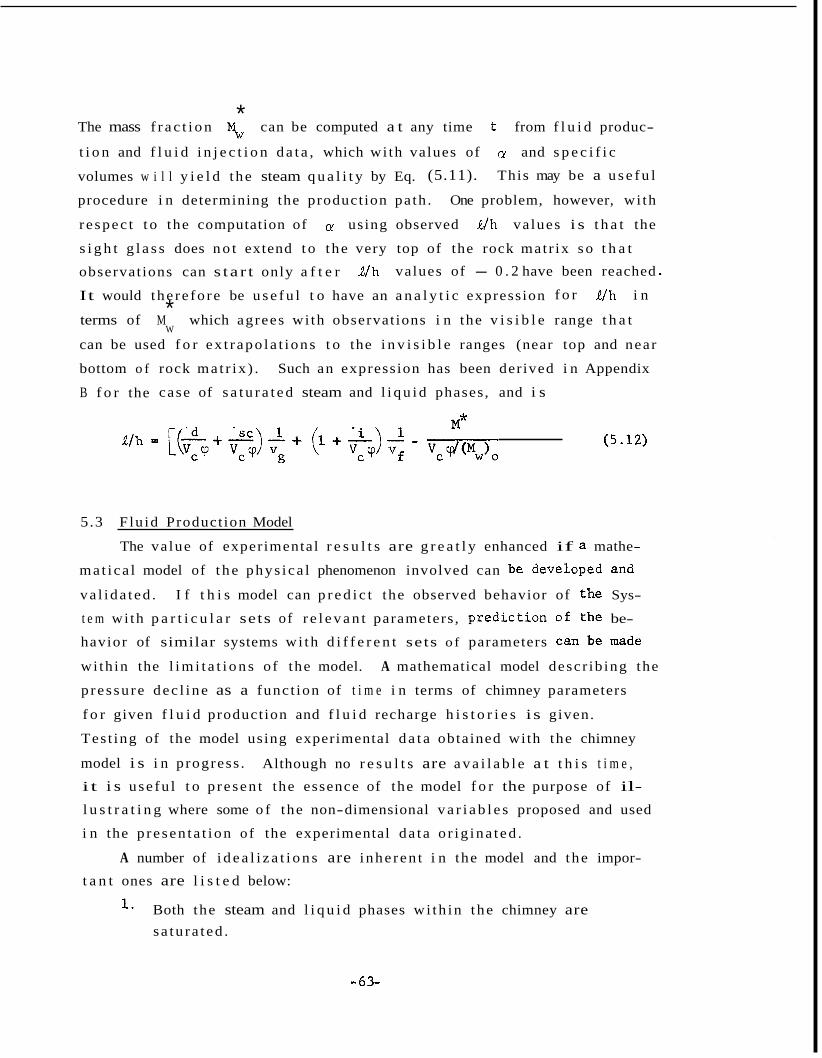
* The mass f r a c t i o n Mw can be computed a t any time t from f l u i d produc-
t i o n and f l u i d i n j e c t i o n d a t a , which wi th values of ry and s p e c i f i c
volumes w i l l y i e l d t he steam q u a l i t y by Eq. (5.11). This may be a u s e f u l
procedure i n determining the product ion pa th . One problem, however, wi th
r e spec t t o the computation of cy using observed R/h va lues i s t h a t the
s i g h t g l a s s does n o t extend t o t he very top of the rock mat r ix s o t h a t
observat ions can s t a r t only a f t e r
It would the re fo re be u s e f u l t o have an a n a l y t i c expression f o r
terms of M which agrees wi th observat ions i n the v i s i b l e range t h a t
can be used f o r ex t r apo la t ions t o the i n v i s i b l e ranges (near top and near
bottom o f rock ma t r ix ) .
B f o r the case of s a t u r a t e d steam and l i q u i d phases, and i s
R/h values of - 0 . 2 have been reached
R/h i n * W
Such an expression has been derived i n Appendix
5.3 F lu id Product ion Model
The va lue of experimental r e s u l t s are g r e a t l y enhanced if a mathe-
ma t i ca l model of t h e phys i ca l phenomenon involved can be developed and
va l ida t ed .
t e m wi th p a r t i c u l a r sets of r e l e v a n t parameters , p red ic t ion of the be-
havior of similar systems wi th d i f f e r e n t sets of parameters can be made
wi th in the l i m i t a t i o n s of the model.
p re s su re dec l ine as a func t ion of t i m e i n terms of chimney parameters
f o r given f l u i d product ion and f l u i d recharge h i s t o r i e s i s given.
Tes t ing of the model using experimental d a t a obtained with the chimney
model i s i n progress . Although no r e s u l t s are a v a i l a b l e a t t h i s t i m e , i t i s use fu l t o p re sen t the essence of the model f o r the purpose of il-
l u s t r a t i n g where some o f the non-dimensional v a r i a b l e s proposed and used
i n the p re sen ta t ion of the experimental da t a o r ig ina t ed .
I f t h i s model can p r e d i c t the observed behavior of the Sys-
A mathematical model descr ib ing the
A number of i d e a l i z a t i o n s are inhe ren t i n the model and the impor-
t a n t ones are l i s t e d below:
1. Both the steam and l i q u i d phases w i th in the chimney are sa tu ra t ed .
-63-

2 . The temperature is that of saturated steam at the given pres-
sure (uniform temperature throughout the chimney).
3 . The rock is in thermal equilibrium with the surrounding two
phase mixture.
Using the principles of conservation of mass and energy on a control
volume enclosing the water/rock system inside the chimney, the following
equation for the pressure decline can be derived:
dP dt - a (5.13)
where ( ) ' indicates differentiation with respect to pressure and other
symbols are explained in the Nomenclature. Equation (5 .13 ) can be made
non-dimensional to a certain extent by introducing the following quanti-
ties:
P = chimney pressure at start of fluid production ( t = 0 ) (psia),
P
Mw = mass of water in chimney (liquid and steam) at time
(M,), = mass of water at
M"
rb = steam production flow rate (lbm/hr) ,
0
Jc n_ - P/Po = non-dimensional chimney pressure (dimensionless) ,
t (lb,) ,
t = 0 (lb,) , MW/(Mw). = mass fraction remaining in chimney (dimensionless)
W
P - (mp) = mean steam production rate for complete pressure depletion
period (lbm/hr) .* A m
m = fluid injection or recharge flow rate (lb /hr)
m: 4 Ai/(: ) = fluid injection rate parameter (dimensionless)
t = production time (hr)
t
= m /(% ) = steam production rate parameter (dimensionless) , P P P
i m
P
* b - - t(AP)/(Mw), = non-dimensional production time parameter
(dimensionless).
With this notation, Eq. (5 .13 ) becomes
- 64-
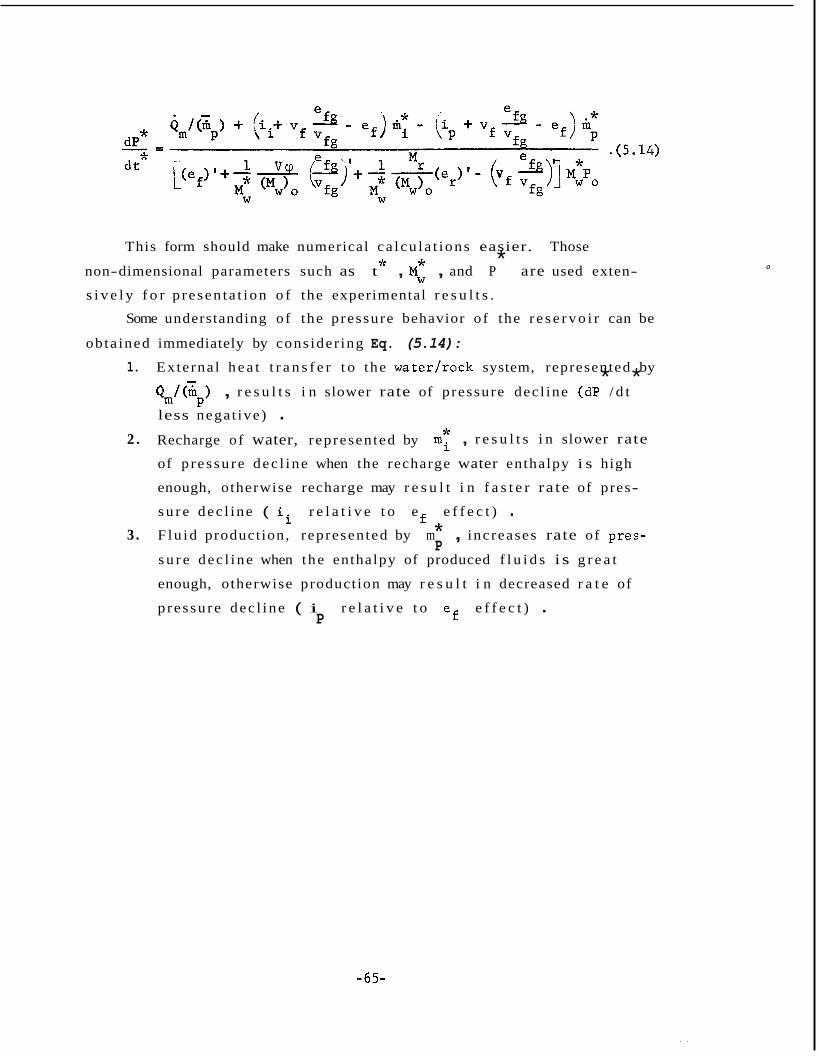
This form should make numerical ca l cu la t ions easier. Those
non-dimensional parameters such as t , Mw , and P are used exten-
s i v e l y f o r p re sen ta t ion o f the experimental r e s u l t s .
* * *
Some understanding of the pressure behavior of the r e s e r v o i r can be
obta ined immediately by cons ider ing Eq. (5.14): 1. Externa l h e a t t r a n s f e r t o the water / rock system, represented by
Qm/(Zp) , r e s u l t s i n slower rate of pressure dec l ine (dP / d t
less negat ive) . Recharge of water, represented by
of p re s su re dec l ine when the recharge water enthalpy i s high
enough, otherwise recharge may r e s u l t i n f a s t e r ra te of pres-
s u r e dec l ine ( ii r e l a t i v e t o e e f f e c t ) . 3 . Flu id product ion, represented by m , increases rate of pres-
s u r e dec l ine when the enthalpy of produced f l u i d s i s g r e a t
enough, otherwise product ion may r e s u l t i n decreased r a t e of
p re s su re dec l ine ( i r e l a t i v e t o ef e f f e c t ) .
* *
* 2 . mi , r e s u l t s i n slower rate
f * P
P
0
-65-

CHAPTER 6
EXPERIMENTAL RESULTS
A t o t a l of n ine f l u i d production runs have been made wi th the chim-
ney model system.
f i r s t t h r ee t e s t s (Runs 1 through 3) were wi th water only i n the chimney
and the remaining tes t s (Runs 4 through 9) were wi th water and rock. It
i s noted t h a t Run 5 w a s f o r p a r t i c u l a r l y low i n i t i a l p ressure and temper-
a t u r e condi t ions .
s t a r t e d leaking during heatup r equ i r ing the c i r c u l a t i o n pump t o be shut
down. The run, however, i s use fu l f o r eva lua t ion of the e f f e c t of low
i n i t i a l pressure/ temperature condi t ions on f l u i d production. The l a s t
run made w a s with recharge of cool water.
The tes t condit ions are presented i n Table 6.1. The
This w a s caused by the c i r c u l a t i o n pump seal which
6 . 1 Spec i f i c Externa l Heat Transfer Parameter
Since the procedure given i n Sect ion 5.2 .1 involves considerable
numerical eva lua t ion r e s u l t s are a v a i l a b l e only f o r Runs 3 and 7 .
these va lues estimates o f the s p e c i f i c e x t e r n a l hea t t r a n s f e r parameters
f o r the remaining runs were obtained by ex t r apo la t ion .
From
A convenient r ep re sen ta t ion of t he var ious energy q u a n t i t i e s in-
volved are given i n Fig. 6 . 1 f o r Run 3. The curves r ep re sen t t he various
terms i n Eq. (5.3) computed from the experimental temperature d a t a and
system parameters evaluated previously. I n t h i s case the re w a s no ex-
t e r n a l hea t ing . Thus the f i r s t i n t e g r a l on the r i g h t i n Eq. (5.2) i s
zero. The second i n t e g r a l i s equal t o area cdefc less the very small
area abca . The t h i r d i n t e g r a l i s equal t o area bfhgb . The t o t a l
e x t e r n a l h e a t t r a n s f e r t o t he water / rock system,
( 5 . 2 ) is the area represented by the hatched area on Fig. 6.1.
, according t o Eq.
The corresponding "energy" diagram f o r Run 7 i s shown in Fig. 6 .2.
Heating w a s appl ied i n t h i s case and the t o t a l energy add i t i on corre-
sponding t o the f i r s t i n t e g r a l i n Eq. (5.2) is equal t o area abcda . Numerical i n t e g r a t i o n of the two i n t e g r a l s by the t rapezoida l r u l e
y ie lded the numerical values presented i n Table 6.2.
The minus s i g n f o r the numerical values of % i nd i ca t e s t h a t energy has been removed from the water during the product ion and a p lus s ign in-
d i c a t e s energy add i t i on . - 66-

a, I h o a J k dcd
%
*A U a , o a 5 8 k PI
4
-r( h cdw
E- rl j -@. m m .rl c m m -4 a, a k k -
a4
C ’ 0 0 ’+ z U
G
2
I U a, VI
5 a4
m c 6 0 0 ,A U J J
rl
G a, rl P cd E-l e .rl
a a, N .rl $4
2 7 m
a, k cd M C .rl a (d 0 rl
4: o 0 k
a, 5 w 0
m 0 .rl tl m
.I+ k a, U 0 cd 2 $
n h rl rl cd .A U .I+ c .rl
:
g
0 .rl U .rl a
o a a, rl 0 0 u P 3 m W
U .rl X a, h
.rl
5 U cd Q) k 3 U
2
n a, k 3 VI m a, k a h
.d B $
ti U cd
a, U m
a a, JJ (d k 3 U cd m W
U 4 x a, h a,
.rl
5 U cd a, k 7 U (d k al
$4 cd rl 2 o .rl U $4 cd a cd c, cd U a, {n m .rl
a, ? rl cd ? u .rl X a,
B cd a, JJ m U cd 5 : cd a, E bo C .rl ti JJ a, VJ
n
PI w4
I S I 3 1 rl .I
c d !
5
C .rl (d U P 0
0 U
v)
a, C .rl rl u a, a a, k a m 01 a, k a a, 5
5
5
m cd
PI a,
bo C .rl U m 7 ’m -a (d
h n
- 67-

1 I
I I I
0
-68-

I I I I *
V -c
L 9
T I I I *
-69-

TABLE 6.2
Numerical Data f o r Spec i f i c Heat Transfer Parameter Evaluat ion I n i t i a 1
tf t f Mass
(Mw) 0 r S2dt M2(c20,0-C202f) oJ h2A2B2dt Qm qm=Qm/ (MJ 0 Run
0' (Btu) @tu) @tu) (Btu) (1b) (Btu/lbm)
3 0 109,200 220 , 400 - 111 , 200 865.7 - 129
7 105 , 800 70 , 300 -100 416.8 -1 176 , 000 c
6.2 F lu id Product ion and Recharge C h a r a c t e r i s t i c s
The cumulative f l u i d product ion vs product ion t i m e f o r the runs of
Table 6 . 1 a r e shown i n F ig . 6.3.
each curve are the t o t a l f l u i d product ion and the product ion t i m e f o r a
p a r t i c u l a r run.
cons tan t PCV s e t t i n g o r cons tan t product ion rate) and the s p e c i f i c ex-
t e r n a l h e a t t r a n s f e r parameter,
The two numbers a t the endpoint of
The t a b l e i n Fig. 6 . 3 shows the product ion mode ( e i t h e r
qm , f o r each run.
The i n i t i a l steam product ion rates were set by the opera tor . For
the runs i n which i t w a s attempted t o keep the product ion rate cons tan t
Runs 5 , 6 , 7 , and 9) t h e opera tor a l s o e s t a b l i s h e d t o some e x t e n t the
shapes of later po r t ions f o r these curves.
The las t run (Number 9) involved recharge of cool water.
runs of Table 6 . 1 had no recharge.
the i n j e c t i o n pump.
t i o n of t he pump a t a p a r t i c u l a r s e t t i n g p r i o r to the t e s t .
All o t h e r
The recharge was accomplished with
The recharge r a t e w a s determined by flow ca l ib ra-
The recharge rate and cumulative recharge f o r Run 9 are shown i n
Fig. 6 .4 . It i s noted t h a t the recharge rate i s low i n i t i a l l y when the
chimney pressure i s h ighes t . Increas ing recharge rates r e s u l t e d as the
chimney p re s su re w a s reduced by f l u i d product ion.
6 . 3 Pressure Deplet ion
On i n i t i a t i o n of the product ion cyc le t he l i q u i d a t the chimney
e x i t w a s gene ra l ly s l i g h t l y subcooled, i.e., i t s temperature was lower
than t h a t corresponding t o s a t u r a t i o n temperature f o r t he given system
p res su re . Figure 6 . 5 f o r Run 3 (water only) and Fig. 6 .6 f o r Run 4
(water/rock i n chimney) show the s a t u r a t i o n and measured temperatures
- 70-

0 * W
+ I
> 2 .E" c c V I V I C K 0 0 0 0
0 0 cu
0 0
0 In
D - 0
- / L -

0 In -
0 0
0 In
I -
O
-72-

a
1 I
L c
W
I-
Z 0 I- o 3
0 E
v
r
-
n
a
d 0
-73-

I
+ .- Y (u
0
E O 8
cn c
a 0 v,
!'
I I I I
I d- 0 0 0, 00 d- d- * e I 0 0, d-
I
I
h rl k rd a,
-74-

as a func t ion of product ion time. The measured water temperatures a t t he
chimney e x i t are a l s o p l o t t e d f o r the e a r l y phase of t h e f l u i d product ion
per iod . The complete chimney p re s su re dep le t ion h i s t o r i e s f o r a l l runs are
shown i n Fig. 6 .7.
the i n i t i a l chimney pressures (see Table 6.1).
the non-dimensional t i m e v a r i a b l e ,
observed t h a t the use of these coordinates tends t o introduce a wide
range of data.
have r e s u l t e d i n a r a t h e r narrow range of da t a . Figure 6.7 shows some
s p e c i f i c c h a r a c t e r i s t i c s :
The pressures along the o rd ina t e are normalized t o
The product ion t i m e i s
t* , defined i n Sect ion 5.3. It i s
The use of s tandard pressure and t i m e v a r i a b l e s would
1. Runs wi th water only (1, 2 , and 3) tend t o dep le t e i n pressure
f a s t e r than the water / rock runs ( 4 through 9) when p l o t t e d in
these non-dimensional coord ina tes . The one except ion w a s
Run 1 which tended t o overlap the water / rock runs , 4 and 5. Run 1 w a s produced more r ap id ly ( l a r g e r PCV opening) than
Runs 2 and 3 . This r e s u l t e d i n a comparatively smaller energy
loss from the water / rock as indica ted by the magnitudes of the
s p e c i f i c e x t e r n a l h e a t t r a n s f e r parameter i n the t a b l e i n Fig. 6 . 7 .
2. Run 5 had the lowest i n i t i a l p re s su re (see Table 6.1) and the
This p re s su re dep le t ion w a s below a l l o t h e r water / rock runs.
run a l s o had a r e l a t i v e l y high s p e c i f i c e x t e r n a l h e a t t r a n s f e r
parameter . 3 . The water / rock runs wi th e x t e r n a l hea t ing (Runs 7 , 8, and 9)
are considerably h igher than a l l o t h e r runs .
e lectr ical energy by the hea t e r tapes produced the low magni-
tudes of the s p e c i f i c e x t e r n a l h e a t t r a n s f e r parameters as ind ica t ed i n t he t ab l e . The use of non-dimensional coord ina tes
a l s o tended t o " s t r e t ch" the curves f o r the heated runs t o the
r i g h t .
The supply of
6 . 3 F rac t ion Produced
The f l u i d s produced d iv ided by the t o t a l amount of f l u i d s or ig in-
a l l y i n the system i s of s ign i f i cance i n geothermal resource eva lua t ions .
The f r a c t i o n i s o f t e n r e f e r r e d t o as f r a c t i o n produced.
- 75-

* 4
.. w z !- -
I- O 3 a 0 E a
a, 5 w 0
v)
C 3 k rl rl (d
k 0 w v)
al .rl k 0
C 0
.rl c, a, d a a, a
-76-

I n Fig. 6 .8 t he normalized chimney pressure vs f r a c t i o n produced i s
given f o r a l l runs. Severa l c h a r a c t e r i s t i c s are noted i n t h i s figure:
1.
2.
3 .
4.
5.
The water / rock runs have higher f rac t ions produced than the
water runs except f o r Run 5 which i s among the water runs f o r
most of t he p re s su re range bu t higher f r a c t i o n produced i s
achieved i n t he low pressure range. Since Runs 1 through 3 had
po ros i ty of 100 percent and Runs 4 through 9 had p o r o s i t y 43.7
percent these r e s u l t s may ind ica t e t h a t systems with low p o r o s i t i e s
have higher f r a c t i o n s produced. When energy i s ex t r ac t ed from the
rock the observed behavior i s expected from energy cons idera t ions .
The e f f e c t of i n i t i a l p ressure on the f r a c t i o n produced can be
seen by cons ider ing Run 5 i n r e l a t i o n t o Runs 4, and 6 through
9 , which a l l were a t r e l a t i v e l y higher i n i t i a l p ressures (see
Table 6 .1) .
s u r e t he h igher the f r a c t i o n produced.
It i s observed from Fig . 6 .8 t h a t f i n a l f r a c t i o n s produced
ranged between 13 and 15 percent f o r the water runs. The cor-
responding range f o r the unheated water / rock runs (Runs 4
through 6) was 22 t o 34 percent . This represents roughly a f a c t o r of two which i s what one would expect when a l a r g e frac-
t i o n of energy contained i n the rocks are ex t r ac t ed , s ince the
h e a t capac i ty of t he chimney rock i s of the same o rde r as t h a t
of a corresponding volume of water. Therefore, one can conclude
t h a t a l a rge f r a c t i o n of the energy s to red i n the chimney rock
w a s re leased t o the water during product ion.
Frac t ions produced of more than 50 percent was achieved when
hea t ing was appl ied a t rates l a r g e enough t o make the s p e c i f i c
e x t e r n a l h e a t t r a n s f e r parameter zero o r s l i g h t l y p o s i t i v e
( n a t u r a l environment).
c en t t he re fo re might be expected f o r n a t u r a l systems with other-
wise similar system parameters and a t similar condit ions (same
energy e x t r a c t i o n e f f i c i e n c y from the rock) .
There appears t o be a d i s t i n c t d i f f e r e n c e between the curva tures
f o r the water and water / rock runs.
cha rac t e r i zed by f a i r l y cons tan t s lopes , t he water / rock runs ex-
h i b i t decreasing s lope magnitude wi th decreasing p re s su re l e v e l .
It a l s o appears t h a t t he higher the i n i t i a l pres-
Frac t ions produced of more than 50 per-
Whereas, the water runs are
- 77-

h c C
m
0.l u E m m h
-0 c cd !4
ill
rd 3 u
M 0
W
-0 a
a 0 k PI
Y
- 78-

Comparison of F igs . 6 . 7 and 6 .8 i n d i c a t e some s imilar i t ies .
For example, a h igh l e v e l curve on Fig . 6 .8 (which ind ica t e s
t h a t the a b i l i t y t o produce i s high) has a high l e v e l counter-
p a r t on F ig . 6 .7 even though there i s not a one t o one cor re-
spondence.
a curve on Fig . 6 .7 i n d i c a t e s what a b i l i t y the system has t o
produce f l u i d s .
I n j e c t i o n o r recharge of e s s e n t i a l l y cool water d id no t i nc rease
the f r a c t i o n produced f o r Run 9 . However, such an increase i s
expected i n gene ra l as long as the i n j e c t i o n takes p lace a t the
bottom and the coo le r f l u i d remains i n t he lower s ec t ion of the
chimney, i . e . , does n o t mix with water a t the sur face ( f l a s h
f r o n t ) . I n t h i s case, however, the apparent abnormality i s be-
l ieved t o be caused mostly by the d i f f e r ence i n s p e c i f i c ex-
t e r n a l hea t t r a n s f e r parameters.
It appears t he re fo re t h a t the r e l a t i v e p o s i t i o n of
6 .5 F lash Front P o s i t i o n
The s i g h t g l a s s on the chimney was used t o observe where the e f fec-
t i v e f l a s h f r o n t p o s i t i o n o r l i q u i d l e v e l was loca ted .
t i o n s are presented i n Fig. 6 .9 where the f l a s h f r o n t p o s i t i o n measured
from top of rock mat r ix i s p l o t t e d i n non-dimensional form as a funct ion
of product ion t i m e f o r Run 4. Also given i s the cor rec ted f l a s h f r o n t
p o s i t i o n based on Eq. (5.6) and the computed l i q u i d l e v e l based on Eq.
(5 .12) . The computed l i q u i d l e v e l based on mass f r a c t i o n from Eq. (5.12)
i s an average of 5 percent (of the chimney he ight ) higher than the cor-
rec t ed observat ions.
These observa-
6.6 Chimney Temperatures
The temperature measured a t the chimney e x i t ( T/c 110 on Fig.
2.10) genera l ly corresponded t o the s a t u r a t i o n temperature f o r the meas-
ured p re s su re .
chimney system temperature.
of non-dimensional production time i n Fig. 6 .10.
erenced to ambient temperature ( Tm ) are normalized t o
which i s the d i f f e r ence between the i n i t i a l system temperature and the
ambient temperature.
This temperature measurement w a s t he re fo re used f o r the
These temperatures are given as a funct ion
The temperatures r e f -
0) 8 = To - T 0
- 79-

1 0
- I C 0
m 0 a
.- c .-
N
I In
-
-
Q - L .o 2 0 2 4-
> - L
Q r : v ) v ) n o o z
0
0
0
- a -
- d- -
- N -
- 0 -
- - c D
.- %-a L t 0 E
2
O - - N
- d - Y u
Y-
Q 0 c
1 I I 0 0 - ? CD In d: M N
d o 1 WOtld 33NVlSlC.l lVNOISN3Wla-NON
h L 1;: v
W
I-
Z 0 I- O 3 Q 0 CT a
E -
- bD d -4 M 3 a
co .rl ii .rl v) 0 a L,
L4 w
- 80-
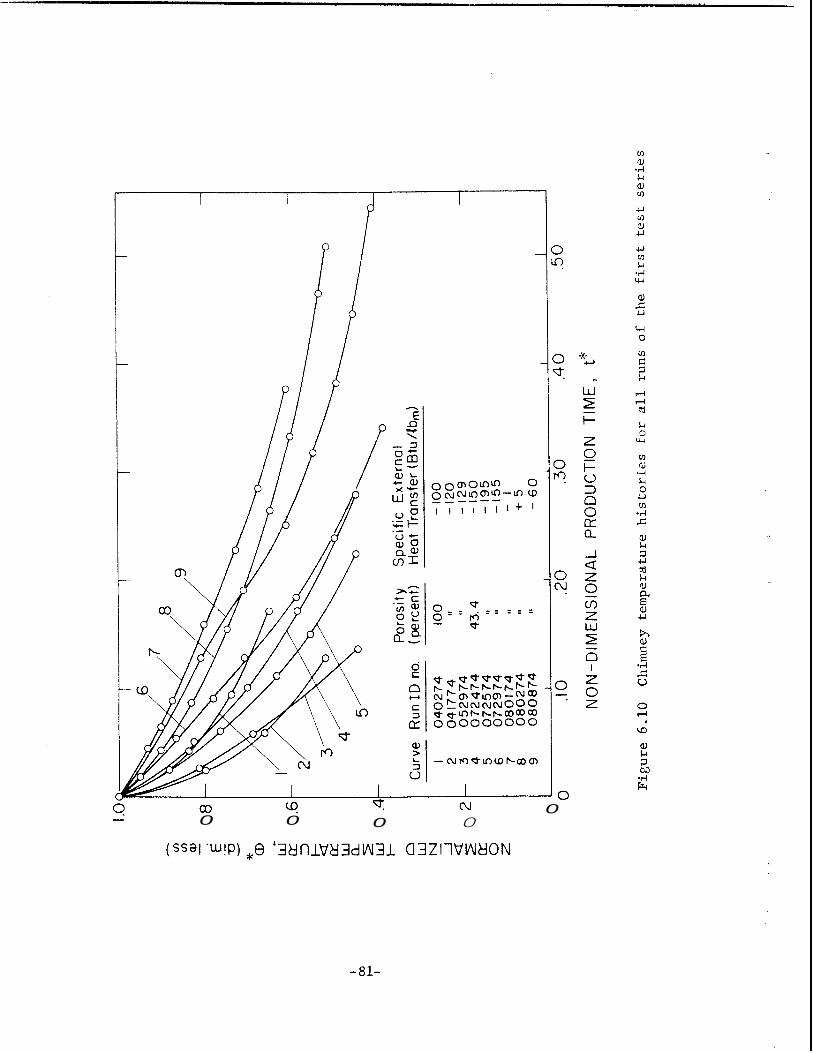
00 cq 0 0
b. cu 0 0
0
- 81-

Because of the vapor pressure/temperature relationship for saturated
water the curves on Fig. 6.10 are expected to resemble the normalized pressure curves on Fig. 6.7 except f o r the very early part of the produc-
tion period where the system is subcooled. figures shows that the pressure and temperature curves for a particular run have the same relative locations on each figure.
A comparison of these two
6 . 6 . 1 Water/Rock Temperature Distribution
The locations of the thermocouples for the determination of chimney
water and rock temperature distributions are shown in Fig. 2.10.
sion of the "instrumented rocks" were given in Section 4 . 5 .
perature data provided by these thermocouples, the water/rock temperature distributions along the chimney center line through 6.16 for Runs 4 through 9. tions are plotted at various values o f the production time,
included are the measured chimney exit temperature which except for early
production times is the saturation temperature corresponding to the chim- ney pressure. Additionally, the uncorrected observations of the water level or flash front positions are included (corrected values on Fig.
6.11).
Discus- From the tem-
* are shown on Figs. 6.11 The water/rock temperature distribu-
t . Also,
These data also show several characteristics:
1. It appears that the initial temperature distribution in the chimney is uniform to a very high degree. ments along the walls o f the chimney also showed similar behavior.
This indicates that there is temperature equilibrium between
the water and rock media at the start of the experiment. During fluid production the water/rock temperature distribution
appears to remain uniform and approximately equal to the satura-
tion temperature in regions below the water level, i.e., there is temperature equilibrium between the instrumented rocks and the surrounding water. It is very likely that the instrumented rock temperatures are representative of the whole rock matrix submerged in water in view of the large mean mass of the indi-
vidual instrumented rocks compared to that of the mean for the
rock matrix (almost a factor of 3 to 1, see Chapter 4 ) . Thus,
Temperature measure-
2.
* An exception was the thermocouples next to the rock matric top which were located 5 inches off center ( 7 inches from the wall).
- 82-

50(
I:
40(
30C f -
a’
2oc
I oc
n “0
I 1 I I0724
I \
U
- Symbol Description 0 Water temp. along center-line
0 Rock center temp. I I - - Measured Chimney exit temp. (saturation temp)
I Uncorrected measured water level
Top of rock matrix / I I
.2 5 5 0 .7 5 I .o NON-DIMENSIONAL DISTANCE FROM TOP
Figure 6.11 Centerline waterlrock temperature historv for Run 5
-83-

500
400
30C
20c
IO(
072574 1 I I I
L 0
,5 - n v
n
* Y
h v ce v
n 0. - 18 I
Svmbol 0
0
Description Water temp. olong center- line
Rock center temp. I I
Meosured Chimney exit temp. (saturation temp.)
Uncorrected meosured woter level
Top of rock mat r ix J I I I I . 25 50 .7 5 I . 0
NON-DIMENSIONAL DISTANCE FROM TOP
Figure 6.12 C e n t e r l i n e water/rock temperature history for Run 5
- 84-

500
4 00
30C
200
too
0
U n 18.6 n
I
Symbol Desc ri p t i on
0 Water temp. along center-line
- .0 Rock center temp I1
- Measured Chimney exi t temp (saturation temp. )
I Uncorrected measured water level
,TOP o f rock matrix I I
0 .25 .50 .7 5 1.0 NON-DIMENSIONAL DISTANCE FROM TOP
Figure 6 .13 C e n t e r l i n e wa te r / rock temperature h i s t o r y f o r Run 6
- 85-

500 ~
400
n LL
e 300 W [y. 3 t-
E W ct-
a
2 200 W t-
100
0
Symbol Desc r i pt io n -
0 Water temp. along center-line
e Rock center temp.
- Measured Chimney exit temp. (saturation temp.)
I I
I Uncorrected measured water level
Top o f rock m a t r i x J I I I I - 0 .25 .50 .7 5 I .o
NON- DIMENSIONAL DISTANCE FROM TOP Figure 6 .14 C e n t e r l i n e wa te r / rock temperature h i s t o r y for Run 7
- 86-

I I I a 0. n h b
- '0° 080274 v U U
t = O ( h r )
400
300
2 0 0
IO0
- Svmbol
0
a
I -
I
Des c r i p t ion
Water temp along center-line
Rock center temp. - II - Measured Chimney exit temp. ( saturation temp.)
Uncorrected measured water level -
Top of rock matrix I I
.25 I 50 .7 5 I .o o J 0
NON-DIMENSIONAL DISTANCE FROM TOP
Figure 6.15 Centerline water/rock temperature history for Run 8
-87-
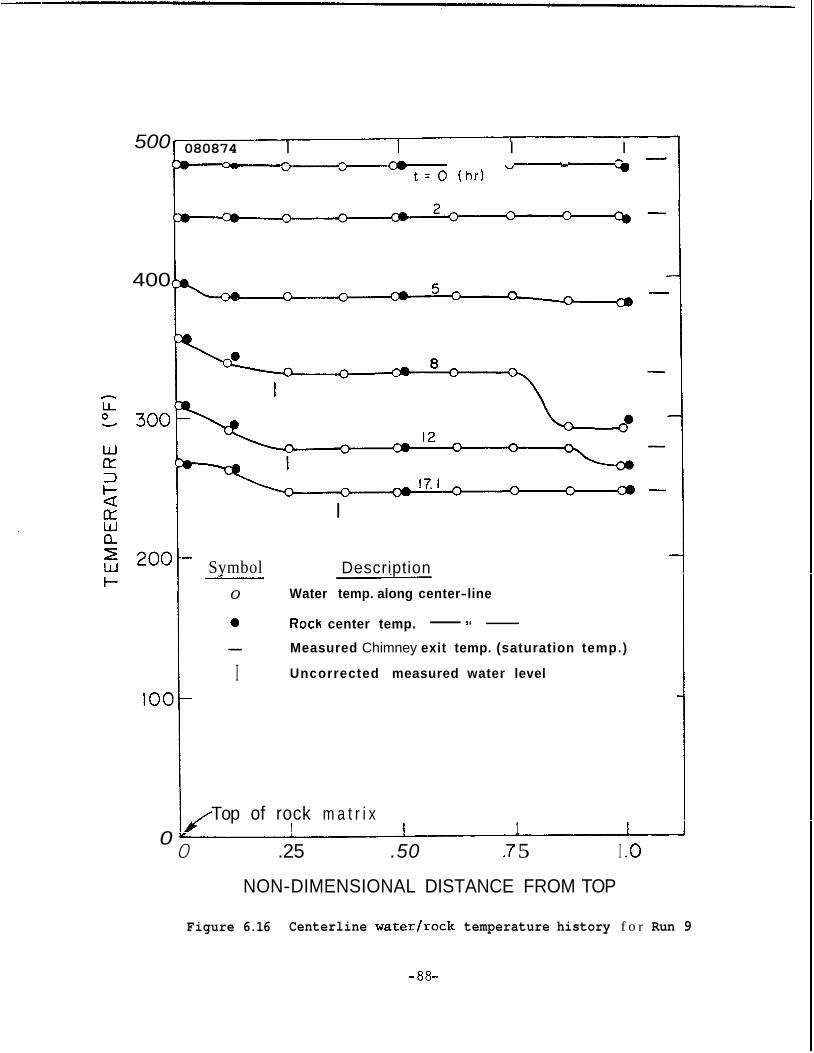
500
400
IOC
I 1 I I D 080874
ry c U -
h
U h V
- t = O ( h r )
- Symbol
0
0
I
I
Description Water temp. along center-line
Rock center temp. - 1 1 - Measured Chimney exit temp. (saturation temp.)
Uncorrected measured water level
Top of rock m a t r i x 1 I
0 .25 .50 .7 5 I .o 0
NON-DIMENSIONAL DISTANCE FROM TOP
Figure 6.16 Centerline water/rock temperature history f o r Run 9
-88-

i f the l a r g e rocks are i n e q u i l i b r i u m w i t h the surrounding
water t h e smaller rocks should a l s o be i n equ i l ib r ium.
It i s observed from Figs. 6 . 1 1 through 6 .16 t h a t when the f l a s h
f r o n t r e c e e d s i n t o t h e chimney, the steam along the chimney
c e n t e r l i n e above t h e f l a s h f r o n t g e n e r a l l y becomes superheated.
The degree of superhea t g e n e r a l l y i n c r e a s e s w i t h d i s t a n c e above
t h e f l a s h f r o n t f o r l a r g e product ion t i m e s . Exceptions are
t h e behavior e x h i b i t e d by 'Runs 4 , 6 , and 8 which have maximum
degrees of superhea t a t p o i n t s below t h e top of t h e rock m a t r i x .
3.
4. During t h e f l u i d p roduc t ion p rocess t h e rock temperatures a r e
reduced i n d i c a t i n g release of s t o r e d thermal energy i n t h e rocks
t o t h e surrounding water. It i s noted t h a t the l a r g e s t rock
energy release was ob ta ined when t h e f l a s h f r o n t w a s l o c a t e d
n e a r e s t t h e top of t h e rock mat r ix .
5 . It i s noted from F i g . 6.16 t h a t t h e c o o l water recharged a t t h e
lower end of the rock m a t r i x remains i n the lower s e c t i o n of
t h e rock matrix due t o i t s h igher d e n s i t y . The h o t t e r water,
due t o i t s lower d e n s i t y , i s l o c a t e d between t h e f l a s h f r o n t
and t h e c o o l e r r e g i o n and evapora t ion of t h i s water determines
t h e system p r e s s u r e .
6 .6 .2 Rock Energy E x t r a c t i o n E f f i c i e n c y
The degree t o which energy i s e x t r a c t e d from chimney rock , c a l l e d
t h e rock energy e x t r a c t i o n e f f i c i e n c y , 7 i s de f ined by the f r a c t i o n
o f energy a c t u a l l y e x t r a c t e d from chimney rock t o maximum p o s s i b l e en-
e rgy e x t r a c t i o n between t h e p rocess temperature l i m i t s .
e x t r a c t i o n e f f i c i e n c y i s g iven by The energy
where
T = i n i t i a l e q u i l i b r i u m temperature of wa te r / rock (OF) ,
Tf = f i n a l temperature ( s a t u r a t i o n temperature corresponding t o
0
t e rmina t ion p r e s s u r e ) ( O F ) ,
T; = f i n a l temperature of rock a t end of p roduc t ion pe r iod ( O F ) . - 89-

The most d i f f i c u l t q u a n t i t y t o determine i s t h e mean temperature of t h e
rock , T; . t h i s case because t h e s e measurements a r e b e l i e v e d t o be r e s p r e s e n t a t i v e
of t h e mean rock matrix temperature d i s t r i b u t i o n .
The measured rock temperature d i s t r i b u t i o n s are used i n
From F i g . 6 . 1 1 t h e energy e x t r a c t e d from rocks i s p r o p o r t i o n a l t o
the a r e a fbcdef whi le t h e maximum energy e x t r a c t i o n p o s s i b l e f o r the
p rocess i s p r o p o r t i o n a l t o the a r e a abcda.
c i ency ,
summarized i n Table 6 . 3 below. It i s observed from t h e t a b l e t h a t the
es t ima ted
The energy e x t r a c t i o n e f f i -
q , was c a l c u l a t e d f o r Runs 4 through 9 and the r e s u l t s a r e
$ s range between 92 and 98 p e r c e n t .
Run Run ID No. To( OF)
4 072474 477
5 072574 386
6 072974 486
7 080174 484
8 080274 486
9 080874 485
Computed Chimney Rock Energy E x t r a c t i o n E f f i c i e n c y , q ,
T f ( OF) T;( OF) ( dimens ion 1 e s s )
255 26 7 .95
217 221 .97
2 36 25 4 .93
327 330 .98
290 306 .92
246 25 1 .98
6 . 6 . 3 Chimney E x i t Steam Q u a l i t y
I n Sec t ion 5 .2 .3 the term chimney
as the steam q u a l i t y a t the PCV. When
has been degraded somewhat due t o h e a t
l e t l i n e . Thus, t h e steam e x i t i n g the
q u a l i t y and en tha lpy than a t t h e PCV.
ex i t steam q u a l i t y was r e f e r r e d t o
t h e steam reaches t h i s p o s i t i o n it
l o s s e s and condensation i n the out-
chimney has a somewhat h igher steam
It i s expected t h a t the degree of degrada t ion i n steam q u a l i t y w i l l depend on the steam flow r a t e s i n c e t h e
h e a t l o s s e s from t h e o u t l e t l i n e a t a p a r t i c u l a r temperature l e v e l w i l l
n o t change w i t h steam f low rate.
PCV vs the steam flow rate (see Sec t ion 5 .2 .2 ) a r e p resen ted i n Fig. 6 .17 f o r Run 4.
A p l o t of d a t a on steam q u a l i t y a t the
A t e a r l y p roduc t ion times ( h i g h e s t product ion rate) the steam qual-
i t y i s about 90 p e r c e n t a t the PCV, i n d i c a t i n g t h a t the steam e x i t i n g
- 90-

0
0
0
0
0
0
0
0
0
0
0 0
0 0
0 0
0
0
b rl
10 .
-91-

the rock m a t r i x w a s n e a r s a t u r a t e d , i . e . , the steam q u a l i t y was near 100 p e r c e n t dur ing e a r l y p roduc t ion times (excep t f o r ve ry e a r l y produc-
t i o n t i m e s when t h e system was subcooled). It i s b e l i e v e d t h a t t h i s was
the c a s e f o r most of t h e product ion c y c l e a l though evidence of superhea t
w a s noted a t the chimney e x i t thermocouple l o c a t i o n f o r s h o r t p e r i o d s of
t ime. The thermocouple o c c a s i o n a l l y jumped from a reading corresponding
t o s a t u r a t e d c o n d i t i o n s t o a level 1 5 - 30°F h igher b u t would then "de-
s up e rhea t " rap i d 1 y . 6 . 7 Thermodynamic P a t h of Product ion Process
The water /s team mixture i n the chimney passes through a series o f
thermodynamic states as f l u i d s a r e produced and the chimney p r e s s u r e de-
c l i n e s . These series of states are denoted h e r e as t h e thermodynamic
p a t h f o r t h e p roduc t ion p rocess . I n t h e subcooled reg ion the p a t h i s
determined by two independent s ta te v a r i a b l e s such a s p r e s s u r e and tem-
p e r a t u r e which are a v a i l a b l e from measurements. I n t h e more impor tant
s a t u r a t e d r e g i o n , p r e s s u r e and temperature are n o t independent so t h a t
only one s ta te v a r i a b l e i s known from measurements; e i t h e r p r e s s u r e o r
temperature can be used ,
i t y can be ob ta ined us ing the v o i d / q u a l i t y r e l a t i o n s h i p p resen ted i n
Sec t ion 5 . 2 . 4 . The d a t a necessary t o compute t h e steam q u a l i t y are t h e
void f r a c t i o n which can be ob ta ined from obse rva t ion o f the f l a s h f r o n t
p o s i t i o n . The void f r a c t i o n and steam q u a l i t y were computed us ing t h i s
procedure f o r Run 4 and t h e r e s u l t s are p resen ted i n F i g . 6.18. It i s
noted t h a t the vo id f r a c t i o n i s c l o s e l y a s s o c i a t e d wi th t h e l i q u i d l e v e l
parameter, R/h , shown i n F i g . 6 .9 . A t f i r s t when t h e p r e s s u r e i s rela-
t i v e l y h igh and t h e s p e c i f i c volume of steam r e l a t i v e l y low, t h e steam
q u a l i t y appears t o r ise sharp ly .
volume i n c r e a s e s , t h e r e appears t o be a temporary drop i n the steam q u a l i t y .
p a t h f o r the product ion process can be sketched on t h e i n d i c a t e d i n Fig. 6 .19.
lbm of f l u i d s and i s r e l a t e d t o the n e t energy t r a n s f e r t o the water- steam mixture system.
An a d d i t i o n a l s t a t e v a r i a b l e , t h e steam qual-
A s t h e p r e s s u r e decreases and s p e c i f i c
Given v a l u e s of temperature and steam q u a l i t y the thermodynamic
T- s diagram as The area under the curve r e p r e s e n t s energy p e r
- 92-

- 0 n E > v)
0 0 -
-93-

h
Q, C Y C 0 e
.-
0 v
W e 3 t- Q: e W n z W I-
1200
1000
800
600
400
200
0.5 1 .o I . 5 2 .o ENTROPY ( Btu/lb, O R )
F i g u r e 6.19 Temperature-entropy diagram showing thermodynamic product ion p a t h f o r Run 4
- 94-


CHAPTER 7
DISCUSS ION
7 . 1 R e s u l t s
The exper imenta l r e s u l t s g iven i n Chapter 6 are cons idered p r i l i m i -
na ry because i n s u f f i c i e n t d a t a have been ob ta ined f o r f i rm conclus ions
t o be drawn. A d d i t i o n a l l y , there has been i n s u f f i c i e n t t i m e a v a i l a b l e
f o r a complete d a t a a n a l y s i s .
r e p r e s e n t a t i v e p i c t u r e o f t h e n a t u r e of t h e a v a i l a b l e exper imenta l re-
s u l t s . Moreover, i t i s be l i eved t h a t t h e p re l imina ry r e s u l t s are use-
f u l f o r f u t u r e t e s t p lanning .
However, i t i s hoped t h a t t h e d a t a g i v e a
It i s noted from t h e t a b l e s i n F i g s . 6 . 3 , 6 . 7 , and 6 . 8 t h a t t he
s p e c i f i c e x t e r n a l h e a t t r a n s f e r parameter , , i s nega t ive f o r Runs 1
through 6 , when no e l e c t r i c a l energy w a s added by the tape h e a t e r s on
t h e chimney.
and i t i s seen t h a t
only one h e a t e r t ape on.
vironment f o r t h e w a t e r l r o c k system under s tudy
p o s i t i v e which can be achieved by supply ing more e l e c t r i c a l energyby t h e
tape h e a t e r s . It would be convenient f o r comparison purposes t o ma in ta in
qm complish wi th manual c o n t r o l of tape h e a t e r power.
w i t h d i f f e r e n t
model f o r t h e f l u i d product ion p rocess which i s be ing developed.
Runs 7 and 8 were made w i t h e l e c t r i c a l power on two t a p e s
i s c l o s e t o ze ro f o r bo th runs . Run 9 had qm To approximate cond i t ions of a " natura l" en-
\ should be s l i g h t l y
c o n s t a n t f o r a l l f u t u r e runs ; however, t h i s i s very d i f f i c u l t t o ac-
Comparison of runs
pn can be made i n d i r e c t l y by t h e use of t h e mathematical
The f l u i d product ion rate i s determined by manual adjustment of t h e
p r e s s u r e c o n t r o l v a l v e (PCV) b u t a s k i l l e d o p e r a t o r i s r equ i r ed t o o b t a i n
a d e s i r e d f l u i d product ion c h a r a c t e r i s t i c . During t h e s e t e s t s i t was a t -
tempted t o keep t h e p roduc t ion rate c o n s t a n t f o r some runs . 6 . 3 i t i s appa ren t t h a t f a i r l y c o n s t a n t flow r a t e s were achieved f o r
t h e s e runs dur ing most of t h e product ion p e r i o d , bu t t h a t t h e rates
dropped o f f nea r t h e end.
f l u i d product ion c h a r a c t e r i s t i c ( c o n s t a n t rate) f o r t hese runs , l a t e r
runs should be made w i t h c o n s t a n t PCV s e t t i n g ( cons t an t flow area) s i n c e
t h e o p e r a t o r then w i l l have more t i m e t o a t t e n d o t h e r o p e r a t o r func t ions .
From F ig .
Due t o d i f f i c u l t y i n main ta in ing t h e d e s i r e d
- 95-

The r i s i n g recharge c h a r a c t e r i s t i c ob ta ined f o r Run 9 i s probably
n o t r e p r e s e n t a t i v e f o r t h e d i f f e r e n t types of recharge from real reser-
v o i r s . It i s expected that manual c o n t r o l of t h e i n j e c t i o n pump can be
used t o p rov ide p r e s e l e c t e d recharge c h a r a c t e r i s t i c s f o r f u t u r e runs .
The water became s a t u r a t e d as noted from F i g s . 6 . 5 and 6 . 6 f o r Runs
3 and 4 a t approximately 0 .5 and 0!25 hour, r e s p e c t i v e l y .
i s r easonab le , cons ide r ing t h e chimney had about twice a s much l i q u i d i n
i t i n Run 3 compared t o Run 4. With approximately equa l i n i t i a l produc-
t i o n rates f o r bo th c a s e s , t h e decompression t i m e s are expected t o be
about a f a c t o r of two d i f f e r e n t . It i s a l s o no ted t h a t t h e degrees o f
i n i t i a l subcool ing d i f f e r s f o r t h e two c a s e s . The combination o f com-
p r e s s i b i l i t y and degree o f subcool ing appears t o account f o r t he observed
behav io r .
The d i f f e r e n c e
When the p r e s s u r e i s lowered and b o i l i n g i n i t i a t e d i n t h e rock ma-
t r i x the temperature o f t h e sur rounding water i s reduced. The rock/
water temperature d i f f e r e n c e s e s t a b l i s h e d r e s u l t i n h e a t t r a n s f e r from
t h e rocks t o t h e water. The rate o f heat t r a n s f e r from the rocks w i l l
depend p r i m a r i l y on rock s i z e l s h a p e d i s t r i b u t i o n s and ra te o f cooldown
o f surrounding water. For t h e cooldown rates of t hese experiments
( p r o p o r t i o n a l t o f l u i d p roduc t ion rates) t h e rock/water temperature d i f -
f e rences were n o t measurable (about 1 O F ) . P r e l imina ry t r a n s i e n t analy-
s i s o f s p h e r i c a l roclcs o f d iameter equa l t o t h e mean e q u i v a l e n t d iameter
f o r t he rock load (about 1 inch) suppor t s t h e exper imenta l f i n d i n g s .
The a n a l y s i s showed t h a t about fou r t i m e s as l a r g e cooldown ra tes a r e
r e q u i r e d t o e s t a b l i s h rock/water tempera ture d i f f e r e n c e s o f about 5 O F .
The t i m e c o n s t a n t f o r a 1 inch s p h e r i c a l rock i s about 0.10 hour de-
pending on assumed s u r f a c e h e a t t r a n s f e r c o e f f i c i e n t , whi le product ion
t r a n s i e n t l a s t e d about 20 hours on t h e average .
rates of t h e system i s l i m i t e d by t h e c a p a c i t y o f t h e condenser t o abou t
twice t h e rates of t h e p r e s e n t exper iments , l a r g e r rocks are r equ i r ed t o
measure rock temperature t r a n s i e n t s .
Since f l u i d product ion
The rock energy e x t r a c t i o n e f f i c i e n c i e s , q , t h a t can be ob ta ined depends mainly on the rock s i ze / shape d i s t r i b u t i o n s and t h e rate o f cooldown
o f surrounding water.
r e s u l t s t h a t t he l o c a t i o n o f t h e f l a s h f r o n t has some in f luence on
A d d i t i o n a l l y , i t i s appa ren t from the exper imenta l
q
- 96-

because roclcs l o c a t e d above t h e f l a s h f r o n t do n o t coo l down a s f a s t as
rocks i n water. Therefore , i f h igh va lues of 7 are d e s i r e d p rov i s ions
must be made t o o p e r a t e w i th t h e f l a s h f r o n t nea r t he top of t he rock
matrix.
The f r a c t i o n produced f o r a system i s l a r g e l y determined by poros- rock energy e x t r a c t i o n e f f i c i e n c y , e x t e r n a l h e a t t r a n s f e r parameter,
When on ly water i s p r e s e n t i n a system i t y , and i n i t i a l and f i n a l p re s su res .
(100 p e r c e n t p o r o s i t y ) t h e energy a v a i l a b l e f o r f l a s h i n g of water i n t o
s t e m i s t h e thermal energy i n the water. The h ighe r t he i n i t i a l p res-
s u r e t h e more energy a v a i l a b l e f o r f l a s h i n g and t h e h igher t he f r a c t i o n
produced.
t he f i n a l p r e s s u r e t h e h ighe r t h e f r a c t i o n produced.
From energy cons ide ra t ions one can a l s o s e e t h a t t he lower
When rockc i s p r e s e n t (po ros i ty l ess than 100 pe rcen t ) and the condi-
t i o n s are such t h a t energy i s e x t r a c t e d from the rock t h i s energy i s
a l s o a v a i l a b l e f o r f l a s h i n g of water i n t o steam and h ighe r f r a c t i o n pro-
duced w i l l r e s u l t . Heat t r a n s f e r from t h e surrounding rock (hos t rock)
o r he re from t h e chimney metal, g iven by t h e va lue of
i s p o s i t i v e ) have t h e same e f f e c t as h e a t t r a n s f e r from the chimney
rock .
qm , w i l l (if qm
Runs 1 through 6 had nega t ive va lues o f qm which i n d i c a t e s t h a t
energy w a s removed from t h e water. Higher f r a c t i o n s produced r e s u l t e d
f o r Runs 7 through 9 which had nea r zero o r l e s s nega t ive than the
f i r s t s i x runs . Only when a l l t hese f a c t o r s are considered can the re-
s u l t s of F ig . 6 . 8 be expla ined . Fu r the r e v a l u a t i o n s of the r e s u l t s i n
con junc t ion wi th t h e a n a l y t i c f l u i d product ion model a r e r equ i r ed l a t e r .
q,
The u s e f u l n e s s of employing non-dimensional coo rd ina t e s f o r t he pres-
s u r e d e p l e t i o n d a t a can be demonstrated by a n example. Suppose it were d e s i r e d t o estimate t h e product ion t i m e necessary t o reduce t h e chimney
p r e s s u r e t o a p a r t i c u l a r va lue a t a d i f f e r e n t mean product ion rate than
t h e exper imenta l bu t f o r o therwise similar cond i t ions (same p o r o s i t y ,
rock energy e x t r a c t i o n , and e x t e r n a l h e a t t r a n s f e r parameter ) . For a g iven P* t h e t
product ion t i m e f o r t h e g iven new mean product ion rate.
Procedure i s u s e f u l f o r e s t i m a t i n g p r e s s u r e d e p l e t i o n times f o r real systems-
* va lue from Fig . 6 .7 can be employed to compute the
A s imi lar
Thus, r e s u l t s obta ined wi th t h e l a b o r a t o r y model can be
employing P and t t o o b t a i n approximate r e s u l t s f o r real * *
sys t e m s . - 97-

It w a s no ted from F i g . 6 . 9 t h a t t he computed l i q u i d l e v e l o r f l a s h
f r o n t p o s i t i o n was h ighe r than the observed one by about 5 p e r c e n t of
rock m a t r i x h e i g h t . I n d e r i v i n g Eq. (5.12) used t o compute the l i q u i d
level , i t was assumed t h a t the space above t h e l i q u i d l e v e l i nc lud ing
o u t l e t l i n e was occupied by s a t u r a t e d steam o n l y .
true because approximately 20 lb, o f water (corresponding t o 5 pe rcen t
o f l i q u i d i n chimney) has n o t been accounted f o r . The s i g n i f i c a n c e of
t h i s a p p a r e n t anomaly i s be l i eved t o be t h a t l i q u i d s are p r e s e n t on
metal and rock s u r f a c e s i n t h e chimney above t h e l i q u i d l e v e l as w e l l
a s i n t he o u t l e t l i n e . The maximum amount o f l i q u i d s t h a t could be l o-
ca t ed i n the o u t l e t l i n e i s 7 lb, (completely f i l l e d l i n e ) and there-
f o r e a s i g n i f i c a n t f r a c t i o n of t he "missing" 20 lbm l i q u i d s must be i n
t h e chimney. Also, s i n c e the s u r f a c e area o f t h e metal i n t he chimney
i s much l e s s than t h a t o f t h e rock a s i g n i f i c a n t amount of t he 20 lbm
l i q u i d s must be on t h e rock s u r f a c e s .
d i s t r i b u t e d evenly over t h e t o t a l rock surface above t h e l i q u i d level ,
an average f i l m th i ckness of about 0.017 i n c h would r e s u l t . It i s be-
l i e v e d t h a t t h i s l i q u i d "hangup" i s accen tua ted f o r t h e annulus o f rocks
loca t ed n e a r t he chimney w a l l s and nea r t h e top head.
This i s obviously n o t
If t h e 20 lb, of l i q u i d s were
It w a s noted from F igs . 6 . 1 1 through 6 . 1 6 t h a t f o r l a r g e product ion
t i m e s t h e steam above t h e f l a s h f r o n t i s superhea ted . The degree of super-
h e a t was o f t e n reduced when t h e steam was ascending towards the top o f
t h e rock m a t r i x ( s e e f o r example F ig . 6 .15) . One exp lana t ion f o r t h e ob-
se rved behavior i s t h a t t h e ascending superhea ted steam i s encounter ing
l i q u i d s which o r i g i n a t e from condensa t ion o f steam i n the o u t l e t l i n e .
The observed behavior of t h e thermocouple a t t h e chimney e x i t ( T / c 110,
F i g . 2.10), which o f t e n showed temperatures h ighe r than s a t u r a t i o n f o r
p e r i o d s of t i m e du r ing the p roduc t ion , a l s o i n d i c a t e t h a t bo th l i q u i d s
and superhea ted steam are p r e s e n t a t the chimney e x i t . e s t i m a t e of h e a t l o s s e s i n t h e o u t l e t l i n e i n d i c a t e s t h a t about 6 lbm o f
steam are condensed p e r hour.
one h a l f of t h e l i q u i d s w i l l d r a i n t o t h e chimney and t h e o t h e r h a l f t o
t h e PCV.
t he chimney head and w a l l above t h e f l a s h f r o n t .
p r e d i c t i o n o f h e a t l o s s e s i n t h e o u t l e t l i n e i s be ing developed.
A pre l imina ry
Because of t h e p i p i n g arrangement about
Add i t iona l l i q u i d s m a y , a r i s e from condensat ion of steam on
An a n a l y t i c model f o r
The
- 98-

cond i t ions of t h e s t a m e x i t i n g t h e chimney can then be c a l c u l a t e d us-
i n g steam c o n d i t i o n s a t t h e PCV which i s eva lua t ed from a condenser h e a t
ba l ance .
Eva lua t ion o f the thermodynamic p a t h from observed f l a s h f r o n t pos-
i t i o n and system p r e s s u r e d a t a appears t o be u s e f u l i n o b t a i n i n g an
independent estimate of t h e e x t e r n a l h e a t t r a n s f e r parameter ,
t a i n e d by o t h e r means ear l ie r . Fu r the r work i s needed i n t h i s a r e a .
qm , ob-
7 . 2 Measurement Accuracy
During t h i s i n i t i a l phase of t e s t i n g wi th the chimney model con-
s i d e r a b l e exper ience w i t h t h e exper imenta l system has been gained wi th
r e s p e c t t o (1) des ign and c o n s t r u c t i o n of t h e system hardware, (2) in-
s t rumen ta t ion o f t h e system, (3 ) o p e r a t i o n o f t h e equipment, and ( 4 ) data
r educ t ion procedures . It i s important now t o take a c l o s e r look a t a r e a s
of exper imenta l u n c e r t a i n t y and determine where improvements can be made.
The chimney p r e s s u r e gage and the p r e s s u r e t r a n s m i t t e r were c a l i -
b ra t ed s imul taneous ly up t o 500 p s i g us ing a dead weight tes ter ( t e s t
range 0-500 p s i g ) and bo th devices were found t o be l i n e a r . Subsequently
t h e p r e s s u r e t r a n s m i t t e r was c a l i b r a t e d a g a i a s t t h e gage t o 800 p s i g and
a s l i g h t d e v i a t i o n from l i n e a r i t y i n t h e upper 10 pe rcen t of t h e s c a l e
was appa ren t . Which device was non- l inea r i s n o t known,but s i n c e opera-
t i o n normally s t a r t s below t h e non- l inea r range , no c o r r e c t i o n was
a t tempted . A comparison of d a t a from the two measl:r~~oir.nts i s s h o m i
P ig . 7 . 1 f o r Run 3 . The maximum discrepancy between the two measure-
ments i s about 10 p s i . T h e s a t u r a t i o n temperature corresponding t o t he
p r e s s u r e measured by t h e transmitter i s shown i n F ig . 7 . 2 ( s o l i d l i n e )
r e l a t i v e t o t h e tempera ture measured a t t h e chimney ex i t (T/c 110,
F ig . 2.10). The maximum d i f f e r e n c e between t h e two measurements was 3 ° F .
Checks o f t h i s type were made a t p e r i o d i c i n t e r v a l s dur ing t h e t e s t i n g
t o a s s u r e continuous c a l i b r a t i o n . No s i g n i f i c a n t dev ia t ion from the
o r i g i n a l c a l i b r a t i o n w a s no ted .
The thermocouples used f o r water and metal temperature measurements
were c a l i b r a t e d r e l a t i v e t o each o t h e r by tu rn ing the h e a t e r o f f and
l e t t i n g the c i r c u l a t i o n pump run.
t o one reading on t h e r e c o r d e r s which i n d i c a t e d t h a t temperature e q u i l i b-
rium was achieved and t h a t t h e r e l a t i v e e r r o r s between the thermocouples
were about 2 OF.
All thermocouple responses converged
- 99-

-7
C 0
a u u) W
.- t
.- L
a
- 0 13
z-! E cn
I I I I ! I I
P L
c c 0)
.- E
E I-
n
2
cn C
>
U
3 u) 0 Q,
E
E?
L 3 cn cn
a
0 0
&
O b a3 Ln TI- rr) cu O O 0 0 0 O O 0 0 0
0 a 0 - 0 0 0 0
- 100-

N N
3 N
03 -
co - h I c *, - E
- i = z 0 0 -
- I- O 3
w cu
a " 6 2 a co
d-
cu
0
- 101-
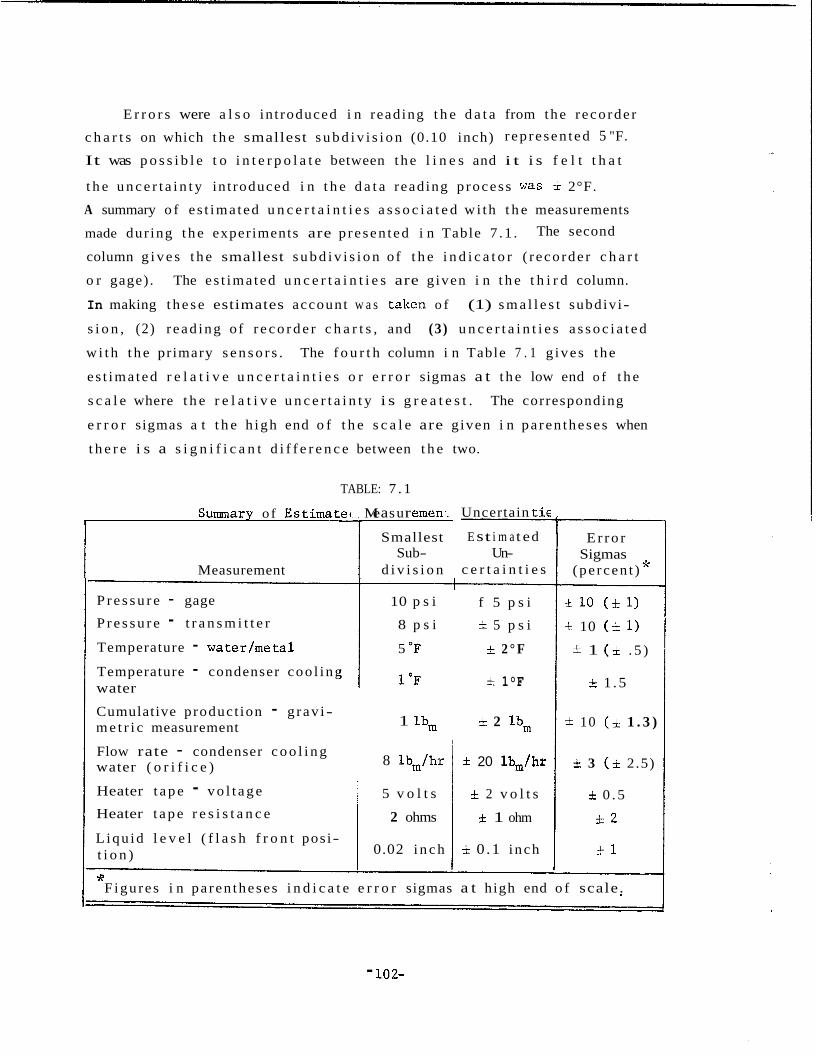
E r r o r s were a l s o in t roduced i n reading t h e d a t a from the r eco rde r
c h a r t s on which t h e smallest s u b d i v i s i o n (0.10 inch) r ep resen ted 5 "F.
It was p o s s i b l e t o i n t e r p o l a t e between t h e l i n e s and i t i s f e l t t h a t
t h e u n c e r t a i n t y in t roduced i n t h e d a t a reading p rocess was i 2°F.
A summary o f e s t ima ted u n c e r t a i n t i e s a s s o c i a t e d wi th t h e measurements
made dur ing t h e experiments are p resen ted i n Table 7 .1 .
column g i v e s t h e smallest s u b d i v i s i o n of t h e i n d i c a t o r ( r eco rde r c h a r t
o r gage) . The e s t ima ted u n c e r t a i n t i e s are g iven i n t h e t h i r d column.
In making t h e s e estimates account w a s t aken o f (1) s m a l l e s t subdiv i-
s i o n , (2) r ead ing of r e c o r d e r c h a r t s , and (3) u n c e r t a i n t i e s a s s o c i a t e d
w i t h t h e primary s e n s o r s . The f o u r t h column i n Table 7 . 1 g ives t he
e s t ima ted r e l a t i v e u n c e r t a i n t i e s o r e r r o r sigmas a t t h e low end o f t h e
s c a l e where t h e r e l a t i v e u n c e r t a i n t y i s g r e a t e s t . The corresponding
e r r o r sigmas a t t h e h igh end o f t h e s c a l e are g iven i n pa ren theses when
t h e r e i s a s i g n i f i c a n t d i f f e r e n c e between t h e two.
The second
TABLE: 7 . 1
Summary of E s t i m a t e (
Measurement
P r e s s u r e - gage
P r e s s u r e - t r a n s m i t t e r
Temperature - water/metal
Temperature - condenser coo l ing water
Cumulative product ion - grav i- m e t r i c measurement
Flow rate - condenser c o o l i n g water ( o r i f i c e )
Heater t a p e - v o l t a g e
Heater t a p e r e s i s t a n c e
L iqu id l e v e l ( f l a s h f r o n t pos i- t i o n ) 4.
Me a su r emen.
Smallest Sub-
d i v i s i o n
10 p s i
8 p s i
5 "F
1 lbm
8 lbm/hr
5 v o l t s
2 ohms
0.02 i n c h
Uncertain t i e
E s t i m a t e d Un-
c e r t a i n t i e s
f 5 p s i
i 5 p s i
f 2 ° F
f 1°F
& 2 lbm
rt 20 lb,/hr
f 2 v o l t s
f 1 ohm
i 0.1 inch
E r r o r Sigmas
(pe rcen t ) ''
i 10 (k 1)
-I: 10 ( * 1)
* 1 ( * . 5 )
f 1 .5
f 10 (i 1 . 3 )
i 3 (i 2.5)
f 0 . 5
i 2
fl
n
Figures i n pa ren theses i n d i c a t e e r r o r sigmas a t high end o f scale.
- 102-

It is apparent from Ta'ble 7.1 that relatively large error sigmas exist at the low end of the scale for the pressure measurements and the cumulative fluid production measurement.
measurement could easily be obtained by the installation of a l o w range
pressure gage which could be switched in at l o w pressure.
arrangement could be used for the fluid measurement where a low range scale could be used during the early period of the production cycle.
Improvements of the pressure
A similar
The uncertainty associated with the total external heat transfer in
comparison to the energy ex.traction from the rock is o f particular im-
portance in determining the usefulness of the present experimental sys-
tem. estimated error sigmas presented previously. The computation of the
total external heat transfer was based on Eq. (5.2) which can be re-
stated as follows:
Such a comparison is made in the foll.owing using numbers and the
where the are the integrals and multipliers of each term in Eq.
(5.2). The error sigma associated with I1 is o1 and stems mainly from the measurement o f the heater tape resistance (see Table 7.1). The error sigma associated with I2 is o2 and since the error as-
sociated with the temperature measurement is small it can be assumed
that the error is mainly associated with evaluation of the chimney mass
M2 (see Table 3 . 8 ) . Similarly, the error sigma in I3 is stems mainly from the error. in the heat loss conductance
error sigma for Qm is on-, and can be computed from the second-power equation (Kline and McClintock, 1953), which becomes with the present nota tion
1's
which
The O3
h2A2 .
After evaluation of the derivatives using Eq. (7.1) the expression for
Om can be simplified to give
(7.2b)
- 103-
= 1 0 . 0 7 , and CT = kO.037 Using o1 = i .02 (from Table 7.1), o2
(from Table 3 . 8 ) f o r t h e i n d i v i d u a l e r r o r sigmas and the numerical
d a t a f o r Qm and t h e 1 ' s i n Table 6 . 2 one f i n d s ' s of iO.102 and
i 8 4 . 3 f o r Runs 3 and 7 , r e s p e c t i v e l y . The es t ima ted u n c e r t a i n t i e s i n
Qm are g iven by om& which become -+ 11,300 Btu and 2~ 8,430 Btu, re-
s p e c t i v e l y .
3
'm
It i s u s e f u l t o compare the es t ima ted u n c e r t a i n t y i n Q t o the m energy e x t r a c t e d from t h e rock . For Run 7 t h e energy e x t r a c t e d from
t h e rock w a s e s t ima ted t o be 50,400 Btu.
i s about 1 7 p e r c e n t of t h e rock energy e x t r a c t i o n . Based on t h e pre-
v i o u s e v a l u a t i o n i t i s c l e a r t h a t one cannot a t t e m p t t o determine the
magnitude o f the energy e x t r a c t e d from two d i f f e r e n t rock types when
t h e expected d i f f e r e n c e i s l e s s than about 17 p e r c e n t u n l e s s represen-
t a t i v e rocks are ins t rumented. In t h a t c a s e the rock energy e x t r a c t i o n
e f f i c i e n c i e s can be computed d i r e c t l y from measurements and one need
n o t know Q a c c u r a t e l y .
Thus, t h e u n c e r t a i n t y i n Q,
m
- 104-

CHAPTER 8
CONCLUSIONS AND RECOMMENDATIONS
8 .1 Conclusions
1.
2.
3 .
4.
5.
6 .
Valuable exper ience has been ga ined i n t h e des ign , c o n s t r u c t i o n , and o p e r a t i o n o f a l a b o r a t o r y s i z e model of a s t imu la t ed geo-
thermal r e s e r v o i r a t p ro t o t y p i c a l temperature and p r e s s u r e con-
d i t i o n s .
Analys is of t h e exper imenta l d a t a ob ta ined t o d a t e shows t h a t
t h e behavior o f most a s p e c t s a s s o c i a t e d w i t h real s t imu la t ed
geothermal r e s e r v o i r s can be s t u d i e d us ing t h e p r e s e n t labora-
t o r y model.
Experimental d a t a f o r i n i t i a l p r e s s u r e and temperature condi-
t i o n s o f up t o 790 p s i a and 500°F, r e s p e c t i v e l y a p p l i c a b l e
most ly t o f r ac tu re (d dry h o t rock chimneys have been ob ta ined .
Corresponding t o t h e more g e n e r a l s t imu la t ed r e s e r v o i r condi-
t i o n s w i t h r echa rge , only l i m i t e d d a t a have been obta ined .
The w a l l e f f e c t o r h e a t t r a n s f e r from the v e s s e l t o t h e water/
rock system can be accounted f o r u s ing a combination o f c a l i b r a -
t i o n experiments and a n a l y s e s .
s u l t s i n h e a t t r a n s f e r away from t h e water/roclc system.
t i o n of energy t o t h e model by e l e c t r i c a l h e a t e r tapes can be
made t o e l i m i n a t e t h e w a l l e f f e c t .
The p r e s e n t experiments have demonstrated t h a t energy can be
e x t r a c t e d from h o t rock bq l e t t i n g t h e f l a s h f r o n t recede i n t o
t h e rock matrix.
conta ined i n t h e rocks between t h e temperature l i m i t s o f t h e s e
experiments w a s extracted dur ing t h e f l u i d product ion .
centage o f energy t h a t could be e x t r a c t e d from the rock matrix
depended t o some degree on the f l a s h f r o n t p o s i t i o n . e x t r a c t i o n s were achieved w i t h t h e f l a s h f r o n t a t t h e top of
t h e rock ma t r ix .
The f r a c t i o n of f l u i d s produced w a s roughly a f a c t o r o f two
h ighe r f o r t h e water / rock system than f o r t h e water system due
t o energy e x t r a c t i o n from t h e rock . Also, t h e f r a c t i o n o f
The w a l l e f f e c t g e n e r a l l y re-
Addi-
More t h a t 90 p e r c e n t of t h e thermal energy
The per-
Highes t
.. 105-
f l u i d s t h a t could be produced depended on t h e i n i t i a l p r e s s u r e
and tempera ture o f t h e system and on t h e system bulk p o r o s i t y .
The r e s u l t s of t h e experiments w i th t h e water / rock system sug-
g e s t t h a t approximately 35 percen t of t h e o r i g i n a l water i n a system can be produced when t h e p r e s s u r e i s reduced from about
600 t o 100 p s i a f o r similar cond i t ions of rock energy extrac-
t i o n .
7 . The experiments sugges t t h a t superhea ted steam i s p r e s e n t i n
t h e r e g i o n above t h e f l a s h f r o n t . The degree o f superhea t i s
g e n e r a l l y h i g h e s t a t some p o i n t between t h e f l a s h f r o n t and t h e
top of t h e rock matrix. Also, t h e experiments i n d i c a t e t h a t
l i q u i d s on t h e rock and metal s u r f a c e s c o e x i s t w i th superhea ted
steam i n t h e r eg ion above t h e f l a s h f r o n t .
8. I n t h e case o f no recharge the temperature of t he water below
t h e f l a s h f r o n t remains a t uniform tempera ture j u s t below t h a t
corresponding t o s a t u r a t i o n dur ing t h e e n t i r e product ion c y c l e .
When l i m i t e d recharge of coo l water i s used a t t h e lower end
of t h e chimney, t h e c o o l e r recharge water remains i n t he lower
s e c t i o n of t h e chimney below t h e h o t t e r water a t t h e f l a s h
f r o n t p o s i t i o n .
r e s u l t . Recharge of l a r g e r q u a n t i t i e s may a l t e r t h i s
9 . The p r e s e n t l a b o r a t o r y model does n o t inc lude: ( a ) r e a l i s t i c
s imu la t ions o f recharge mechanism from t h e surrounding a q u i f e r
and (b) r ea l i s t i c s imula t ion o f t h e two-phase phenomenon i n
t h e wel l -bore . A d d i t i o n a l l y , t es t s invo lv ing h igh ly concen-
t r a t e d b r i n e s and l i q u i d s con ta in ing sand p a r t i c l e s cannot be
run us ing t h e p r e s e n t model.
s p e c i f i c a l l y f o r such tests i s r e q u i r e d . Another l a b o r a t o r y model designed
8 . 2 Recommendations
8 . 2 . 1 Hardware
The expe r i ence ga ined w i t h .the chimney model system dur ing the i n i -
Many o f t i a l phase has h i g h l i g h t e d some areas o f hardware improvements.
t h e s e areas have a l r e a d y been coirrected o r c o r r e c t i v e a c t i o n i s i n pro-
g r e s s .
- i06-

D i f f i c u l t i e s have been exper ienced w i t h t h e l a r g e diameter O-ring
used f o r s e a l i n g o f t h e quick-opening head.
ter r e a d i n g O-ring (Vi ton) has been a c q u i r e d which p e r f o m s w e l l a t s l i g h t l y d e r a t e d maximum c o n d i t i o n s (- 485 "F i n s t e a d o f 500'F and
p s i g i n s t e a d o f 800 p s i g ) .
q u i r e f u r t h e r d e r a t i n g o r c o r r e c t i v e a c t i o n , a p l a n f o r r e p l a c i n g the
quick-opening head i s be ing formulated.
However, a new h igh durome-
- 650
I f a d d i t i o n a l problems wi th t h e O- ring re-
Major problems were exper ienced w i t h t h e c i r c u l a t i o n pump seal
a f t e r 200-300 hours o f o p e r a t i o n .
e r a b l e p e r i o d s o f down-time. New seals have been r e c e i v e d . Adequate
maintenance o f t h e seal i s expected t o r e s u l t i n reduced down-time i n
t h e f u t u r e .
Th i s i t e m was r e s p o n s i b l e f o r consid-
The need €or g r a v i m e t r i c measurements o f t h e q u a n t i t y o f water i n -
It i s t h e r e f o r e j e c t e d became a p p a r e n t d u r i n g t h e i n i t i a l t e s t s e r i e s .
recommended t h a t a l a r g e head t ank w i t h s i g h t g l a s s be i n s t a l l e d f o r
d i r e c t o b s e r v a t i o n o f amount o f f l u i d s recharged. The cumulat ive f l u i d s
i n j e c t e d w i l l be computed from t h e head t ank water l e v e l .
D i f f i c u l t i e s were exper ienced w i t h c o n t r o l o f t h e i n j e c t i o n pump
flow rate.
10 p e r c e n t o f t h e scale has been r e q u i r e d .
pump v a l v e s makes t h e pump flow ra te s e n s i t i v e t o t h e magnitude o f t h e
back p r e s s u r e (chimney p r e s s u r e ) .
on t h e i n j e c t i o n o r recharge pump i s recommended t o improve c o n t r o l over
t h e recharge rate.
The problem stems from t h e f a c t t h a t o p e r a t i o n i n t h e lower
I n t h i s range i n e r t i a of t h e
The i n s t a l l a t i o n of a by-pass l i n e
The p r e s e n t c i r c u l a t i o n h e a t e r c o n t r o l arrangement us ing a n o n / o f f
the rmos ta t performs w e l l f o r heatup purposes b u t i s inadequate when t h e
c i r c u l a t i o n h e a t e r i s used f o r p r e h e a t i n g t h e recharge water. It i s
t h e r e f o r e recommended t h a t a cont inuous power c o n t r o l system be i n s t a l l e d .
It i s a n t i c i p a t e d t h a t t h e c o n t r o l system under c o n s i d e r a t i o n w i l l a l l o w
recharge f l u i d temperature/ t ime c h a r a c t e r i s t i c s o f l i n e a r l y i n c r e a s i n g ,
l i n e a r l y d e c r e a s i n g , and c o n s t a n t r echarge wate r temperature .
The condenser performed s a t i s f a c t o r i l y w i t h t h e steam f low rates o f
t h e s e exper iments (- 10 l b m / h r ) .
steam produc t ion ra tes , however, a c o o l i n g water flow ra te of 2 gpm i s inadequa te . The c o o l i n g water flow rate can be inc reased t o a t l e a s t
A t much h i g h e r p r e s s u r e d e p l e t i o n and
- 107-

5 gpm by i n c r e a s i n g t h e o r i f i c e s i z e . F u r t h e r e v a l u a t i o n i s recommended
t o determine if a condenser w i t h h i g h e r r a t i n g needs t o be a c q u i r e d .
The need f o r an a c c u r a t e low range p r e s s u r e gage and a n a c c u r a t e
low range s c a l e f o r cumulat ive p r o d u c t i o n measurement h a s become appar-
e n t . To improve measurement a c c u r a c i e s towards t h e l o w end o f t h e s c a l e ,
i t i s recommended t h a t s e p a r a t e low range s e n s o r s be i n s t a l l e d f o r t h e
chimney p r e s s u r e and f l u i d p r o d u c t i o n measurements.
I n s t a l l a t i o n o f more t a p e h e a t e r c a p a c i t y i s r e q u i r e d . I t i s recom-
mended t h a t m o i s t u r e r e s i s t a n t t a p e s f o r h i g h t empera tu re s e r v i c e be
a c q u i r e d .
I n g e n e r a l i t i s cons idered t h a t t h e sys tem performed w e l l and i t is
b e l i e v e d t h a t a m a j o r i t y o f the o r i g i n a l l y planned tests f o r which t h e
sys tem was designed can be made w i t h t h e p r e s e n t system. There a r e ,
however, c e r t a i n k inds o f problems t h a t cannot b e s t u d i e d us ing t h e
p r e s e n t system and t h e s e are: (1) s c a l i n g and c o r r o s i o n problems asso-
c i a t e d w i t h h i g h l y c o n c e n t r a t e d b r i n e s , (2) performance o f rock loads
c o n t a i n i n g sand such as f r i a b l e sands tone , (3) two-phase flow i n t h e
we l l- bore , and ( 4 ) i n t e r a c t i o n between sur rounding a q u i f e r , rock chim-
ney and d e l i v e r y system (wel l- bore) which w i l l c o n t r o l t h e chimney
f l a s h f r o n t p o s i t i o n .
problems can be s t u d i e d has been i n i t i a t e d . It i s e s t i m a t e d t h a t t h i s
sys tem would c o s t $150,000 and t h e new system cou ld be o p e r a t i o n a l 24
months a f t e r s t a r t o f f i n a l des ign phase .
e f f o r t s on such a system b e i n t e n s i f i e d and c o n s t r u c t i o n i n i t i a t e d as
soon as p o s s i b l e .
Conceptual d e s i g n o f a new system i n which t h e s e
It i s recommended t h a t d e s i g n
Due t o t h e many problems exper ienced w i t h t h e qu ick opening head
and t h e mechanical seal i n t h e c i r c u l a t i o n pump i t i s recommended t h a t
f u t u r e sys t e m s n o t i n c l u d e t h e s e d e s i g n f e a t u r e s .
I n ins t rument ing f u t u r e rock l o a d s e f f o r t s shou ld be made t o in-
c l u d e i n s t r u m e n t a t i o n f o r c l o s e r s t u d y o f t h e phenomenon o f water coex-
i s t i n g w i t h superhea ted steam i n t h e r e g i o n above t h e f l a s h f r o n t .
Work on t h e mathemat ical model f o r t h e f l u i d p r o d u c t i o n / p r e s s u r e
d e p l e t i o n p r o c e s s should be a c c e l e r a t e d . A g e n e r a l mathemat ical model
f o r p a r a m e t r i c s t u d y o f t h e t r a n s i e n t behav ior o f i n d i v i d u a l rocks lo-
cated i n t y p i c a l geothermal r e s e r v o i r environments should be developed.
- 108-

8 . 2 . 2 Test P r i o r i t i e s The w r i t i n g o f t h i s r e p o r t has b rought i n t o focus areas of t e s t i n g
which should be g iven p r i o r i t i e s i n t h e n e a r term t e s t schedu le .
g e n e r a l , i t i s f e l t t h a t advantage shou ld be t aken o f t h e t e s t s e t u p and
rock load ing as i t e x i s t e d dur ing t h e most r e c e n t tes t p e r i o d . Addi-
t i o n a l equipment i n s t a l l a t i o n i s i n p r o g r e s s which w i l l make t h e sys tem
more f l e x i b l e so t h a t d i f f e r e n t types o f t es t s can be performed. I n t h e
f u t u r e e f f o r t s shou ld be made t o m a i n t a i n t h e s p e c i f i c e x t e r n a l h e a t
t r a n s f e r pa ramete r ,
r u n s , as t h i s w i l l make d a t a i n t e r p r e t a t i o n s and comparisons e a s i e r .
More emphasis shou ld be p u t on the complet ion o f data r e d u c t i o n computer
programs. Programming e f f o r t s on t h e mathemat ical model f o r t h e f l u i d
p r o d u c t i o n l p r e s s u r e d e p l e t i o n p r o c e s s should be a c c e l e r a t e d .
I n
\ , e q u a l o r s l i g h t l y g r e a t e r t h a n ze ro f o r a l l
Near term
t e s t o b j e c t i v e s w i t h t h e chimney model system should i n c l u d e t h e follow-
ing:
1. I n j e c t i o n o r recharge o f c o o l and h o t water whi le i n j e c t i o n
rate i s main ta ined r e l a t i v e t o t h e f l u i d p roduc t ion ra te t o
ach ieve a n approximateiy s t a t i o n a r y f l a s h f r o n t p o s i t i o n .
During t h e tests w i t h h o t water i n j e c t i o n e f f o r t s w i l l be d i-
r e c t e d towards m a i n t a i n i n g c o n s t a n t and l i n e a r l y decreas ing
i n j e c t i o n water temperature .
The f l u i d p r o d u c t i o n rate and cor responding p r e s s u r e d e p l e t i o n
h i s t o r y w i l l be v a r i e d o v e r a g r e a t e r range than p r e v i o u s l y .
It i s b e l i e v e d t h a t t h e re la t ive magnitudes o f p r e s s u r e dep le-
t i o n rate and s i z e o f t h e rock w i l l a f f e c t t h e ene;gy e x t r a c-
t i o n from t h e rock .
2 .
3 . C y c l i c r e c h a r g e l f l u i d p roduc t ion w i l l be a t t empted . During
t h e s e tests h o t water a t c o n s t a n t temperature w i l l be i n j e c t e d
con t inuous ly .
f l a s h f r o n t r ecedes i n t o t h e rock m a t r i x and when a c e r t a i n
level has been reached f l u i d p roduc t ion i s s topped. The chim- ney i s then recharged w i t h h o t water which i n c r e a s e s p r e s s u r e /
temperature i n t h e system.
The f l u i d p roduc t ion i s a d j u s t e d such t h a t t h e
The c y c l e i s then r e p e a t e d .
- 109-

The a n a l y t i c modeling of t he p h y s i c a l p roces se s involved r e q u i r e s
s p e c i f i c t e s t d a t a f o r model v e r i f i c a t i o n . It i s expec ted t h a t t h e da t a
ob t a ined t o d a t e t o g e t h e r w i t h t h e d a t a expected i n t he n e a r f u t u r e may
s a t i s f y t h i s requirement . Howe
major importance which needs t o
t h e rock m a t r i x bu lk p o r o s i t y .
l oads should be made such t h a t
d e r t o f u r t h e r i n v e s t i g a t e rock
er , t h e r e i s one parameter t h a t i s or'
be v a r i e d over a g r e a t e r range , namely
The re fo re , t h e s e l e c t i o n of f u t u r e rock
owex p o r o s i t i e s can be ach ieved . I n or-
enzrgy e x t r a c t i o n a f u t u r e rock load
should have much l a r g e r s i z e rocks . I n i n s t rumen t ing f u t u r e rock loads
emphasis should be p l aced on i n v e s t i g a t i n g t h e temperature d i s t r i b u t i o n
and l i q u i d hangup phenomenon i n t he reg ion above the f l a s h f r o n t .
- 110-

APPENDIX A
DERIVATIONS FOR TWO-MASS LUMPED PARAMETER TRANSIENT MODEL
The b a s i s f o r t h e s e l e c t i o n o f t h e two-mass lumped parameter t r a n-
s i e n t model shown on t h e upper p o r t i o n o f F i g . 3 . 1 w a s d i scussed i n
Chapter 3.
model are summarized below:
The assumptions and i d e a l i z a t i o n s i n h e r e n t i n t h e two-mass
1.
2 . A l l metal and i n s u l a t i o n undergoing temperature changes a r e
A l l water and t h e rock are a t uniform o r mean tempera tu re , T l .
a t mean t empera tu re , T 2 . 3 . The tempera tu re o f t h e surrounding i s c o n s t a n t a t T m
4. E l e c t r i c power i s supp l ied as r e c t a n g u l a r p u l s e s .
5 . S p e c i f i c h e a t s o f t h e rock , water and chimney metal are
c o n s t a n t . 6 . The h e a t t r a n s f e r conductances are c o n s t a n t .
The e l ec t r i ca l ana log o f t h i s system i s shown on t h e lower p o r t i o n
of F i g . 3 .1 . The power s o u r c e s , S1 and S2 , a r e a p p l i e d as r e c t a n g u l a r
p u l s e s by use o f t h e u n i t s t e p f u n c t i o n
= O f o r t < r
= l f o r t > T
u ( t - 7 )
Thus, a c o n s t a n t power supp ly of SL a p p l i e d between t i m e s t = 711
and t = T~~ would appear as
D e r i v a t i o n o f Equa t ions
The rate o f c r e a t i o n of energy s t a t e m e n t i s i n g e n e r a l form
(A. 2) a a t ROC E = 0 = (ou t ) - ( i n ) + - ( s t o r a g e ) .
Applying t h i s p r i n c i p l e t o each lumped mass t h e r e r e s u l t s t h e two
equa t ions :
-111-
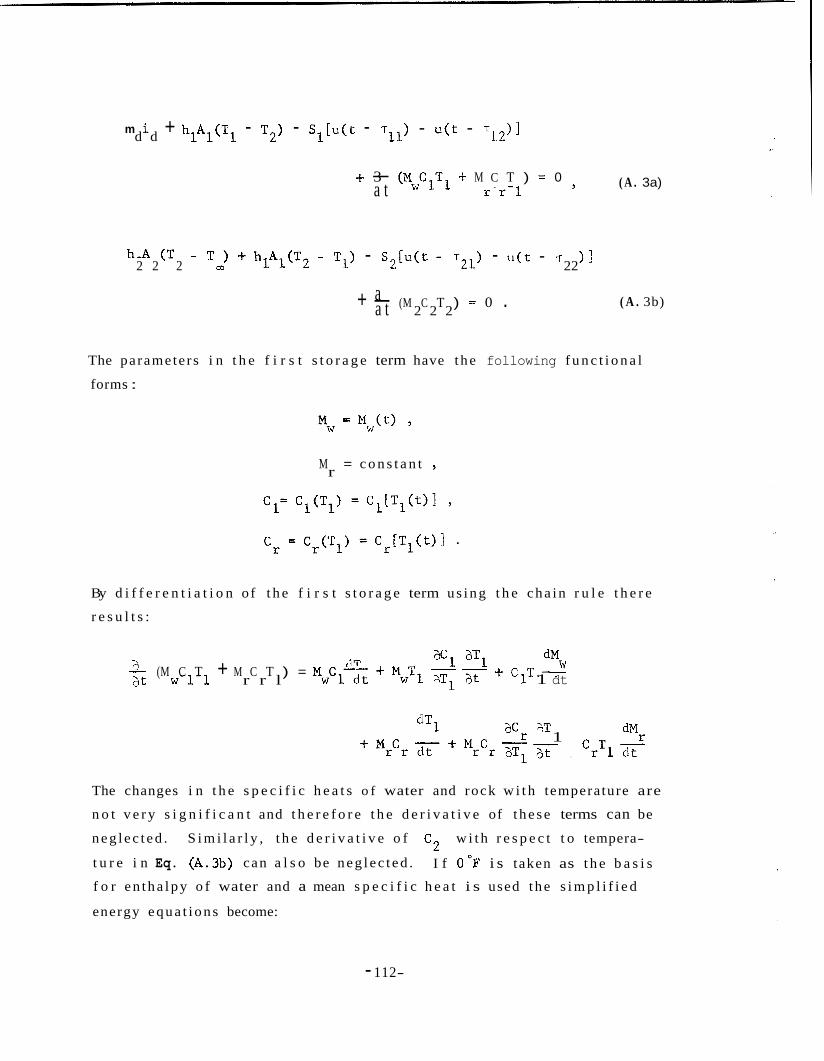
m i + hlA1(Tl - T2) - S,[u(t - Til) - u ( t - T12)1 d d
( A . 3a) f - 3 (MwCIT1 + M C T ) = 0 a t r r l
h A (T - T ) + hlA1(T2 - TI) - S 2 [ U ( t - T21) - u ( t - 7 ) ] 2 2 2 m 22
( A . 3b) a a t 2 2 2 + - (M C T ) = 0 .
The paramete rs i n t h e f i r s t s t o r a g e term have t h e following f u n c t i o n a l
forms :
M = c o n s t a n t r
By d i f f e r e n t i a t i o n o f t h e f i r s t s t o r a g e term u s i n g t h e c h a i n r u l e t h e r e
r e s u l t s :
d'w ;3Cl aT1 dTl t C T - 1 1 dt (M C T + M C T ) = M w C l x -t MwT1 q ;3t a t w l l r r l
1 d'r at + CrTL dt dTl a C r '1T
+ MrCr dt ' Mrcr
The changes i n t h e s p e c i f i c h e a t s o f water and rock w i t h temperature are
n o t v e r y s i g n i f i c a n t and t h e r e f o r e t h e d e r i v a t i v e of t h e s e terms can be
n e g l e c t e d . S i m i l a r l y , t h e d e r i v a t i v e o f C 2 w i t h r e s p e c t t o tempera-
t u r e i n Eq. (A.3b) can a l s o be n e g l e c t e d .
f o r e n t h a l p y o f water and a mean s p e c i f i c h e a t i s used t h e s i m p l i f i e d
energy e q u a t i o n s become:
I f O°F i s taken as t h e b a s i s
- 112-

dT2 4- h2A2(T2 - T ) + hlA1(T2 - T1) M2CZ dt m
= S 2 [ u ( t - T ~ ~ ) - u ( t - ) ] (A .4b) T2 2
Applying t h e mass conse rva t ion p r i n c i p l e t o the water conta ined i n the
system w e g e t i n g e n e r a l
a a t ROC M = 0 = (o;t) - ( i b ) + - ( s t o r a g e ) ,
o r , i n p a r t i c u l a r
mW lid +- = 0 .
d t
Thus
Using t h i s i n Eq. (A.4.a) t he two l a s t terms cance l each o t h e r . New tem-
p e r a t u r e v a r i a b l e s a r e de f ined by
O 1 - T 1 - T m , 4 e 2 = T 2 - T , A m
and c o e f f i c i e n t s a r e de f ined by
n_ h2A2 n hlAl
MICl M2C2 M2C2 , a - - , , a = - a -- 4 hlAl
- A '2 , s 2 = - . - D sl s1 = - M2C 2
-113-

A l s o , t h e d i f f e r e n t i a l o p e r a t o r D i s d e f i n e d by
The d i f f e r e n t i a l e q u a t i o n s t h e n become:
- (D -I- all el - ale2 = s ,Mt - T ~ ~ ) - u ( t - ~ ~ ~ 1 1
-a 0 + (D + a2 + a3) Q2 = S 2 [ u ( t - ‘rZ1) - u ( t - T ~ ~ ) ] .
(A. 7a)
- (A.7b)
2 1
These e q u a t i o n s are t o be s o l v e d w i t h t h e i n i t i a l c o n d i t i o n s
S o l u t i o n of T r a n s i e n t Problem
To s o l v e t h e above e q u a t i o n s a n a l y t i c a l l y f u r t h e r assumptions have
It i s 3 . and a t o be made w i t h r e s p e c t t o t h e q u a n t i t i e s al a2
assumed t h a t t h e s e are c o n s t a n t s over t h e t empera tu re range o f i n t e r e s t
The most s e v e r e v a r i a t i o n i n t h e s e q u a n t i t i e s d u r i n g a heatup t r a n s i e n t
i s a s s o c i a t e d w i t h t h e q u a n t i t y a3 h2A2/M2C2 . Here t h e e f f e c t i v e
h e a t t r a n s f e r c o e f f i c i e n t h2
roundings may vary s i g n i f i c a n t l y o v e r t h e t empera tu res exper ienced dur-
i n g heatup o r cooldown t r a n s i e n t s p a r t i c u l a r l y due t o t h e r a d i a t i o n
c o n t r i b u t i o n . However, t h e convec t ion c o n t r i b u t i o n may a l s o change
s i g n i f i c a n t l y due t o changes i n t h e su r roundings such as t u r n i n g on t h e
a i r - c o n d i t i o n i n g system, opening windows and d o o r s , e t c . In t h e evalua-
t i o n of t h e s o l u t i o n , t h e r e f o r e , s u i t a b l e mean v a l u e s o f h have t o b e
used.
a s s o c i a t e d w i t h h e a t l o s s e s t o t h e su r -
2
With t h e s e a d d i t i o n a l assumptions t h e problem can be so lved a n a l y t -
i c a l l y by employing Laplace t ransforms t o t h e e q u a t i o n s . Taking t h e
Laplace t r ans form of Eq. (A.7a) and (A.7b), u s i n g (A.8) t h e r e r e s u l t s :
h h s1 -712 sl -T1l e ( s + all el - a182 - - + - e Y ..- S
- 114-

s2 - 7 2 1 s2 - 7 2 2 e - - - a2g1 i- ( s + a 2 i- a3) 8, = e20 + y e S
The c h a r a c t e r i s t i c e q u a t i o n i s given by
2 1 - s+a
s + (a,+ a + a3>s + a l a 3 2 A =
-a2 s+a +a 2 3
ml and m are t h e r o o t s o f Eq. ( A . 9 ) given by 2 whe r e
The s o l u t i o n s g1 and 8, i n Laplace space becomes - -
(s + a + a3> 2 e -I Q, = :[(elo + e S
- -
E!
SI -“I2) a2] . ( A , l l b )
S - -
SI
I n o r d e r t o i n v e r t from Laplace space t o r ea l t i m e space i t i s necessa ry
t o s p l i t t h e s e f r a c t i o n s i n t o p a r t i a l f r a c t i o n s and then i n v e r t each
term. The a l g e b r a involved i s l eng thy and i s n o t p r e s e n t e d h e r e . The
f i n a l s o l u t i o n s appear as fo l lows :
m l t m2t - 5 2
= Cl l e
- 115-

mlt m2t - C22e O2 = C21 e
(i = 1, 2 , j = 1 . . 6 ) are g iven by t h e fo l lowing ‘ij The q u a n t i t i e s
expres s ions :
QIO(ml+ a2+ a3) + 8 20 a 1 - - ml - m2 ‘11 ,
8 ( m + a + a ) + e a = 1 0 2 2 3 20 1
ml - m2 5 2 I
- S (m + a2+ a3) - 1 1 -
‘13 (ml - m2) ml ’ - S ( m + a + a ) 1 2 2 3 (ml - m2) m2 ’
- - ‘14
(A. 1 3 4
(A. 13b)
(A. 13c)
( A . 13d)
- 116-

- S a 2 1
=: ‘15 (ml- m2) ml ’
- S a
‘16 (ml- m2) m2 ’ 2 1 =
0 (m + al) +
ml - m2 ‘21 - Y
20 1
8 (m + al) + 8 a - 20 2 10 2 ‘22 - m1- m,
Y
( A . 13e)
( A . 13h) L L
- S2(m1+ a 2 ) I (A . 1 3 i ) ‘23 (ml- m2)ml ’
- S a - 1 2 -
‘25 (ml- m2)ml ’ - S a 1 2
‘26 = (ml- m2)m2 ’
(A. 1 3 j )
(A. 131~)
( A . 131)
S p e c i a l i z a t i o n s o f t h e g e n e r a l s o l u t i o n given by E q s . (A.12a) and (A.12b)
are r e a d i l y made, e . g . t h e s p e c i a l c a s e o f a heatup t r a n s i e n t from room
tempera tu re becomes f o r
= o , I
%o - 820
t h e r e f o r e
Also ,
12 ’ and 7 ar !1 ’ 722
7 = o , 11
v e r y l a r g e .
Thus t h e s o l u t i o n f o r el and O2 f o r a s imple heatuip t r a n s i e n t
a r e
-117-

I m l t - 1 ) - c2& m z t - 1 ) . '2 a ' 2 5 k
( A . 14a)
( A . 14b )
Another s p e c i a l c a s e is t h e cooldown t r a n s i e n t from g iven i n i t i a l condi-
t i o n s , and . I n t h i s c a s e w e have no power sourccs ,so - '10 '11 are a l l l a r g e and t h e s o l u t i o n s are: l-2 2 7 and l-12 ' 2 1 '
m1 t m q t ( A . 15a) 1
11 e - 5 2 e ' e = c 1
m 1 t m2t - c 2 2 e 2 = c e 2 1 ( A . L5b)
Some examples o f t h e use o f E q s . (A.14a) and (A.14b) were g iven pre-
v i o u s l y (Kruger and Ramey, 1974). It was also p o i n t e d o u t t h a t t o p re-
d i c t t h e t r a n s i e n t s a p p r o p r i a t e mean v a l u e s of t h e h e a t t r a n s f e r
conductances and system h e a t c a p a c i t a n c e s a r e r e q u i r e d . The i n i t i a l
exper iments w i t h t h e chimney model were d i r e c t e d a t o b t a i n i n g t h e s e
q u a n t i t i e s .
D e r i v a t i o n s f o r t h e One-Mass T r a n s i e n t Model
The r e s u l t s from t h e hea tup t r a n s i e n t exper iments showed t h a t t h e
s l o p e s o f t h e t empera tu re curves f o r t h e water and m e t a l were n e a r l y t h e
same throughout t h e t r a n s i e n t excep t dur ing t h e v e r y e a r l y s t a g e s or' t h e
hea tup t r a n s i e n t . A d d i t i o n a l l y , t h e t empera tu re d i f f e r e n c e between w a t e r
and metal were n o t g r e a t f o r t h e w a t e r l r o c k runs ( o r d e r o f 1OoF) whi le t h e
d i f f e r e n c e w a s somewhat l a r g e r f o r t h e water r u n s .
b e r e p r e s e n t e d by o n l y one lumped mass.
v e n i e n t when e v a l u a t i n g t h e system e f f e c t i v e m a s s and t h e der iva . t ions
are p r e s e n t e d i n t h e fo l lowing .
Thus t h e system might
T h i s r e p r e s e n t a t i o n i s con-
Adding E q s . ( A . 4 a ) and (A.4b) w i t h t h e unders tand ing t h a t S1 i s
con t inuous ly and S 2 i s " of f" and u s i n g t h e c o n t i n u i t y equa t ion t o
c a n c e l t h e l a s t two terms i n E q . ( A . & ) , t h e r e r e s u l t s
dT1 dT2 + h2A2(T2 - T,2) = S1 . (MWCl + MrCr) dt + M2C2 dt
-118-
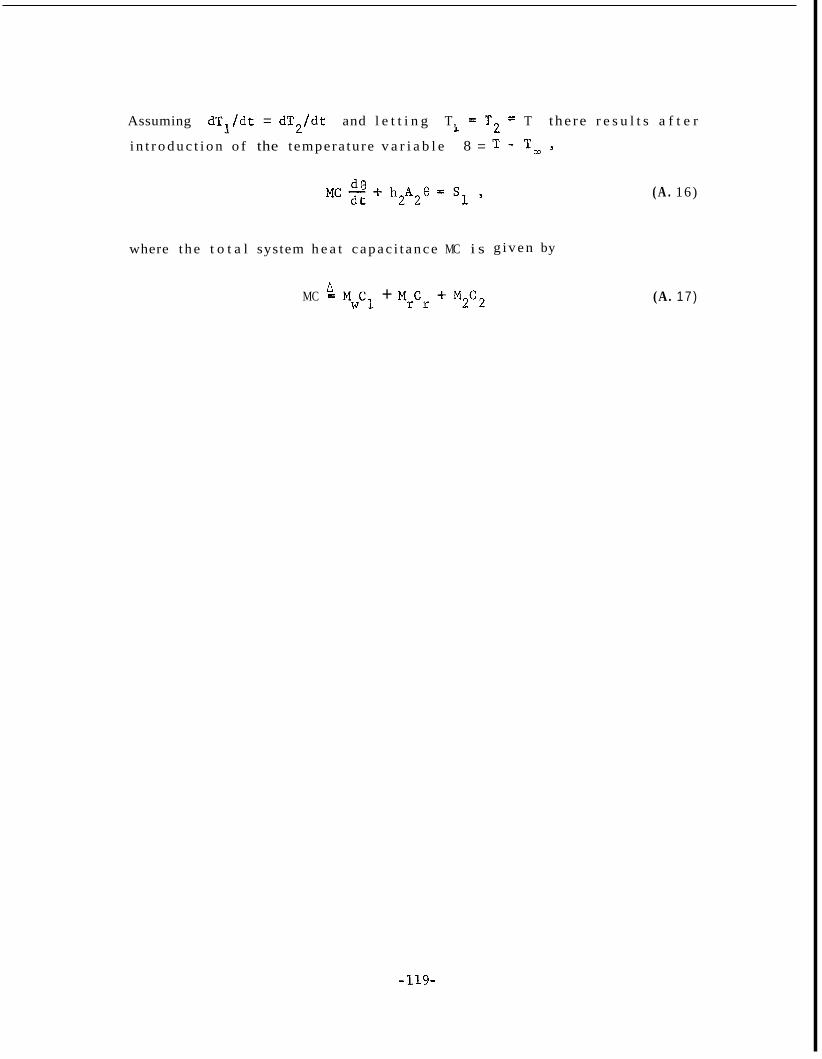
J. L L
i n t r o d u c t i o n o f the tempera tu re v a r i a b l e 8 =
Assuming d T , / d t = dT,/dt and l e t t i n g T, = T 2 T t he re r e s u l t s a f t e r
where t h e t o t a l system h e a t c a p a c i t a n c e MC i s
MC a, MwC1 + MrCr + M2C2
-119-
g i v e n by
( A . 16)
(A. 17)


APPENDIX B
DERIVATIONS FOR DATA REDUCTION PROCEDURES
D e r i v a t i o n s f o r S p e c i f i c E x t e r n a l Energy T r a n s f e r Parameter
Consider t h e a n n u l a r c o n t r o l volume e n c l o s i n g t h e s t ee l chimney
w i t h connect ing i n l e t and o u t l e t l i n e s and i n s u l a t i o n . Thi.s c o n t r o l
volume by d e f i n i t i o n exc ludes t h e wa te r / rock system con ta ined i n s i d e
t h e chimney and i n t h e i n l e t / o u t l e t p i p i n g .
mine t h e n e t energy t r a n s f e r from t h e chimney w a l l t o t h e wa te r / rock
system ( “ w a l l e f f e c t ” ) . There are f o u r energy terms involved:
It i s o f i n t e r e s t t o d e t e r -
1. Heat l o s s e s from t h e chimney of magnitude h2A202 (Btu) .
2 . Energy s t o r a g e i n t h e chimney metal o f magnitude M C 6 (Btu) . 2 2 2 3 . N e t ra te o f energy t r a n s f e r from t h e chimney system t o t h e
w a t e r / r o c k system denoted by Qm (Btu /h r ) .
4. E l e c t r i c a l energy supply by t h e t a p e h e a t e r s on t h e chimney
o u t s i d e s u r f a c e denoted by S 2 ( B t u / h r ) .
An energy ba lance on t h e chimney c o n t r o l volume y i e l d s t h e
e q u a t i o n
& ( M C O ) + h A E 2 2 2 + Q m = S 2 . a t 2 2 2
A mean v a l u e o f Q between d i s t i n c t times tl and t2 can be m o b t a i n e d when t h e mean v a l u e s o f 62 , C 2 and S 2 i n t h i s t i m e i n t e r -
v a l are a v a i l a b l e . So lv ing Eq. ( B . l ) f o r y i e l d s
The t o t a l n e t energy t r a n s f e r from t h e chimney t o t h e water:/rock system
can be computed by i n t e g r a t i n g Eq. ( B . l ) ,
- 120-

D e r i v a t i o n s f o r Condenser Heat Balance
A diagram of t h e condenser showing l o c a t i o n s o f thermocouples arid
t h e n o t a t i o n t o be used i n t h e fo l lowing d e r i v a t i o n i s shown i n F i g .
B . l . The condenser and t h e s h o r t p i p i n g s e c t i o n s c a r r y i n g h o t f l u i d s
are w e l l i n s u l a t e d . T h e r e f o r e , i t i s assumed t h a t t h e heat losses a re
n e g l i g i b l e . The energy ba lance based on E q . ( A . 2 ) then becomes, neg-
l e c t i n g t h e rate o f change o f s t o r a g e because o f t h e smal l mass invo lved ,
- i ) = m ( i - i > * p H , i n H,out r;l (i c C,ou t C , i n
It i s conven ien t t o use t h e t empera tu re measurements on t h e c o o l s i d e
and u s i n g t h e mean s p e c i f i c h e a t f o r water i n t h e temperature range or'
i n t e r e s t t h e r e r e s u l t s
- ) = m (i - i 1 . mcCp(TC , o u t - TC , i n p H, in H,out
A l l q u a n t i t i e s h e r e are known from measurements excep t i which i s H, in t h e chimney e x i t e n t h a l p y . Thus,
m ?.- ...
i = i = i + 4 C (T - T ) . e H , i n H,out m p C,ou t C , i n P
D e r i v a t i o n s f o r Chimney F l a s h F r o n t Loca t ion
The s i g h t g l a s s i n s t a l l e d on t h e chimney f o r f l a s h f r o n t l o c a t i o n
o b s e r v a t i o n i s n o t as w e l l i n s u l a t e d as t h e chimney i t s e l f and conse-
q u e n t l y t h e temperature o f t h e water i n t h e s i g h t g l a s s tends t o remain
lower than i n t h e chimney.
c e s s a r i l y t h e t r u e f l a s h f r o n t p o s i t i o n due t o t h e d e n s i t y d i f f e r e n c e of
t h e two water columns. A d e n s i t y c o r r e c t i o n t o t h e observed measurement
i s d e r i v e d u s i n g t h e n o t a t i o n shown on F ig . B.2. A t p o i n t (1) t h e p r e s -
Sure due t o t h e t w o water columns i s e q u a l and t h e r e f o r e
Thus, t h e observed l i q u i d l e v e l is n o t ne-
H - R ' = - H - R L V VSG
Solv ing t h i s r e l a t i o n s h i p f o r t h e c o r r e c t e d l e v e l
dimens i o n l e ss f o m
R , t h e r e r e s u l t s i n
-121-

2 I I I l
w ci z 0 0
I \ \ \ \ \ \
I I
I c c 3 0 I
\ I I I I I I
I
rl a P
$4 0
W
4 0 k U
- 122-

i
E
FLASH FRONT /
/
"L
INDICATED FLASH FRONT
SIGHT GLASS
. FLOW 0 I STRlBUTl ON BAFFLE
Figure B.2 Diagram o f chimney and s i g h t g lass showing nomenc la tu re f o r l eve l d e n s i t y c o r r e c t i o n
- 123-

V R h - -
SG
D e r i v a t i o n s f o r VoidISteam Q u a l i t y R e l a t i o n s h i p
A diagram of t h e chimney and connec t ing i n l e t / o u t l e t p i p i n g i s
shown on F i g . B . 3 . The n o t a t i o n used f o r t h e v a r i o u s volumes c o n t a i n e d
between t h e i s o l a t i o n v a l u e s are a l s o i n d i c a t e d on t h e diag,ram. The
t o t a l volume c o n t a i n i n g e i t h e r steam o r l i q u i d i s g iven by
V E V d + V t V,y+ vi = v + V f . sc g
The volume of t h e space occupied by steam only i s
Using t h e s e i n the d e f i n i t i o n of t h e v o i d f r a c t i o n ( E q . (5 .8) ) t h e r e
r e s u l t s
CJ = (Vd + vsc + Vcyz) /V R .
A v o i d / q u a l i t y r e l a t i o n s h i p can now be d e r i v e d .
p r e s e n t i n the chimney i n terms o f
The mass of l i q u i d s
Vf and t h e s p e c i f i c volume i s
Mf = Vf/vL .
Use t h i s e x p r e s s i o n i n t h e d e f i n i t i o n o f steam q u a l i t y ( E q .
which y i e l d s (5 .7 ) )
o r
V f (1 - X) vLMW .
- 124-

h
INLET I S 0 L AT10 N VALVE
c c
+ L I Q U I D
+ L I Q U I D
TRUE FLASH FRONT POSITION
f.-
Figure B . 3 Diagram of chimney and inletloutlet piping showing nomenclature used f o r level analysis
- 125-

S u b s t i t u t e t h i s i n t o t h e d e f i n i t i o n of t h e vo id f r a c t i o n (E5q. (5 .8) )
and g e t
Div id ing through by t h e i n i t i a l mass of water i n the system, (MW), , and r e d e f i n i n g v a r i a b l e s , the v o i d / q u a l i t y r e l a t i o n s h i p i s obtained:
(1 - x) < . L a , = 1 - - V
V 0
An exp re s s ion f o r t h e
F i g . B . 3 .
expressed as
j / h r a t i o can be de r ived us ing the n o t a t i o n o f
The t o t a l amount of water (steam and l i q u i d phases) can be
where the vG's
v a r i o u s steam spaces and t h e v ' s have a s i m i l a r meaning f o r t h e
l i q u i d spaces. One can s o l v e t h i s r e l a t i o n s h i p f o r the ,4/h r a t i o
which y i e l d s a f t e r i n t roduc ing t h e m a s s f r a c t i o n
are t h e mean s p e c i f i c volumes f o r t h e ste#am i n the
L
* Mw '
A s i m p l i f i c a t i o n of t h i s e x p r e s s i o n can be made i f i t i s assumed t h a t
t he steam i n all steam spaces i s s a t u r a t e d and a l l l i q u i d i s s a t u r a t e d .
The p rev ious exp re s s ion then becomes
(B. 11) It i s recognized t h a t e r r o r s may be in t roduced by t h i s approach s i n c e
t h e r e i s cons ide rab l e amount of mo i s tu r e due t o condensat ion i n the out-
l e t l i n e .
- 126-

REFERENCES
Atkinson, Charles H. and Ward, Don C. "Project Gasbuggey: Status Report," J. Petrol. Technol., 19:1319-1324, October 1967.
Goldsmith, Alexander, Waterman, Thomas E., and Hirschhorn, Harry J. Handbook o f Thermophysical Properties of Solid Materials, Vol . 2. The Macmillan Company, 1961.
Griffiths,J. C. Scientific Method in Analysis of Sediments. McGraw- Hill Book Co., 1967.
Kline, S. J. and McClintock, F. A . "The Description o f Uncertainties in Single Sample Experiments," Mechanical Engineering:, 75, 1953, p . 3.
Kreith, F. Principles of Heat Transfer, 2nd ed. International Text- book Co. , 1965.
Kruger, Paul and Otte, Carel (eds.). Geothermal Energy, Resources, Production, Stimulation. Stanford University Press, 1973.
Kruger, P., and Ramey, H. J. Stimulation of Geothermal Aquifers, Progress Report No, 1. Advanced Technology Dept., RA", National Science Foundation, Grant No. GI-34925, March 1973.
Kruger, P., and Ramey, H. J. Stimulation and Reservoir Engineering of Geothermal Resources, SGP-TR-1. Advanced Technology Dept., MNN, National Science Foundation, Gront No. GI-34925, June 1974.
Krumbein, W. C. "Measurement and Geological Significance of Shape and Roundness o f Sedimentary Particles," J . Sediment Petrol., 11:64-72, 1941.
Pittijohn, F. J. Sedimentary Rocks, 2nd ed. Harper and Bros . , 1951.
-127-