a omprehensive review of state adequacy … omprehensive review of state adequacy studies since 2003...
TRANSCRIPT
A Comprehensive Review of State
Adequacy Studies Since 2003
Prepared for
Maryland State Department of Education
By Anabel Aportela, Lawrence O. Picus and Allan Odden,
Picus Odden and Associates &
Mark Fermanich, APA Consulting
Submitted by APA Consulting
September 12, 2014
A Comprehensive Review of State Adequacy Studies Since 2003
ii
The Maryland General Assembly enacted Chapter 288, Acts of 2002 – the Bridge to Excellence in Public
Schools Act, which established new primary State education aid formulas based on adequacy cost studies
using the professional judgment and successful schools method and other education finance analyses
that were conducted in 2000 and 2001 under the purview of the Commission on Education Finance,
Equity and Excellence. State funding to implement the Bridge to Excellence Act was phased-in over six
years, reaching full implementation in fiscal 2008. Chapter 288 required a follow up study of the
adequacy of education funding in the State to be undertaken approximately 10 years after its enactment.
The study must include, at a minimum, adequacy cost studies that identify a base funding level for
students without special needs and per pupil weights for students with special needs to be applied to the
base funding level, and an analysis of the effects of concentrations of poverty on adequacy targets. The
adequacy cost study will be based on the Maryland College and Career-Ready Standards (MCCRS)
adopted by the State Board of Education and include two years of results from new State assessments
aligned with the standards, which are scheduled to be administered beginning in the 2014-2015 school
year.
There are several additional components mandated to be included in the study. These components
include evaluations of: the impact of school size, the Supplemental Grants program, the use of Free and
Reduced Price Meal eligibility as the proxy for identifying economic disadvantage, the federal Community
Eligibility Program in Maryland, prekindergarten services and funding, the current wealth calculation,
and the impact of increasing and decreasing enrollments on local school systems. The study must also
include an update of the Maryland Geographic Cost of Education Index.
Augenblick, Palaich and Associates, in partnership with Picus Odden and Associates and the Maryland
Equity Project at the University of Maryland, will submit a final report to the state no later than October
31, 2016.
This report, required under Section 3.2.1.10 of the Request for Proposals (R00R4402342) reviews 39
adequacy studies conducted since 2003. The purpose of this review is to provide Maryland policy
makers with information on how the studies were conducted, what the estimated adequate funding
levels are and, where definitive information is available, the policy impact the studies had in their own
states.
Suggested Citation: Aportela, A., Picus, L., Odden, A. & Fermanich, M. (2014). A Comprehensive
Review of State Adequacy Studies Since 2003. Denver, CO: Augenblick, Palaich & Associates

A Comprehensive Review of State Adequacy Studies Since 2003
iii
Executive Summary Many states face the challenging task of determining how much money is needed for their PK-12 public
schools to ensure that all students have the opportunity to meet the state’s educational proficiency
standards. Answering this question of “how much money do schools need?” is important because public
PK-12 education is one of the largest, if not the largest, component of most state and local
governments. Today, with the growing importance of standards based education as evidenced by the
Common Core and college and career-ready standards, knowing what it might cost to provide all
students with an education program that will give them the best possible opportunity to meet those
standards is a critical and complex undertaking. Understanding how much money PK-12 schools need is
typically referred to in the school finance and education policy communities as adequacy.
Adequacy studies are not new to Maryland. Two studies were conducted in 2001. The first, conducted
by Management Analysis and Planning (MAP) for the Maryland Equity Project, utilized the professional
judgment approach. The second, conducted by Augenblick & Myers for the Thornton Commission, used
the professional judgment and successful schools approaches. The work of the Thornton Commission
led to the passage of The Bridge to Excellence in Public Schools Act that estimated a $1.8 billion increase
in state funds for education. An evaluation of the impact of the Bridge to Excellence in Public Schools Act
by MGT of America reported an increase in education spending from 2002-2007 of $3.3 billion in
combined state and local funds (MGT of America, 2008).
This report, prepared for the Maryland State Department of Education addresses the important issue of
school finance adequacy by providing a review of recent school finance “costing out” or adequacy
studies as the first step in a two-year assessment of funding adequacy for Maryland.
The report reviews 39 adequacy studies conducted since 2003. The purpose of this review is to provide
Maryland policy makers with information on how the studies were conducted, what the estimated
adequate funding levels are and, to the extent possible, the policy impact the studies had in their own
states.
There are four general approaches to estimating adequacy. The successful schools/districts (SSD)
approach uses spending in districts that meet an agreed upon set of state standards to estimate what
other school districts would need (with adjustments for student characteristics). The cost function (CF)
method relies on econometric techniques to estimate the level of spending needed to meet a specified
state standard (typically a standardized test score) while controlling for district and student
characteristics. The professional judgment (PJ) technique uses panels of education professionals to
specify the design and resources needed to support prototypical schools that would offer programs that
enable all or almost all students to meet the state’s standards, then estimates the cost of those
resources across all schools and districts in the state. Finally, the evidence-based (EB) model uses
educational research findings to specify the design and resources needed for a prototypical school and
similarly aggregates those resources to a statewide total. All three of these have evolved over time to
the point that today many studies employ multiple methods to determine school funding adequacy.

A Comprehensive Review of State Adequacy Studies Since 2003
iv
We identified a total of 39 school finance adequacy studies that have been conducted in 24 states and
the District of Columbia since 2003 using three of the four approaches. This report does not include
adequacy studies using the cost function approach because that methodology requires a level of data
not available in Maryland. Four of the 39 studies were conducted in one state (Colorado) and three
studies were conducted in Kentucky during that time frame. Two studies were conducted in nine of the
other states and one study in each of the remaining 13 states and the District of Columbia.
Reasons for conducting the studies varied depending on political and economic circumstances in each
state. The most common reasons for conducting adequacy studies were in response to stakeholder
interest, in response to legislation or a court ruling requiring such a study, or to recalibrate a previous
adequacy study – the last often required by either the court or the legislation implementing the findings
from an earlier study.
The most common approaches for adequacy studies were the PJ and EB methods. Many of the reports
we reviewed indicated the use of multiple approaches, sometimes all with equal weight and sometimes
one method used as a secondary approach. For example, many of the PJ studies also used SSD to
validate study findings. Similarly, many of the EB studies relied on small numbers of professional panels
to test and evaluate the EB recommendations – and make state specific adjustments as appropriate. It is
likely the PJ and EB methods have gained greater usage in recent years because in addition to offering a
cost estimate, they provide suggestions as to how the resources allocated to schools and districts might
be used most effectively.
Only one of the 39 studies (Wyoming 2010) suggested fewer dollars were needed in a state’s PK-12
public education system. All others estimated increases in funding that ranged from a low of $144 per
pupil in New Jersey in 2006 to a high of over $5,000 per pupil in Montana in 2007.
Our review of the studies identified seven “best practices” for the design of adequacy studies. They are:
1. Clear focus on improvement of student performance 2. The potential value of case studies in future work 3. Importance of state policy makers and local stakeholders in the process 4. Combining multiple methods in each state study 5. Selection of professional judgment panels 6. Number of professional judgment panels 7. Accurately representing compensation in the analysis
Our conclusion notes that the two consulting groups that partnered to work for Maryland on this study
conducted 26 of the 39 studies reviewed as well as one of the 2001 Maryland studies. We also noted
that adequacy studies have evolved over time such that both the PJ and EB methods now use
components of the alternative method – PJ studies use educational research to inform the panels as
they make decisions and EB studies use panels to validate and modify recommendations for the specifics
of each state. Moreover, most of the PJ studies conducted by APA also conduct a SSD study to validate
the findings.

A Comprehensive Review of State Adequacy Studies Since 2003
v
We also found that over time, the use of PJ panels has become more sophisticated, comprising both
school level educators as well as district and state level professionals to review the recommendations
and provide resource recommendations for central district and state level organizations.
What is clear from this analysis is that the methods for costing out adequacy have become more
sophisticated over time and that they are now better tailored to the specific needs and circumstances of
each state. We anticipate a similar state specific analysis to emerge from the study we are conducting
for Maryland. We also recommend that the adequacy study we are conducting for Maryland include
three of the four methods to estimate an adequate level of resources for school districts in Maryland –
professional judgment, evidence-based and successful schools/districts.

A Comprehensive Review of State Adequacy Studies Since 2003
vi
Contents
Executive Summary ........................................................................................................................... iii
Introduction ......................................................................................................................................1
Chapter 1: Overview of the Adequacy Studies .....................................................................................3
Study Sample ............................................................................................................................................. 3
Table 1.1: Summary of State Adequacy Studies, 2003-2014 .............................................................. 3
Table 1.2: Number of States and Studies Conducted, 2003-2014 ...................................................... 4
Why Studies Were Conducted and Who Commissioned Them ................................................................ 4
Table 1.3: Organizations that Commissioned Adequacy Studies, 2003-2014 .................................... 5
Table 1.4: Reasons Adequacy Studies Were Conducted, 2003-2014 ................................................. 6
Study Methods .......................................................................................................................................... 8
The Successful Schools/Districts Approach (SSD) ............................................................................... 8
Cost Function (CF) ............................................................................................................................... 9
The Professional Judgment Approach (PJ) .......................................................................................... 9
The Evidence-based Approach (EB) .................................................................................................. 10
Use of the Methods in Adequacy Studies ......................................................................................... 10
Table 1.5: Adequacy Study Methods, 2003-2014 ............................................................................. 10
Study Impact and Cost Estimates ............................................................................................................ 11
Table 1.6: Summary of Adequacy Study Funding Recommendations, 2003-2014 ........................... 13
Who Conducted the Studies? ................................................................................................................. 14
Table 1.7: Number of Adequacy Studies Conducted, by Consulting Firm, 2003-2014 ..................... 15
Table 1.8: State Adequacy Studies, 2003-2014................................................................................. 15
Chapter 2: Assumptions and Programmatic Elements Used in the Studies ......................................... 17
Prototypical Schools ................................................................................................................................ 18
Table 2.1: Prototypical School Size ................................................................................................... 19
Core Teachers ......................................................................................................................................... 20
Elective Teachers..................................................................................................................................... 20
Instructional Coaches .............................................................................................................................. 21
Special Education .................................................................................................................................... 21
Other School Staff ................................................................................................................................... 22
Salary Estimates and Regional Cost Differences ..................................................................................... 22
Table 2.2: Core Teachers ................................................................................................................... 23
Table 2.3: Elective Teachers .............................................................................................................. 25

A Comprehensive Review of State Adequacy Studies Since 2003
vii
Table 2.4: Instructional Coaches ....................................................................................................... 26
Table 2.5: Special Education Weights ............................................................................................... 27
Table 2.6: At Risk Students ................................................................................................................ 28
Table 2.7: Summer School ................................................................................................................ 30
Table 2.8: Extended Day Programs ................................................................................................... 33
Table 2.9: Tutors ............................................................................................................................... 35
Table 2.10: Pupil Support .................................................................................................................. 37
Table 2.11: ELL .................................................................................................................................. 40
Funds for Purchasing Materials, Technology and Training ..................................................................... 42
Table 2.12: Instructional Materials ................................................................................................... 43
Table 2.13: Assessments ................................................................................................................... 44
Table 2.14: Gifted and Talented........................................................................................................ 45
Table 2.15: Technology ..................................................................................................................... 46
Table 2.16: Professional Development ............................................................................................. 48
Table 2.17: Campus Safety ................................................................................................................ 52
Table 2.18: Carry Forwards and Items Excluded from Studies ......................................................... 53
Chapter 3: The Evolution of Adequacy Studies and Best Practices for their Design ............................. 55
Evolution of the Successful Schools/Districts Method ........................................................................... 55
Evolution of the Professional Judgment Method ................................................................................... 56
Evolution of the Evidence-based Method .............................................................................................. 57
Best Practices for the Design of Adequacy Studies................................................................................. 58
1. Focus on Improvement of Student Performance .......................................................................... 58
2. The Value of Case Studies in Future Work ..................................................................................... 59
3. Importance of State Policy Makers ................................................................................................ 59
4. Combining Multiple Methods in Each State Study ........................................................................ 60
5. Selection of Professional Judgment Panels ................................................................................... 60
6. Number of Professional Judgment Panels ..................................................................................... 61
7. Accurately Representing Compensation in the Analysis ............................................................... 61
Recommendations for Maryland ...................................................................................................... 62
List of Adequacy Studies Reviewed ................................................................................................... 63
Additional References ...................................................................................................................... 66
Appendix A: Standards, State Assessments and the Adequacy Studies .............................................. 67

A Comprehensive Review of State Adequacy Studies Since 2003
1
Introduction One of the most important questions facing state policy makers is “how much money do schools need?”
This question matters because public PK-12 education is one of the largest, if not the largest, component
of most state and local governments. Today, with the growing importance of standards based education
as evidenced by the Common Core Standards, knowing what it might cost to provide all students with an
education program that will give them the best possible opportunity to meet those standards is a critical
and complex undertaking. Understanding how much money PK-12 schools need is typically referred to in
the school finance and education policy communities as adequacy.
As typically defined, adequacy means providing a level of resources adequate to ensure that all students
have the opportunity to meet their state’s educational proficiency standards – in other words, adequate
funds to meet world class standards.
Today, many states are faced with the difficult question of determining how much money is needed to
educate their school children to those standards and an estimate of how much more – if anything – it
would cost beyond what they are already spending. To answer this question they rely on “costing-out”
or adequacy studies to provide estimates of the level of funding needed.
This report, prepared for the Maryland State Department of Education, reviews 39 adequacy studies
conducted since 2003. In order to provide a comparison to the Maryland context we have also included
the two studies completed for the state in 2001. The purpose of this review is to provide Maryland
policy makers with information on how the studies were conducted, what the estimated adequate
funding levels are, and the policy impact the studies had in their own state.
Adequacy studies are not new to Maryland. Two studies were conducted in 2001. The first, conducted
by Management Analysis and Planning (MAP) for the Maryland Equity Project, utilized the professional
judgment approach. The second, conducted by Augenblick & Myers for the Thornton Commission, used
the professional judgment and successful schools approaches. The work of the Thornton Commission
led to the passage of The Bridge to Excellence in Public Schools Act that estimated a $1.8 billion increase
in state funds for education. An evaluation of the impact of the Bridge to Excellence in Public Schools Act
by MGT of America reported an increase in education spending from 2002-2007 of $3.3 billion in
combined state and local funds (MGT of America, 2008).
This is the first of a number of studies designed to help Maryland review current PK-12 education
spending and assess the adequacy of current funding levels. By reviewing recent school finance
adequacy studies, this analysis will provide the state with information on what has worked and what has
not worked in the past. The findings in this document are designed to help Maryland conduct a
comprehensive adequacy study that will help the state fund its schools into the future.
In the chapters that follow we consider the following topics:
An overall summary of the 39 adequacy studies
The assumptions and programmatic elements used in the studies

A Comprehensive Review of State Adequacy Studies Since 2003
2
The best practices for the design of adequacy studies in the future and a recommendation on
the study approach to be used in the current Maryland study.
We also include a discussion of the timing and use of Maryland’s state assessments for supporting the
study (Appendix A).
Although the basic “algebra” of school finance is straightforward, there are 51 unique school finance
systems across the United States (being the 50 states and the District of Columbia). These systems vary
on the relative shares of state and local funds, the rules for distribution of state funds to local school
districts, and the ways school districts raise local taxes (generally property taxes) for education. In
addition, there are disparities in both the number of students in each state, as well as tremendous
variation across the states in the number and average enrollment of school districts and schools both
within and across states. As a result, adequacy studies are very “state centric” and often the
assumptions and findings of one state’s study cannot be applied directly to other states. For that reason,
this analysis describes approaches that have been used in the last decade and attempts to develop from
those studies a set of best practices that can help guide Maryland policymakers as they identify the
components and costs of an adequate school finance system for their state.

A Comprehensive Review of State Adequacy Studies Since 2003
3
Chapter 1: Overview of the Adequacy Studies This chapter identifies the adequacy studies that have been conducted since 2003 and provides
overview information on those studies. Specifically it identifies the organizations that conducted the
studies, the reasons why each study was conducted (e.g., as a result of a lawsuit, the result of policy
interest in school funding levels, etc.), and provides information on the funding levels recommended by
each study. In each section of this chapter we have strived to make our analysis of the studies as
comparable as possible, but in some instances direct comparisons are not feasible.
Study Sample
This review of state adequacy studies focuses on 39 adequacy studies that were conducted in 24 states
and the District of Columbia since 2003 using three of the four approaches. This report does not include
adequacy studies using the cost function approach because that methodology requires a level of data
not available in Maryland. Table 1.1 summarizes the states where the adequacy studies were conducted
and the number of studies in each state that were reviewed. In most states, only one study has been
conducted, but in several there have been two or more. Colorado has had a total of four adequacy
studies in the time frame studied, and Kentucky a total of three (with a fourth nearly complete as this
report is written)1. Table 1.2 summarizes the number of states and respective studies. Within our
sample 14 states have had one study each (for this review, the District of Columbia is considered a
state), nine states have had two studies, one state has had three, and one state has had four adequacy
studies completed since 2003.
In order to provide context to this review of adequacy studies, the first state listed in most tables is
Maryland and its two 2001 adequacy studies. The first, published in June of 2001, was a professional
judgment panel approach completed by Management Analysis & Planning, Inc. The second, published in
September of 2001, was a professional judgment panel and successful schools approach conducted by
Augenblick & Myers, Inc.
Table 1.1: Summary of State Adequacy Studies, 2003-2014
State Number of Studies
Maryland 2
Arizona 1
Arkansas 2
California 2
Colorado 4
Connecticut 1
District of Columbia 1
Illinois 1
Kentucky 3
Maine 1
Minnesota 2
1 The fourth Kentucky study is not included in this analysis because the final results will not be publicly available
until after the due date of this report.

A Comprehensive Review of State Adequacy Studies Since 2003
4
State Number of Studies
Montana 2
Nevada 1
New Jersey 2
New Mexico 1
New York 2
North Dakota 2
Ohio 1
Pennsylvania 1
Rhode Island 1
South Dakota 1
Tennessee 1
Texas 1
Washington 2
Wisconsin 1
Wyoming 2
Total Studies* 39 * Does not include Maryland
Table 1.2: Number of States and Studies Conducted*, 2003-2014
Number of Studies Conducted
Number of States
0 26
1 14
2 9
3 1
4 1 *Does not include Maryland
Why Studies Were Conducted and Who Commissioned Them There are many reasons why states conduct adequacy studies. They are often the result of a court ruling
holding the state school funding system unconstitutional, or legislation seeking to understand how well
funding for schools stacks up to an estimate of what is needed to meet state proficiency standards. In
other states, a private organization or stakeholder group commissions an adequacy study, often with
the support of a charitable foundation. These often are intended to drive changes in school funding
levels or formulas. Table 1.3 summarizes the types of organizations that funded adequacy studies while
Table 1.4 describes the reasons such studies were undertaken.
Table 1.3 shows that the largest number of studies were funded by stakeholder interest groups. Table
1.4 shows that the reason for 12 of the 39 studies was stakeholder interest, thus it is clear education
support groups and child advocate groups are a powerful influence in commissioning adequacy studies –
in most cases with the hope the study will show more education resources are needed to fund their
state’s schools.

A Comprehensive Review of State Adequacy Studies Since 2003
5
Another important sponsor of adequacy studies is state legislatures and other government agencies.
These studies are often commissioned in response to a state supreme court (or possibly lower court)
ruling, or conducted in anticipation of the filing of, or ruling in a school finance lawsuit. While funded
through Legislative budget appropriations, some studies are managed by a Legislative office, (either
through an interim committee or in some states a Legislative research office or an office established
specifically to manage school funding issues), while others are managed by the state department of
education, or a commission established to do the study.
Of the 39 studies we reviewed, two were commissioned by the plaintiffs – the 2012 Texas school
funding case and the 2011 Colorado case. It is likely that other studies funded by parties to school
finance litigation exist, but at present they are not part of the public literature and thus unavailable for
this review.
Table 1.4 also shows that seven of the studies were commissioned with the purpose of recalibrating
previous studies. The Wyoming Supreme Court requires that state to recalibrate the costs of education
at least every five years, and the legislation implementing Arkansas’ school funding plan in 2004 called
for biennial updates to the model. North Dakota has no specific requirement for recalibration, but after
a five-year effort to implement the 2008 study, it commissioned the 2014 study to recalibrate its per
pupil funding level. Of the four studies done in Colorado, three were commissioned by a stakeholder
group and one by the plaintiffs to a lawsuit. The 2006 and 2013 studies were recalibrations of the 2003
and 2011 studies respectively.
Table 1.3: Organizations that Commissioned Adequacy Studies, 2003-2014
State Year of Study Type of Organization
Maryland 2001 Stakeholder Interest Group
Maryland 2001 Legislature (Thornton Commission)
Arizona 2004 Stakeholder Interest Group
Arkansas 2003 Legislature
Arkansas 2006 Legislature
California 2006 Other Government Agency or Commission
California 2007 Other Government Agency or Commission
Colorado 2003 Stakeholder Interest Group
Colorado 2006 Stakeholder Interest Group
Colorado 2011 Plaintiffs in a lawsuit
Colorado 2013 Stakeholder Interest Group
Connecticut 2005 Stakeholder Interest Group
D.C. 2013 Other Government Agency or Commission
Illinois 2010 Stakeholder Interest Group
Kentucky 2003 State Department of Education or State
Board of Education
Kentucky 2003 State Department of Education or State

A Comprehensive Review of State Adequacy Studies Since 2003
6
State Year of Study Type of Organization
Board of Education
Kentucky 2004 Stakeholder Interest Group
Maine 2014 Legislature
Minnesota 2004 Other Government Agency or Commission
Minnesota 2006 Stakeholder Interest Group
Montana 2005 Legislature
Montana 2007 Stakeholder Interest Group
Nevada 2006 Legislature
New Jersey 2006 State Department of Education or State
Board of Education
New Jersey 2007 State Department of Education or State
Board of Education
New Mexico 2008 Legislature
New York 2004 Stakeholder Interest Group
New York 2004 Other Government Agency or Commission
North Dakota 2008 Other Government Agency or Commission
North Dakota 2014 Legislature
Ohio 2009 Stakeholder Interest Group
Pennsylvania 2007 State Department of Education or State
Board of Education
Rhode Island 2007 Legislature
South Dakota 2006 Stakeholder Interest Group
Tennessee 2004 Stakeholder Interest Group
Texas 2012 Plaintiffs in a lawsuit
Washington 2006 Other Government Agency or Commission
Washington 2006 Other Government Agency or Commission
Wisconsin 2007 Stakeholder Interest Group
Wyoming 2005 Legislature
Wyoming 2010 Legislature
Table 1.4: Reasons Adequacy Studies Were Conducted, 2003-2014
State Year of Study Reason for Study
Maryland 2001 Stakeholder Interest
Maryland 2001 Legislation
Arizona 2004 Stakeholder Interest
Arkansas 2003 Law Suit/Court Ruling
Arkansas 2006 Recalibration of Previous Study

A Comprehensive Review of State Adequacy Studies Since 2003
7
State Year of Study Reason for Study
California 2006 Government Agency Interest (e.g., Dept. of Education)
California 2007 Government Agency Interest (e.g., Dept. of Education)
Colorado 2003 Stakeholder Interest
Colorado 2006 Recalibration of a Previous Study
Colorado 2011 Stakeholder Interest
Colorado 2013 Recalibration of a Previous Study
Connecticut 2005 Stakeholder Interest
D.C. 2013 Government Agency Interest (e.g., Dept. of Education)
Illinois 2010 Stakeholder Interest
Kentucky 2003 Legislation
Kentucky 2003 Legislation
Kentucky 2004 Stakeholder Interest
Maine 2014 Legislation
Minnesota 2004 Government Agency Interest (e.g., Dept. of Education)
Minnesota 2006 Recalibration of a Previous Study
Montana 2005 Law Suit/Court Ruling
Montana 2007 Stakeholder Interest
Nevada 2006 Stakeholder Interest
New Jersey 2006 Government Agency Interest (e.g., Dept. of Education)
New Jersey 2007 Government Agency Interest (e.g., Dept. of Education)
New Mexico 2008 Stakeholder Interest
New York 2004 Law Suit/Court Ruling
New York 2004 Law Suit/Court Ruling
North Dakota 2008 Law Suit/Court Ruling
North Dakota 2014 Recalibration of a Previous Study
Ohio 2009 Government Agency Interest (e.g., Dept. of Education)
Pennsylvania 2007 Government Agency Interest (e.g., Dept. of Education)
Rhode Island 2007 Legislation
South Dakota 2006 Stakeholder Interest
Tennessee 2004 Stakeholder Interest
Texas 2012 Law Suit/Court Ruling
Washington 2006 Legislation
Washington 2006 Legislation
Wisconsin 2007 Stakeholder Interest
Wyoming 2005 Recalibration of Previous Study
Wyoming 2010 Recalibration of Previous Study

A Comprehensive Review of State Adequacy Studies Since 2003
8
Study Methods Over the past two decades four generally accepted approaches to estimating school finance adequacy
have been developed: successful schools/districts (SSD); cost function (CF); professional judgment (PJ)
and evidence-based (EB). These approaches differ in terms of underlying philosophy, the assumptions
that need to be made to apply them, and the data required. Each approach is briefly summarized below.
The Successful Schools/Districts Approach (SSD)
The successful schools/districts approach is based on the premise that the level of resources needed to
meet a set of objectives can be identified by examining the spending of schools or districts that currently
meet those objectives. The approach also assumes additional funding is needed to meet the cost of
serving students with identified needs and districts with special circumstances. These additional
amounts are determined using methods more appropriate for estimating support for students with
special needs.
The SSD approach is most useful when the state has specified its student outcome and input objectives
and districts or schools that meet them can be identified. The characteristics of the approach are the
following: it is based on current practice to meet the standards; it is empirical and tangible, based on the
spending of districts meeting the standard; it assumes that resources can be used in very different ways
in successful districts; it focuses on the cost of providing services to students with no special needs in
districts with no special circumstances; and it only generates a base cost figure – adjustments must be
made for students with identified needs and districts with special circumstances.
Typically, SSD adequacy studies are conducted at the district level. There are several reasons for this,
including the fact that most states report reliable expenditure data only at the district level and because
district supports and strategies often contribute, at least in part, to the success of any one school in a
district. Under the SSD approach, districts meeting specific performance criteria are selected and, after
conducting an efficiency analysis to screen out districts with unusually high spending patterns,
expenditures for general administration, general education, and operations and maintenance are
analyzed and used to develop a specific amount for a per student base cost, which estimates the
amount of resources required for students with no special needs to successfully achieve state standards.
The adequacy study that APA originally conducted in Maryland made use of a school level successful
schools approach because the state has too few school districts to provide an adequate number of
successful districts on which to base performance and cost comparisons. The theory behind the
approach does not change based on the level of analysis – district or school. Successful units are
identified, their spending is examined, efficiency screens are applied where possible, and a base cost is
developed based on the spending of the efficient, high-performing schools or districts. Where the
approaches differ is that when working at the district level expenditure data are typically gathered from
readily available state education agency fiscal reports. When schools are the unit of analysis, in nearly all
states, school level expenditure data must be collected via specifically administered surveys and/or
interviews with the appropriate school and district administrators and then blended with relevant
district level expenditures going to support the school to ensure that all applicable resources supporting

A Comprehensive Review of State Adequacy Studies Since 2003
9
a school are accounted for. This is the expenditure data approach used by APA in the 2001 Maryland
study and the approach we propose to use again for the current study.
Cost Function (CF)
The cost function or statistical approach is based on understanding those factors that explain differences
in spending across school districts while controlling for student performance. Because of its complexity
and use of econometrics, the CF approach has proven difficult to explain in situations other than
academic forums. The approach requires the availability of a significant amount of data, much of which
needs to be at the school or student level in order to be most useful. No state has used the cost function
approach alone to determine the parameters of a school finance formula. However, the cost function
approach has been used to establish some of the adjustments states use to allocate funding sensitive to
uncontrollable cost pressures, such as setting the weights for students enrolled in special education
programs or creating the formulas to reflect the costs associated with different enrollment levels.
The SSD and CF approaches identified above are ways to estimate an adequate level of funding, but do
not offer guidance about how to allocate those resources. They make no assumption that resources can
or will be used differently from current practice. The next two approaches address this issue, one by
relying on the expertise of education professionals and the other using the growing research evidence
surrounding programs and resource use that lead to improved student learning.
The Professional Judgment Approach (PJ) The professional judgment approach relies on the expertise of experienced education professionals to
specify the kinds of resources, and the quantities of those resources, that would be expected to be
available in order to achieve a set of objectives. This “input-based” approach was developed in Wyoming
in the late 1990s to calculate a base cost amount in response to the state Supreme Court’s requirement
that the school finance system reflect the cost of the “basket of goods and services” needed to assure
that a high school graduate could be admitted to an institution of higher education in the state. The
approach uses panels of experts to specify the way education services should be delivered in order to
meet state standards. Once the services have been specified (with a focus on the number and types of
personnel, regular school programs, extended-day and extended-year programs, professional
development, and technology), costs are attached and a per pupil cost is determined.
This approach best reflects the experiences of people who are actually responsible for delivering
education services, and may be combined with research results, as a rational way to specify the
resources required to produce a specific level of student performance.
Regardless of how the approach has been implemented, it has been designed to distribute funds
through a “block grant” – that is, without specifying exactly how money should be spent; while the
professional judgment panels identify specific resources, they do so with the understanding that those
resources might be employed differently in each setting to best serve the needs of a particular school or
district’s students, but that the general level of resource identified is adequate.
The advantages of the approach are that it reflects the views of actual education professionals and it is
easy to understand; the disadvantages are that it tends to be based on current practice and there may

A Comprehensive Review of State Adequacy Studies Since 2003
10
not be evidence, beyond individual experience, that the provision of money at the designated level, or
even the deployment of resources as specified by the representative schools, will produce the
anticipated outcomes. The approach is now often coupled with the use of evidence-based figures as a
starting point in order to address some of these disadvantages.
The Evidence-based Approach (EB)
The evidence-based approach assumes that information gathered from research exists to define the
resource needs of a hypothetical school or school district to assure that it can meet state standards. This
approach was used in New Jersey in 1998 to determine the resource needs of a subset of school
districts, commonly referred to as “Abbott” districts. The court identified these districts as requiring
special attention and resources. The approach not only determined resource levels but also specified
the programmatic ways such resources should be used. The strength of the approach is that it
incorporates the latest research about the way services should be delivered to improve their likelihood
of success. But there are disadvantages, including questions about whether research applies to all
demographic situations, the lack of research information about many cost elements schools face, and
the fact that the approach may not be state specific. In recent years the approach has made use of local
professional judgment panels and case studies of improving schools to tailor the evidence-based model
to specific state contexts.
Use of the Methods in Adequacy Studies
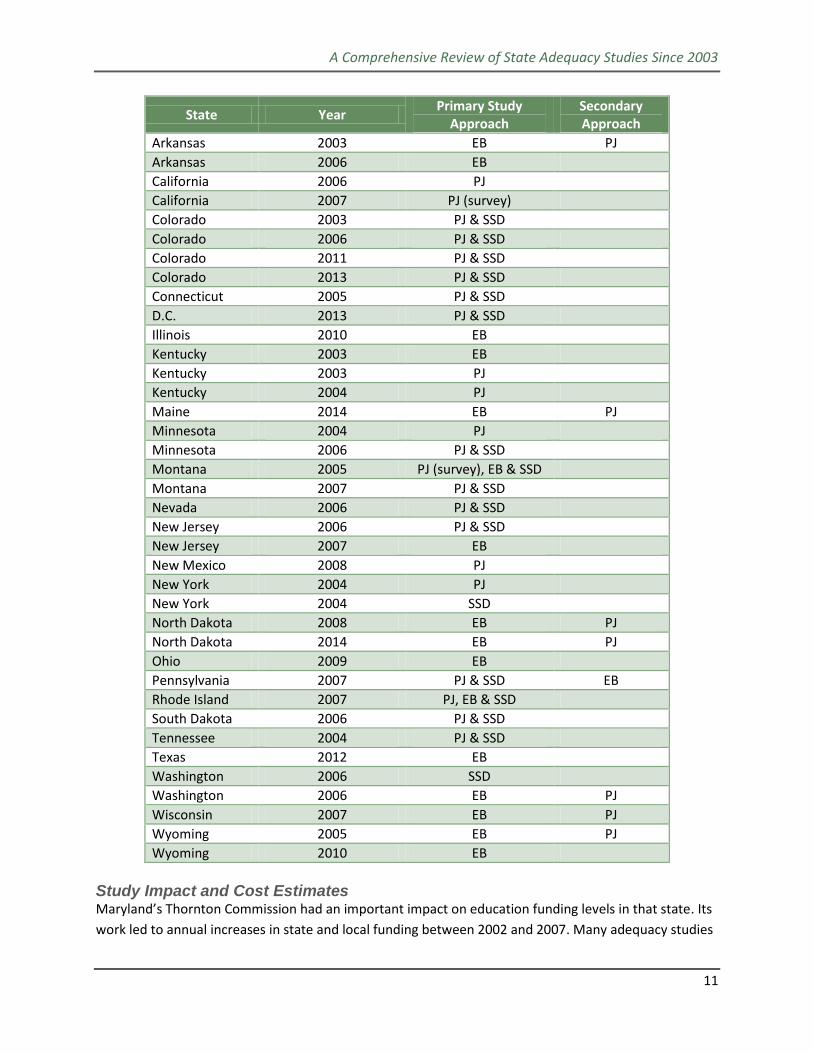
Table 1.5 identifies the methods used in each of the 39 studies we reviewed.2 In most cases, there was a
primary method or approach identified by the consultants. Some of the studies relied on a second
approach to test or verify the findings. For example, many PJ studies provide panelists with a set of
research findings to help guide their discussions, as noted previously. Similarly most EB studies have
used panels of professionals to review and verify the EB recommendations in their particular state. In
addition, recent EB studies have also included case studies of improving schools to ascertain how closely
the EB strategies match the approach used by these improving schools.
Some of the studies reviewed estimated adequacy findings using multiple approaches. In those cases, all
of the approaches are indicated in the primary study approach column of Table 1.5. The two patterns
that emerge most clearly from Table 1.5 are 1) most EB studies also have a PJ panel review the EB
recommendations, and 2) most of the PJ studies have used SSD as an additional primary method to
validate the base cost figures in the study.
Table 1.5: Adequacy Study Methods, 2003-2014
State Year Primary Study
Approach Secondary Approach
Maryland 2001 PJ
Maryland 2001 PJ & SSD
Arizona 2004 EB PJ
2 This review does not include adequacy studies using the cost function approach as the methodology requires a
level of data not available in Maryland.
A Comprehensive Review of State Adequacy Studies Since 2003
11
State Year Primary Study
Approach Secondary Approach
Arkansas 2003 EB PJ
Arkansas 2006 EB
California 2006 PJ
California 2007 PJ (survey)
Colorado 2003 PJ & SSD
Colorado 2006 PJ & SSD
Colorado 2011 PJ & SSD
Colorado 2013 PJ & SSD
Connecticut 2005 PJ & SSD
D.C. 2013 PJ & SSD
Illinois 2010 EB
Kentucky 2003 EB
Kentucky 2003 PJ
Kentucky 2004 PJ
Maine 2014 EB PJ
Minnesota 2004 PJ
Minnesota 2006 PJ & SSD
Montana 2005 PJ (survey), EB & SSD
Montana 2007 PJ & SSD
Nevada 2006 PJ & SSD
New Jersey 2006 PJ & SSD
New Jersey 2007 EB
New Mexico 2008 PJ
New York 2004 PJ
New York 2004 SSD
North Dakota 2008 EB PJ
North Dakota 2014 EB PJ
Ohio 2009 EB
Pennsylvania 2007 PJ & SSD EB
Rhode Island 2007 PJ, EB & SSD
South Dakota 2006 PJ & SSD
Tennessee 2004 PJ & SSD
Texas 2012 EB
Washington 2006 SSD
Washington 2006 EB PJ
Wisconsin 2007 EB PJ
Wyoming 2005 EB PJ
Wyoming 2010 EB
Study Impact and Cost Estimates Maryland’s Thornton Commission had an important impact on education funding levels in that state. Its
work led to annual increases in state and local funding between 2002 and 2007. Many adequacy studies

A Comprehensive Review of State Adequacy Studies Since 2003
12
have had similar impacts, while others have not led to much change in their state. In states with
Supreme Court rulings (e.g. Wyoming and Arkansas), major changes in the distribution formula as well
as substantial new funding for schools resulted from adequacy studies and the recalibration of those
studies. In other states adequacy studies received considerable attention, but little action for changing
funding formulas emerged directly from the study. For example, California’s two studies conducted as
part of a larger group of studies collectively known as “Getting Down to Facts,” had very little direct
impact on school funding in the state although some of the initial modeling developed for one of the
studies did help in the simulations used to support the successful revision of California’s funding formula
several years later.
Ohio represents a somewhat different outcome. In 2009, Governor Ted Strickland announced during his
state of the state address that Ohio would move to an evidence-based approach to fund schools, and
proposed a new funding formula based on the EB model modified to meet Ohio’s specific
characteristics. The Ohio study reviewed for this analysis does not estimate the cost of adequacy, but
rather was commissioned by a charitable foundation to compare the Governor’s proposal with the
generic EB model. Similarly, the 2007 New Jersey study was a review and comparison of the EB model
with a previous adequacy study done in the state that used PJ and SSD methods.
In Pennsylvania, the recommendations of the 2007 study conducted for the State Board of Education
were largely adopted by then Governor Rendell, who in 2008 proposed the implementation of a new
school funding formula that would phase in the report’s recommendations over a six-year period. While
implementation made progress during the Rendell administration, subsequent legislative action has
reversed much of this work.
Table 1.6 summarizes the increase in total and per pupil funding recommended in each of the studies
for which such data can be derived. Some studies reported total funding while others provided
estimates of funding per pupil. In a few studies, multiple funding recommendations were reported
based on the different adequacy approaches. The studies rarely, if ever, indicated the degree to which
the recommended new per pupil levels would be funded with state or local revenues. This omission is
appropriate as this should be a state policy decision, generally starting with the Legislature.
In several studies, recommended funding changes were presented as a range, rather than a single
estimate. When that occurred, we used the average of the range or amounts reported. If multiple
adequacy approach results were reported in one study, Table 1.6 contains additional lines for each
reported amount. The corresponding approach is documented in the notes column of the table.
Some studies reported both total funding changes and changes in funding per pupil. When only one of
those amounts was reported (generally only the change in total funding) we used the state’s total
enrollment as reported in the NEA Rankings and Estimates Documents for the appropriate year and
computed the missing information. In some instances, the estimated change in total funding was not
included in the study (see for example, Ohio).

A Comprehensive Review of State Adequacy Studies Since 2003
13
The Wyoming 2010 study, which was a recalibration of the 2005 study, is unique in that the authors
found that state appropriations for K-12 education exceeded current EB estimates of adequacy and that
additional resources to fund schools were not necessary.
Table 1.6: Summary of Adequacy Study Funding Recommendations, 2003-2014
State
Year
of the
Study
Total Additional
Funding
(in millions)
Per Pupil
Funding Change
Needed
Implementation of
Study Results Notes
Maryland 2001 $300 $352 Not Implemented PJ Low Estimate
$1,800 $2,110 Not Implemented PJ High Estimate
Maryland 2001 $2,879 $3,375 Implemented
Thornton
Commission
recommendation
of $1.8 Billion
PJ
$2,022 $2,371 SSD
Arizona 2004 $1,325 $1,428 Not Implemented EB
Arkansas 2003 $847 $1,903 Implemented EB
Arkansas 2006 $220 $485 Not Implemented EB
California 2006 $24,140
$32,010
$3,826
$5,073
Not Implemented
Not Implemented
PJ Low Estimate
PJ High Estimate
California 2007 $19,474 $3,099 Not Implemented PJ survey
Colorado 2003 N/A N/A Not Implemented PJ
Colorado 2006 $700
$2,078
$959
$2,848
Not Implemented
Not Implemented
SSD
PJ
Colorado 2011 $1,350
$3,580
$1,633
$4,331
Not Implemented
Not Implemented
SSD
PJ
Colorado 2013 $2,650
$4,060
$3,089
$4,733
Not Implemented
Not Implemented
SSD
PJ
Connecticut 2005
$46
$2,020
$801
$3,503
Not Implemented
Not Implemented
SSD
PJ
D.C. 2013 $182 $2,176 Partially
Implemented
PJ
Illinois 2010 $3,540 $1,750 Not Implemented EB
Kentucky 2003 $740 $1,176 Not Implemented EB
Kentucky 2003 $1,800 $2,861 Not Implemented PJ
Kentucky 2004 $1,230 $1,955 Not Implemented PJ
Maine 2014 $327 $873 Too early to
determine
EB
Minnesota 2004 N/A N/A N/A PJ
Minnesota 2006 $1,789 $2,258 Not Implemented PJ

A Comprehensive Review of State Adequacy Studies Since 2003
14
State
Year
of the
Study
Total Additional
Funding
(in millions)
Per Pupil
Funding Change
Needed
Implementation of
Study Results Notes
$1,059 $1,384 Not Implemented SSD
Montana 2005 $96
$329
$21
$660
$2,262
$142
Not Implemented
Not Implemented
Not Implemented
SSD
PJ
EB
Montana 2007 $725 $5,021 Not Implemented PJ
Nevada 2006 $80
$1,321
$231
$3,579
Not Implemented
Not Implemented
SSD
PJ
New Jersey 2006 $200 $144 Implemented PJ
New Jersey 2007 N/A N/A Implemented EB
New Mexico 2008 $335 $1,034 Not Implemented PJ
New York 2004 $6,210
$8,400
$2,200
$2,976
Not Implemented
Not Implemented
PJ Low Estimate
PJ High Estimate
New York 2004 $4,800 $2,445 Partially
Implemented
SSD
North Dakota 2008 $300 $976 Implemented EB
North Dakota 2014 N/A N/A N/A EB
Ohio 2009 N/A N/A N/A EB
Pennsylvania 2007 $4,378 $2,414 Partially
Implemented
SSD/PJ/EB
Rhode Island 2007 $93
$205
$57
$570
$1,262
$349
Not Implemented
Not Implemented
Not Implemented
SSD
PJ
EB
South Dakota 2006 $134
$406
$1,148
$3,324
Not Implemented
Not Implemented
SSD
PJ
Tennessee 2004 $1,114 $1,284 Not Implemented PJ
Texas 2012 N/A N/A N/A EB
Washington 2006 N/A N/A N/A EB
Washington 2006 $183 $178 Partially
Implemented
SSD
Wisconsin 2007 $786 $888 Not Implemented EB
Wyoming 2005 $327 $3,903 Implemented EB
Wyoming 2010 - - Implemented EB
Who Conducted the Studies?
A review to ascertain which consultants conducted these studies shows that most of the adequacy
studies completed between 2003 and 2014 were led by two firms; Augenblick, Palaich & Associates and

A Comprehensive Review of State Adequacy Studies Since 2003
15
Picus Odden & Associates (in some instances under different firm names but with generally the same
leadership staff). Table 1.7 summarizes the number of studies done by each firm, not including
Maryland’s two 2001 adequacy studies. There were three studies done by multiple firms during this
time, including two in which Augenblick, Palaich & Associates partnered with another firm.
Table 1.7: Number of Adequacy Studies Conducted, by Consulting Firm*, 2003-2014
Firm Conducting Study Number of Studies
Picus Odden & Associates 16
Augenblick, Palaich & Associates 11
American Institutes for Research 2
R. Craig Wood and Associates 2
Multiple Firms 3
Public Policy Institute of California 1
National Louis University 1
Deborah Verstegen 1
Management Analysis and Planning 1
Standard and Poor’s 1
*Does not include Maryland
Table 1.8 lists all 39 studies since 2003 and the two Maryland 2001 studies, and indicates the publication
year for each study and the consultant conducting the work, including Maryland’s two 2001 studies. The
first, published in June of 2001, was a professional judgment panel approach done by Management
Analysis & Planning, Inc. The second, published in September of 2001 was a professional judgment panel
and successful schools approach done by Augenblick & Myers, Inc.
Table 1.8: State Adequacy Studies, 2003-2014
Study # State Year Consultant
Maryland 2001 MAP
Maryland 2001 APA
1 Arizona 2004 POA
2 Arkansas 2003 POA
3 Arkansas 2006 POA
4 California 2006 AIR
5 California 2007 PPIC
6 Colorado 2003 APA
7 Colorado 2006 APA
8 Colorado 2011 APA
9 Colorado 2013 APA
10 Connecticut 2005 APA
11 District of Columbia 2013 APA and the Finance Project
12 Illinois 2010 National Louis University
13 Kentucky 2003 POA
14 Kentucky 2003 POA
15 Kentucky 2004 Deborah Verstegen

A Comprehensive Review of State Adequacy Studies Since 2003
16
Study # State Year Consultant
16 Maine 2014 POA
17 Minnesota 2004 MAP
18 Minnesota 2006 APA
19 Montana 2005 R. Craig Wood and Associates
20 Montana 2007 APA
21 Nevada 2006 APA
22 New Jersey 2006 APA/New Jersey Dept. of Education
23 New Jersey 2007 POA
24 New Mexico 2008 AIR
25 New York 2004 AIR and MAP
26 New York 2004 Standard and Poor’s
27 North Dakota 2008 POA
28 North Dakota 2014 POA
29 Ohio 2009 POA
30 Pennsylvania 2007 APA
31 Rhode Island 2007 R. Craig Wood and Associates
32 South Dakota 2006 APA
33 Tennessee 2004 APA
34 Texas 2012 POA
35 Washington 2006 POA
36 Washington 2006 POA
37 Wisconsin 2007 POA
38 Wyoming 2005 POA
39 Wyoming 2010 POA POA – Picus Odden & Associates (Also Lawrence O. Picus and Associates) APA – Augenblick, Palaich & Associates (Also Augenblick & Myers) AIR – American Institutes for Research MAP – Management Analysis and Planning
A Comprehensive Review of State Adequacy Studies Since 2003
17
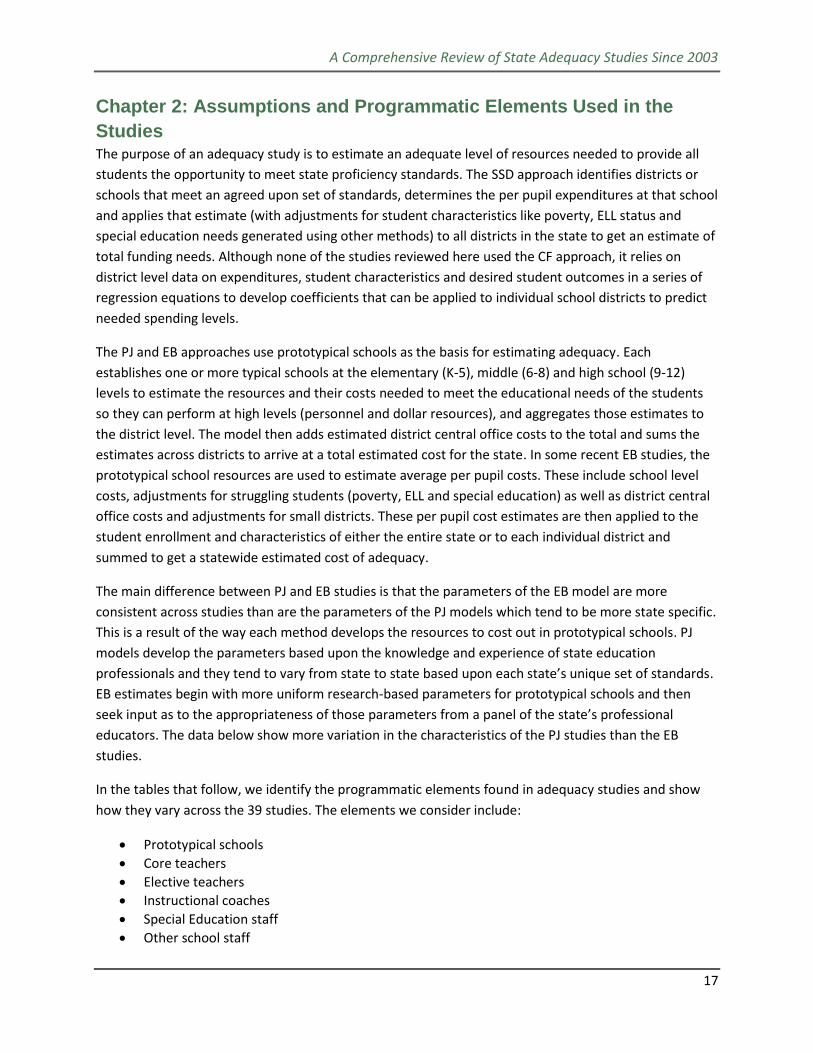
Chapter 2: Assumptions and Programmatic Elements Used in the
Studies The purpose of an adequacy study is to estimate an adequate level of resources needed to provide all
students the opportunity to meet state proficiency standards. The SSD approach identifies districts or
schools that meet an agreed upon set of standards, determines the per pupil expenditures at that school
and applies that estimate (with adjustments for student characteristics like poverty, ELL status and
special education needs generated using other methods) to all districts in the state to get an estimate of
total funding needs. Although none of the studies reviewed here used the CF approach, it relies on
district level data on expenditures, student characteristics and desired student outcomes in a series of
regression equations to develop coefficients that can be applied to individual school districts to predict
needed spending levels.
The PJ and EB approaches use prototypical schools as the basis for estimating adequacy. Each
establishes one or more typical schools at the elementary (K-5), middle (6-8) and high school (9-12)
levels to estimate the resources and their costs needed to meet the educational needs of the students
so they can perform at high levels (personnel and dollar resources), and aggregates those estimates to
the district level. The model then adds estimated district central office costs to the total and sums the
estimates across districts to arrive at a total estimated cost for the state. In some recent EB studies, the
prototypical school resources are used to estimate average per pupil costs. These include school level
costs, adjustments for struggling students (poverty, ELL and special education) as well as district central
office costs and adjustments for small districts. These per pupil cost estimates are then applied to the
student enrollment and characteristics of either the entire state or to each individual district and
summed to get a statewide estimated cost of adequacy.
The main difference between PJ and EB studies is that the parameters of the EB model are more
consistent across studies than are the parameters of the PJ models which tend to be more state specific.
This is a result of the way each method develops the resources to cost out in prototypical schools. PJ
models develop the parameters based upon the knowledge and experience of state education
professionals and they tend to vary from state to state based upon each state’s unique set of standards.
EB estimates begin with more uniform research-based parameters for prototypical schools and then
seek input as to the appropriateness of those parameters from a panel of the state’s professional
educators. The data below show more variation in the characteristics of the PJ studies than the EB
studies.
In the tables that follow, we identify the programmatic elements found in adequacy studies and show
how they vary across the 39 studies. The elements we consider include:
Prototypical schools
Core teachers
Elective teachers
Instructional coaches
Special Education staff
Other school staff
A Comprehensive Review of State Adequacy Studies Since 2003
18
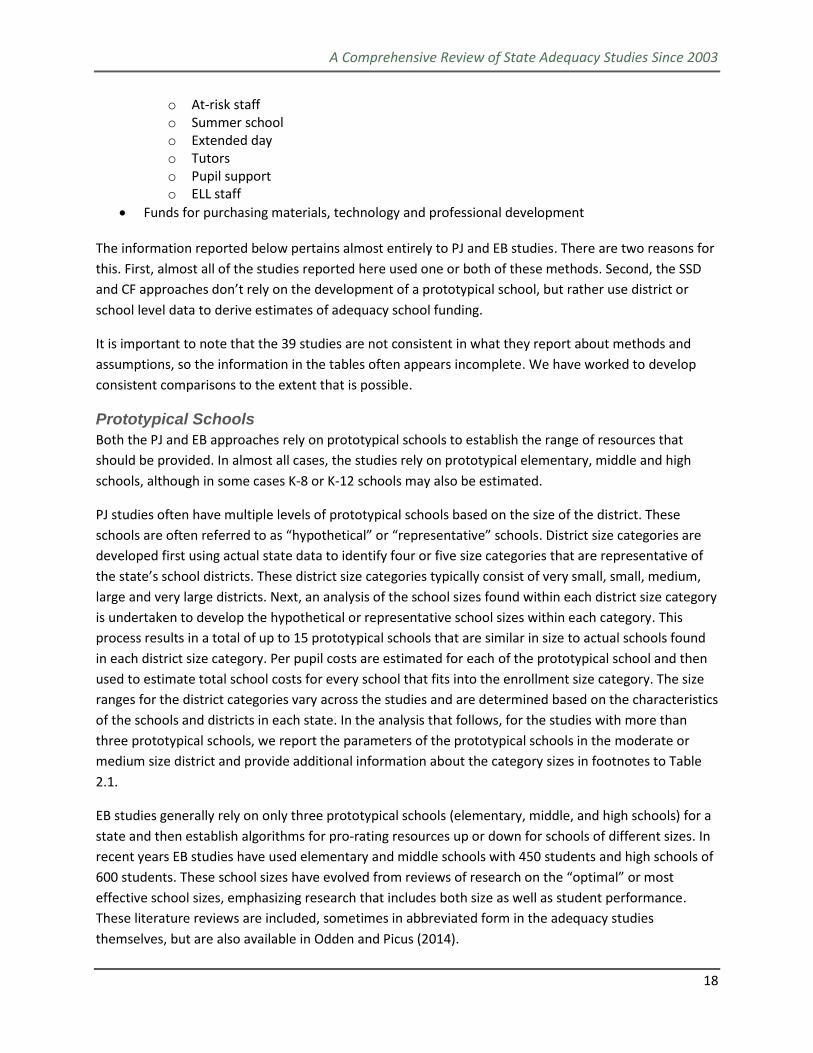
o At-risk staff o Summer school o Extended day o Tutors o Pupil support o ELL staff
Funds for purchasing materials, technology and professional development The information reported below pertains almost entirely to PJ and EB studies. There are two reasons for
this. First, almost all of the studies reported here used one or both of these methods. Second, the SSD
and CF approaches don’t rely on the development of a prototypical school, but rather use district or
school level data to derive estimates of adequacy school funding.
It is important to note that the 39 studies are not consistent in what they report about methods and
assumptions, so the information in the tables often appears incomplete. We have worked to develop
consistent comparisons to the extent that is possible.
Prototypical Schools
Both the PJ and EB approaches rely on prototypical schools to establish the range of resources that
should be provided. In almost all cases, the studies rely on prototypical elementary, middle and high
schools, although in some cases K-8 or K-12 schools may also be estimated.
PJ studies often have multiple levels of prototypical schools based on the size of the district. These
schools are often referred to as “hypothetical” or “representative” schools. District size categories are
developed first using actual state data to identify four or five size categories that are representative of
the state’s school districts. These district size categories typically consist of very small, small, medium,
large and very large districts. Next, an analysis of the school sizes found within each district size category
is undertaken to develop the hypothetical or representative school sizes within each category. This
process results in a total of up to 15 prototypical schools that are similar in size to actual schools found
in each district size category. Per pupil costs are estimated for each of the prototypical school and then
used to estimate total school costs for every school that fits into the enrollment size category. The size
ranges for the district categories vary across the studies and are determined based on the characteristics
of the schools and districts in each state. In the analysis that follows, for the studies with more than
three prototypical schools, we report the parameters of the prototypical schools in the moderate or
medium size district and provide additional information about the category sizes in footnotes to Table
2.1.
EB studies generally rely on only three prototypical schools (elementary, middle, and high schools) for a
state and then establish algorithms for pro-rating resources up or down for schools of different sizes. In
recent years EB studies have used elementary and middle schools with 450 students and high schools of
600 students. These school sizes have evolved from reviews of research on the “optimal” or most
effective school sizes, emphasizing research that includes both size as well as student performance.
These literature reviews are included, sometimes in abbreviated form in the adequacy studies
themselves, but are also available in Odden and Picus (2014).

A Comprehensive Review of State Adequacy Studies Since 2003
19
Table 2.1 summarizes the prototypical school size used in each of the 39 studies where such was
identified.
Table 2.1: Prototypical School Size*
Prototypical School Size
State Year Elementary Middle High School
Maryland 2001 500 800 1,000
Maryland 2001 500 800 1,000
Arizona 2004 500 500 500
Arkansas 2003 500 500 500
Arkansas 2006 500 500 500
California 2006 N/A N/A N/A
California 2007 583 950 1,759
Colorado* 2003 345 345 465
Colorado* 2006 345 345 465
Colorado* 2011 420 450 500
Colorado* 2013 420 450 500
Connecticut 2005 420 525 1,400
D.C.* 2013 420 600 1,000
Illinois 2010 432 450 600
Kentucky 2003 500 500 500
Kentucky 2003 400 500 800
Kentucky 2004 384 567 768
Maine 2014 450 450 600
Minnesota* 2004 372 426 628
Minnesota* 2006 372 426 628
Montana 2005 300 249 399
Montana* 2007 200 116 232
Nevada* 2006 600 750 1,250
New Jersey* 2006 400 600 1,640
New Jersey 2007 400 600 1,640
New Mexico 2008 NA NA NA
New York 2004 NA NA NA
New York 2004 NA NA NA
North Dakota 2008 432 450 600
North Dakota 2014 450 450 600
Ohio 2009 418 557 733
Pennsylvania* 2007 NA NA NA
Rhode Island 2007 308 657 891
South Dakota 2006 192 193 256
Tennessee 2004 320 400 1,064
Texas 2012 450 450 600

A Comprehensive Review of State Adequacy Studies Since 2003
20
Prototypical School Size
State Year Elementary Middle High School
Washington 2006 432 450 600
Washington 2006 NA NA NA
Wisconsin 2007 432 450 600
Wyoming 2005 288 315 630
Wyoming 2010 288 315 630
*In studies where multiple prototype sizes were used, the midsize is reported in the table and the states
are indicated with an “*”.
Core Teachers
Teachers represent the largest component of school district expenditures. Most PJ and EB studies
provide estimates for both core and elective teachers; though PJ studies, particularly for secondary
schools, often present a total teacher figure without distinguishing between core and elective. Core
teachers are regular classroom teachers. In elementary schools, they typically are responsible for a
classroom all day (with time for planning). In middle and high schools with departmentalized instruction,
core teachers focus on math, language arts, science, social studies and world languages. Elective
teachers (discussed in the next section) provide for planning time in elementary schools and teach
elective courses at middle and high schools. Table 2.2 shows how the number of core teachers is
estimated for each of the studies. The most common approach is to provide a ratio of the number of
students to a teacher. For example, most of the EB studies use ratios of 15:1 for grades K-3 (this includes
prekindergarten when it is part of the study) and 25:1 for grades 4-12. This may vary due to past
practice (Wyoming) or state requirements (Arkansas).
The core teacher ratios vary more in the PJ studies and are sometimes reported in different formats. For
example the Colorado and Connecticut studies estimate core teachers based on the number of teachers
per 1,000 students to make numbers comparable across all of the prototype schools, although this can
be converted easily to the pupil/teacher ratios reported in most of the studies.
Some of the larger ratios are also a function of combining elective teachers with core teachers rather
than identify them separately. This is noted in Table 2.3.
Elective Teachers
Elective teachers are included in most of the adequacy studies in this sample. Generally, elective
teachers at the elementary level teach art, music and physical education (PE) classes to provide time for
core teachers to plan and collaborate. At the middle and high school level core teachers are used to
offer non-core elective classes. Table 2.3 shows how elective teachers were allocated in the studies we
reviewed.
The EB studies typically estimate elective teachers at 20% of the number of core teachers at the
elementary and middle school levels. Early EB studies use the same percentage at the high school level
although more recent ones typically use 33% elective teachers so that high schools can use block
schedules and still provide a daily planning period for all teachers.

A Comprehensive Review of State Adequacy Studies Since 2003
21
The PJ studies show more variation (as they do with core teachers). Some of the studies identify a
percentage, others provide a number of elective teachers for a prototypical school, others identify the
number of elective teaches per 1,000 students, while others do not distinguish between core and
elective teachers.
Instructional Coaches
Coaches, or instructional facilitators, coordinate the instructional program and ongoing instructional
coaching and mentoring for teachers. There is growing evidence that coaches are an important
component of improved schools (Lockwood, McCombs & Marsh, 2010; Marsh, McCombs & Martorell,
2010; and Pianta, Allen & King, 2011). Many of the adequacy studies we reviewed include coaches in
their cost estimates as shown in Table 2.4.
The EB studies are most consistent, generally resourcing schools with 1 coach for every 200 students or
2.25 coaches for a prototypical school of 450 students and 3 coaches for a prototypical school of 600
students.
There is again more variation in the allocation of coaching resources in the PJ studies when they are
included based upon different state approaches to coaching. For example, some states do not have
separate instructional coaches but instead rely on mentor teachers with added release time to coach
other teachers. Of the 39 studies, only 19 include instructional coaches in the cost estimates. One study
in Montana includes them as elective or specialist teachers.
Special Education
Provision of special education is critical to estimating the costs of adequacy. Two approaches were
identified in the studies. In some instances, primarily EB studies, a census-based approach was used. In
those instances additional staff were included at the school site to provide special education services for
children with mild and moderate disabilities while it was recommended that services for children with
severe disabilities be funded entirely by the state. Over time the special education allocation has
changed from one teacher and a half-time aid for every 150 students to one teacher and one full-time
aid for every 150 students. This change appears to be based on feedback from PJ panels that were part
of most EB studies. The PJ approach often looks at resources for disaggregated special education
categories, such as mild, moderate or severe based upon disabilities or service need levels.
Twelve studies recommended a weighted student approach to funding special education. Table 2.5
summarizes the weights that were used in these 12 studies. The other studies used some combination
of either a specific dollar amount, or included Special Education in another category. In Wyoming,
special education was not specifically addressed since all approved special education costs are fully
funded by the state. In general, special education allocations were state specific and cannot be easily
summarized. For Maryland, we recommend using the recommendations that emerge from the EB and PJ
studies and developing state specific cost estimates based on current approaches and the special
education student counts for the state.

A Comprehensive Review of State Adequacy Studies Since 2003
22
Other School Staff
Schools rely on a range of other staff to provide services to students. We found substantial variation in
the types and allocation of staff positions across the studies. Position titles varied across the studies and
the expected services each provided varied as well. The following tables provide a summary of these
staff allocations across the 39 studies.
Table 2.6 – At Risk Students
Table 2.7 – Summer School
Table 2.8 – Extended Day Programs
Table 2.9 – Tutors
Table 2.10 – Pupil Support Staff
Table 2.11 – ELL
Salary Estimates and Regional Cost Differences
Employee compensation represents the largest component of any school district’s expenditures and
relatively the largest portion of the total cost of adequacy estimates. Therefore the choice of
compensation levels used in the model is critical. The total cost of salaries and benefits will drive the
total cost of any adequacy study.
Our analysis found that PJ studies typically rely on statewide average teacher salary and benefit rates
and apply them to the number of positions in each category as part of the total cost of adequacy. Cost of
living adjustments are often made to these averages to account for variation, as discussed in further
detail below. In some states (e.g., South Dakota 2008, Connecticut 2011), the PJ panels recommended
that the statewide averages be adjusted to be more competitive with other states. This cost was then
reflected in the final cost estimates. Benefit rates in PJ studies vary from state to state based upon
available data for the state or districts, but consistently are in the range of 23% to 35%.
EB studies similarly rely on state average salaries to estimate total costs. In early EB studies, average
benefit costs were also typically used. However, in recent studies the authors have noted that there is
substantial variation in the types of benefits paid to school district employees. This is mostly the result
of variation in health care costs. Other benefits such as retirement, Social Security, and Workers’
Compensation are typically funded based on a percentage of salary and thus straightforward to estimate
if the rates for those benefits are accurately measured. On the other hand, health benefits vary widely in
terms of both the level and the type of coverage as well as the number of family members covered.
Average costs are difficult to estimate. In one recent study, the 2014 North Dakota recalibration, study
consultants suggested estimating health care costs using the costs of providing health care for North
Dakota state employees. The average amount paid per employee (not a percentage) was used for health
care costs and added to the benefits component of compensation. While this approach is logical, the
higher cost of health insurance led to increased benefit rates, particularly for classified employees who
typically have relatively low salaries. While this approach may produce a more realistic estimate of the
cost of providing health care benefits, it suggests earlier estimates using an overall percentage of salary
figure may have potentially underestimated these costs in the past.

A Comprehensive Review of State Adequacy Studies Since 2003
23
Both EB and PJ studies develop models that have the capability of simulating various compensation
levels (typically allowing salary, percentage-based benefits and health care costs per employee to vary)
so that sensitivity analyses related to variation in the level of salary and benefits can be estimated.
The majority of studies, regardless of methodological approach, take into account the regional cost
differences in a particular state by applying, or suggesting, an index that adjusts education costs to
account for these differences. In some cases, the research team developed the index. For example, in
New Mexico, the research team estimated a Geographical Cost of Education Index (GCEI) to account for
differences in demand and salary for personnel. Likewise, the research team in Pennsylvania used a
Location Cost Metric (LCM) to reflect cost of living differences across the state. Many other studies rely
on the Comparable Wage Index that was developed with the support of the National Center for
Education Statistics and updated on an annual basis. The Wyoming study in 2005 developed a Hedonic
Wage Index to replace a Wyoming computed price index that was in use at the time. The two indexes
were “centered” at the state average, which meant that some districts actually received a negative
adjustment if the costs in their geographic area were less than the state average. A final compromise
provided each district with the higher of the two indexes, or a value of 1.0, whichever is higher. That
compromise remains the approach used in Wyoming today.
Table 2.2: Core Teachers
State Year Elementary Middle High School
Maryland 2001 21 22 22
Maryland 2001 33 (per school) 36 (per school) 69 (per school)
Arizona 2004 K-3: 15, 4-5: 25 6-8: 25 9-12: 25
Arkansas 2003 K-3: 15, 4-5: 25 6-8: 25 9-12: 25 Maximum of 150 per semester
Arkansas 2006 Kindergarten: 10; Grades 1-3: 23; Grades 4-12: 25
Grades 4-12: 25 Grades 4-12: 25
California 2006 NA NA NA
California 2007 K: 5.2; Gr 1-5: 21.9 (per school)
34.6 (per school) 52.4 (per school)
Colorado 2003 58 per 1,000 students 60.9 per 1,000 students
64.5 per 1,000 students
Colorado 2006 58 per 1,000 students 60.9 per 1,000 students
64.5 per 1,000 students
Colorado 2011 69.05 per 1,000 students
57.78 per 1,000 students
66 per 1,000 students
Colorado 2013 69.05 per 1,000 students
57.78 per 1,000 students
66 per 1,000 students
Connecticut 2005 57.1 per 1,000 students
47.6 per 1,000 students
64.3 per 1,000 students
D.C. 2013 24.3 (per school) 32 (per school) 53.3 (per school)
Illinois 2010 K-3rd Grade: 15, 4th- 4th-12th Grade: 25 4th-12th Grade: 25

A Comprehensive Review of State Adequacy Studies Since 2003
24
State Year Elementary Middle High School
12th Grade: 25
Kentucky 2003 K-3:15, 4-5: 25 25 25
Kentucky 2003 K-3: 15, 4-5: 20 20 20
Kentucky 2004 24 (per school) 27 (per school) 44.8 (per school)
Maine 2014 Preschool: 15, K-3: 15, 4-5: 25
25 25
Minnesota 2004 K: 4; Gr 1-5: 17.5 Total: 21.5 (per
school)
22.5 (per school) 34 (per school)
Minnesota 2006 K: 4; Gr 1-5: 17.5 Total: 21.5 (per
school)
22.5 (per school) 34 (per school)
Montana 2005 20 (per school) 13 (per school) 20 (per school)
Montana 2007 14 (per school) 5.8 (per school) 16.3 (per school)
Nevada 2006 35 (per school) 30(per school) 65 (per school)
New Jersey 2006 22 (per school) 43 (per school) 128 (per school)
New Jersey 2007 K-3: 17.8, 4-5: 5.3, Total: 23.1 (per
school)
24 (per school) 65.6 (per school)
New Mexico 2008 NA NA NA
New York 2004 15.7 (per school) 22.6 (per school) 24.3 (per school)
New York 2004 NA NA NA
North Dakota 2008 K-3: 15, 4-5: 25 6-8: 25 9-12: 25
North Dakota 2014 K-3: 15, 4-5: 25 6-8: 25 9-12: 25
Ohio 2009 K-3: 15, 4-5: 25 25 25
Pennsylvania 2007 NA NA NA
Rhode Island 2007 16 (per school) 31.5 (per school) 52 (per school)
South Dakota 2006 12 (per school) 11 (per school) 18.5 (per school)
Tennessee 2004 19 (per school) 20 (per school) 40.5 (per school)
Texas 2012 K-3: 15, 4-5: 25 6-8: 25 9-12: 25
Washington 2006 K-3: 15, 4-5: 25 6-8: 25 9-12: 25
Washington 2006 NA NA NA
Wisconsin 2007 K-3: 15, 4-5: 25 6-8: 25 9-12: 25
Wyoming 2005 16 21 21
Wyoming 2010 16 21 21
Note: Values in each cell represent a ratio unless otherwise noted

A Comprehensive Review of State Adequacy Studies Since 2003
25
Table 2.3: Elective Teachers
State Year Elementary Middle High School
Maryland 2001 12.25 13 20
Maryland 2001 6 (per school) 9 (per school) Included with core
Arizona 2004 20% of core 20% of core 33% of core
Arkansas 2003 20% of core 20% of core 20% of core
Arkansas 2006 20% of core 20% of core 20% of core
California 2006 NA NA NA
California 2007 2.2 14.2 40
Colorado 2003 13 per 1,000 students 20 per 1,000 students 23.7 per 1,000 students
Colorado 2006 13 per 1,000 students 20 per 1,000 students 23.7 per 1,000 students
Colorado 2011 Included with core Included with core Included with core
Colorado 2013 Included with core Included with core Included with core
Connecticut 2005 11.9 per 1,000 students
28.6 per 1,000 students
Included with core
D.C. 2013 4 Included with core Included with core
Illinois 2010 20% over core teachers
20% over core teachers
33% over core teachers
Kentucky 2003 20% of core 20% of core 20% of core
Kentucky 2003 20% of core 20% of core 20% of core
Kentucky 2004 5.8 6.4 14
Maine 2014 20% of core 20% of core 33% of core
Minnesota 2004 3 1 1
Minnesota 2006 3 1 1
Montana 2005 Included with core Included with core Included with core
Montana 2007 4.5 2.8 1.5
Nevada 2006 5 6 Included with core
New Jersey 2006 20% of core 20% of core 30% of core
New Jersey 2007 20% of core 20% of core 30% of core
New Mexico 2008 NA NA NA
New York 2004 Included with core Included with core Included with core
New York 2004 NA NA NA
North Dakota 2008 20% of core 20% of core 33% of core
North Dakota 2014 20% of core 20% of core 1/3 of core
Ohio 2009 20% (same) 20% (same) 25% (33%)
Pennsylvania 2007 NA NA NA
Rhode Island 2007 3.125 11.5 8.5
South Dakota 2006 3.5 2.5 Included with core
Tennessee 2004 3 6.5 26
Texas 2012 20% of core 20% of core 33% of core

A Comprehensive Review of State Adequacy Studies Since 2003
26
State Year Elementary Middle High School
Washington 2006 20% of core 20% of core 33% of core
Washington 2006 NA NA NA
Wisconsin 2007 20% of core 20% of core 33% of core
Wyoming 2005 20% of core 20% of core 20% of core
Wyoming 2010 20% of core 20% of core 33% of core
Table 2.4: Instructional Coaches
State Year Elementary Middle High School
Maryland 2001 not included not included not included
Maryland 2001 not included not included not included
Arizona 2004 2.5 2.5 2.5
Arkansas 2003 2.5 2.5 2.5
Arkansas 2006 Minimum: 2.0; $270.95/pupil
(schools may use up to .05 for Asst
Principals
Minimum: 2.0; $270.95/pupil
(schools may use up to .05 for Asst
Principals
Minimum: 2.0; $270.95/pupil
(schools may use up to .05 for Asst
Principals
California 2006 NA NA NA
California 2007 1.4 3.1 4.1
Colorado 2003 not included not included not included
Colorado 2006 not included not included not included
Colorado 2011 2.38 per 1,000 students
2 per 1,000 students 2 per 1,000 students
Colorado 2013 2.38 per 1,000 students
2 per 1,000 students 2 per 1,000 students
Connecticut 2005 not included not included not included
D.C. 2013 1 2 2
Illinois 2010 1 per 200 students 1 per 200 students 1 per 200 students
Kentucky 2003 2.5 full time instructional
facilitators with a minimum of 1
2.5 full time instructional
facilitators with a minimum of 1
2.5 full time instructional
facilitators with a minimum of 1
Kentucky 2003 1 1 2
Kentucky 2004 0.5 0.5 1
Maine 2014 1 instructional coach for every 200 students
1 instructional coach for every 200
students
1 instructional coach for every 200
students
Minnesota 2004 NA NA NA
Minnesota 2006 NA NA NA

A Comprehensive Review of State Adequacy Studies Since 2003
27
State Year Elementary Middle High School
Montana 2005 not included not included not included
Montana 2007 included in Specialist teachers
included in Specialist teachers
included in Specialist teachers
Nevada 2006 3 3 4
New Jersey 2006 0 0 0
New Jersey 2007 2 3 8.2
New Mexico 2008 NA NA NA
New York 2004 NA NA NA
New York 2004 NA NA NA
North Dakota 2008 2.2 2.3 3
North Dakota 2014 2.25 2.25 3
Ohio 2009 One for each organizational unit (One for every 200
students)
One for each organizational unit (One for every 200
students)
One for each organizational unit (One for every 200
students)
Pennsylvania 2007 NA NA NA
Rhode Island 2007 not included not included not included
South Dakota 2006 not included not included not included
Tennessee 2004 not included not included not included
Texas 2012 1 per 200 students: 2.25
1 per 200 students: 2.25
1 per 200 students: 3.0
Washington 2006 2.2 2.25 3
Washington 2006 NA NA NA
Wisconsin 2007 2.2 2.25 3
Wyoming 2005 1.5 1.5 3
Wyoming 2010 1.5 1.5 1.5
Table 2.5: Special Education Weights
State Year Special Education Weight
Maryland 2001 not included in study
Maryland 2001 1.17
Colorado 2003 1.15
Colorado 2006 1.15
Colorado 2011 .93 for mild; 1.93 for moderate; 5.2 for severe
Colorado 2013 .93 for mild; 1.93 for moderate; 5.2 for severe
Connecticut 2005 .987 for mild; 1.540 for moderate; 4.182 for severe

A Comprehensive Review of State Adequacy Studies Since 2003
28
State Year Special Education Weight
D.C. 2013 Level 1: .88; Level 2: 1.08; Level 3: 1.77; Level 4: 3.13
Kentucky 2004 1.23
Minnesota 2006 1
Montana 2007 .77 for mild; 1.32 for moderate; 2.93 for severe
Nevada 2006 .88 for mild; 1.28 for moderate; 2.52 for severe
Pennsylvania 2007 1.3
South Dakota
2006 .94 for mild, 1.86 for moderate; 4.21 for severe
Tennessee 2004 .5 for mild; 1 for moderate; 3.45 for severe
Table 2.6: At Risk Students
State Year Elementary Middle High School
Maryland 2001 $364 per pupil $203 per pupil $181 per pupil
Maryland 2001 $9,165 per pupil (at-risk weight)
$9,165 per pupil (at-risk weight)
$9,165 per pupil (at-risk weight)
Arizona 2004 EB* EB* EB*
Arkansas 2003 EB* EB* EB*
Arkansas 2006 EB* EB* EB*
California 2006 NA NA NA
California 2007 NA NA NA
Colorado 2003 $3,146 per pupil (at-risk weight)
$2,204 per pupil (at-risk weight)
$2,430 per pupil (at-risk weight)
Colorado 2006 $3,146 per pupil (at-risk weight)
$2,204 per pupil (at-risk weight)
$2,430 per pupil (at-risk weight)
Colorado 2011 1.68 additional staff, depending on district
size, for low concentration (20%)
at risk; 1.88 for moderate
concentration (40%) at risk; 2.25 for high concentration (60%)
at risk
3.36 additional staff, depending on district
size, for low concentration (20%)
at risk; 3.8 for moderate
concentration (40%) at risk; 4.59 for high concentration (60%)
at risk
5.04 additional staff, depending on district
size, for low concentration (20%)
at risk; 5.47 for moderate
concentration (40%) at risk; 7.05 for high concentration (60%)
at risk

A Comprehensive Review of State Adequacy Studies Since 2003
29
State Year Elementary Middle High School
Colorado 2013 1.68 additional staff, depending on district
size, for low concentration (20%)
at risk; 1.88 for moderate
concentration (40%) at risk; 2.25 for high concentration (60%)
at risk
3.36 additional staff, depending on district
size, for low concentration (20%)
at risk; 3.8 for moderate
concentration (40%) at risk; 4.59 for high concentration (60%)
at risk
5.04 additional staff, depending on district
size, for low concentration (20%)
at risk; 5.47 for moderate
concentration (40%) at risk; 7.05 for high concentration (60%)
at risk
Connecticut 2005 2 teachers, 2 aides, and 2 tutors for
moderate concentration at-risk
6 tutors for moderate concentration at-risk
2 teachers
D.C. 2013 2.9 teachers, 3 instructional aides,
2.5 support staff
7.5 teachers, 3.6 intervention teachers,
3.6 pupil support
12.4 teachers, 6 intervention teachers,
6 pupil support, 2 security personnel
Illinois 2010 EB* EB* EB*
Kentucky 2003 EB* EB* EB*
Kentucky 2003 EB* EB* EB*
Kentucky 2004 4 9 10
Maine 2014 NA NA NA
Minnesota 2004 NA NA NA
Minnesota 2006 NA NA NA
Montana 2005 $1,193 per pupil $1,789 per pupil $2,385 per pupil
Montana 2007 NA NA NA
Nevada 2006 3 teachers, 1 pupil support, .8
instructional facilitator, .2 tutor, .5
parent liaison, .3 clinical aide
2 teachers, 1 pupil support, .8
instructional facilitator, 1 parent
liaison, .3 clinical aide
1 instructional aide, .8 instructional
facilitator, 2 tutors, 1 parent liaison, .3
clinical aide
New Jersey 2006 40% 160** 40% 240** 40% 656**
New Jersey 2007 40% 160** 40% 240** 40% 656*
New Mexico 2008 NA NA NA
New York 2004 NA NA NA
New York 2004 NA NA NA
North Dakota 2008 EB* EB* EB*
North Dakota 2014 EB* EB* EB*
Ohio 2009 EB* EB* EB*
Pennsylvania 2007 NA NA NA
Rhode Island 2007 NA NA NA
South Dakota 2006 2 teachers, 4 aides, .5 2 teachers, 4 aides, .4 1 teacher, .5 pupil

A Comprehensive Review of State Adequacy Studies Since 2003
30
State Year Elementary Middle High School
pupil support pupil support support
Tennessee 2004 2 teachers, .75 aides 4 teachers, 3 aides 5 teachers, 5 aides, 1 pupil support
Texas 2012 NA NA NA
Washington 2006 EB* EB* EB*
Washington 2006 EB* EB* EB*
Wisconsin 2007 EB* EB* EB*
Wyoming 2005 EB* EB* EB*
Wyoming 2010 EB* EB* EB*
*Evidence Based Studies provide resources for tutors, pupil support personnel, summer school, extended day, and ELL programs to serve at risk students. Each of these categories is included in subsequent tables. ** Second number reported for New Jersey studies represents school size.
Table 2.7: Summer School
State Year Elementary Middle High School
Maryland 2001 not included not included not included
Maryland 2001 not included not included not included
Arizona 2004 not included not included not included
Arkansas 2003 existing amounts carried forward
existing amounts carried forward
existing amounts carried forward
Arkansas 2006 3.33 FTE per 100 at-risk students, paid at 25% of salary, which is equivalent to 1 FTE
per 120 at-risk students
3.33 FTE per 100 at-risk students, paid at 25% of salary, which is equivalent to 1 FTE
per 120 at-risk students
3.33 FTE per 100 at-risk students, paid at 25% of salary, which is equivalent to 1 FTE
per 120 at-risk students
California 2006 NA NA NA
California 2007 For 120 students For 271 students For 599 students
Colorado 2003 $177 per pupil $157 per pupil $35 per pupil
Colorado 2006 $177 per pupil $157 per pupil $35 per pupil
Colorado 2011 NA NA NA
Colorado 2013 NA NA NA
Connecticut 2005 included in At-Risk resources
included in At-Risk resources
included in At-Risk resources

A Comprehensive Review of State Adequacy Studies Since 2003
31
State Year Elementary Middle High School
D.C. 2013 100% of at-risk students for 6 weeks full day, K-3 at 15:1
teacher ratio, all others 20:1 teacher
ratio, 1 social worker, 2 instructional aides, 1 security personnel, plus $500 per pupil
for interventions
100% of at-risk students for 6-8
weeks full day, 30:1 teacher ratio, 1 social
worker, 1 security personnel, plus $500
per pupil for interventions
100% of at-risk students for 6-8
weeks full day, 30:1 teacher ratio, 2
security personnel, plus $100 per pupil for Summer Bridge
for 9th graders; Summer Enrichment
for all, 4 weeks, 3 hours, 4 days per
week, 20:1 teacher ratio
Illinois 2010 15:1 for half of the students who qualify for free or reduced-
price lunch (FRL)
15:1 for half of the students who qualify for free or reduced-
price lunch (FRL)
15:1 for half of the students who qualify for free or reduced-
price lunch (FRL)
Kentucky 2003 not included not included not included
Kentucky 2003 not included not included not included
Kentucky 2004 included in At-Risk resources
included in At-Risk resources
included in At-Risk resources
Maine 2014 3.33 FTE per 100 at-risk students, paid at 25% of salary, which is equivalent to 1 FTE
per 120 at-risk students
3.33 FTE per 100 at-risk students, paid at 25% of salary, which is equivalent to 1 FTE
per 120 at-risk students
3.33 FTE per 100 at-risk students, paid at 25% of salary, which is equivalent to 1 FTE
per 120 at-risk students
Minnesota 2004 NA NA NA
Minnesota 2006 NA NA NA
Montana 2005 $400 per pupil not meeting proficiency
$400 per pupil not meeting proficiency
$400 per pupil not meeting proficiency
Montana 2007 not included separately
not included separately
not included separately
Nevada 2006 included in At-Risk resources
included in At-Risk resources
included in At-Risk resources
New Jersey 2006 1.5 (extended school year)
1.5 (extended school year)
1.5 (extended school year)
New Jersey 2007 1.3 2 5.5
New Mexico 2008 NA NA NA
New York 2004 NA NA NA
New York 2004 NA NA NA
North Dakota 2008 3.33 FTE per 100 at- 3.33 FTE per 100 at- 3.33 FTE per 100 at-

A Comprehensive Review of State Adequacy Studies Since 2003
32
State Year Elementary Middle High School
risk students, paid at 25% of salary, which is equivalent to 1 FTE
per 120 at-risk students
risk students, paid at 25% of salary, which is equivalent to 1 FTE
per 120 at-risk students
risk students, paid at 25% of salary, which is equivalent to 1 FTE
per 120 at-risk students
North Dakota 2014 3.33 FTE per 100 at-risk students, paid at 25% of salary, which is equivalent to 1 FTE
per 120 at-risk students
3.33 FTE per 100 at-risk students, paid at 25% of salary, which is equivalent to 1 FTE
per 120 at-risk students
3.33 FTE per 100 at-risk students, paid at 25% of salary, which is equivalent to 1 FTE
per 120 at-risk students
Ohio 2009 $3,000 per summer teacher. Number of summer teachers is based on half the
number of economically
disadvantaged children with a class
size of 30 (.25 FTE certified teachers for
1/2 of students in poverty with a class
size of 15)
$3,000 per summer teacher. Number of summer teachers is based on half the
number of economically
disadvantaged children with a class
size of 30 (.25 FTE certified teachers for
1/2 of students in poverty with a class
size of 15)
$3,000 per summer teacher. Number of summer teachers is based on half the
number of economically
disadvantaged children with a class
size of 30 (.25 FTE certified teachers for
1/2 of students in poverty with a class
size of 15)
Pennsylvania 2007 NA NA NA
Rhode Island 2007 NA NA NA
South Dakota 2006 included in At-Risk resources
included in At-Risk resources
included in At-Risk resources
Tennessee 2004 not included not included not included
Texas 2012 3.33 FTE per 100 at-risk students, paid at 25% of salary, which is equivalent to 1 FTE
per 120 at-risk students
3.33 FTE per 100 at-risk students, paid at 25% of salary, which is equivalent to 1 FTE
per 120 at-risk students
3.33 FTE per 100 at-risk students, paid at 25% of salary, which is equivalent to 1 FTE
per 120 at-risk students
Washington 2006 1.3 1.35 1.8
Washington 2006 NA NA NA
Wisconsin 2007 1.1 1.125 1.5
Wyoming 2005 0.25 teacher positions for every 15
summer students
0.25 teacher positions for every 15
summer students
0.25 teacher positions for every 15
summer students
Wyoming 2010 0.25 teacher positions for every 30
at-risk students
0.25 teacher positions for every 30
at-risk students
0.25 teacher positions for every 30
at-risk students

A Comprehensive Review of State Adequacy Studies Since 2003
33
Table 2.8: Extended Day Programs
State Year Elementary Middle High School
Maryland 2001 not included not included not included
Maryland 2001 not included not included not included
Arizona 2004 not included not included not included
Arkansas 2003 not included not included not included
Arkansas 2006 3.33 FTE per 100 at-risk students, paid at 25% of salary, which is equivalent to 1 FTE
per 120 at-risk students
3.33 FTE per 100 at-risk students, paid at 25% of salary, which is equivalent to 1 FTE
per 120 at-risk students
3.33 FTE per 100 at-risk students, paid at 25% of salary, which is equivalent to 1 FTE
per 120 at-risk students
California 2006 NA NA NA
California 2007 41 teacher hours/week
133 teacher hours/week
154 teacher hours/week
Colorado 2003 $237 per pupil $437 per pupil $190 per pupil
Colorado 2006 $237 per pupil $437 per pupil $190 per pupil
Colorado 2011 NA NA NA
Colorado 2013 NA NA NA
Connecticut 2005 included in At-Risk resources
included in At-Risk resources
included in At-Risk resources
D.C. 2013 100% of at-risk students for 2.5
hours, 25:1 teacher ratio, .5 coordination personnel, plus $165
per pupil for materials
100% of at-risk students for 2 hours, 30:1 teacher ratio, .5
coordination personnel
100% of at-risk students for 2 hours, 30:1 teacher ratio, 1
coordination personnel
Illinois 2010 15:1 for half of the students who qualify for free or reduced-
price lunch (FRL)
15:1 for half of the students who qualify for free or reduced-
price lunch (FRL)
15:1 for half of the students who qualify for free or reduced-
price lunch (FRL)
Kentucky 2003 not included not included not included
Kentucky 2003 not included not included not included
Kentucky 2004 included in At-Risk resources
included in At-Risk resources
included in At-Risk resources
Maine 2014 3.33 FTE per 100 at-risk students, paid at 25% of salary, which is equivalent to 1 FTE
per 120 at-risk students
3.33 FTE per 100 at-risk students, paid at 25% of salary, which is equivalent to 1 FTE
per 120 at-risk students
3.33 FTE per 100 at-risk students, paid at 25% of salary, which is equivalent to 1 FTE
per 120 at-risk students
Minnesota 2004 NA NA NA

A Comprehensive Review of State Adequacy Studies Since 2003
34
State Year Elementary Middle High School
Minnesota 2006 NA NA NA
Montana 2005 $400 per pupil not meeting proficiency
$400 per pupil not meeting proficiency
$400 per pupil not meeting proficiency
Montana 2007 not included separately
not included separately
not included separately
Nevada 2006 included in At-Risk resources
included in At-Risk resources
included in At-Risk resources
New Jersey 2006 1.5 3 6
New Jersey 2007 1.3 2 5.5
New Mexico 2008 NA NA NA
New York 2004 NA NA NA
New York 2004 NA NA NA
North Dakota 2008 1.5 at-risk weight 1.5 at-risk weight 2.1 at-risk weight
North Dakota 2014 3.33 FTE per 100 at-risk students, paid at 25% of salary, which is equivalent to 1 FTE
per 120 at-risk students
3.33 FTE per 100 at-risk students, paid at 25% of salary, which is equivalent to 1 FTE
per 120 at-risk students
3.33 FTE per 100 at-risk students, paid at 25% of salary, which is equivalent to 1 FTE
per 120 at-risk students
Ohio 2009 Part of responsibility of tutors for
struggling students (.25 FTE certified
teachers for 1/2 of students in poverty with a class size of
15)
Part of responsibility of tutors for
struggling students (.25 FTE certified
teachers for 1/2 of students in poverty with a class size of
15)
Part of responsibility of tutors for
struggling students (.25 FTE certified
teachers for 1/2 of students in poverty with a class size of
15)
Pennsylvania 2007 NA NA NA
Rhode Island 2007 NA NA NA
South Dakota 2006 included in At-Risk resources
included in At-Risk resources
included in At-Risk resources
Tennessee 2004 not included not included not included
Texas 2012 3.33 FTE per 100 at-risk students, paid at 25% of salary, which is equivalent to 1 FTE
per 120 at-risk students
3.33 FTE per 100 at-risk students, paid at 25% of salary, which is equivalent to 1 FTE
per 120 at-risk students
3.33 FTE per 100 at-risk students, paid at 25% of salary, which is equivalent to 1 FTE
per 120 at-risk students
Washington 2006 1.3 1.35 1.8
Washington 2006 NA NA NA
Wisconsin 2007 1.1 1.125 1.5
Wyoming 2005 0.25 teacher positions for every 15
extended-day
0.25 teacher positions for every 15
extended-day
0.25 teacher positions for every 15
extended-day

A Comprehensive Review of State Adequacy Studies Since 2003
35
State Year Elementary Middle High School
students students students
Wyoming 2010 0.25 teacher positions for every 30
at-risk students
0.25 teacher positions for every 30
at-risk students
0.25 teacher positions for every 30
at-risk students
Table 2.9: Tutors
State Year Elementary Middle High School
Maryland 2001 NA NA NA
Maryland 2001 500 800 1,000
Arizona 2004 1/each 20% poverty or one for every 100
poverty students
1/each 20% poverty or one for every 100
poverty students
1/each 20% poverty or one for every 100
poverty students
Arkansas 2003 1/each 20% poverty or one for every 100
poverty students
1/each 20% poverty or one for every 100
poverty students
1/each 20% poverty or one for every 100
poverty students
Arkansas 2006 1 Teacher for every 100 NSL students*
1 Teacher for every 100 NSL students*
1 Teacher for every 100 NSL students*
California 2006 NA NA NA
California 2007 Not included Not included Not included
Colorado 2003 NA NA NA
Colorado 2006 NA NA NA
Colorado 2011 NA NA NA
Colorado 2013 NA NA NA
Connecticut 2005 NA 3 4
D.C. 2013 NA NA NA
Illinois 2010 Minimum of 1 per prototypical school or 1 for every 100
students who qualify for FRL, whichever is
greater
Minimum of 1 per prototypical school or 1 for every 100
students who qualify for FRL, whichever is
greater
Minimum of 1 per prototypical school or 1 for every 100
students who qualify for FRL, whichever is
greater
Kentucky 2003 1 for each 20% students from low
income background with a minimum of 1
1 for each 20% students from low
income background with a minimum of 1
1 for each 20% students from low
income background with a minimum of 1
Kentucky 2003 2 Professional tutor types, 2 learning support for K-3, 2
support for 4-5, one speech/hearing
specialist, Total of 7
7 learning support personnel, one for
each of the 6 teams plus 1 floating certified staff
member and a 1/2
8 includes GATE

A Comprehensive Review of State Adequacy Studies Since 2003
36
State Year Elementary Middle High School
certified personnel to handle mild and
moderate disabilities and struggling
students. Number of tutors to vary by %
poverty; minimum of one, maximum of 4.
time speech/hearing specialist. If more
than 75% of students in poverty, one more
reading specialist.
Kentucky 2004 NA NA NA
Maine 2014 1 FTE per 100 FRL students
1 FTE per 100 FRL students
1 FTE per 100 FRL students
Minnesota 2004 NA NA NA
Minnesota 2006 NA NA NA
Montana 2005 see At-risk see At-risk see At-risk
Montana 2007 1 teacher and 4 paraprofessionals
1 teacher and 2 paraprofessionals
1.5 teachers and 3 paraprofessionals
Nevada 2006 1 3 2
New Jersey 2006 8 6 8
New Jersey 2007 1.6 2.4 6.6
New Mexico 2008 NA NA NA
New York 2004 NA NA NA
New York 2004 NA NA NA
North Dakota 2008 1.0 and an additional 1.0 for every 125 at-
risk students
1.0 and an additional 1.0 for every 125 at-
risk students
1.0 and an additional 1.0 for every 125 at-
risk students
North Dakota 2014 1.0 and an additional 1.0 for every 125 at-
risk students
1.0 and an additional 1.0 for every 125 at-
risk students
1.0 and an additional 1.0 for every 125 at-
risk students
Ohio 2009 1 certified teacher for every 100
students in poverty. Also expected to
provide assistance with extended-day
instruction and tutoring (1 certified
teacher for every 100 students in poverty)
1 certified teacher for every 100
students in poverty. Also expected to
provide assistance with extended-day
instruction and tutoring (1 certified
teacher for every 100 students in poverty)
1 certified teacher for every 100
students in poverty. Also expected to
provide assistance with extended-day
instruction and tutoring (1 certified
teacher for every 100 students in poverty)
Pennsylvania 2007 NA NA NA
Rhode Island 2007 NA NA NA
South Dakota 2006 NA NA NA
Tennessee 2004 NA NA NA
Texas 2012 1 teacher for every 100 ED students
2 teacher for every 100 ED students
3 teacher for every 100 ED students

A Comprehensive Review of State Adequacy Studies Since 2003
37
State Year Elementary Middle High School
Washington 2006 one for every 100 poverty students:
1.55
one for every 100 poverty students:
1.62
one for every 100 poverty students:
2.16
Washington 2006
Wisconsin 2007 1 for every 100 poverty students
(1.30)
1 for every 100 poverty students
(1.35)
1 for every 100 poverty students
(1.8)
Wyoming 2005 1 FTE teacher tutor for every 100 "at-
risk" students
1 FTE teacher tutor for every 100 "at-
risk" students
1 FTE teacher tutor for every 100 "at-
risk" students
Wyoming 2010 1 FTE teacher tutor for every 100 "at-
risk" students
1 FTE teacher tutor for every 100 "at-
risk" students
1 FTE teacher tutor for every 100 "at-
risk" students *Arkansas refers to its Free and Reduced Price Lunch program as the National School Lunch (NSL) program
Table 2.10: Pupil Support
State Year Elementary Middle High School
Maryland 2001 Not specified Not specified Not specified
Maryland 2001 2 Counselors, 1 Nurse, 1 Health
Technician, 2 Psychologists
4 Counselors, 1 Nurse, 1 Health
Technician, 1 Psychologist, 1 Juvenile Service Worker, 1 Social
Worker
5 Counselors, 2 Nurses, 1 Social
Worker
Arizona 2004 1/each 20% poverty or 1 for every 100 poverty students
1 for every 100 poverty students plus
1.0 guidance
1 for every 100 poverty students plus
2.0 guidance
Arkansas 2003 1/each 20% poverty or 1 for every 100 poverty students
1 for every 100 poverty students plus
1.0 guidance
1 for every 100 poverty students plus
2.0 guidance
Arkansas 2006 1 Teacher for every 100 NSL
1 Teacher for every 100 NSL
1 Teacher for every 100 NSL
California 2006 NA NA NA
California 2007 1.9 4.9 8.4
Colorado 2003 Guidance counselors: 2.9; Nurse: 1.9 per
Guidance counselors:2.9;
Nurse: 1.9
Guidance counselors: 4.3; Nurse: 1.4
Colorado 2006 Guidance counselors: 2.9; Nurse: 1.9 per
Guidance counselors:2.9;
Nurse: 1.9
Guidance counselors: 4.3; Nurse: 1.4

A Comprehensive Review of State Adequacy Studies Since 2003
38
State Year Elementary Middle High School
Colorado 2011 Counselors: 2.38; Nurse: 1.19 ;
Psychologist: 1.19; Health Aide: 1.19
Counselors: 4.44 ; Nurse: 2.22 ;
Psychologist: .44 ; Social Worker: .44
Counselors: 4; Nurse: 2; Psychologist: .50; Social Worker: .50;
Health Aide: .50
Colorado 2013 Counselors: 2.38; Nurse: 1.19 ;
Psychologist: 1.19; Health Aide: 1.19
Counselors: 4.44 ; Nurse: 2.22 ;
Psychologist: .44 ; Social Worker: .44
Counselors: 4; Nurse: 2; Psychologist: .50; Social Worker: .50;
Health Aide: .50
Connecticut 2005 2.9 per 1,000 students
5.7 per 1,000 students
7.1 per 1,000 students
D.C. 2013 2.5 3.9 10
Illinois 2010 1 for every 100 students who qualify for free or reduced-
price lunch
1 for every 100 students who qualify for free or reduced-price lunch, plus 1
guidance counselor for every 250
students
1 for every 100 students who qualify for free or reduced-price lunch, plus 1
guidance counselor for every 250
students
Kentucky 2003 1 for each 20-25% students from low-income background with a minimum of 1
1 for each 20-25% students from low-income background with a minimum of 1
1 for each 20-25% students from low-income background with a minimum of 1
Kentucky 2003 3 positions to cover health, guidance and coordination for the
family resource center
4.5 to cover guidance services, health services, social
worker/psychologist, security, and
family/youth services
8 positions for guidance, youth
services, athletics, family outreach,
dropout prevention services, attendance,
security, etc.
Kentucky 2004 4 5 7
Maine 2014 1 FTE per 100 FRL students
1 FTE per 100 FRL students
1 FTE per 100 FRL students
Minnesota 2004 1 (10th percentile special needs) and 2
(90th percentile special needs)
2.7 (10th percentile special needs) and
4.5 (90th percentile special needs)
4.1 (10th percentile special needs) and
6.5 (90th percentile special needs)
Minnesota 2006 1 (10th percentile special needs) and 2
(90th percentile special needs)
2.7 (10th percentile special needs) and
4.5 (90th percentile special needs)
4.1 (10th percentile special needs) and
6.5 (90th percentile special needs)
Montana 2005 2.33 1.83 1.83
Montana 2007 1 plus 1 per 80 at risk .6 plus 1 per 46 at risk 1.2 plus 1.3 per 93 at risk
Nevada 2006 2.4 3.4 5.5

A Comprehensive Review of State Adequacy Studies Since 2003
39
State Year Elementary Middle High School
New Jersey 2006 7 10.5 including extended school year
19.9 including extended school year
New Jersey 2007 1 for every 100 poverty students: 1.6
1 for every 100 poverty students plus
1.0 guidance/250 students 4.8 total
1 for every 100 poverty students plus
1.0 guidance/250 students 11.1 total
New Mexico 2008 NA NA NA
New York 2004 NA NA NA
New York 2004 NA NA NA
North Dakota 2008 1 Guidance counselor plus 1 pupil support
staff position for every 125 at-risk students; At-risk
weight=.13
1 Guidance Counselor per 250 students plus 1 Pupil Support Staff
Position for every 125 at-risk students; At-
risk weight=.13
1 Guidance Counselor per 250 students plus 1 Pupil Support Staff
Position for every 125 at-risk students; At-
risk weight=.13
North Dakota 2014 1 Guidance Counselor per 450 students (1) & 1 Nurse per 750
students plus 1 Pupil Support Staff Position for every 125 at-risk
students
1 Guidance Counselor per 250 students (1.8)
& 1 Nurse per 750 students plus 1 Pupil
Support Staff Position for every 125 at-risk
students
1 Guidance Counselor per 250 students (2.4)
& 1 Nurse per 750 students plus 1 Pupil
Support Staff Position for every 125 at-risk
students
Ohio 2009 1 for every 75 economically
disadvantaged students (1 for every
100 students in poverty)
1 for every 75 economically
disadvantaged students (1 for every
100 students in poverty)
1 for every 75 economically
disadvantaged students (1 for every
100 students in poverty)
Pennsylvania 2007 NA NA NA
Rhode Island 2007 4.75 8.375 8.37
South Dakota 2006 0.8 1.25 1.25
Tennessee 2004 2.1 4 4.5
Texas 2012 Counselors: 1 (per state statute); Nurse:
1/750 students
Counselors: 1.0 /250 students; Nurse: 1/750 students
Counselors: 1 (per state statute); Nurse:
1/750 students
Washington 2006 1 for every 100 poverty students
1 for every 100 poverty students plus
1.0 guidance/250 students
1 for every 100 poverty students plus
1.0 guidance/250 students
Washington 2006 NA NA NA
Wisconsin 2007 1 for every 100 poverty students
1 for every 100 poverty students plus
1.0 guidance/250 students
1 for every 100 poverty students plus
1.0 guidance/250 students

A Comprehensive Review of State Adequacy Studies Since 2003
40
State Year Elementary Middle High School
Wyoming 2005 1.0 FTE positions for every 100 at-risk
students
1 for every 100 at-risk students plus 1.0
guidance counselor for every 250
students
1 for every 100 at-risk students plus 1.0
guidance counselor for every 250
students
Wyoming 2010 1.0 FTE positions for every 100 at-risk
students
1 for every 100 at-risk students plus 1.0
guidance counselor for every 250
students
1 for every 100 at-risk students plus 1.0
guidance counselor for every 250
students
Table 2.11: ELL
State Year Elementary Middle High School
Maryland 2001 not included in study not included in study not included in study
Maryland 2001 $6,612 per pupil (ELL
weight of 1.0) $6,612 per pupil (ELL
weight of 1.0) $6,612 per pupil (ELL
weight of 1.0)
Arizona 2004 An additional .4 teachers for every
100 ELL/LEP students who are also from a
poverty family
An additional .4 teachers for every
100 ELL/LEP students who are also from a
poverty family
An additional .4 teachers for every
100 ELL/LEP students who are also from a
poverty family
Arkansas 2003 An additional 0.4 teachers for every
100 ELL/LEP students who are also from a
poverty family
An additional 0.4 teachers for every
100 ELL/LEP students who are also from a
poverty family
An additional 0.4 teachers for every
100 ELL/LEP students who are also from a
poverty family
Arkansas 2006 1 Teacher for every 100 ELL
1 Teacher for every 100 ELL
1 Teacher for every 100 ELL
Colorado 2003 $3,191 per pupil $2,859 per pupil $4,049 per pupil
California 2006 NA NA NA
California 2007 Not included Not included Not included
Colorado 2006 $3,191 per pupil $2,859 per pupil $4,049 per pupil
Colorado 2011 1.76 2.36 2.62
Colorado 2013 1.76 2.36 2.62
Connecticut 2005 ELL weight ELL weight ELL weight
D.C. 2013 2 teachers, .4 pupil support, .1 ELL
coordinator
2.8 teachers, .5 instructional aides, .4 pupil support, .1 ELL
coordinator
4.7 teachers, .6 instructional aides, .9 pupil support,.2 ELL
coordinator
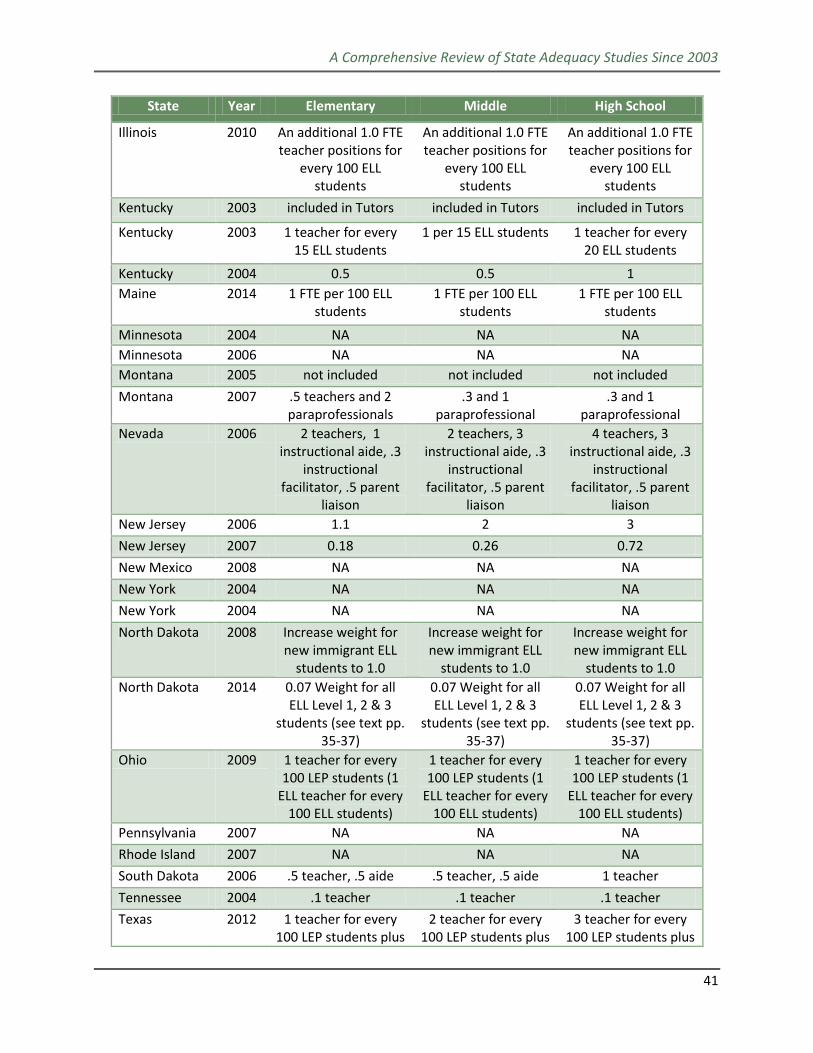
A Comprehensive Review of State Adequacy Studies Since 2003
41
State Year Elementary Middle High School
Illinois 2010 An additional 1.0 FTE teacher positions for
every 100 ELL students
An additional 1.0 FTE teacher positions for
every 100 ELL students
An additional 1.0 FTE teacher positions for
every 100 ELL students
Kentucky 2003 included in Tutors included in Tutors included in Tutors
Kentucky 2003 1 teacher for every 15 ELL students
1 per 15 ELL students 1 teacher for every 20 ELL students
Kentucky 2004 0.5 0.5 1
Maine 2014 1 FTE per 100 ELL students
1 FTE per 100 ELL students
1 FTE per 100 ELL students
Minnesota 2004 NA NA NA
Minnesota 2006 NA NA NA
Montana 2005 not included not included not included
Montana 2007 .5 teachers and 2 paraprofessionals
.3 and 1 paraprofessional
.3 and 1 paraprofessional
Nevada 2006 2 teachers, 1 instructional aide, .3
instructional facilitator, .5 parent
liaison
2 teachers, 3 instructional aide, .3
instructional facilitator, .5 parent
liaison
4 teachers, 3 instructional aide, .3
instructional facilitator, .5 parent
liaison
New Jersey 2006 1.1 2 3
New Jersey 2007 0.18 0.26 0.72
New Mexico 2008 NA NA NA
New York 2004 NA NA NA
New York 2004 NA NA NA
North Dakota 2008 Increase weight for new immigrant ELL
students to 1.0
Increase weight for new immigrant ELL
students to 1.0
Increase weight for new immigrant ELL
students to 1.0
North Dakota 2014 0.07 Weight for all ELL Level 1, 2 & 3
students (see text pp. 35-37)
0.07 Weight for all ELL Level 1, 2 & 3
students (see text pp. 35-37)
0.07 Weight for all ELL Level 1, 2 & 3
students (see text pp. 35-37)
Ohio 2009 1 teacher for every 100 LEP students (1
ELL teacher for every 100 ELL students)
1 teacher for every 100 LEP students (1
ELL teacher for every 100 ELL students)
1 teacher for every 100 LEP students (1
ELL teacher for every 100 ELL students)
Pennsylvania 2007 NA NA NA
Rhode Island 2007 NA NA NA
South Dakota 2006 .5 teacher, .5 aide .5 teacher, .5 aide 1 teacher
Tennessee 2004 .1 teacher .1 teacher .1 teacher
Texas 2012 1 teacher for every 100 LEP students plus
2 teacher for every 100 LEP students plus
3 teacher for every 100 LEP students plus

A Comprehensive Review of State Adequacy Studies Since 2003
42
State Year Elementary Middle High School
5 percent of teacher positions for subs
plus Additional 5 days a year for each LEP
teacher plus $10 per LEP pupil beyond
what each generates through the core
model
5 percent of teacher positions for subs
plus Additional 5 days a year for each LEP
teacher plus $10 per LEP pupil beyond
what each generates through the core
model
5 percent of teacher positions for subs
plus Additional 5 days a year for each LEP
teacher plus $10 per LEP pupil beyond
what each generates through the core
model
Washington 2006 An additional 1.00 teachers for every 100 ELL students
An additional 1.00 teachers for every 100 ELL students
An additional 1.00 teachers for every 100 ELL students
Washington 2006 NA NA NA
Wisconsin 2007 An additional 1.00 teachers for every 100 ELL students
An additional 1.00 teachers for every 100 ELL students
An additional 1.00 teachers for every 100 ELL students
Wyoming 2005 An additional 1.0 FTE teacher for every 100
ELL students
An additional 1.0 FTE teacher for every 100
ELL students
An additional 1.0 FTE teacher for every 100
ELL students
Wyoming 2010 An additional 1.0 FTE teacher for every 100
ELL students
An additional 1.0 FTE teacher for every 100
ELL students
An additional 1.0 FTE teacher for every 100
ELL students
Funds for Purchasing Materials, Technology and Training
All of the adequacy studies we reviewed also provide resources to purchase items such as technology
and instructional materials as well as professional development for staff. Costs for these items are
typically identified in terms of dollars rather than numbers of personnel. There is substantial variation
across the studies in how each of these is handled, and the following tables identify the major
components of these cost items and how they were addressed in each state study.
Table 2.12 – Instructional Materials
Table 2.13 – Assessment
Table 2.14 – Gifted and Talented
Table 2.15 – Technology
Table 2.16 – Professional Development
Table 2.17 – Campus Safety Finally, in many studies there is a carry forward component of the cost estimate that indicates that the
current cost of certain programs and services is carried over as is. This is a result of the wide variety of
state specific funding programs for special services, transportation, capital projects, deferred
maintenance and other items (sometimes including operations and maintenance), many of which are
not included in adequacy studies that typically focus on instructional programs and the resources that

A Comprehensive Review of State Adequacy Studies Since 2003
43
directly support instruction. Table 2.18 displays how carry forward resources are handled in the studies
where it is made explicit.
Table 2.12: Instructional Materials
State Year Elementary Middle High School
Maryland 2001 $158 per pupil $158 per pupil $158 per pupil
Maryland 2001 $175 per pupil $275 per pupil $550 per pupil
Arizona 2004 $250/pupil $250/pupil $250/pupil
Arkansas 2003 $250/pupil $250/pupil $250/pupil
Arkansas 2006 $160 per pupil $160 per pupil $160 per pupil
California 2006 NA NA NA
California 2007 Not indicated Not indicated Not indicated
Colorado 2003 $350 per pupil $425 per pupil $500 per pupil
Colorado 2006 $350 per pupil $425 per pupil $500 per pupil
Colorado 2011 $225 per pupil $250 per student $310 per student
Colorado 2013 $225 per pupil $250 per student $310 per student
Connecticut 2005 $175 per pupil $225 per pupil $275 per pupil
D.C. 2013 $165/student $335/student $400/student
Illinois 2010 $140 Per-Pupil $140 Per-Pupil $170 Per-Pupil
Kentucky 2003 not indicated not indicated not indicated
Kentucky 2003 $250 per pupil $250 per pupil $250 per pupil
Kentucky 2004 $320 per pupil $325 per pupil $375 per pupil
Maine 2014 $170 per K-8 pupil (Instructional materials and assessments)
$170 per K-8 pupil (Instructional materials and assessments)
$205 per high school pupil (Instructional
materials and assessments)
Minnesota 2004 NA NA NA
Minnesota 2006 NA NA NA
Montana 2005 250 350 400
Montana 2007 $350 per pupil $375 per pupil $400 per pupil
Nevada 2006 $250 per pupil $300 per pupil $450 per pupil
New Jersey 2006 $300 per pupil plus additional for LEP and
special ed
$300 per pupil plus additional for LEP and
special ed
$320 per pupil plus additional or LEP and
special ed
New Jersey 2007 $140 per pupil $140 per pupil $175 per pupil
New Mexico 2008 NA NA NA
New York 2004 NA NA NA
New York 2004 NA NA NA
North Dakota 2008 $145/pupil $145/pupil $180/pupil
North Dakota 2014 $140/student $140/student $175/student
Ohio 2009 $165 per pupil phased in at 25% biennium
($165 per pupil)
$165 per pupil phased in at 25% biennium
($165 per pupil)
$165 per pupil phased in at 25% biennium
($200 per pupil)

A Comprehensive Review of State Adequacy Studies Since 2003
44
State Year Elementary Middle High School
Pennsylvania 2007 NA NA NA
Rhode Island 2007 $221 per pupil $221 per pupil $221 per pupil
South Dakota 2006 $250 per pupil $250 per pupil $250 per pupil
Tennessee 2004 $400 per pupil $450 per pupil $600 per pupil
Texas 2012 $140/pupil $140/pupil $175/pupil
Washington 2006 $140/pupil $140/pupil $175/pupil
Washington 2006 NA NA NA
Wisconsin 2007 $140/pupil $140/pupil $175/pupil
Wyoming 2005 $285.57/ADM $285.57/ADM $349.66/ADM
Wyoming 2010 $140/ADM $140/ADM $175/ADM
Table 2.13: Assessments
State Year Elementary Middle High School
Maryland 2001 $30 per pupil $30 per pupil $30 per pupil
Maryland 2001 $20 per pupil $20 per pupil $20 per pupil
Arizona 2004 not included not included not included
Arkansas 2003 not included not included not included
Arkansas 2006 $25 per pupil $25 per pupil $25 per pupil
California 2006 NA NA NA
California 2007 not indicated not indicated not indicated
Colorado 2003 $22 per pupil $22 per pupil $22 per pupil
Colorado 2006 $22 per pupil $22 per pupil $22 per pupil
Colorado 2011 $25 per pupil $25 per pupil $25 per pupil
Colorado 2013 $25 per pupil $25 per pupil $25 per pupil
Connecticut 2005 $12 per pupil $10 per pupil $11 per pupil
D.C. 2013 included in Instructional
Materials
included in Instructional
Materials
included in Instructional
Materials
Illinois 2010 $25 Per-Pupil $25 Per-Pupil $25 Per-Pupil
Kentucky 2003 not indicated not indicated not indicated
Kentucky 2003 not indicated not indicated not indicated
Kentucky 2004 $20 per pupil $20 per pupil $20 per pupil
Maine 2014 $170 per K-8 pupil (Instructional materials and assessments)
$170 per K-8 pupil (Instructional materials and assessments)
$205 per high school pupil (Instructional
materials and assessments)
Minnesota 2004 NA NA NA
Minnesota 2006 NA NA NA
Montana 2005 $50 per pupil $50 per pupil $80 per pupil
Montana 2007 not included separately
not included separately
not included separately

A Comprehensive Review of State Adequacy Studies Since 2003
45
State Year Elementary Middle High School
Nevada 2006 not included not included not included
New Jersey 2006 NA NA NA
New Jersey 2007 NA NA NA
New Mexico 2008 NA NA NA
New York 2004 NA NA NA
New York 2004 NA NA NA
North Dakota 2008 $25/Pupil $25/Pupil $25/Pupil
North Dakota 2014 $30/student $30/student $30/student
Ohio 2009 NA NA NA
Pennsylvania 2007 NA NA NA
Rhode Island 2007 $45 per pupil $45 per pupil $45 per pupil
South Dakota 2006 $2,000 per school $2,000 per school $2,000 per school
Tennessee 2004 $15 per pupil $15 per pupil $15 per pupil
Texas 2012 $25/pupil $25/pupil $25/pupil
Washington 2006 not included not included not included
Washington 2006 NA NA NA
Wisconsin 2007 $25/pupil $25/pupil $25/pupil
Wyoming 2005 $28.50/ADM $28.50/ADM $28.50/ADM
Wyoming 2010 $28.50/ADM $28.50/ADM $28.50/ADM
Table 2.14: Gifted and Talented
State Year Elementary Middle High School
Maryland 2001 not included not included not included
Maryland 2001 not included not included not included
Arizona 2004 not included not included not included
Arkansas 2003 not included not included not included
Arkansas 2006 not included not included not included
California 2006 NA NA NA
California 2007 not included not included not included
Colorado 2003 not included not included not included
Colorado 2006 not included not included not included
Colorado 2011 0.6 0.66 0.71
Colorado 2013 0.6 0.66 0.71
Connecticut 2005 not included not included not included
D.C. 2013 .2 teacher .3 teacher .5 teacher
Illinois 2010 $25 per pupil $25 per pupil $25 per pupil
Kentucky 2003 not included not included not included
Kentucky 2003 not included not included not included
Kentucky 2004 $15 per pupil $15 per pupil $15 per pupil
Maine 2014 $25 per pupil $25 per pupil $25 per pupil
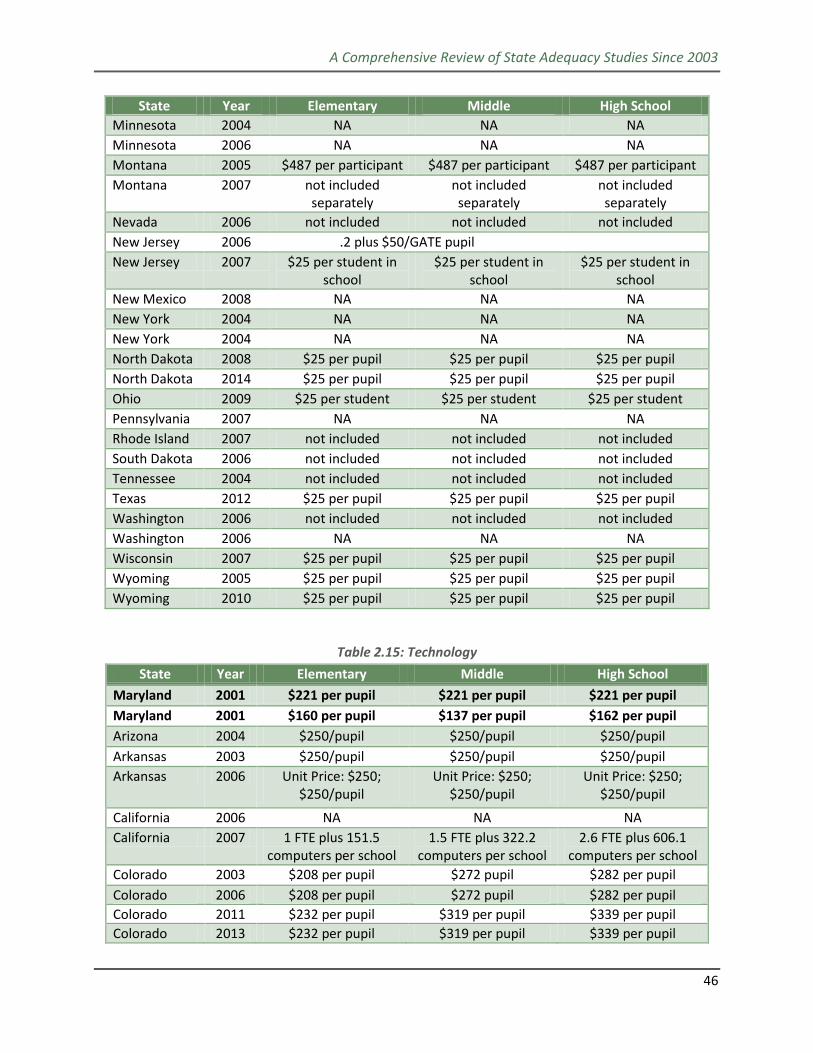
A Comprehensive Review of State Adequacy Studies Since 2003
46
State Year Elementary Middle High School
Minnesota 2004 NA NA NA
Minnesota 2006 NA NA NA
Montana 2005 $487 per participant $487 per participant $487 per participant
Montana 2007 not included separately
not included separately
not included separately
Nevada 2006 not included not included not included
New Jersey 2006 .2 plus $50/GATE pupil
New Jersey 2007 $25 per student in school
$25 per student in school
$25 per student in school
New Mexico 2008 NA NA NA
New York 2004 NA NA NA
New York 2004 NA NA NA
North Dakota 2008 $25 per pupil $25 per pupil $25 per pupil
North Dakota 2014 $25 per pupil $25 per pupil $25 per pupil
Ohio 2009 $25 per student $25 per student $25 per student
Pennsylvania 2007 NA NA NA
Rhode Island 2007 not included not included not included
South Dakota 2006 not included not included not included
Tennessee 2004 not included not included not included
Texas 2012 $25 per pupil $25 per pupil $25 per pupil
Washington 2006 not included not included not included
Washington 2006 NA NA NA
Wisconsin 2007 $25 per pupil $25 per pupil $25 per pupil
Wyoming 2005 $25 per pupil $25 per pupil $25 per pupil
Wyoming 2010 $25 per pupil $25 per pupil $25 per pupil
Table 2.15: Technology
State Year Elementary Middle High School
Maryland 2001 $221 per pupil $221 per pupil $221 per pupil
Maryland 2001 $160 per pupil $137 per pupil $162 per pupil
Arizona 2004 $250/pupil $250/pupil $250/pupil
Arkansas 2003 $250/pupil $250/pupil $250/pupil
Arkansas 2006 Unit Price: $250; $250/pupil
Unit Price: $250; $250/pupil
Unit Price: $250; $250/pupil
California 2006 NA NA NA
California 2007 1 FTE plus 151.5 computers per school
1.5 FTE plus 322.2 computers per school
2.6 FTE plus 606.1 computers per school
Colorado 2003 $208 per pupil $272 pupil $282 per pupil
Colorado 2006 $208 per pupil $272 pupil $282 per pupil
Colorado 2011 $232 per pupil $319 per pupil $339 per pupil
Colorado 2013 $232 per pupil $319 per pupil $339 per pupil

A Comprehensive Review of State Adequacy Studies Since 2003
47
State Year Elementary Middle High School
Connecticut 2005 $119 per pupil $156 per pupil $134 per pupil
D.C. 2013 .5 FTE, $30 per pupil for licensing
1 FTE, $30 per pupil for licensing
1 technology specialist, 1 IT
manager, per pupil for licensing
Illinois 2010 $250/pupil $250/pupil $250/pupil
Kentucky 2003 $214/student $214/student $214/student
Kentucky 2003 1 technology person at the school site,1/2
time instructional, 1/2 time technical; $214/pupil for
hardware/software replacement and
repair, $50 per pupil for moving to ratio of 1 computer for every
3 students
1 technology person at the school site,1/2
time instructional, 1/2 time technical; $214/pupil for
hardware/software replacement and
repair, $50 per pupil for moving to ratio of 1 computer for every
3 students
2 technology people at the school site, 1
instructional, 1 technical; $214/pupil
for hardware/software
replacement and repair, $50 per pupil for moving to ratio of 1 computer for every
3 students
Kentucky 2004 1 technology specialist plus $300 per pupil
1 technology specialist plus $300 per pupil
1 technology specialist plus $300 per pupil
Maine 2014 $250 per all pupils $250 per all pupils $250 per all pupils
Minnesota 2004 NA NA NA
Minnesota 2006 NA NA NA
Montana 2005 1 FTE plus $300 per pupil
0.5 FTE plus $400 per pupil
1 FTE plus $400 per pupil
Montana 2007 $235 per pupil $266 per pupil $274 per pupil
Nevada 2006 1 plus $175 per pupil 1 plus $175 per pupil 1 plus $177 per pupil
New Jersey 2006 $150 per student plus 1 tech spec. positions
identified above in pupil support staff
$150 per student plus 2 tech spec. positions
identified above in pupil support staff
$150 per student plus 2 tech spec. positions
identified above in pupil support staff
New Jersey 2007 $250 per pupil $250 per pupil $250 per pupil
New Mexico 2008 NA NA NA
New York 2004 NA NA NA
New York 2004 NA NA NA
North Dakota 2008 $250/student $250/student $250/student
North Dakota 2014 $250/student $250/student $250/student
Ohio 2009 $250 per pupil phased in at 25% per
biennium ($250 per pupil)
$250 per pupil phased in at 25% per
biennium ($250 per pupil)
$250 per pupil phased in at 25% per
biennium ($250 per pupil)
Pennsylvania 2007 NA NA NA
Rhode Island 2007 $220 per pupil $220 per pupil $220 per pupil

A Comprehensive Review of State Adequacy Studies Since 2003
48
State Year Elementary Middle High School
South Dakota 2006 1 FTE plus $407 per pupil
1 FTE plus $330 per pupil
1 FTE plus $479 per pupil
Tennessee 2004 1 technology specialist 1 technology specialist 1 technology specialist
Texas 2012 $250/pupil $250/pupil $250/pupil
Washington 2006 $250/pupil $250/pupil $250/pupil
Washington 2006 NA NA NA
Wisconsin 2007 $250/pupil $250/pupil $250/pupil
Wyoming 2005 $250/ADM $250/ADM $250/ADM
Wyoming 2010 $250/ADM $250/ADM $250/ADM
Table 2.16: Professional Development
State Year Elementary Middle High School
Maryland 2001 Not specified Not specified Not specified
Maryland 2001 $123 per pupil $200 per pupil $239 per pupil
Arizona 2004 Included above: Instructional
facilitators, Planning & prep time, 10 summer
days; Additional: $50/pupil for other PD
expenses - trainers, conferences, travel,
etc.
Included above: Instructional
facilitators, Planning & prep time, 10 summer
days; Additional: $50/pupil for other PD
expenses - trainers, conferences, travel,
etc.
Included above: Instructional
facilitators, Planning & prep time, 10 summer
days; Additional: $50/pupil for other PD
expenses - trainers, conferences, travel,
etc.
Arkansas 2003 Included above: Instructional
facilitators, Planning & prep time, 10 summer
days; Additional: $50/pupil for other PD
expenses - trainers, conferences, travel,
etc.
Included above: Instructional
facilitators, Planning & prep time, 10 summer
days; Additional: $50/pupil for other PD
expenses - trainers, conferences, travel,
etc.
Included above: Instructional
facilitators, Planning & prep time, 10 summer
days; Additional: $50/pupil for other PD
expenses - trainers, conferences, travel,
etc.
Arkansas 2006 Instructional facilitators, Planning & prep time, 10 summer
days; Additional: $50/pupil for other PD
expenses - trainers, conferences, travel,
etc.
Instructional facilitators, Planning & prep time, 10 summer
days; Additional: $50/pupil for other PD
expenses - trainers, conferences, travel,
etc.
Instructional facilitators, Planning & prep time, 10 summer
days; Additional: $50/pupil for other PD
expenses - trainers, conferences, travel,
etc.
California 2006 NA NA NA

A Comprehensive Review of State Adequacy Studies Since 2003
49
State Year Elementary Middle High School
California 2007 59 hours/year/teacher for collaborative time
122.1 hours/year/teacher for
collaborative time
100.1 hours/year/teacher for
collaborative time
Colorado 2003 $1,000 per teacher $1,000 per teacher $1,000 per teacher
Colorado 2006 $1,000 per teacher $1,000 per teacher $1,000 per teacher
Colorado 2011 5 additional teacher days, $200 per pupil
5additional teacher days, $200 per pupil
5 additional teacher days, $200 per pupil
Colorado 2013 6 additional teacher days, $200 per pupil
5additional teacher days, $200 per pupil
6 additional teacher days, $200 per pupil
Connecticut 2005 $233 per pupil $25 per pupil $217 per pupil
D.C. 2013 15 days/teacher; $100 student
15 days/teacher; $100 student
13 days/teacher; $100 student
Illinois 2010 $100/pupil $100/pupil $100/pupil
Kentucky 2003 $60,000 for professional
development with a minimum of $30,000
$60,000 for professional
development with a minimum of $30,000
$60,000 for professional
development with a minimum of $30,000
Kentucky 2003 10 extra days for Summer Institutes
included in expanded school year. Additional
professional development provided
by curriculum specialist included
above, considerable collaborative planning
during planning and preparation times. Plus
$50 per student for travel, consultants,
materials, etc.
10 extra days for Summer Institutes
included in expanded school year. Additional
professional development provided by curriculum specialist
included above, considerable
collaborative planning during planning and
preparation times. Plus $50 per student for travel, consultants,
materials, etc.
10 extra days for Summer Institutes
included in expanded school year. Additional
professional development provided by curriculum specialist
included above, considerable
collaborative planning during planning and
preparation times. Plus $50 per student for travel, consultants,
materials, etc.
Kentucky 2004 5 days for certified staff, 4 days for classified staff
5 days for certified staff, 4 days for classified staff
5 days for certified staff, 4 days for classified staff
Maine 2014 Instructional Coaches, Collaboration Time, 10 days of pupil free time for training, $100/pupil
for training
Instructional Coaches, Collaboration Time, 10 days of pupil free time for training, $100/pupil
for training
Instructional Coaches, Collaboration Time, 10 days of pupil free time for training, $100/pupil
for training
Minnesota 2004 NA NA NA
Minnesota 2006 NA NA NA
Montana 2005 not included not included not included
Montana 2007 $2,000 per teacher and $2,000 per teacher and $2,000 per teacher and

A Comprehensive Review of State Adequacy Studies Since 2003
50
State Year Elementary Middle High School
$1,000 per paraprofessional
$1,000 per paraprofessional
$1,000 per paraprofessional
Nevada 2006 $500 per teachers plus 5 extra days
$500 per teachers plus 5 extra days
$500 per teachers plus 5 extra days
New Jersey 2006 $1,250 per personnel plus $50 per student
$1,250 per personnel plus $50 per student
$1,250 per personnel plus $50 per student
New Jersey 2007 $100 per pupil plus costs for inst.
Facilitators, planning and prep time and 10
summer days
$100 per pupil plus costs for inst.
Facilitators, planning and prep time and 10
summer days
$100 per pupil plus costs for inst.
Facilitators, planning and prep time and 10
summer days
New Mexico 2008 NA NA NA
New York 2004 NA NA NA
New York 2004 NA NA NA
North Dakota 2008 Included above: Instructional coaches, planning & prep time,
10 summer days; Additional:
$100/student for other PD expenses – trainers,
conferences, travel, etc.
Included above: Instructional coaches, planning & prep time,
10 summer days; Additional:
$100/student for other PD expenses –trainers,
conferences, travel, etc.
Included above: Instructional coaches, planning & prep time,
10 summer days; Additional:
$100/student for other PD expenses –trainers,
conferences, travel, etc.
North Dakota 2014 Included above: Instructional coaches, planning & prep time,
10 pupil fee days; Additional:
$100/student for other PD expenses – trainers,
conferences, travel, etc.
Included above: Instructional coaches, planning & prep time,
10 pupil fee days; Additional:
$100/student for other PD expenses – trainers,
conferences, travel, etc.
Included above: Instructional coaches, planning & prep time,
10 pupil fee days; Additional:
$100/student for other PD expenses – trainers,
conferences, travel, etc.
Ohio 2009 $1,833 per teacher at an average of 18 pupils per teacher this would be $127.29 per pupil
when specialist teachers are included
($100 per pupil)
$1,833 per teacher at a class size of 25 this is
$91.65 per pupil when specialist teachers are
included ($100 per pupil)
$1,833 per teacher at a class size of 25 this is
$91.65 per pupil when specialist teachers are
included ($100 per pupil)
Pennsylvania 2007 NA NA NA
Rhode Island 2007 $275 per pupil $275 per pupil $275 per pupil
South Dakota 2006 $1,000 per teacher $1,000 per teacher $1,000 per teacher
Tennessee 2004 5% of total budget 5% of total budget 5% of total budget
Texas 2012 5 additional teacher 5 additional teacher 5 additional teacher

A Comprehensive Review of State Adequacy Studies Since 2003
51
State Year Elementary Middle High School
days to total 10 PD days; $100/pupil
days to total 10 PD days; $100/pupil
days to total 10 PD days; $100/pupil
Washington 2006 Included above: Instructional
facilitators, Planning & prep time, 10 summer
days; Additional: $100/pupil for other
PD expenses - trainers, conferences, travel,
etc.
Included above: Instructional
facilitators, Planning & prep time, 10 summer
days; Additional: $100/pupil for other
PD expenses - trainers, conferences, travel,
etc.
Included above: Instructional
facilitators, Planning & prep time, 10 summer
days; Additional: $100/pupil for other
PD expenses - trainers, conferences, travel,
etc.
Washington 2006 NA NA NA
Wisconsin 2007 Included above: Instructional
facilitators, Planning & prep time, 10 summer
days; Additional: $100/pupil for other
PD expenses - trainers, conferences, travel,
etc.
Included above: Instructional
facilitators, Planning & prep time, 10 summer
days; Additional: $100/pupil for other
PD expenses - trainers, conferences, travel,
etc.
Included above: Instructional
facilitators, Planning & prep time, 10 summer
days; Additional: $50/pupil for other PD
expenses - trainers, conferences, travel,
etc.
Wyoming 2005 Included above: Instructional
facilitators, Planning & prep time, 5 summer
days; Additional: $100/pupil for other
PD expenses - trainers, conferences, travel,
etc.
Included above: Instructional
facilitators, Planning & prep time, 5 summer
days; Additional: $100/pupil for other
PD expenses - trainers, conferences, travel,
etc.
Included above: Instructional
facilitators, Planning & prep time, 5 summer
days; Additional: $100/pupil for other
PD expenses - trainers, conferences, travel,
etc.
Wyoming 2010 Included above: Instructional
facilitators, Planning & prep time, 5 summer
days; Additional: $100/pupil for other
PD expenses - trainers, conferences, travel,
etc.
Included above: Instructional
facilitators, Planning & prep time, 5 summer
days; Additional: $100/pupil for other
PD expenses - trainers, conferences, travel,
etc.
Included above: Instructional
facilitators, Planning & prep time, 5 summer
days; Additional: $100/pupil for other
PD expenses - trainers, conferences, travel,
etc.

A Comprehensive Review of State Adequacy Studies Since 2003
52
Table 2.17: Campus Safety
State Year Elementary Middle High School
Maryland 2001 Not specified Not specified Not specified
Maryland 2001 $12 per pupil $12 per pupil $12 per pupil
Arizona 2004 not included not included not included
Arkansas 2003 not included not included not included
Arkansas 2006 not included not included not included
California 2006 NA NA NA
California 2007 .2 1.7 3.9
Colorado 2003 not included .5 School Resource Officer
.5 School Resource Officer
Colorado 2006 not included .5 School Resource Officer
.5 School Resource Officer
Colorado 2011 not included 5.55 per 1,000 students 5.0 per 1,000 students
Colorado 2013 not included 5.55 per 1,000 students 5.0 per 1,000 students
Connecticut 2005 not included not included not included
D.C. 2013 2 3 6
Illinois 2010 not included not included not included
Kentucky 2003 not included not included not included
Kentucky 2003 not included not included not included
Kentucky 2004 1 1 2
Maine 2014 not included not included not included
Minnesota 2004 .1 (10th percentile special needs) and .1
(90th percentile special needs)
.5 (10th percentile special needs) and .7
(90th percentile special needs)
.5 (10th percentile special needs) and 1
(90th percentile special needs)
Minnesota 2006 .1 (10th percentile special needs) and .1
(90th percentile special needs)
.5 (10th percentile special needs) and .7
(90th percentile special needs)
.5 (10th percentile special needs) and 1
(90th percentile special needs)
Montana 2005 $25 $25 $50
Montana 2007 not included not included not included
Nevada 2006 not included not included not included
New Jersey 2006 not included not included not included
New Jersey 2007 not included not included not included
New Mexico 2008 NA NA NA
New York 2004 NA NA NA
New York 2004 NA NA NA
North Dakota 2008 not included not included not included
North Dakota 2014 not included not included not included
Ohio 2009 NA NA NA

A Comprehensive Review of State Adequacy Studies Since 2003
53
State Year Elementary Middle High School
Pennsylvania 2007 NA NA NA
Rhode Island 2007 $16 per pupil $16 per pupil $16 per pupil
South Dakota 2006 not included not included not included
Tennessee 2004 not included not included not included
Texas 2012 not included not included not included
Washington 2006 not included not included not included
Washington 2006 NA NA NA
Wisconsin 2007 not included not included not included
Wyoming 2005 not included not included not included
Wyoming 2010 not included not included not included
Table 2.18: Carry Forwards and Items Excluded from Studies
State Year Carry Forward and Exclusions
Maryland 2001 district-level services, special education, and transportation
Maryland 2001 transportation, capital and facilities, food service
Arizona 2004 facilities, transportation, food service, etc.
Arkansas 2003 operations and maintenance, central office, facilities, transportation
Arkansas 2006 operations and maintenance, central office, facilities, transportation
California 2006 district level functions, maintenance and operations and transportation, facilities and debt service
California 2007 facilities, transportation services, maintenance and operations, instructional materials, or office supplies
Colorado 2003 transportation, food services, adult education, capital outlay and debt service for facilities
Colorado 2006 transportation, food services, adult education, capital outlay and debt service for facilities
Colorado 2011 capital, transportation, food service
Colorado 2013 capital, transportation, food service
Connecticut 2005 facilities, transportation, food service
D.C. 2013 food services, transportation, facilities
Illinois 2010 NA
Kentucky 2003 NA
Kentucky 2003 NA
Kentucky 2004 debt and facilities
Maine 2014 NA
Minnesota 2004 district administration, maintenance and operations and transportation
Minnesota 2006 district administration, maintenance and operations and transportation

A Comprehensive Review of State Adequacy Studies Since 2003
54
State Year Carry Forward and Exclusions
Montana 2005 maintenance and operations, transportation, food costs, central office
Montana 2007 transportation, food services, or facilities
Nevada 2006 transportation, facilities, food services
New Jersey 2006 NA
New Jersey 2007 NA
New Mexico 2008 transportation, facilities, debt service, food services
New York 2004 central office, maintenance and operations, facilities and debt, food service
New York 2004 NA
North Dakota 2008 NA
North Dakota 2014 NA
Ohio 2009 NA
Pennsylvania 2007 capital, transportation, food services, adult education
Rhode Island 2007 education, and community services were excluded from PJ panel
South Dakota 2006 facilities, transportation, food service
Tennessee 2004 facilities, debt service, transportation, food service
Texas 2012 NA
Washington 2006 food services, transportation, facilities
Washington 2006 NA
Wisconsin 2007 facilities, debt service, transportation, food service
Wyoming 2005 NA
Wyoming 2010 NA

A Comprehensive Review of State Adequacy Studies Since 2003
55
Chapter 3: The Evolution of Adequacy Studies and Best Practices for their Design The preceding chapters identified 39 adequacy studies completed between 2003 and 2014 and provided
a detailed description of the ways each study reached its estimate of school finance adequacy in its
respective state. The studies use a variety of methods, sometimes individually and sometimes in
combination. A review of the studies shows that each of the methods has evolved over time, in some
instances incorporating components of other methods in the adequacy estimates. We found that
Augenblick, Palaich & Associates or Picus Odden & Associates conducted 27 of the 39 studies and
partnered in two additional studies, allowing us to see and reflect on the evolution of the methodologies
over time. In general the studies conducted by APA relied on the successful schools/districts (SSD) and
professional judgment (PJ) methods while those completed by POA used the evidence-based (EB)
approach. The remaining 12 studies relied on a variety of methods, often more than one. Twenty-one of
the studies used PJ as the primary method while 16 used EB as the primary method and two the SSD
approach.
This chapter summarizes the evolution of the three methodological approaches we reviewed and the
best practices that have emerged from this evolution.
Evolution of the Successful Schools/Districts Method
The successful schools/districts approach has evolved over time in two main areas. The first is in the
selection and identification of the districts or schools being identified as successful. In the early SSD
work the consultant typically created the approach for selecting successful districts or schools. This
approach utilized state level testing results to identify the districts or schools that were performing well
in an absolute sense. This approach led to the selection of districts or schools achieving high overall (or
status) test scores but ignored those districts or schools that may have had lower absolute achievement
but were producing significant student growth and improvement over a relatively short period of time.
The method for identifying successful districts or schools began to change as data on student academic
growth became more widely available, allowing for the identification and inclusion of systems achieving
significant improvement in performance, thus facilitating the inclusion of multiple lenses for identifying
high performance. As a result, district or school selection began to focus on identifying both absolute
high performers along with those showing dramatic performance improvement but still achieving less
than top tier absolute performance. Under this new method for identifying success, performance gains
were measured in multiple ways, including identifying districts or schools that were growing at a rate
that had them on a path to meet state standards over a set period of time or schools or districts that
were outperforming what would be expected of them based on the past achievement of their students.
Along with the change in the types of successful school systems being selected, the focus of the
selection process has also changed. As state assessment and accountability systems have become more
sophisticated over time the selection method has become less consultant dependent and more aligned
with the a state’s own accountability system and goals. This approach, where possible, incorporates a
state’s own definition of what constitutes success and tends to make the selection of districts or schools
more understandable to all state stakeholders.

A Comprehensive Review of State Adequacy Studies Since 2003
56
The second area of evolution is in the identification of the base cost figure for each district or school. In
earlier SSD work the identification of the base cost figure was done at the total base cost level and no
examination was made of the different components of spending making up the base cost, such as
instruction, administration or plant maintenance and operations. Also, no consideration was made for
the efficiency of spending of the districts included in the successful schools base cost figure, which could
lead to the selection of districts or schools that used their resources inefficiently. In more recent
applications of the SSD methodology the base cost is disaggregated and analyzed by different cost areas
and financial efficiency screens are applied to ensure that inefficient school systems do not bias the base
cost estimates upward. Efficiency screens are generally applied only within the group of identified
successful districts or schools and the comparative levels of staffing or per pupil spending are used as
the measure of efficient use of resources for each of the different cost areas. Districts or schools are
excluded from the final base cost figures if their use of resources varies significantly, according to
established benchmarks, from that of other successful districts or schools included in the analysis.
The SSD method also began to include studies of some of the identified schools to determine how the
resources were used to produce the performance results that had them selected for the cost study.
Evolution of the Professional Judgment Method
The professional judgment approach has evolved dramatically since it was first implemented. Early
professional judgment work was often based on the work of small groups of educators that met for a
few days with little initial guidance or subsequent review of their results. Experts were often not from
the state being analyzed and the focus was to build the full array of resources within just a few days,
using one or perhaps a handful of panels that all addressed similar questions. As the PJ approach
progressed, the number of panels and the levels of review expanded considerably. However, the work
continued to focus on one specific representative district or a handful of districts typically categorized by
enrollment size. Panelists focused only on their category of district and a number of different
representative districts could be built independently without participants from across the panels
informing each other’s work.
In today’s application a multi-tiered approach is used that begins with school level panels. These panels
are not specific to one size of district and bring together successful educators from across a state to
determine what resources are required for every student in the state to be successful in meeting state
standards. Separate special needs panels are assembled to specifically identify the resources needed for
special education, at-risk, and English Language Learners to be successful in the school models
developed by the first panels.
District panels then meet to determine the types of resources needed at the district level to support the
schools that were developed by the school level and special needs panels. These district level panels
also bring a district-wide perspective to the school level work by reviewing the school level
specifications to determine if there are specific resource changes they would make based on differences
in how different sized districts might utilize resources.

A Comprehensive Review of State Adequacy Studies Since 2003
57
Additional panels may be constituted where necessary to ensure all needed resources are identified.
These may include a panel of district chief financial officers (CFO), technology specialists, or career and
technical education professionals. Finally, a systems panel made up of a select group of district and
school level administrators and educators who are known to hold a statewide perspective on
educational performance and systems meets to review all of the panels’ recommendations developed
up to that point. Today’s professional judgment panel process has evolved to incorporate multiple levels
of input and review from highly regarded in-state participants who possess a strong understanding of
the state’s educational expectations, student needs, and the types of resources required to allow
students to be successful.
Evolution of the Evidence-based Method
The evidence-based method has also evolved over time. The method had its origin in the comprehensive
school reform models that provided detailed instructional designs that could be translated into specific
resources (e.g., staff or materials) and linked to a cost. Over time, the approach incorporated research
evidence on all aspects related to a school and district, where research findings are available. The early
EB studies reviewed here (2003-2005) referenced literature on the individual elements of the school
model, but had limited descriptions of how the resources could be used to boost student performance.
Subsequent EB studies grew more specific as to the use of resources, outlining a school design that
includes significant resources in the early grades, targeted resources for students with additional
instructional needs, and an emphasis on teacher professional development. Underlying the approach is
the goal of providing every student with an equal opportunity to achieve to state standards and an
assumption that there are sets of specific instructional strategies that make that possible. To make that
practical in every state, the approach has been refined to include the use of PJ panels and case studies
of improving schools.
Unlike the PJ panels described above, the PJ panels used in EB studies are a secondary method. Their
role in the EB approach is to confirm that the elements included in the EB model are applied
appropriately in their state. Participants are not asked to design a school from scratch – instead, they
respond to the evidence presented in light of the specific state context.
The case studies found in the most recent EB studies are also used as confirmation that the EB model is
applicable to the state. Leaders and teachers in schools identified as making significant improvement in
student achievement, oftentimes “doubling performance” for all or groups of students, are interviewed
with the aim of understanding how they align resources to their instructional goals. The results are
compared to the EB model in order to determine how well the EB model aligns to the particular state
context and to make changes to the EB model when needed. They can also be a powerful local example
of how a school may integrate the elements in the EB approach into an instructional school design that
improves achievement.
Finally, over time, the EB reports have evolved to provide more pointed recommendations on the use of
additional funding. The studies suggest that if the additional resources are not used as the model is
designed, substantial improvements in student performance might not emerge. These

A Comprehensive Review of State Adequacy Studies Since 2003
58
recommendations resulted from case studies of improving schools that were included in later EB studies
and from a number of follow-up studies conducted in several states where funding was increased
following an adequacy study. The consultants consistently found that while there was general support
from the education community for the reforms suggested in the EB study, schools provided with
increased funding made few changes in how they used the resources available to them and student
performance remained generally static. On the other hand, the case studies conducted in recent EB
reports provide some evidence that improving schools often exhibit the characteristics and resource use
patterns identified in the EB model.
Our discussion of the assumptions and programmatic elements of the adequacy approaches in Chapter
2 and the evolution of the three approaches in Chapter 3 highlights how each of the approaches have
been improved-upon over time as analysts have gained experience in working with the methods. A
discussion of each of the key best practices we have identified through this review is presented below.
Best Practices for the Design of Adequacy Studies
The findings from this review, combined with the experiences of the principal consultants working
together on this study, suggest seven “best practices” for the design of adequacy studies. They are:
1. Clear focus on improvement of student performance 2. The potential value of case studies in future work 3. Importance of state policy makers and local stakeholders in the process 4. Combining multiple methods in each state study 5. Selection of professional judgment panels 6. Number of professional judgment panels 7. Accurately representing compensation in the analysis.
1. Focus on Improvement of Student Performance
An explicit goal of most adequacy studies today is the importance of improved student performance. If
the intent is to determine what it costs to provide every student an equal opportunity to meet state
performance standards, such as Maryland’s College and Career-Ready Standards, then a focus on
student outcomes and how to reach performance goals is essential. This focus reflects an evolution from
early studies – mostly done prior to 2003 – that used the SSD and CF approaches.
The early SSD studies found districts or schools that met a specific performance level while more recent
SSD studies also include those schools producing large improvements in student learning. This serves to
better identify schools that may face significant instructional challenges and are still able to have their
students achieve.
Though the PJ method has always asked panels to design higher performing schools, more recent
studies have sought to find members for the panels from schools that have moved the student
achievement needle or have National Board certification, for example. The same is true for panelists
selected to review the EB recommendations.

A Comprehensive Review of State Adequacy Studies Since 2003
59
The EB method has always referenced research that links each programmatic element to improved
student learning, but as this approach evolved over time it began to more explicitly identify a detailed
theory of school improvement, i.e., how all of its recommendations could be combined in schools to
dramatically improve student learning.
In short, all three adequacy methods proposed for use in the Maryland study have evolved to a point
where they explicitly seek to link resources to student performance. Their goal is not only to identify the
level and types of resources that are needed to adequately fund the education system, but also to be
more explicit about how those resources can be used to attain that performance goal.
At the same time, only a few of the more recent adequacy studies have focused explicitly on attaining
Common Core Standards. This latest chapter in the standards movement and its subsequent
assessments can be expected to produce additional modifications to each method going forward.
2. The Value of Case Studies in Future Work
We found that a number of recent adequacy studies included case studies of high-performing and/or
dramatically improving schools. The case studies have been used to enhance adequacy studies for all
three methods for several reasons, including:
Tailoring the basic parameters of the study method to the specifics of how schools produce learning gains in the state studied.
Providing examples of how the resources estimated for base funding and additional resources for students with additional needs can be used to effectively boost student achievement.
Confirming, at least to some degree, the school improvement model that may be embedded in the particular adequacy study approach.
3. Importance of State Policy Makers
Our review of the 39 adequacy studies and our experience in conducting such studies suggests that the
involvement of the State Legislature and/or other state policy making bodies is more likely to impact
school finance policy and lead to changes in school finance systems. An early example of this was the
work of Maryland’s Thornton Commission, using findings from APA’s study, which led to a five-year
strategy to increase state and local education funding by over $3 billion (more than $3,000 per pupil).
The Thornton Commission was created by the state’s political leaders and included strong
representation by members of the Legislature.
The two adequacy studies conducted in Arkansas in 2003 and 2006 were done under the direction and
participation of the Legislature’s Interim Education Committee. Working hand in hand with the
consultants, the Committee responded to the state Supreme Court’s decision overturning the school
finance system, finding a way to raise over $800 million in additional funding for schools. In Wyoming a
joint Legislative Committee (supported by a legislative office focused specifically on school finance) has
met on a regular basis since the state’s high court first overturned the school finance system in 1997.
Along the way, Wyoming pioneered both the PJ and EB approaches to adequacy studies, implementing a
funding model that was based directly on the models developed by the consultants involved (initially
Management Analysis and Planning and later Picus Odden & Associates). The two adequacy studies

A Comprehensive Review of State Adequacy Studies Since 2003
60
conducted in North Dakota also were conducted for governmental bodies – the 2008 study for the
Education Improvement Commission (whose membership included the Lieutenant Governor and several
legislators) and the 2014 study for an Interim committee of the Legislature.
Even when Legislative bodies do not commission adequacy studies directly, the involvement of key
members of the Legislature, along with other state policy makers is essential if the goal is to produce
changes in the school funding system.
4. Combining Multiple Methods in Each State Study
Historically, adequacy studies used one of the four approaches to each study. However, this overview
analysis of the studies conducted during the past decade shows that 23 of the 39 studies used multiple
methods is assessing school finance adequacy. (All four studies conducted in 2013 and 2014 have used
multiple approaches.) A number of them developed cost estimates directly from two or more methods,
and several others relied on one primary method, supported by reviews and analyses grounded in
another of the four methods. Combining the studies led, in many cases, to multiple estimates of
adequacy, which allow policy makers a set of choices about how to structure finance reform and what
each option might cost.
Most of the evidence-based studies conducted in the past ten years have used professional judgment
panels to help validate or modify the study’s initial recommendations. Although the panels were not
asked to design high-performing schools from scratch as is done with the PJ approach, they were asked
to review the recommendations of the EB model and to provide suggestions regarding the initial EB
model parameters and to recommend modifications that better meet the specific needs of their state.
Likewise, more recent PJ panels, such as the 2011 Colorado study, have used an evidence-based model
as the starting point for PJ panel deliberations.
Similarly, the successful schools/districts approach is usually combined with a second model (generally
EB or PJ) because the estimate of a base funding level it generates does not identify weights to support,
or make recommendations regarding, the cost of additional services for at risk students (low income,
ELL and students with disabilities).
5. Selection of Professional Judgment Panels
Successfully translating the resources identified through adequacy studies into programmatic strategies
that can improve instruction and boost student learning has had an impact on how professional
judgment panels are populated. Initially, PJ panels were created to ensure the involvement of teachers
and education leaders from multiple educational perspectives – elementary, middle and high schools,
core and elective subjects, special education – as well as all regions of a state and districts of varying
size. Though continuing to meet those criteria, today’s PJ panels are, to the extent possible, populated
with teachers, instructional coaches, and administrators who:
Are from schools that have produced large gains in student learning
Work in turnaround or high-performing schools
Are National Board Certified or otherwise award winning teachers.

A Comprehensive Review of State Adequacy Studies Since 2003
61
The purpose of this change in the composition of PJ panels has been to ensure that panel members
understand how to move the student achievement needle, and have experience in doing so. The hope is
that recommendations from successful educators at all levels of the system will be better grounded in
strategies for identifying the resources needed to adequately staff and support successful schools as
well as how those resources can be used to accomplish the core goal of the education system –
improving student achievement.
6. Number of Professional Judgment Panels
Another evolution of the PJ approach has been the addition of more panels at different levels, each
reviewing the recommendations of the previous panel. Early PJ studies consisted of school panels at the
elementary, middle and high school levels, a panel for central office costs, and occasionally a panel
focused on special needs students. More recently special needs panels have become the norm and
panels consisting of district budget/finance officers and state officials are also often constituted to
review and validate the school and district/central office level panels.
Two studies, California in 2007 and Montana in 2005, used a different approach to PJ panels. They
surveyed practitioners from across the state and, as a result, were able to gather professional opinion
from many more educators than with a traditional PJ panel approach. We think that this approach, while
allowing for input from more professionals, does so at the expense of the panel interaction and
thoughtful deliberation that occurs when a group of educators comes together to consider how to best
use resources in a school to improve student achievement.
7. Accurately Representing Compensation in the Analysis
A final and just emerging best practice is a growing focus on the details of employee compensation,
which constitutes as much as 80% of a school district’s total budget. Generally adequacy studies have
relied on the average salary of various positions, and average benefit costs, to reach an estimate of total
system costs under the new resource recommendations. Today it is relatively straightforward to
simulate alternative salary and benefit levels and determine the impact higher salaries and benefits will
have on the total cost of the system.
More specifically, it has become important to pay attention to the benefit rate used in calculating total
compensation rates for all staff in adequacy studies. The most common practice in the past was to
calculate an “average” benefit rate by dividing total expenditures for benefits (when it was available) by
the total expenditures for salaries to estimate a benefit rate. When so computed, the benefit rates
ranged from 25% to 35% of salaries. Recently, however, as the example of North Dakota showed, efforts
are being made to identify the individual elements of and costs associated with benefits and to build a
benefit rate figure from the ground up. North Dakota used the actual costs of health insurance for state
employees as the estimate of health insurance costs for the K12 system, which produced much higher
but more realistic benefit rates, particularly for classified employees. By identifying the individual
elements of the bundle of items included in fringe benefits, and their costs, adequacy studies can
provide states an opportunity to more explicitly make polices on how such cost elements will be
addressed in the K12 funding system.

A Comprehensive Review of State Adequacy Studies Since 2003
62
Another challenge adequacy studies will need to face going forward is unfunded pension liabilities in
many states. While the solutions may occur at the state level, they have the potential to increase the
costs of education at least for some period of time.
Understanding the implications of alternative approaches to benefits is important for all future
adequacy studies.
Recommendations for Maryland This document summarizes 39 publically available adequacy studies conducted in 24 states and the
District of Columbia between 2003 and 2014. It shows that the two consultants who partnered to do the
current study in Maryland have conducted most of the studies reviewed (26 of the 39). The review also
shows the evolution of adequacy studies over time and how this evolution reflects the development of
methodological improvements, or best practices, over time. Both the PJ and EB methods now use
components of the other method – PJ studies use educational research to inform the panels as they
make decisions and EB studies use panels to validate and modify recommendations for the specifics of
each state. Moreover, most of the PJ studies conducted by APA also include a SSD study, and the EB
model uses school case studies, to validate the findings.
Given our collective history and expertise in the design of adequacy studies, we recommend that
Maryland design an adequacy study that takes the best practices that have emerged from this review
and is comprised of all three approaches discussed here – the SSD, PJ, and EB methods. Each of the
three methods provides valuable information not found in the others – the programmatic expertise of
practitioners found in the PJ approach, research supported programs and strategies from the EB
approach, and the actual expenditure levels of currently high-performing schools from the SSD
approach. Taken together, these three approaches serve to compliment and validate the findings of the
individual study approaches, providing Maryland with the most accurate and actionable findings
available.

A Comprehensive Review of State Adequacy Studies Since 2003
63
List of Adequacy Studies Reviewed Augenblick, J., Brown, A., DeCesare, D., Myers, J., & Silverstein, J. (2006). Estimating the cost of an
adequate education in South Dakota. Denver, CO: Augenblick, Palaich and Associates, Inc. Retrieved from: http://www.schoolfunding.info/states/sd/SD-augenbl-2006.pdf
Augenblick & Myers, Inc. (2001). Calculation of the cost of an adequate education in Maryland in 1999-
2000 using two different analytic approaches. Denver, CO: Author. Retrieved from: http://www.stateinnovation.org/Research/Education/Adequacy-Based-School-Funding/MarylandAdequacyStudysummary.aspx
Augenblick & Myers, Inc. (2003). Calculation of the cost of an adequate education in Colorado using the
professional judgment and the successful school district approaches. Denver, CO: Author. Retrieved from: http://www.schoolfunding.info/states/co/CO-03AdequacyStudy.pdf
Augenblick, Palaich and Associates, Inc. (2006). Estimating Colorado school district costs to meet state
and federal education accountability requirements. Denver, CO: Author. Retrieved from: http://www.schoolfunding.info/states/co/CO-06CostStudy_update.pdf
Augenblick, Palaich, and Associates, Inc. (2007). Costing out the resources needed to meet
Pennsylvania’s public education goals. Denver, CO: Author. Retrieved from: http://apaconsulting.net/~apa/wp-content/uploads/2014/06/6-penn-public-ed.pdf
Augenblick, Palaich, & Associates, Inc. (2011). Costing out the resources needed to meet Colorado
education standards and requirements. Denver, CO: Author. Retrieved from: http://co.chalkbeat.org/wp-content/uploads/sites/2/2011/08/APACostStudy80811.pdf
Augenblick, Palaich and Associates. (2013a). Overview of the structure of the Illinois school finance
system. Denver, CO: Author. Retrieved from: http://apaconsulting.net/wp-content/uploads/2014/07/130924-apa-rpt.pdf
Augenblick, Palaich, & Associates, Inc. (2013b). Update on the Colorado Costing Out Study. Denver, CO:
Author. Retrieved from: http://www.cosfp.org/HomeFiles/CostingOutAnalysis/2013/CostingOutUpdateReport2013.pdf
Augenblick, J., Palaich, R., Silverstein, J., Rose, D., & DeCesare, D. (2005). Estimating the cost of an
adequate education in Connecticut. Denver, CO: Augenblick, Palaich, & Associates, Inc. Retrieved from: http://www.schoolfunding.info/states/ct/CT-adequacystudy.pdf
Augenblick, J. & Silverstein, J. (2004). An estimation of the total cost in 2002-2003 of implementing the
results of the school finance adequacy study undertaken by Augenblick, Palaich and Associates, Inc. Denver, CO: Augenblick, Palaich & Associates, Inc. Retrieved from: http://www.schoolfunding.info/states/tn/TN-Adequacy%20Study%20-%20Phase%20II%202004.pdf
Augenblick, J., Silverstein, J., Brown, A.R., Rose, D., DeCesare, D., & Anderson, A.B. (2006). Estimating
the cost of an adequate education in Nevada. Denver, CO: Augenblick, Palaich and Associates, Inc. Retrieved from: http://apaconsulting.net/~apa/wp-content/uploads/2014/06/7-nevada.pdf

A Comprehensive Review of State Adequacy Studies Since 2003
64
Chambers, J., Levin, J., & Delaney, D. (2006). Efficiency and adequacy in California school finance: A professional judgment approach. Washington, DC: American Institutes for Research. Retrieved from: http://cepa.stanford.edu/gdtf/publications
Chambers, J., Levin, J., DeLancey, D., Manship, D. (2008). An independent comprehensive study of the
New Mexico public school funding formula. Washington, DC: American Institutes for Research. Retrieved from: http://www.schoolfunding.info/states/nm/AIRCostStudy.pdf
Chambers, J.G., Parrish, T.B., Levin, J.D., Smith, J.R., Guthrie, J.W., Seder, R.C., & Taylor, L. (2004).
Determining the cost of providing all children in New York an adequate education. Washington, D.C.: American Institutes for Research. Retrieved from: http://www.air.org/sites/default/files/NYAdequacyReportVOLUMEI1.pdf
Dupree, A., Augenblick, J., & Silverstein, J. (2006). Report on the cost of education. Trenton, NJ: New
Jersey Department of Education. Retrieved from: http://nj.gov/education/sff/archive/report.pdf Fermanich, M., Picus, L.O., & Odden, A. (2006). Washington learns: Successful district study final report.
North Hollywood, CA: Lawrence O. Picus and Associates. Hayes, C.D., Griffin, S.S., Ravindranath, N., & Katz, I. (2013). Cost of student achievement: Report of the
DC education adequacy study. Washington, DC: The Finance Project. Retrieved from: http://dme.dc.gov/sites/default/files/dc/sites/dme/publication/attachments/DC%20ADEQUACY%20STUDY_FULL%20REPORT.pdf
Management Analysis & Planning, Inc. (2001). A professional judgment approach to determining
adequate education funding in Maryland. Davis, CA: Author. Retrieved from: http://www.schoolfunding.info/states/md/MD_MAPFinalReport.pdf
Mangan, M.T., Purinton, T. & Aportela, A. (2010). Illinois school finance adequacy study – Parts I & II: A
Comparison of Statewide Simulation of Adequate Funds to Current Revenues. Chicago, IL: National Louis University.
Odden, A. (2007). Final report on the reviews of the report on the cost of education in New Jersey.
Madison, WI: Author. Odden, A., Picus, L.O., Archibald, S., Goetz, M., Mangan, M.T., & Aportela, A. (2007). Moving from good
to great in Wisconsin: Funding schools adequately and doubling student performance. Madison, WI: The Wisconsin School Finance Adequacy Initiative. Retrieved from: http://picusodden.com/state-studies/
Odden, A., Picus, L.O., & Fermanich, M. (2003). An evidenced-based approach to school finance
adequacy in Arkansas. North Hollywood, CA: Lawrence O. Picus and Associates. Retrieved from: http://picusodden.com/wp-content/uploads/2013/09/AR_2003_EB_Report.pdf
Odden, A., Picus, L. O., Fermanich, M., & Goetz, M. (2004). An evidenced-based approach to school
finance adequacy in Arizona. North Hollywood, CA: Lawrence O. Picus and Associates. Retrieved from: http://picusodden.com/wp-content/uploads/2013/09/AFSFinalAOLong1.pdf

A Comprehensive Review of State Adequacy Studies Since 2003
65
Odden. A., Picus, L.O., & Goetz, M. (2006). Recalibrating the Arkansas school funding structure. North Hollywood, CA: Lawrence O. Picus and Associates. Retrieved from: http://www.schoolfunding.info/states/ar/costingout_ar06.php3
Odden, A., Picus, L.O., & Goetz, M. (2014). Recalibrating North Dakota’s per student number for the
school foundation program. North Hollywood, CA: Picus Odden & Associates. Retrieved from: http://picusodden.com/state-studies/
Odden, A., Picus, L.O., Goetz, M., Aportela, A., & Archibald, S. (2008). Funding schools adequately in
North Dakota: Resources to double student performance. North Hollywood, CA: Lawrence O. Picus and Associates. Retrieved from: http://picusodden.com/state-studies/
Odden, A., Picus, L.O., Goetz, M., Fermanich, M., Seder, R.C., Glenn, W., & Nelli, R. (2005). An evidence-
based approach to recalibrating Wyoming’s block grant school funding formula. North Hollywood, CA: Lawrence O. Picus and Associates. Retrieved from: http://picusodden.com/state-studies/
Odden, A., Picus, L.O., Goetz, M., Mangan, M.T., & Fermanich, M. (2006). An evidence-based approach
to school finance adequacy in Washington. North Hollywood, CA: Lawrence O. Picus and Associates. Picus, L.O., & Odden, A. (2009). Review and analysis of Ohio’s evidence-based model. North Hollywood,
CA: Lawrence O. Picus & Associates. Retrieved from: http://picusodden.com/wp-content/uploads/2013/09/Ohio-EB-Report-Final.pdf
Picus, L.O., Odden, A., & Fermanich, M. (2003a). A professional judgment panel approach to school
finance adequacy in Kentucky. North Hollywood, CA: Lawrence O. Picus and Associates. Retrieved from: http://picusodden.com/state-studies/
Picus, L.O., Odden, A., & Fermanich, M. (2003b). A state-of-the-art approach to school finance adequacy
in Kentucky. North Hollywood, CA: Lawrence O. Picus and Associates. Retrieved from: http://picusodden.com/state-studies/
Picus, L.O., Odden, A., Goetz, M., & Aportela, A. (2012). Estimating the cost of an adequate education for
Texas school districts using the evidence-based approach. North Hollywood, CA: Lawrence O. Picus and Associates.
Picus, L.O., Odden, A., Goetz, M., Griffith, M., Glenn, W., Hirshberg, D., & Aportela, A. (2013). An
independent review of Maine’s essential programs and services funding act: Parts I & II. North Hollywood, CA: Lawrence O. Picus and Associates. Retrieved from: http://picusodden.com/state-studies/
R.C. Woods & Associates. (2007). State of Rhode Island education adequacy study. Gainesville, FL:
Author. Retrieved from: http://www.classworks.com/uploads/research/RhodeIsland_RIEFAStudy.pdf
Seder, R.C., Smith, J.R., & Guthrie, J.W. (2004). Preliminary study to determine adequate education
funding in Minnesota. Davis, CA: Management Analysis & Planning, Inc. Retrieved from: http://www.edconsultants.com/documents/mn-final-report-rcs.pdf

A Comprehensive Review of State Adequacy Studies Since 2003
66
Silverstein, J., Rose, D., & Myers, J. (2006). Estimating the cost of an adequate education in Minnesota. Denver, CO: Augenblick, Palaich and Associates, Inc. Retrieved from: http://www.schoolfunding.info/states/mn/MN-APA-11-06.pdf
Silverstein, J., Rose, D., Palaich, R., Myers, J., & Brown, A. (2007). Estimating the cost of an adequate
education in Montana. Denver, CO: Augenblick, Palaich and Associates, Inc. Retrieved from: http://apaconsulting.net/~apa/wp-content/uploads/2014/06/5-montana.pdf
Sontelie, J. (2007). Aligning school finance with academic standards: A weighted-student formula based
on a survey of practitioners. San Francisco, CA: Public Policy Institute of California. Retrieved from: http://cepa.stanford.edu/gdtf/publications
Standard & Poor’s School Evaluation Services. (2004). Resource adequacy study for the New York state
commission on education reform. New York, NY: Author. Retrieved from: http://www.schoolfunding.info/states/ny/ny_sp_coststudy_2004.pdf
Verstegen, D. A., (2004). Calculation of the cost of an adequate education in Kentucky: A professional
judgment approach. Education Policy Analysis Archives, 12(8). Retrieved August 10, 2014 from http://epaa.asu.edu/epaa/v12n8/
Wood, R.C., Robson, D., Farrier, M., Smith, S., Silverthrone, J., & Griffith, M. (2005). Determining the cost
of providing an adequate education in the state of Montana. Gainesville, FL: R.C. Wood &
Associates. Retrieved from: http://www.schoolfunding.info/states/mt/MT-Wood2005.pdf
Additional References Lockwood, J.R., McCombs, J.S., & Marsh, J. (2010). Linking reading coaches and student achievement:
Evidence from Florida middle schools. Educational Evaluation and Policy Analysis, 32(3), 372–388.
Marsh, J., McCombs, J.S., & Martorell, F. (2010). How instructional coaches support data-driven decision
making. Educational Policy, 24(6), 872–907.
MGT of America, Inc. (2008). An evaluation of the effect of increased state aid to local school systems through the bridge to excellence act. Final report. Tallahassee, FL: Maryland State Department of Education.
Odden, A. & Picus, L. (2014). School Finance: A Policy Perspective, 5th Edition. New York: McGraw Hill.
Pianta, R., Allen, J., & King, H. (2011). An interaction-based approach to enhancing secondary school
instruction and student achievement, Science, 333 (6045), 1034-1037.

A Comprehensive Review of State Adequacy Studies Since 2003
67
Appendix A: Standards, State Assessments and the Adequacy
Studies The fundamental purpose of an adequacy study is to determine the level of resources required within a
state or local education agency for providing all students with the opportunity to meet state learning
standards and performance expectations. These learning standards and expectations are described and
measured by the academic standards and assessment regime adopted by the state. The role played by
state standards and assessments in guiding a study of financial adequacy varies by the study approach
used. The following provides a brief description of how Maryland’s state standards and assessments will
be used to guide and inform the adequacy studies presented in the study team’s proposal and the
interaction of the study’s timeline and the implementation schedule for the new PARCC assessments
adopted by the state.
For this work, the study team has proposed using three different adequacy methods – evidence-based,
professional judgment and successful schools. For the first two methods, evidence-based and
professional judgment, state standards provide the benchmark for directing the discussions and fiscal
decisions that take place. State assessments, on the other hand, play only an indirect role by providing
an indication of how well the educational system is currently meeting state expectations.
In the evidence-based approach specific research-supported programs and strategies are used to
construct a comprehensive educational model that should support students in meeting the state’s
specific academic expectations. A total adequacy cost is then calculated by costing out the various
elements of the educational model. Similarly, under the professional judgment approach, participating
panelists are instructed on the content and performance expectations contained in the standards and
then asked to construct a comprehensive educational cost model that will enable students to meet
these expectations. In neither case are state assessment results necessary for linking performance
expectations with the adequacy cost model.
Of the three approaches, the successful schools approach makes direct use of state assessment results
to determine adequacy. The estimate of an adequate per student base cost is based on how much is
spent by districts currently performing well on state assessments – that ideally are aligned with the
state’s standards. These estimates may be more or less inaccurate to the extent that the state’s
standards and assessments are not aligned.
The successful schools adequacy work in Maryland is complicated by the fact that the state adopted its
College and Career-Ready Standards in 2011-12 but will not administer the PARCC assessments aligned to
the new standards until 2014-15. The assessments currently used by the state, the Maryland School
Assessment (MSA) and Maryland High School Assessments (MHSA), are not aligned with the new
standards. However, the selection of successful schools (and schools to be included in the case studies
used to inform our adequacy recommendations) must take place in the fall of 2014, well before the first
administration of the PARCC assessments. Working with MSDE staff, we have developed a plan that will
keep the study on schedule while incorporating performance information from the new, aligned PARCC
assessments.

A Comprehensive Review of State Adequacy Studies Since 2003
68
The initial selection of schools for the successful schools adequacy study and the case studies will be
based on six years of MSA and MHSA assessment data for the years 2006 through 2011, during which
the state’s prior standards were still in effect. This ensures that our school selections will reflect
performance data based on aligned standards and assessments. The state’s new College and Career-
Ready Standards were adopted in 2012, so assessment results from 2012 through 2014 will not be
directly comparable to the earlier assessment results.
Although we will be well into our successful schools analysis by the time results for the first
administration of the PARCC assessments become available sometime during the summer or early fall of
2015, we will rerun our school selection analysis using the PARCC-based performance data to determine
if our list of high-performing schools changes significantly and whether any schools should be added to
or dropped from the list of successful schools based on the new assessment data. The criteria for making
changes to the list of successful schools will be developed after the data are available and there is a
better understanding of magnitude and direction of changes in the performance results. If the list of
schools changes, we will rerun the analysis to calculate a new per student base cost based on the new
list of schools.
To date, no other state that has contracted for an adequacy study that used assessment data aligned to
the Common Core to identify successful schools or districts, making Maryland the first state to do so.
Given the relative youth of the Common Core Standards and the time it takes to develop and implement
aligned assessments, there have been only a few states (Texas 2012, Colorado 2013, and Maine 2014)
that have explicitly referenced the Common Core and/or college and career standards as the goal for
student achievement, but none of these used data from assessments in their adequacy studies.