capital adequacy capital adequacy (consolidated) · annual report 2017 the norinchukin bank 127...
TRANSCRIPT
127ANNUAL REPORT 2017 The Norinchukin Bank
CAPITAL ADEQUACY
Disclosure Regarding Capital Adequacy
The Bank calculates its capital adequacy ratio based on
the formula contained in Notification No. 4 of the 2006
Financial Services Agency and the Ministry of Agriculture,
Forestry and Fisheries of Japan entitled “Standards
for Judging the Soundness of Management of The
Norinchukin Bank” (hereinafter, “Notification Regarding
Capital Adequacy Ratio”). In addition, to calculate risk-
weighted assets for credit risk, the Bank has adopted the
“Advanced Internal Ratings-Based Approach (A-IRB)
(partially the Foundation Internal Ratings-Based Approach
(F-IRB))” and “The Standardized Approach (TSA)” for
calculating operational risk capital charges.
Regarding the calculation of capital adequacy ratio,
the Bank has been audited by Ernst & Young ShinNihon
LLC pursuant to “Treatment of Inspection of the Capital
Ratio Calculation Framework Based on Agreed-upon
Procedures” (JICPA Industry Committee Report No. 30).
It does not constitute a part of the audit on financial state-
ments by law, but a review on agreed-upon procedures
on internal control of the capital adequacy calculation.
Accordingly, Ernst & Young ShinNihon LLC does not
express any audit opinion as a result of the review.
The disclosure requirements for the Bank are provided
in Notification No. 6 of the 2007 Financial Services
Agency and the Ministry of Agriculture, Forestry and
Fisheries of Japan entitled “Disclosure Items Related to
Capital Adequacy of The Norinchukin Bank” (hereinafter,
“Disclosure Notification”). These disclosures can be found
in this annual report as well as in the IR Library of the
Bank’s website at https://www.nochubank.or.jp/.
Capital Adequacy (Consolidated)
Scope of Consolidation
• Reason for discrepancies between companies belong-
ing to the Bank’s group that are required to compute
a consolidated capital adequacy ratio, as specified in
the Notification Regarding Capital Adequacy Ratio,
Article 3 (hereinafter, “the Consolidated Group”) and the
companies included in the scope of consolidation, based
on “Ordinance on Terminology, Forms and Preparation
Methods of Consolidated Financial Statement” under
Ministerial Ordinance No. 28, issued by the Ministry of
Finance in 1976:
Not applicable
• As of March 31, 2017, the Bank had 12 consolidated
subsidiaries. The names and principal lines of business of
the primary subsidiaries are as follows:
1. Norinchukin Trust & Banking Co., Ltd.: Trust and
banking business
2. Kyodo Housing Loan Co., Ltd.: Loans and guaran-
tees for housing
• Companies belonging to the Consolidated Group but not
included in the scope of consolidation:
Not applicable
• Companies not belonging to the Consolidated Group but
included in the scope of consolidation:
Not applicable
• Affiliated companies engaged in financial service busi-
ness that were subject to the provisions of Article 9 of the
Notification Regarding Capital Adequacy Ratio:
Not applicable
• Restrictions on the transfer of funds and capital between
the members of the Consolidated Group:
Not applicable
Companies with Less than the
Regulatory Required Capital and the
Amount of Shortfall
With regard to the group companies that are subject to capi-
tal deduction, as provided for in the Notification Regarding
Capital Adequacy Ratio, the names of those companies
whose capital is less than the regulatory required capital
and the total amount of shortfall in their capital:
Not applicable
Remarks on Computation of the Consolidated Capital Adequacy Ratio
128 ANNUAL REPORT 2017 The Norinchukin Bank
CAPITAL ADEQUACY
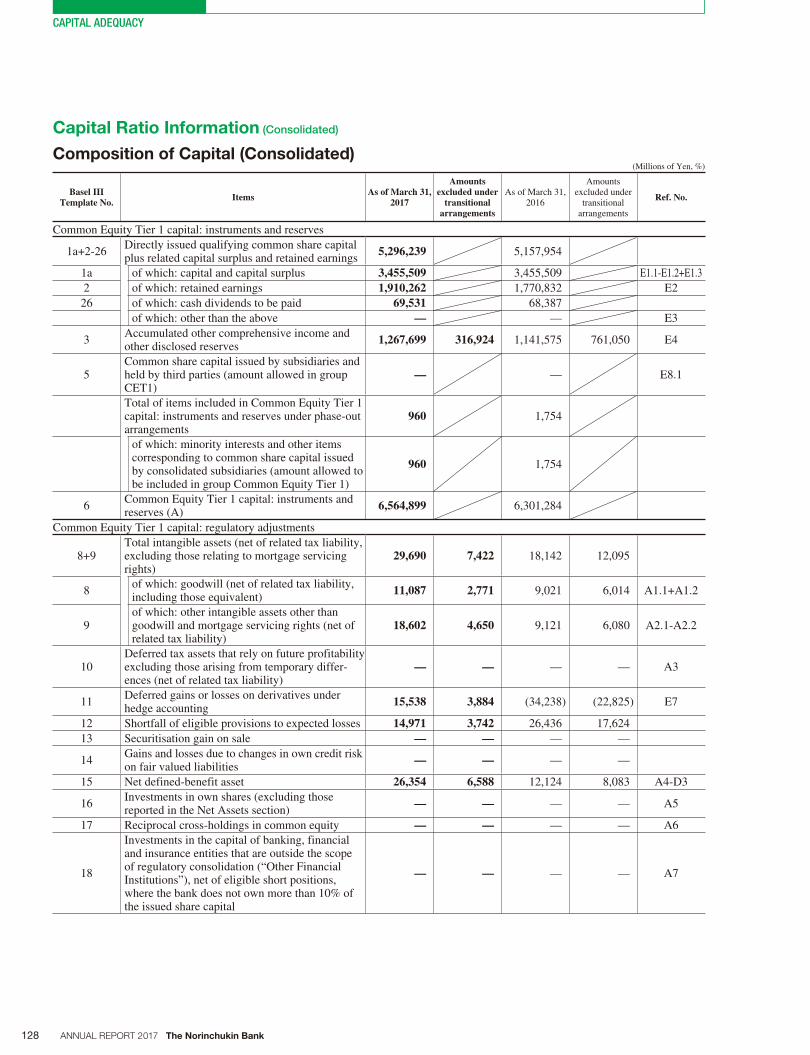
Capital Ratio Information (Consolidated)
Composition of Capital (Consolidated)(Millions of Yen, %)
Basel III Template No. Items As of March 31,
2017
Amounts excluded under
transitional arrangements
As of March 31, 2016
Amounts excluded under
transitional arrangements
Ref. No.
Common Equity Tier 1 capital: instruments and reserves
1a+2-26Directly issued qualifying common share capital plus related capital surplus and retained earnings
5,296,239 5,157,954
1a of which: capital and capital surplus 3,455,509 3,455,509 E1.1-E1.2+E1.3
2 of which: retained earnings 1,910,262 1,770,832 E2
26 of which: cash dividends to be paid 69,531 68,387
of which: other than the above — — E3
3Accumulated other comprehensive income and other disclosed reserves
1,267,699 316,924 1,141,575 761,050 E4
5Common share capital issued by subsidiaries and held by third parties (amount allowed in group CET1)
— — E8.1
Total of items included in Common Equity Tier 1 capital: instruments and reserves under phase-out arrangements
960 1,754
of which: minority interests and other items corresponding to common share capital issued by consolidated subsidiaries (amount allowed to be included in group Common Equity Tier 1)
960 1,754
6Common Equity Tier 1 capital: instruments and reserves (A)
6,564,899 6,301,284
Common Equity Tier 1 capital: regulatory adjustments
8+9Total intangible assets (net of related tax liability, excluding those relating to mortgage servicing rights)
29,690 7,422 18,142 12,095
8of which: goodwill (net of related tax liability, including those equivalent)
11,087 2,771 9,021 6,014 A1.1+A1.2
9of which: other intangible assets other than goodwill and mortgage servicing rights (net of related tax liability)
18,602 4,650 9,121 6,080 A2.1-A2.2
10Deferred tax assets that rely on future profitability excluding those arising from temporary differ-ences (net of related tax liability)
— — — — A3
11Deferred gains or losses on derivatives under hedge accounting
15,538 3,884 (34,238) (22,825) E7
12 Shortfall of eligible provisions to expected losses 14,971 3,742 26,436 17,624
13 Securitisation gain on sale — — — —
14Gains and losses due to changes in own credit risk on fair valued liabilities
— — — —
15 Net defined-benefit asset 26,354 6,588 12,124 8,083 A4-D3
16Investments in own shares (excluding those reported in the Net Assets section)
— — — — A5
17 Reciprocal cross-holdings in common equity — — — — A6
18
Investments in the capital of banking, financial and insurance entities that are outside the scope of regulatory consolidation (“Other Financial Institutions”), net of eligible short positions, where the bank does not own more than 10% of the issued share capital
— — — — A7
129ANNUAL REPORT 2017 The Norinchukin Bank
CAPITAL ADEQUACY
(Millions of Yen, %)
Basel III Template No. Items As of March 31,
2017
Amounts excluded under
transitional arrangements
As of March 31, 2016
Amounts excluded under
transitional arrangements
Ref. No.
19+20+21Amount exceeding the 10% threshold on speci-fied items
— — — —
19of which: significant investments in the com-mon stock of financials
— — — — A8
20 of which: mortgage servicing rights — — — — A9
21of which: deferred tax assets arising from tem-porary differences (net of related tax liability)
— — — — A10
22Amount exceeding the 15% threshold on speci-fied items
— — — —
23of which: significant investments in the com-mon stock of financials
— — — — A11
24 of which: mortgage servicing rights — — — — A12
25of which: deferred tax assets arising from tem-porary differences (net of related tax liability)
— — — — A13
27Regulatory adjustments applied to Common Equity Tier 1 due to insufficient Additional Tier 1 and Tier 2 to cover deductions
— —
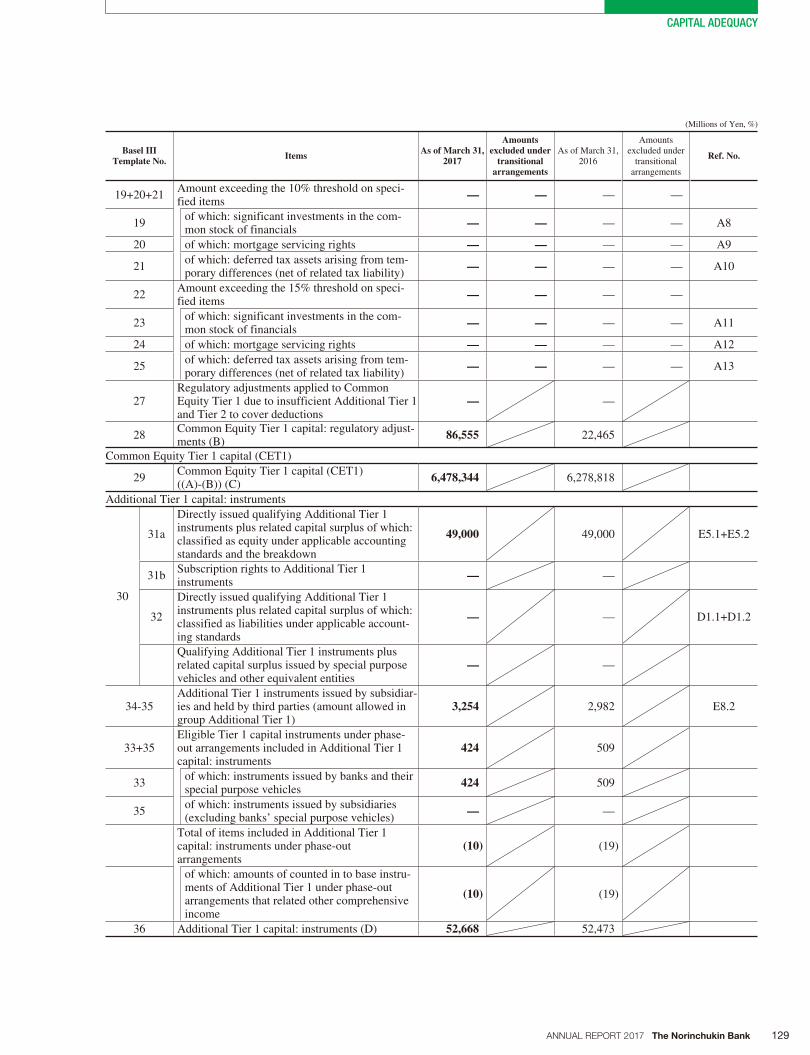
28Common Equity Tier 1 capital: regulatory adjust-ments (B)
86,555 22,465
Common Equity Tier 1 capital (CET1)
29Common Equity Tier 1 capital (CET1)((A)-(B)) (C)
6,478,344 6,278,818
Additional Tier 1 capital: instruments
30
31a
Directly issued qualifying Additional Tier 1 instruments plus related capital surplus of which: classified as equity under applicable accounting standards and the breakdown
49,000 49,000 E5.1+E5.2
31bSubscription rights to Additional Tier 1 instruments
— —
32
Directly issued qualifying Additional Tier 1 instruments plus related capital surplus of which: classified as liabilities under applicable account-ing standards
— — D1.1+D1.2
Qualifying Additional Tier 1 instruments plus related capital surplus issued by special purpose vehicles and other equivalent entities
— —
34-35Additional Tier 1 instruments issued by subsidiar-ies and held by third parties (amount allowed in group Additional Tier 1)
3,254 2,982 E8.2
33+35Eligible Tier 1 capital instruments under phase-out arrangements included in Additional Tier 1 capital: instruments
424 509
33of which: instruments issued by banks and their special purpose vehicles
424 509
35of which: instruments issued by subsidiaries (excluding banks’ special purpose vehicles)
— —
Total of items included in Additional Tier 1 capital: instruments under phase-out arrangements
(10) (19)
of which: amounts of counted in to base instru-ments of Additional Tier 1 under phase-out arrangements that related other comprehensive income
(10) (19)
36 Additional Tier 1 capital: instruments (D) 52,668 52,473

130 ANNUAL REPORT 2017 The Norinchukin Bank
CAPITAL ADEQUACY
(Millions of Yen, %)
Basel III Template No. Items As of March 31,
2017
Amounts excluded under
transitional arrangements
As of March 31, 2016
Amounts excluded under
transitional arrangements
Ref. No.
Additional Tier 1 capital: regulatory adjustments
37 Investments in own Additional Tier 1 instruments — — — — A14
38Reciprocal cross-holdings in Additional Tier 1 instruments
— — — — A15
39
Investments in the capital of banking, financial and insurance entities that are outside the scope of regulatory consolidation, net of eligible short positions, where the bank does not own more than 10% of the issued common share capital of the entity (amount above the 10% threshold)
— — — — A16
40
Significant investments in the capital of banking, financial and insurance entities that are outside the scope of regulatory consolidation (net of eligible short positions)
40,027 10,006 29,222 19,481 A17
Total of items included in Additional Tier 1 capital: regulatory adjustments under phase-out arrangements
1,871 8,812
of which: 50% of balance due to pay of eligible provisions
1,871 8,812
42Regulatory adjustments applied to Additional Tier 1 due to insufficient Tier 2 to cover deductions
— —
43 Additional Tier 1 capital: regulatory adjustments (E) 41,898 38,034
Additional Tier 1 capital (AT1)
44 Additional Tier 1 capital (AT1) ((D)-(E)) (F) 10,769 14,439
Tier 1 capital (T1=CET1+AT1)
45 Tier 1 capital (T1=CET1+AT1) ((C)+(F)) (G) 6,489,114 6,293,257
Tier 2 capital: instruments and provisions
46
Directly issued qualifying Tier 2 instruments plus related capital surplus of which: classified as equity under applicable accounting standards and its breakdown
— — E6
Subscription rights to Tier 2 instruments — —
Directly issued qualifying Tier 2 instruments plus related capital surplus of which: classified as liabilities under applicable accounting standards
1,415,480 1,415,480 D2.1+D2.2
Tier 2 instruments plus related capital surplus issued by special purpose vehicles and other equivalent entities
— —
48-49Tier 2 instruments issued by subsidiaries and held by third parties (amount allowed in group Tier 2)
96 197 E8.3
47+49Eligible Tier 2 capital instruments under phase-out arrangements included in Tier 2: instruments and provisions
97,816 147,816
47of which: instruments issued by banks and their special purpose vehicles
97,816 147,816
49of which: instruments issued by subsidiaries (excluding banks’ special purpose vehicles)
— —
50Total of general reserve for possible loan losses and eligible provisions included in Tier 2
12 6
50a of which: general reserve for possible loan losses 12 6 A18
50b of which: eligible provisions — — A19
Total of items included in Tier 2 capital: instruments and provisions under phase-out arrangements
192,795 487,276
of which: amounts of counted in to base instru-ments of Additional Tier 1 under phase-out arrangements that related other comprehensive income
192,795 487,276
51 Tier 2 capital: instruments and provisions (H) 1,706,199 2,050,776
131ANNUAL REPORT 2017 The Norinchukin Bank
CAPITAL ADEQUACY
(Millions of Yen, %)
Basel III Template No. Items As of March 31,
2017
Amounts excluded under
transitional arrangements
As of March 31, 2016
Amounts excluded under
transitional arrangements
Ref. No.
Tier 2 capital: regulatory adjustments
52 Investments in own Tier 2 instruments — — — — A20
53 Reciprocal cross-holdings in Tier 2 instruments — — — — A21
54
Investments in the capital of banking, financial and insurance entities that are outside the scope of regulatory consolidation, net of eligible short positions, where the bank does not own more than 10% of the issued common share capital of the entity (amount above the 10% threshold)
— — — — A22
55
Significant investments in the capital banking, financial and insurance entities that are outside the scope of regulatory consolidation (net of eligible short positions)
— — — — A23
Total of items included in Tier 2 capital: regulatory adjustments under phase-out arrangements
14,592 34,192
of which: intangibles assets other than mortgage servicing rights
2,771 6,014
of which: 50% of balance due to pay of eligible provisions
1,871 8,812
of which: significant investments in the additional Tier 1 capital of other financial institutions
9,948 19,365
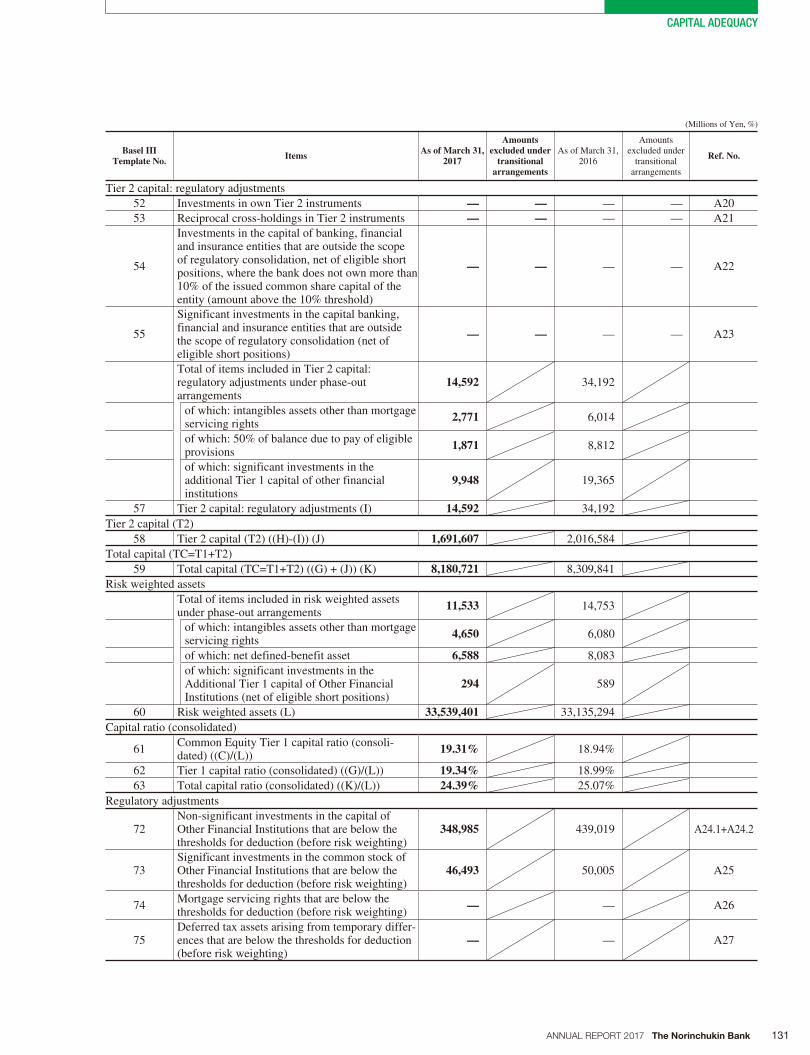
57 Tier 2 capital: regulatory adjustments (I) 14,592 34,192
Tier 2 capital (T2)
58 Tier 2 capital (T2) ((H)-(I)) (J) 1,691,607 2,016,584
Total capital (TC=T1+T2)
59 Total capital (TC=T1+T2) ((G) + (J)) (K) 8,180,721 8,309,841
Risk weighted assets
Total of items included in risk weighted assets under phase-out arrangements
11,533 14,753
of which: intangibles assets other than mortgage servicing rights
4,650 6,080
of which: net defined-benefit asset 6,588 8,083
of which: significant investments in the Additional Tier 1 capital of Other Financial Institutions (net of eligible short positions)
294 589
60 Risk weighted assets (L) 33,539,401 33,135,294
Capital ratio (consolidated)
61Common Equity Tier 1 capital ratio (consoli-dated) ((C)/(L))
19.31% 18.94%
62 Tier 1 capital ratio (consolidated) ((G)/(L)) 19.34% 18.99%
63 Total capital ratio (consolidated) ((K)/(L)) 24.39% 25.07%
Regulatory adjustments
72Non-significant investments in the capital of Other Financial Institutions that are below the thresholds for deduction (before risk weighting)
348,985 439,019 A24.1+A24.2
73Significant investments in the common stock of Other Financial Institutions that are below the thresholds for deduction (before risk weighting)
46,493 50,005 A25
74Mortgage servicing rights that are below the thresholds for deduction (before risk weighting)
— — A26
75Deferred tax assets arising from temporary differ-ences that are below the thresholds for deduction (before risk weighting)
— — A27
132 ANNUAL REPORT 2017 The Norinchukin Bank
CAPITAL ADEQUACY
(Millions of Yen, %)
Basel III Template No. Items As of March 31,
2017
Amounts excluded under
transitional arrangements
As of March 31, 2016
Amounts excluded under
transitional arrangements
Ref. No.
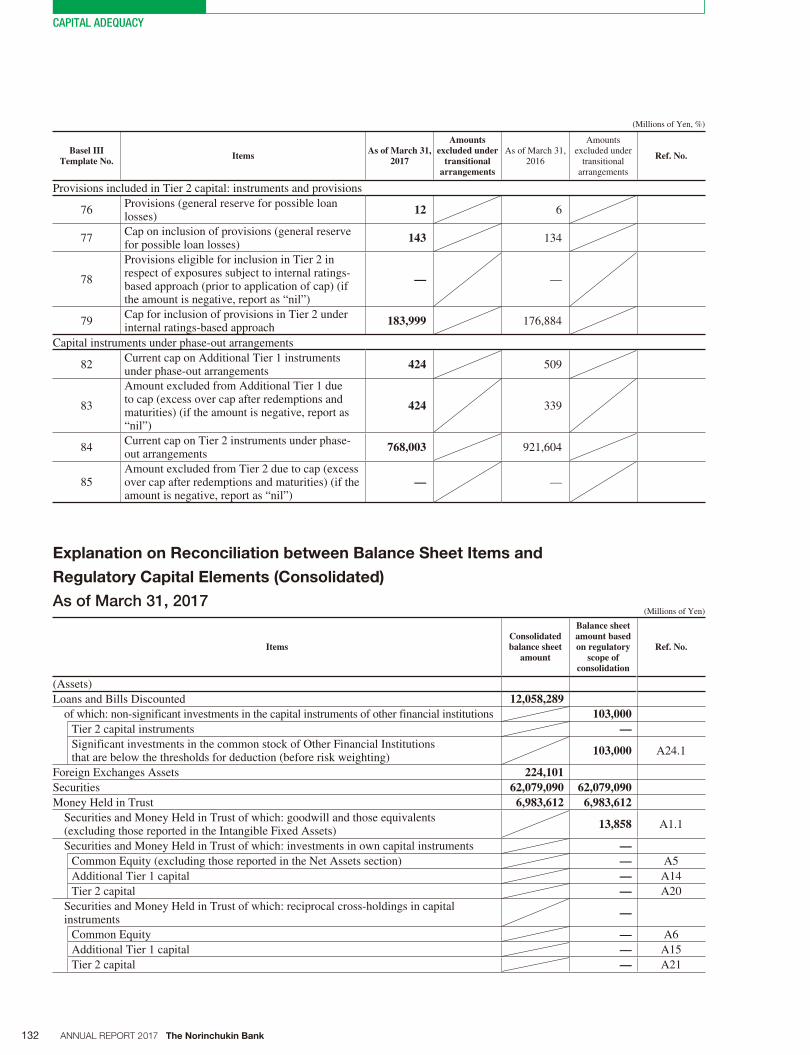
Provisions included in Tier 2 capital: instruments and provisions
76Provisions (general reserve for possible loan losses)
12 6
77Cap on inclusion of provisions (general reserve for possible loan losses)
143 134
78
Provisions eligible for inclusion in Tier 2 in respect of exposures subject to internal ratings-based approach (prior to application of cap) (if the amount is negative, report as “nil”)
— —
79Cap for inclusion of provisions in Tier 2 under internal ratings-based approach
183,999 176,884
Capital instruments under phase-out arrangements
82Current cap on Additional Tier 1 instruments under phase-out arrangements
424 509
83
Amount excluded from Additional Tier 1 due to cap (excess over cap after redemptions and maturities) (if the amount is negative, report as “nil”)
424 339
84Current cap on Tier 2 instruments under phase-out arrangements
768,003 921,604
85Amount excluded from Tier 2 due to cap (excess over cap after redemptions and maturities) (if the amount is negative, report as “nil”)
— —
(Millions of Yen)
ItemsConsolidated balance sheet
amount
Balance sheetamount based on regulatory
scope of consolidation
Ref. No.
(Assets)
Loans and Bills Discounted 12,058,289of which: non-significant investments in the capital instruments of other financial institutions 103,000
Tier 2 capital instruments — Significant investments in the common stock of Other Financial Institutions that are below the thresholds for deduction (before risk weighting)
103,000 A24.1
Foreign Exchanges Assets 224,101Securities 62,079,090 62,079,090Money Held in Trust 6,983,612 6,983,612
Securities and Money Held in Trust of which: goodwill and those equivalents (excluding those reported in the Intangible Fixed Assets)
13,858 A1.1
Securities and Money Held in Trust of which: investments in own capital instruments —Common Equity (excluding those reported in the Net Assets section) — A5
Additional Tier 1 capital — A14
Tier 2 capital — A20
Securities and Money Held in Trust of which: reciprocal cross-holdings in capital instruments
—
Common Equity — A6
Additional Tier 1 capital — A15
Tier 2 capital — A21
Explanation on Reconciliation between Balance Sheet Items and
Regulatory Capital Elements (Consolidated)
As of March 31, 2017
133ANNUAL REPORT 2017 The Norinchukin Bank
CAPITAL ADEQUACY
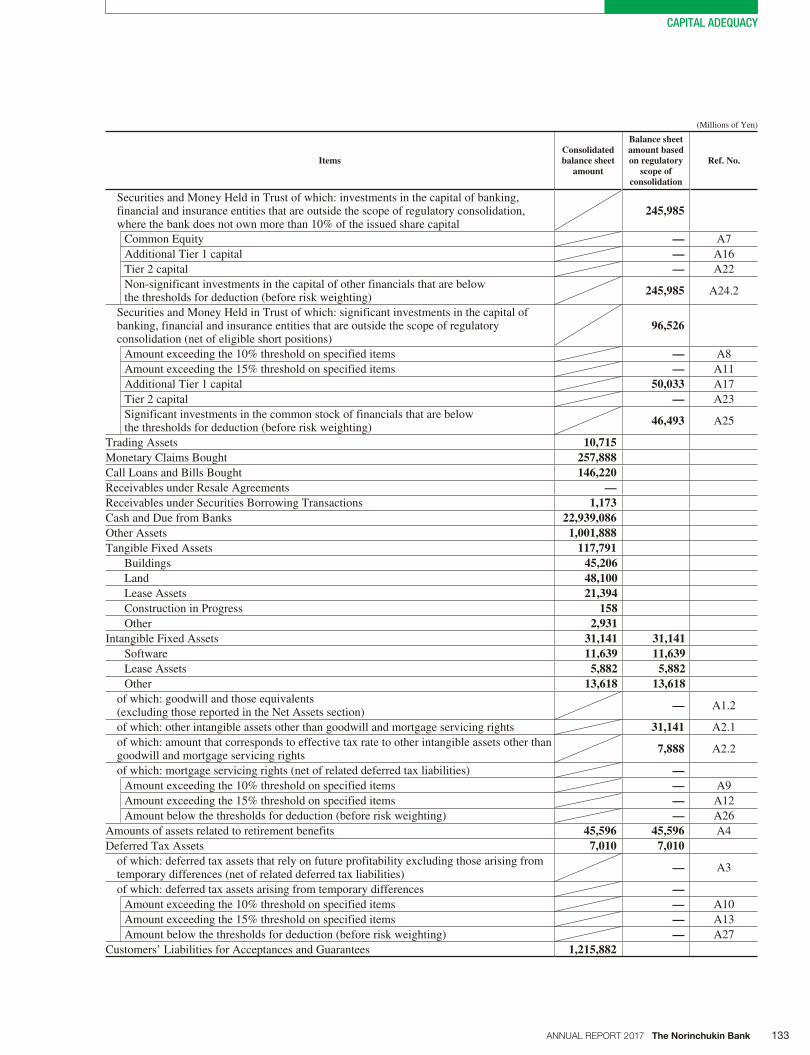
(Millions of Yen)
ItemsConsolidated balance sheet
amount
Balance sheetamount based on regulatory
scope of consolidation
Ref. No.
Securities and Money Held in Trust of which: investments in the capital of banking, financial and insurance entities that are outside the scope of regulatory consolidation, where the bank does not own more than 10% of the issued share capital
245,985
Common Equity — A7
Additional Tier 1 capital — A16
Tier 2 capital — A22
Non-significant investments in the capital of other financials that are below the thresholds for deduction (before risk weighting)
245,985 A24.2
Securities and Money Held in Trust of which: significant investments in the capital of banking, financial and insurance entities that are outside the scope of regulatory consolidation (net of eligible short positions)
96,526
Amount exceeding the 10% threshold on specified items — A8
Amount exceeding the 15% threshold on specified items — A11
Additional Tier 1 capital 50,033 A17
Tier 2 capital — A23
Significant investments in the common stock of financials that are below the thresholds for deduction (before risk weighting)
46,493 A25
Trading Assets 10,715Monetary Claims Bought 257,888Call Loans and Bills Bought 146,220Receivables under Resale Agreements — Receivables under Securities Borrowing Transactions 1,173Cash and Due from Banks 22,939,086Other Assets 1,001,888Tangible Fixed Assets 117,791
Buildings 45,206Land 48,100Lease Assets 21,394Construction in Progress 158Other 2,931
Intangible Fixed Assets 31,141 31,141Software 11,639 11,639Lease Assets 5,882 5,882Other 13,618 13,618
of which: goodwill and those equivalents (excluding those reported in the Net Assets section)
— A1.2
of which: other intangible assets other than goodwill and mortgage servicing rights 31,141 A2.1
of which: amount that corresponds to effective tax rate to other intangible assets other than goodwill and mortgage servicing rights
7,888 A2.2
of which: mortgage servicing rights (net of related deferred tax liabilities) —Amount exceeding the 10% threshold on specified items — A9
Amount exceeding the 15% threshold on specified items — A12
Amount below the thresholds for deduction (before risk weighting) — A26
Amounts of assets related to retirement benefits 45,596 45,596 A4
Deferred Tax Assets 7,010 7,010of which: deferred tax assets that rely on future profitability excluding those arising from temporary differences (net of related deferred tax liabilities)
— A3
of which: deferred tax assets arising from temporary differences —Amount exceeding the 10% threshold on specified items — A10
Amount exceeding the 15% threshold on specified items — A13
Amount below the thresholds for deduction (before risk weighting) — A27
Customers’ Liabilities for Acceptances and Guarantees 1,215,882
134 ANNUAL REPORT 2017 The Norinchukin Bank
CAPITAL ADEQUACY
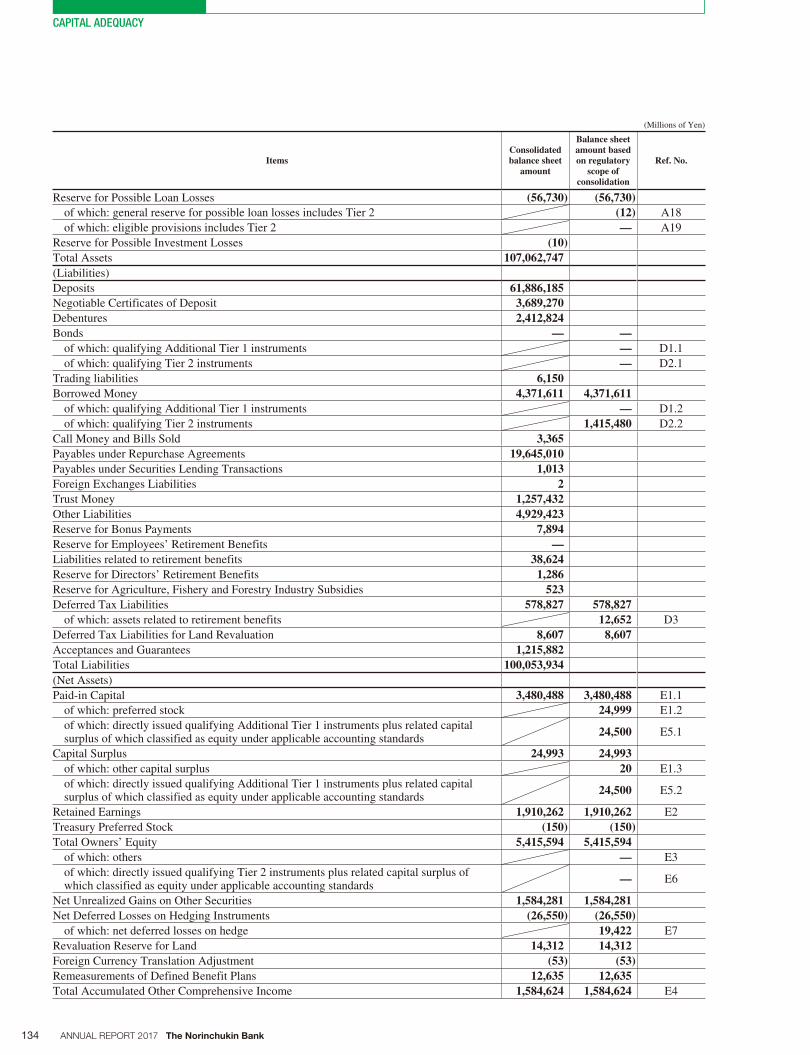
(Millions of Yen)
ItemsConsolidated balance sheet
amount
Balance sheetamount based on regulatory
scope of consolidation
Ref. No.
Reserve for Possible Loan Losses (56,730) (56,730)of which: general reserve for possible loan losses includes Tier 2 (12) A18
of which: eligible provisions includes Tier 2 — A19
Reserve for Possible Investment Losses (10)Total Assets 107,062,747(Liabilities)
Deposits 61,886,185Negotiable Certificates of Deposit 3,689,270Debentures 2,412,824Bonds — —
of which: qualifying Additional Tier 1 instruments — D1.1
of which: qualifying Tier 2 instruments — D2.1
Trading liabilities 6,150Borrowed Money 4,371,611 4,371,611
of which: qualifying Additional Tier 1 instruments — D1.2
of which: qualifying Tier 2 instruments 1,415,480 D2.2
Call Money and Bills Sold 3,365Payables under Repurchase Agreements 19,645,010Payables under Securities Lending Transactions 1,013Foreign Exchanges Liabilities 2Trust Money 1,257,432Other Liabilities 4,929,423Reserve for Bonus Payments 7,894Reserve for Employees’ Retirement Benefits —Liabilities related to retirement benefits 38,624Reserve for Directors’ Retirement Benefits 1,286Reserve for Agriculture, Fishery and Forestry Industry Subsidies 523Deferred Tax Liabilities 578,827 578,827
of which: assets related to retirement benefits 12,652 D3
Deferred Tax Liabilities for Land Revaluation 8,607 8,607Acceptances and Guarantees 1,215,882Total Liabilities 100,053,934(Net Assets)
Paid-in Capital 3,480,488 3,480,488 E1.1
of which: preferred stock 24,999 E1.2
of which: directly issued qualifying Additional Tier 1 instruments plus related capital surplus of which classified as equity under applicable accounting standards
24,500 E5.1
Capital Surplus 24,993 24,993of which: other capital surplus 20 E1.3
of which: directly issued qualifying Additional Tier 1 instruments plus related capital surplus of which classified as equity under applicable accounting standards
24,500 E5.2
Retained Earnings 1,910,262 1,910,262 E2
Treasury Preferred Stock (150) (150)Total Owners’ Equity 5,415,594 5,415,594
of which: others — E3
of which: directly issued qualifying Tier 2 instruments plus related capital surplus of which classified as equity under applicable accounting standards
— E6
Net Unrealized Gains on Other Securities 1,584,281 1,584,281Net Deferred Losses on Hedging Instruments (26,550) (26,550)
of which: net deferred losses on hedge 19,422 E7
Revaluation Reserve for Land 14,312 14,312Foreign Currency Translation Adjustment (53) (53)Remeasurements of Defined Benefit Plans 12,635 12,635Total Accumulated Other Comprehensive Income 1,584,624 1,584,624 E4
135ANNUAL REPORT 2017 The Norinchukin Bank
CAPITAL ADEQUACY
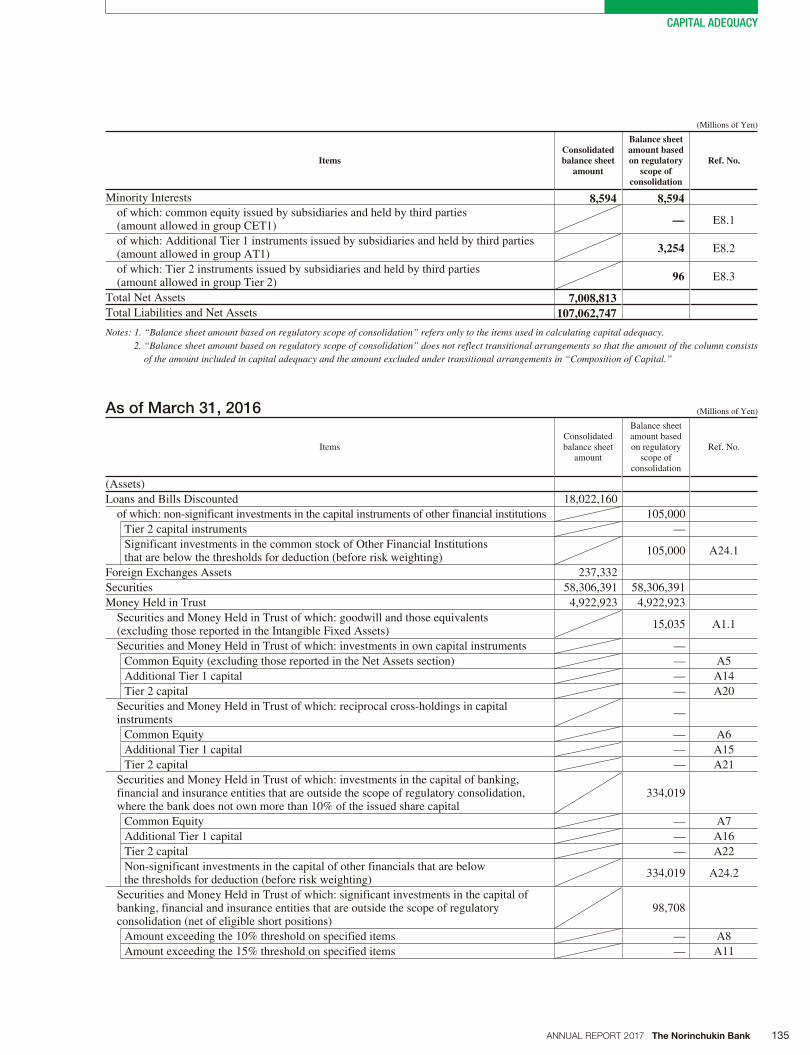
(Millions of Yen)
ItemsConsolidated balance sheet
amount
Balance sheetamount based on regulatory
scope of consolidation
Ref. No.
Minority Interests 8,594 8,594of which: common equity issued by subsidiaries and held by third parties (amount allowed in group CET1) — E8.1
of which: Additional Tier 1 instruments issued by subsidiaries and held by third parties (amount allowed in group AT1) 3,254 E8.2
of which: Tier 2 instruments issued by subsidiaries and held by third parties (amount allowed in group Tier 2)
96 E8.3
Total Net Assets 7,008,813Total Liabilities and Net Assets 107,062,747
Notes: 1. “Balance sheet amount based on regulatory scope of consolidation” refers only to the items used in calculating capital adequacy. 2. “Balance sheet amount based on regulatory scope of consolidation” does not reflect transitional arrangements so that the amount of the column consists
of the amount included in capital adequacy and the amount excluded under transitional arrangements in “Composition of Capital.”
(Millions of Yen)
ItemsConsolidated balance sheet
amount
Balance sheetamount based on regulatory
scope of consolidation
Ref. No.
(Assets)
Loans and Bills Discounted 18,022,160
of which: non-significant investments in the capital instruments of other financial institutions 105,000
Tier 2 capital instruments —
Significant investments in the common stock of Other Financial Institutions that are below the thresholds for deduction (before risk weighting)
105,000 A24.1
Foreign Exchanges Assets 237,332
Securities 58,306,391 58,306,391
Money Held in Trust 4,922,923 4,922,923
Securities and Money Held in Trust of which: goodwill and those equivalents (excluding those reported in the Intangible Fixed Assets)
15,035 A1.1
Securities and Money Held in Trust of which: investments in own capital instruments —
Common Equity (excluding those reported in the Net Assets section) — A5
Additional Tier 1 capital — A14
Tier 2 capital — A20
Securities and Money Held in Trust of which: reciprocal cross-holdings in capital instruments
—
Common Equity — A6
Additional Tier 1 capital — A15
Tier 2 capital — A21
Securities and Money Held in Trust of which: investments in the capital of banking, financial and insurance entities that are outside the scope of regulatory consolidation, where the bank does not own more than 10% of the issued share capital
334,019
Common Equity — A7
Additional Tier 1 capital — A16
Tier 2 capital — A22
Non-significant investments in the capital of other financials that are below the thresholds for deduction (before risk weighting)
334,019 A24.2
Securities and Money Held in Trust of which: significant investments in the capital of banking, financial and insurance entities that are outside the scope of regulatory consolidation (net of eligible short positions)
98,708
Amount exceeding the 10% threshold on specified items — A8
Amount exceeding the 15% threshold on specified items — A11
As of March 31, 2016
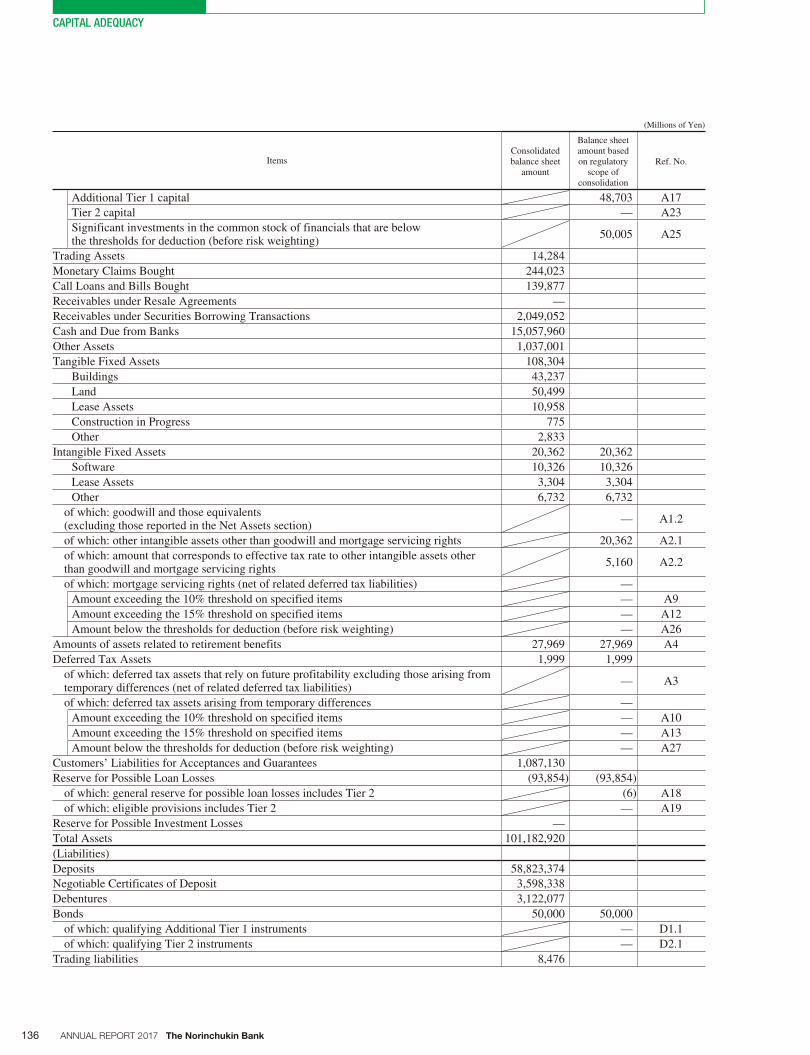
136 ANNUAL REPORT 2017 The Norinchukin Bank
CAPITAL ADEQUACY
(Millions of Yen)
ItemsConsolidated balance sheet
amount
Balance sheetamount based on regulatory
scope of consolidation
Ref. No.
Additional Tier 1 capital 48,703 A17
Tier 2 capital — A23
Significant investments in the common stock of financials that are below the thresholds for deduction (before risk weighting)
50,005 A25
Trading Assets 14,284
Monetary Claims Bought 244,023
Call Loans and Bills Bought 139,877
Receivables under Resale Agreements —
Receivables under Securities Borrowing Transactions 2,049,052
Cash and Due from Banks 15,057,960
Other Assets 1,037,001
Tangible Fixed Assets 108,304
Buildings 43,237
Land 50,499
Lease Assets 10,958
Construction in Progress 775
Other 2,833
Intangible Fixed Assets 20,362 20,362
Software 10,326 10,326
Lease Assets 3,304 3,304
Other 6,732 6,732
of which: goodwill and those equivalents (excluding those reported in the Net Assets section)
— A1.2
of which: other intangible assets other than goodwill and mortgage servicing rights 20,362 A2.1
of which: amount that corresponds to effective tax rate to other intangible assets other than goodwill and mortgage servicing rights
5,160 A2.2
of which: mortgage servicing rights (net of related deferred tax liabilities) —
Amount exceeding the 10% threshold on specified items — A9
Amount exceeding the 15% threshold on specified items — A12
Amount below the thresholds for deduction (before risk weighting) — A26
Amounts of assets related to retirement benefits 27,969 27,969 A4
Deferred Tax Assets 1,999 1,999
of which: deferred tax assets that rely on future profitability excluding those arising from temporary differences (net of related deferred tax liabilities)
— A3
of which: deferred tax assets arising from temporary differences —
Amount exceeding the 10% threshold on specified items — A10
Amount exceeding the 15% threshold on specified items — A13
Amount below the thresholds for deduction (before risk weighting) — A27
Customers’ Liabilities for Acceptances and Guarantees 1,087,130
Reserve for Possible Loan Losses (93,854) (93,854)
of which: general reserve for possible loan losses includes Tier 2 (6) A18
of which: eligible provisions includes Tier 2 — A19
Reserve for Possible Investment Losses —
Total Assets 101,182,920
(Liabilities)
Deposits 58,823,374
Negotiable Certificates of Deposit 3,598,338
Debentures 3,122,077
Bonds 50,000 50,000
of which: qualifying Additional Tier 1 instruments — D1.1
of which: qualifying Tier 2 instruments — D2.1
Trading liabilities 8,476
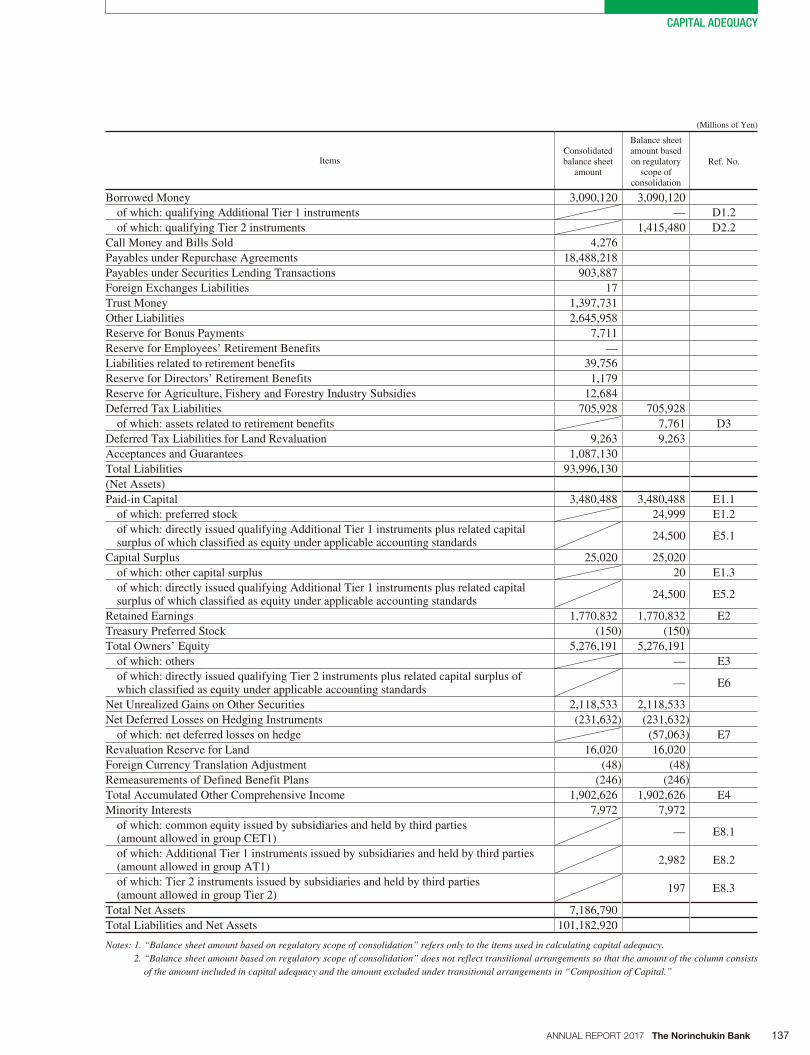
137ANNUAL REPORT 2017 The Norinchukin Bank
CAPITAL ADEQUACY
(Millions of Yen)
ItemsConsolidated balance sheet
amount
Balance sheetamount based on regulatory
scope of consolidation
Ref. No.
Borrowed Money 3,090,120 3,090,120
of which: qualifying Additional Tier 1 instruments — D1.2
of which: qualifying Tier 2 instruments 1,415,480 D2.2
Call Money and Bills Sold 4,276
Payables under Repurchase Agreements 18,488,218
Payables under Securities Lending Transactions 903,887
Foreign Exchanges Liabilities 17
Trust Money 1,397,731
Other Liabilities 2,645,958
Reserve for Bonus Payments 7,711
Reserve for Employees’ Retirement Benefits —
Liabilities related to retirement benefits 39,756
Reserve for Directors’ Retirement Benefits 1,179
Reserve for Agriculture, Fishery and Forestry Industry Subsidies 12,684
Deferred Tax Liabilities 705,928 705,928
of which: assets related to retirement benefits 7,761 D3
Deferred Tax Liabilities for Land Revaluation 9,263 9,263
Acceptances and Guarantees 1,087,130
Total Liabilities 93,996,130
(Net Assets)
Paid-in Capital 3,480,488 3,480,488 E1.1
of which: preferred stock 24,999 E1.2
of which: directly issued qualifying Additional Tier 1 instruments plus related capital surplus of which classified as equity under applicable accounting standards
24,500 E5.1
Capital Surplus 25,020 25,020
of which: other capital surplus 20 E1.3
of which: directly issued qualifying Additional Tier 1 instruments plus related capital surplus of which classified as equity under applicable accounting standards
24,500 E5.2
Retained Earnings 1,770,832 1,770,832 E2
Treasury Preferred Stock (150) (150)
Total Owners’ Equity 5,276,191 5,276,191
of which: others — E3
of which: directly issued qualifying Tier 2 instruments plus related capital surplus of which classified as equity under applicable accounting standards
— E6
Net Unrealized Gains on Other Securities 2,118,533 2,118,533
Net Deferred Losses on Hedging Instruments (231,632) (231,632)
of which: net deferred losses on hedge (57,063) E7
Revaluation Reserve for Land 16,020 16,020
Foreign Currency Translation Adjustment (48) (48)
Remeasurements of Defined Benefit Plans (246) (246)
Total Accumulated Other Comprehensive Income 1,902,626 1,902,626 E4
Minority Interests 7,972 7,972
of which: common equity issued by subsidiaries and held by third parties (amount allowed in group CET1)
— E8.1
of which: Additional Tier 1 instruments issued by subsidiaries and held by third parties (amount allowed in group AT1)
2,982 E8.2
of which: Tier 2 instruments issued by subsidiaries and held by third parties (amount allowed in group Tier 2)
197 E8.3
Total Net Assets 7,186,790
Total Liabilities and Net Assets 101,182,920
Notes: 1. “Balance sheet amount based on regulatory scope of consolidation” refers only to the items used in calculating capital adequacy. 2. “Balance sheet amount based on regulatory scope of consolidation” does not reflect transitional arrangements so that the amount of the column consists
of the amount included in capital adequacy and the amount excluded under transitional arrangements in “Composition of Capital.”
138 ANNUAL REPORT 2017 The Norinchukin Bank
CAPITAL ADEQUACY
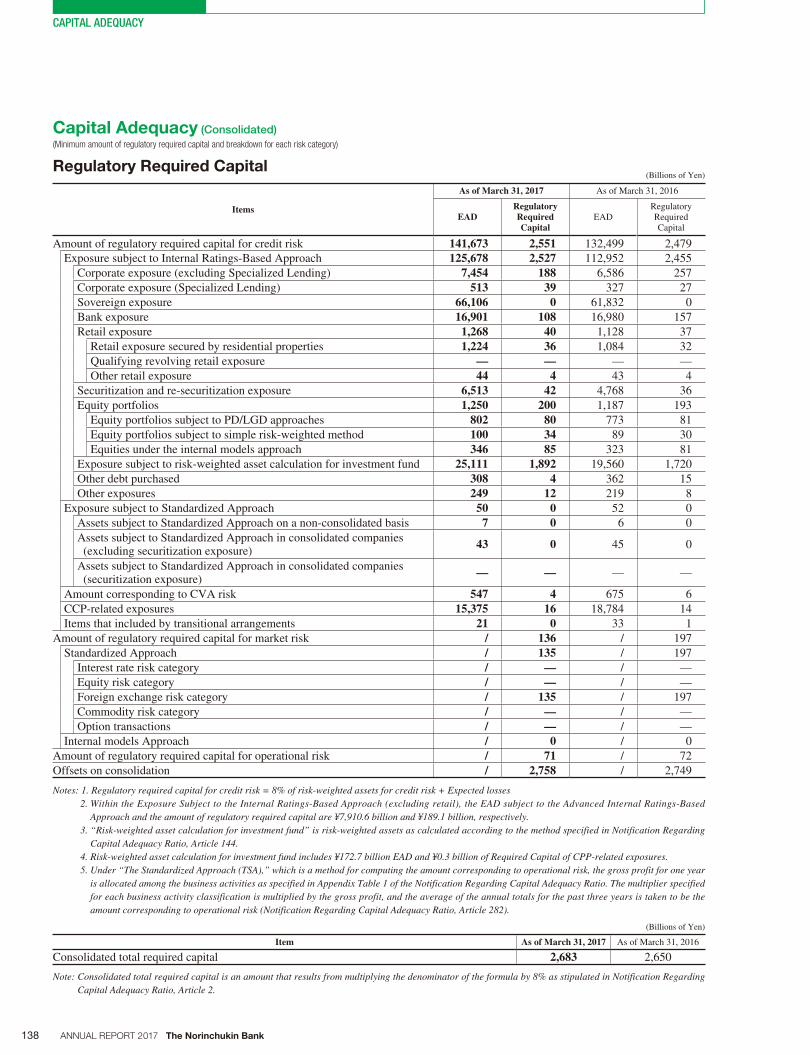
Capital Adequacy (Consolidated)
(Minimum amount of regulatory required capital and breakdown for each risk category)
Regulatory Required Capital (Billions of Yen)
Items
As of March 31, 2017 As of March 31, 2016
EADRegulatoryRequiredCapital
EADRegulatoryRequiredCapital
Amount of regulatory required capital for credit risk 141,673 2,551 132,499 2,479
Exposure subject to Internal Ratings-Based Approach 125,678 2,527 112,952 2,455
Corporate exposure (excluding Specialized Lending) 7,454 188 6,586 257
Corporate exposure (Specialized Lending) 513 39 327 27
Sovereign exposure 66,106 0 61,832 0
Bank exposure 16,901 108 16,980 157
Retail exposure 1,268 40 1,128 37
Retail exposure secured by residential properties 1,224 36 1,084 32
Qualifying revolving retail exposure — — — —
Other retail exposure 44 4 43 4
Securitization and re-securitization exposure 6,513 42 4,768 36
Equity portfolios 1,250 200 1,187 193
Equity portfolios subject to PD/LGD approaches 802 80 773 81
Equity portfolios subject to simple risk-weighted method 100 34 89 30
Equities under the internal models approach 346 85 323 81
Exposure subject to risk-weighted asset calculation for investment fund 25,111 1,892 19,560 1,720
Other debt purchased 308 4 362 15
Other exposures 249 12 219 8
Exposure subject to Standardized Approach 50 0 52 0
Assets subject to Standardized Approach on a non-consolidated basis 7 0 6 0
Assets subject to Standardized Approach in consolidated companies (excluding securitization exposure)
43 0 45 0
Assets subject to Standardized Approach in consolidated companies (securitization exposure)
— — — —
Amount corresponding to CVA risk 547 4 675 6
CCP-related exposures 15,375 16 18,784 14
Items that included by transitional arrangements 21 0 33 1
Amount of regulatory required capital for market risk / 136 / 197
Standardized Approach / 135 / 197
Interest rate risk category / — / —
Equity risk category / — / —
Foreign exchange risk category / 135 / 197
Commodity risk category / — / —
Option transactions / — / —
Internal models Approach / 0 / 0
Amount of regulatory required capital for operational risk / 71 / 72
Offsets on consolidation / 2,758 / 2,749
Notes: 1. Regulatory required capital for credit risk = 8% of risk-weighted assets for credit risk + Expected losses2. Within the Exposure Subject to the Internal Ratings-Based Approach (excluding retail), the EAD subject to the Advanced Internal Ratings-Based
Approach and the amount of regulatory required capital are ¥7,910.6 billion and ¥189.1 billion, respectively.3. “Risk-weighted asset calculation for investment fund” is risk-weighted assets as calculated according to the method specified in Notification Regarding
Capital Adequacy Ratio, Article 144.4. Risk-weighted asset calculation for investment fund includes ¥172.7 billion EAD and ¥0.3 billion of Required Capital of CPP-related exposures.5. Under “The Standardized Approach (TSA),” which is a method for computing the amount corresponding to operational risk, the gross profit for one year
is allocated among the business activities as specified in Appendix Table 1 of the Notification Regarding Capital Adequacy Ratio. The multiplier specified for each business activity classification is multiplied by the gross profit, and the average of the annual totals for the past three years is taken to be the amount corresponding to operational risk (Notification Regarding Capital Adequacy Ratio, Article 282).
(Billions of Yen)
Item As of March 31, 2017 As of March 31, 2016
Consolidated total required capital 2,683 2,650
Note: Consolidated total required capital is an amount that results from multiplying the denominator of the formula by 8% as stipulated in Notification Regarding Capital Adequacy Ratio, Article 2.
139ANNUAL REPORT 2017 The Norinchukin Bank
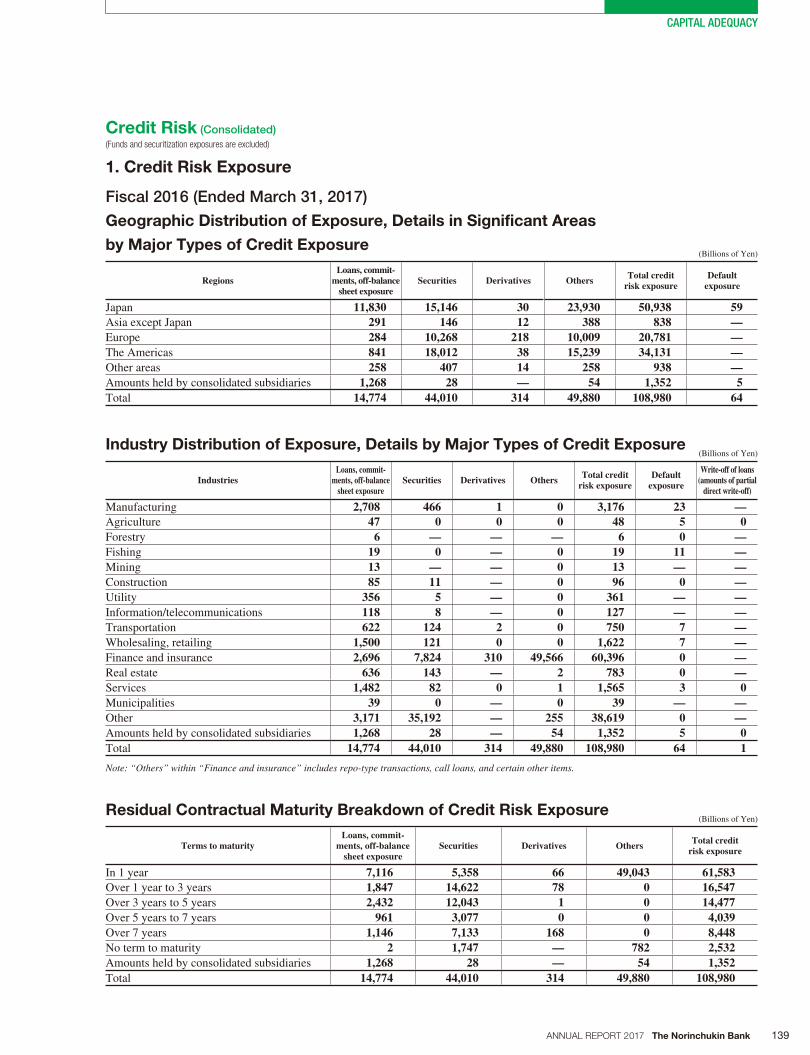
CAPITAL ADEQUACY
Fiscal 2016 (Ended March 31, 2017)
Geographic Distribution of Exposure, Details in Significant Areas
by Major Types of Credit Exposure (Billions of Yen)
RegionsLoans, commit-
ments, off-balance sheet exposure
Securities Derivatives Others Total credit risk exposure
Default exposure
Japan 11,830 15,146 30 23,930 50,938 59Asia except Japan 291 146 12 388 838 —Europe 284 10,268 218 10,009 20,781 —The Americas 841 18,012 38 15,239 34,131 —Other areas 258 407 14 258 938 —Amounts held by consolidated subsidiaries 1,268 28 — 54 1,352 5Total 14,774 44,010 314 49,880 108,980 64
Industry Distribution of Exposure, Details by Major Types of Credit Exposure (Billions of Yen)
IndustriesLoans, commit-
ments, off-balancesheet exposure
Securities Derivatives Others Total credit risk exposure
Default exposure
Write-off of loans(amounts of partial
direct write-off)
Manufacturing 2,708 466 1 0 3,176 23 —Agriculture 47 0 0 0 48 5 0Forestry 6 — — — 6 0 —Fishing 19 0 — 0 19 11 —Mining 13 — — 0 13 — —Construction 85 11 — 0 96 0 —Utility 356 5 — 0 361 — —Information/telecommunications 118 8 — 0 127 — —Transportation 622 124 2 0 750 7 —Wholesaling, retailing 1,500 121 0 0 1,622 7 —Finance and insurance 2,696 7,824 310 49,566 60,396 0 —Real estate 636 143 — 2 783 0 —Services 1,482 82 0 1 1,565 3 0Municipalities 39 0 — 0 39 — —Other 3,171 35,192 — 255 38,619 0 —Amounts held by consolidated subsidiaries 1,268 28 — 54 1,352 5 0Total 14,774 44,010 314 49,880 108,980 64 1
Note: “Others” within “Finance and insurance” includes repo-type transactions, call loans, and certain other items.
Residual Contractual Maturity Breakdown of Credit Risk Exposure (Billions of Yen)
Terms to maturityLoans, commit-
ments, off-balance sheet exposure
Securities Derivatives Others Total credit risk exposure
In 1 year 7,116 5,358 66 49,043 61,583Over 1 year to 3 years 1,847 14,622 78 0 16,547Over 3 years to 5 years 2,432 12,043 1 0 14,477Over 5 years to 7 years 961 3,077 0 0 4,039Over 7 years 1,146 7,133 168 0 8,448No term to maturity 2 1,747 — 782 2,532Amounts held by consolidated subsidiaries 1,268 28 — 54 1,352Total 14,774 44,010 314 49,880 108,980
Credit Risk (Consolidated)
(Funds and securitization exposures are excluded)
1. Credit Risk Exposure
140 ANNUAL REPORT 2017 The Norinchukin Bank
CAPITAL ADEQUACY
Notes: 1. The amount of credit exposure at the end of the period does not substantially differ from the average-risk position during fiscal 2016.2. The amounts of credit-risk exposure held by consolidated subsidiaries are extremely limited, amounting only to about 1% of consolidated risk exposure, so
only the total amounts held by these subsidiaries are shown.3. Within credit risk exposure, credit risk exposure subject to the Standardized Approach was ¥51.3 billion.4. Default exposure is classified in the Bank’s self-assessment as being under “Debtor Under Requirement of Control.”
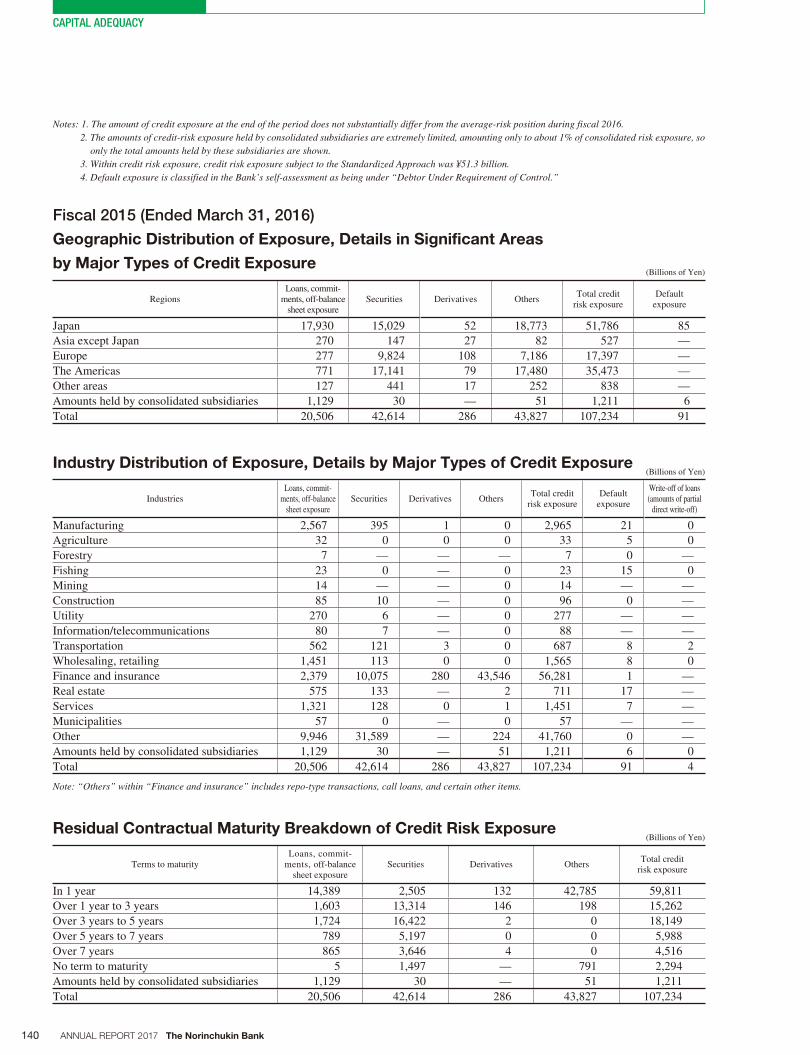
Fiscal 2015 (Ended March 31, 2016)
Geographic Distribution of Exposure, Details in Significant Areas
by Major Types of Credit Exposure (Billions of Yen)
RegionsLoans, commit-
ments, off-balancesheet exposure
Securities Derivatives OthersTotal credit
risk exposureDefault
exposure
Japan 17,930 15,029 52 18,773 51,786 85
Asia except Japan 270 147 27 82 527 —
Europe 277 9,824 108 7,186 17,397 —
The Americas 771 17,141 79 17,480 35,473 —
Other areas 127 441 17 252 838 —
Amounts held by consolidated subsidiaries 1,129 30 — 51 1,211 6
Total 20,506 42,614 286 43,827 107,234 91
Industry Distribution of Exposure, Details by Major Types of Credit Exposure (Billions of Yen)
IndustriesLoans, commit-
ments, off-balancesheet exposure
Securities Derivatives OthersTotal credit
risk exposureDefault
exposure
Write-off of loans(amounts of partial
direct write-off)
Manufacturing 2,567 395 1 0 2,965 21 0
Agriculture 32 0 0 0 33 5 0
Forestry 7 — — — 7 0 —
Fishing 23 0 — 0 23 15 0
Mining 14 — — 0 14 — —
Construction 85 10 — 0 96 0 —
Utility 270 6 — 0 277 — —
Information/telecommunications 80 7 — 0 88 — —
Transportation 562 121 3 0 687 8 2
Wholesaling, retailing 1,451 113 0 0 1,565 8 0
Finance and insurance 2,379 10,075 280 43,546 56,281 1 —
Real estate 575 133 — 2 711 17 —
Services 1,321 128 0 1 1,451 7 —
Municipalities 57 0 — 0 57 — —
Other 9,946 31,589 — 224 41,760 0 —
Amounts held by consolidated subsidiaries 1,129 30 — 51 1,211 6 0
Total 20,506 42,614 286 43,827 107,234 91 4
Note: “Others” within “Finance and insurance” includes repo-type transactions, call loans, and certain other items.
Residual Contractual Maturity Breakdown of Credit Risk Exposure (Billions of Yen)
Terms to maturityLoans, commit-
ments, off-balancesheet exposure
Securities Derivatives OthersTotal credit
risk exposure
In 1 year 14,389 2,505 132 42,785 59,811
Over 1 year to 3 years 1,603 13,314 146 198 15,262
Over 3 years to 5 years 1,724 16,422 2 0 18,149
Over 5 years to 7 years 789 5,197 0 0 5,988
Over 7 years 865 3,646 4 0 4,516
No term to maturity 5 1,497 — 791 2,294
Amounts held by consolidated subsidiaries 1,129 30 — 51 1,211
Total 20,506 42,614 286 43,827 107,234
141ANNUAL REPORT 2017 The Norinchukin Bank
CAPITAL ADEQUACY
Notes: 1. The amount of credit exposure at the end of the period does not substantially differ from the average-risk position during fiscal 2015.2. The amounts of credit-risk exposure held by consolidated subsidiaries are extremely limited, amounting only to about 1% of consolidated risk exposure, so
only the total amounts held by these subsidiaries are shown.3. Within credit risk exposure, credit risk exposure subject to the Standardized Approach was ¥53.0 billion.4. Default exposure is classified in the Bank’s self-assessment as being under “Debtor Under Requirement of Control.”
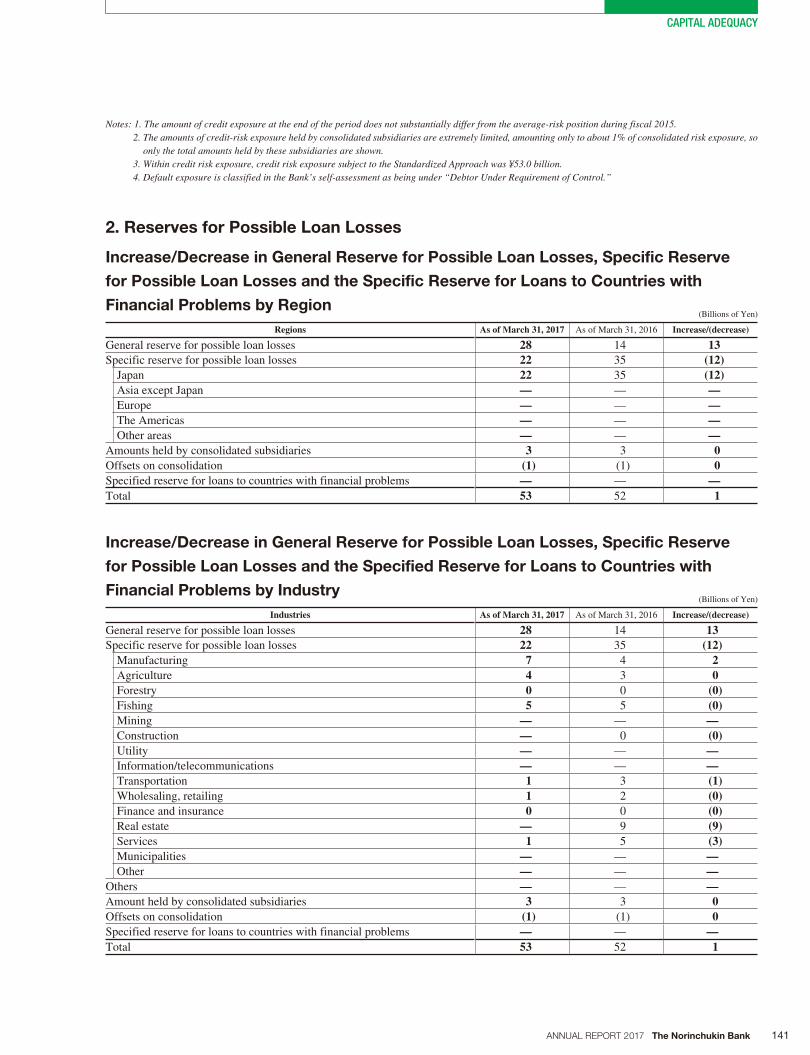
Increase/Decrease in General Reserve for Possible Loan Losses, Specific Reserve
for Possible Loan Losses and the Specific Reserve for Loans to Countries with
Financial Problems by Region (Billions of Yen)
Regions As of March 31, 2017 As of March 31, 2016 Increase/(decrease)
General reserve for possible loan losses 28 14 13Specific reserve for possible loan losses 22 35 (12)
Japan 22 35 (12)Asia except Japan — — —Europe — — —The Americas — — —Other areas — — —
Amounts held by consolidated subsidiaries 3 3 0Offsets on consolidation (1) (1) 0Specified reserve for loans to countries with financial problems — — —Total 53 52 1
Increase/Decrease in General Reserve for Possible Loan Losses, Specific Reserve
for Possible Loan Losses and the Specified Reserve for Loans to Countries with
Financial Problems by Industry (Billions of Yen)
Industries As of March 31, 2017 As of March 31, 2016 Increase/(decrease)
General reserve for possible loan losses 28 14 13Specific reserve for possible loan losses 22 35 (12)
Manufacturing 7 4 2Agriculture 4 3 0Forestry 0 0 (0)Fishing 5 5 (0)Mining — — —Construction — 0 (0)Utility — — —Information/telecommunications — — —Transportation 1 3 (1)Wholesaling, retailing 1 2 (0)Finance and insurance 0 0 (0)Real estate — 9 (9)Services 1 5 (3)Municipalities — — —Other — — —
Others — — —Amount held by consolidated subsidiaries 3 3 0Offsets on consolidation (1) (1) 0Specified reserve for loans to countries with financial problems — — —Total 53 52 1
2. Reserves for Possible Loan Losses
142 ANNUAL REPORT 2017 The Norinchukin Bank
CAPITAL ADEQUACY
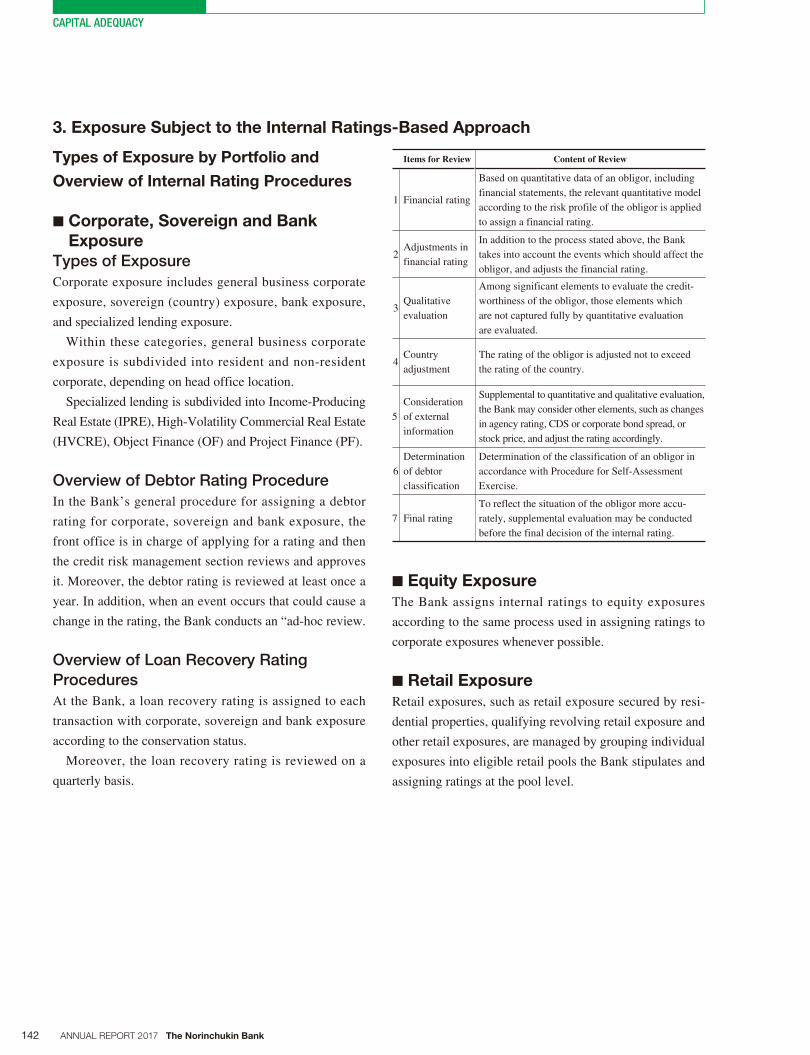
Items for Review Content of Review
1 Financial rating
Based on quantitative data of an obligor, including
financial statements, the relevant quantitative model
according to the risk profile of the obligor is applied
to assign a financial rating.
2Adjustments in
financial rating
In addition to the process stated above, the Bank
takes into account the events which should affect the
obligor, and adjusts the financial rating.
3Qualitative
evaluation
Among significant elements to evaluate the credit-
worthiness of the obligor, those elements which
are not captured fully by quantitative evaluation
are evaluated.
4Country
adjustment
The rating of the obligor is adjusted not to exceed
the rating of the country.
5
Consideration
of external
information
Supplemental to quantitative and qualitative evaluation,
the Bank may consider other elements, such as changes
in agency rating, CDS or corporate bond spread, or
stock price, and adjust the rating accordingly.
6
Determination
of debtor
classification
Determination of the classification of an obligor in
accordance with Procedure for Self-Assessment
Exercise.
7 Final rating
To reflect the situation of the obligor more accu-
rately, supplemental evaluation may be conducted
before the final decision of the internal rating.
■ Equity Exposure
The Bank assigns internal ratings to equity exposures
according to the same process used in assigning ratings to
corporate exposures whenever possible.
■ Retail Exposure
Retail exposures, such as retail exposure secured by resi-
dential properties, qualifying revolving retail exposure and
other retail exposures, are managed by grouping individual
exposures into eligible retail pools the Bank stipulates and
assigning ratings at the pool level.
Types of Exposure by Portfolio and
Overview of Internal Rating Procedures
■ Corporate, Sovereign and Bank
Exposure
Types of Exposure
Corporate exposure includes general business corporate
exposure, sovereign (country) exposure, bank exposure,
and specialized lending exposure.
Within these categories, general business corporate
exposure is subdivided into resident and non-resident
corporate, depending on head office location.
Specialized lending is subdivided into Income-Producing
Real Estate (IPRE), High-Volatility Commercial Real Estate
(HVCRE), Object Finance (OF) and Project Finance (PF).
Overview of Debtor Rating Procedure
In the Bank’s general procedure for assigning a debtor
rating for corporate, sovereign and bank exposure, the
front office is in charge of applying for a rating and then
the credit risk management section reviews and approves
it. Moreover, the debtor rating is reviewed at least once a
year. In addition, when an event occurs that could cause a
change in the rating, the Bank conducts an “ad-hoc review.
Overview of Loan Recovery Rating
Procedures
At the Bank, a loan recovery rating is assigned to each
transaction with corporate, sovereign and bank exposure
according to the conservation status.
Moreover, the loan recovery rating is reviewed on a
quarterly basis.
3. Exposure Subject to the Internal Ratings-Based Approach
143ANNUAL REPORT 2017 The Norinchukin Bank
CAPITAL ADEQUACY
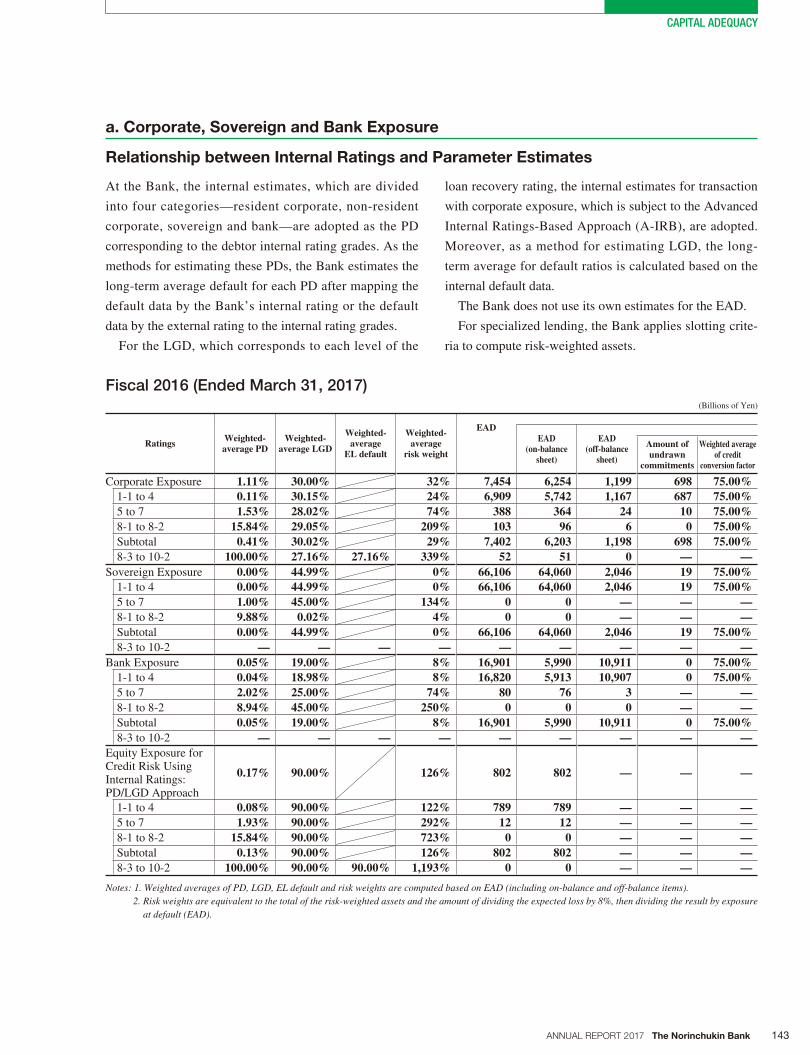
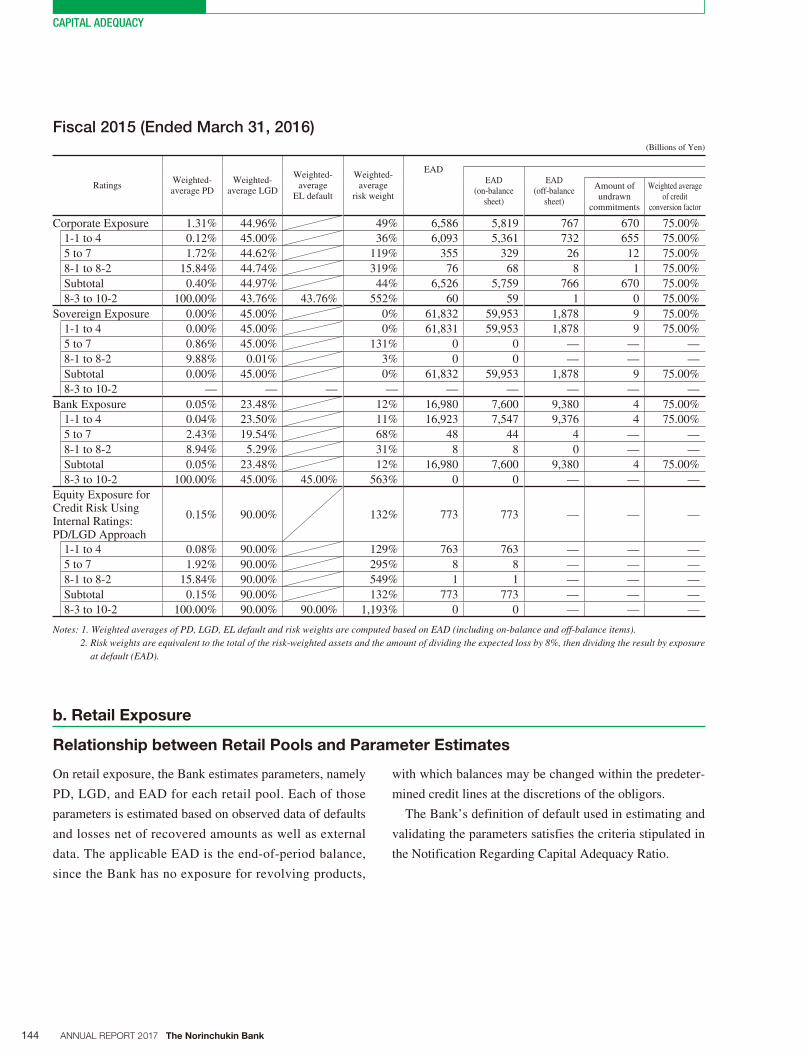
At the Bank, the internal estimates, which are divided
into four categories—resident corporate, non-resident
corporate, sovereign and bank—are adopted as the PD
corresponding to the debtor internal rating grades. As the
methods for estimating these PDs, the Bank estimates the
long-term average default for each PD after mapping the
default data by the Bank’s internal rating or the default
data by the external rating to the internal rating grades.
For the LGD, which corresponds to each level of the
loan recovery rating, the internal estimates for transaction
with corporate exposure, which is subject to the Advanced
Internal Ratings-Based Approach (A-IRB), are adopted.
Moreover, as a method for estimating LGD, the long-
term average for default ratios is calculated based on the
internal default data.
The Bank does not use its own estimates for the EAD.
For specialized lending, the Bank applies slotting crite-
ria to compute risk-weighted assets.
Fiscal 2016 (Ended March 31, 2017)(Billions of Yen)
Ratings Weighted-average PD
Weighted-average LGD
Weighted-average
EL default
Weighted-average
risk weight
EAD EAD
(on-balance sheet)
EAD (off-balance
sheet)
Amount of undrawn
commitments
Weighted average of credit
conversion factor
Corporate Exposure 1.11% 30.00% 32% 7,454 6,254 1,199 698 75.00%1-1 to 4 0.11% 30.15% 24% 6,909 5,742 1,167 687 75.00%5 to 7 1.53% 28.02% 74% 388 364 24 10 75.00%8-1 to 8-2 15.84% 29.05% 209% 103 96 6 0 75.00%Subtotal 0.41% 30.02% 29% 7,402 6,203 1,198 698 75.00%8-3 to 10-2 100.00% 27.16% 27.16% 339% 52 51 0 — —
Sovereign Exposure 0.00% 44.99% 0% 66,106 64,060 2,046 19 75.00%1-1 to 4 0.00% 44.99% 0% 66,106 64,060 2,046 19 75.00%5 to 7 1.00% 45.00% 134% 0 0 — — —8-1 to 8-2 9.88% 0.02% 4% 0 0 — — —Subtotal 0.00% 44.99% 0% 66,106 64,060 2,046 19 75.00%8-3 to 10-2 — — — — — — — — —
Bank Exposure 0.05% 19.00% 8% 16,901 5,990 10,911 0 75.00%1-1 to 4 0.04% 18.98% 8% 16,820 5,913 10,907 0 75.00%5 to 7 2.02% 25.00% 74% 80 76 3 — —8-1 to 8-2 8.94% 45.00% 250% 0 0 0 — —Subtotal 0.05% 19.00% 8% 16,901 5,990 10,911 0 75.00%8-3 to 10-2 — — — — — — — — —
Equity Exposure for Credit Risk Using Internal Ratings: PD/LGD Approach
0.17% 90.00% 126% 802 802 — — —
1-1 to 4 0.08% 90.00% 122% 789 789 — — —5 to 7 1.93% 90.00% 292% 12 12 — — —8-1 to 8-2 15.84% 90.00% 723% 0 0 — — —Subtotal 0.13% 90.00% 126% 802 802 — — —8-3 to 10-2 100.00% 90.00% 90.00% 1,193% 0 0 — — —
Notes: 1. Weighted averages of PD, LGD, EL default and risk weights are computed based on EAD (including on-balance and off-balance items).2. Risk weights are equivalent to the total of the risk-weighted assets and the amount of dividing the expected loss by 8%, then dividing the result by exposure
at default (EAD).
a. Corporate, Sovereign and Bank Exposure
Relationship between Internal Ratings and Parameter Estimates
144 ANNUAL REPORT 2017 The Norinchukin Bank
CAPITAL ADEQUACY
Fiscal 2015 (Ended March 31, 2016)(Billions of Yen)
RatingsWeighted-average PD
Weighted-average LGD
Weighted-average
EL default
Weighted-average
risk weight
EADEAD
(on-balance sheet)
EAD (off-balance
sheet)
Amount of undrawn
commitments
Weighted average of credit
conversion factor
Corporate Exposure 1.31% 44.96% 49% 6,586 5,819 767 670 75.00%
1-1 to 4 0.12% 45.00% 36% 6,093 5,361 732 655 75.00%
5 to 7 1.72% 44.62% 119% 355 329 26 12 75.00%
8-1 to 8-2 15.84% 44.74% 319% 76 68 8 1 75.00%
Subtotal 0.40% 44.97% 44% 6,526 5,759 766 670 75.00%
8-3 to 10-2 100.00% 43.76% 43.76% 552% 60 59 1 0 75.00%
Sovereign Exposure 0.00% 45.00% 0% 61,832 59,953 1,878 9 75.00%
1-1 to 4 0.00% 45.00% 0% 61,831 59,953 1,878 9 75.00%
5 to 7 0.86% 45.00% 131% 0 0 — — —
8-1 to 8-2 9.88% 0.01% 3% 0 0 — — —
Subtotal 0.00% 45.00% 0% 61,832 59,953 1,878 9 75.00%
8-3 to 10-2 — — — — — — — — —
Bank Exposure 0.05% 23.48% 12% 16,980 7,600 9,380 4 75.00%
1-1 to 4 0.04% 23.50% 11% 16,923 7,547 9,376 4 75.00%
5 to 7 2.43% 19.54% 68% 48 44 4 — —
8-1 to 8-2 8.94% 5.29% 31% 8 8 0 — —
Subtotal 0.05% 23.48% 12% 16,980 7,600 9,380 4 75.00%
8-3 to 10-2 100.00% 45.00% 45.00% 563% 0 0 — — —
Equity Exposure for Credit Risk Using Internal Ratings: PD/LGD Approach
0.15% 90.00% 132% 773 773 — — —
1-1 to 4 0.08% 90.00% 129% 763 763 — — —
5 to 7 1.92% 90.00% 295% 8 8 — — —
8-1 to 8-2 15.84% 90.00% 549% 1 1 — — —
Subtotal 0.15% 90.00% 132% 773 773 — — —
8-3 to 10-2 100.00% 90.00% 90.00% 1,193% 0 0 — — —
Notes: 1. Weighted averages of PD, LGD, EL default and risk weights are computed based on EAD (including on-balance and off-balance items).2. Risk weights are equivalent to the total of the risk-weighted assets and the amount of dividing the expected loss by 8%, then dividing the result by exposure
at default (EAD).
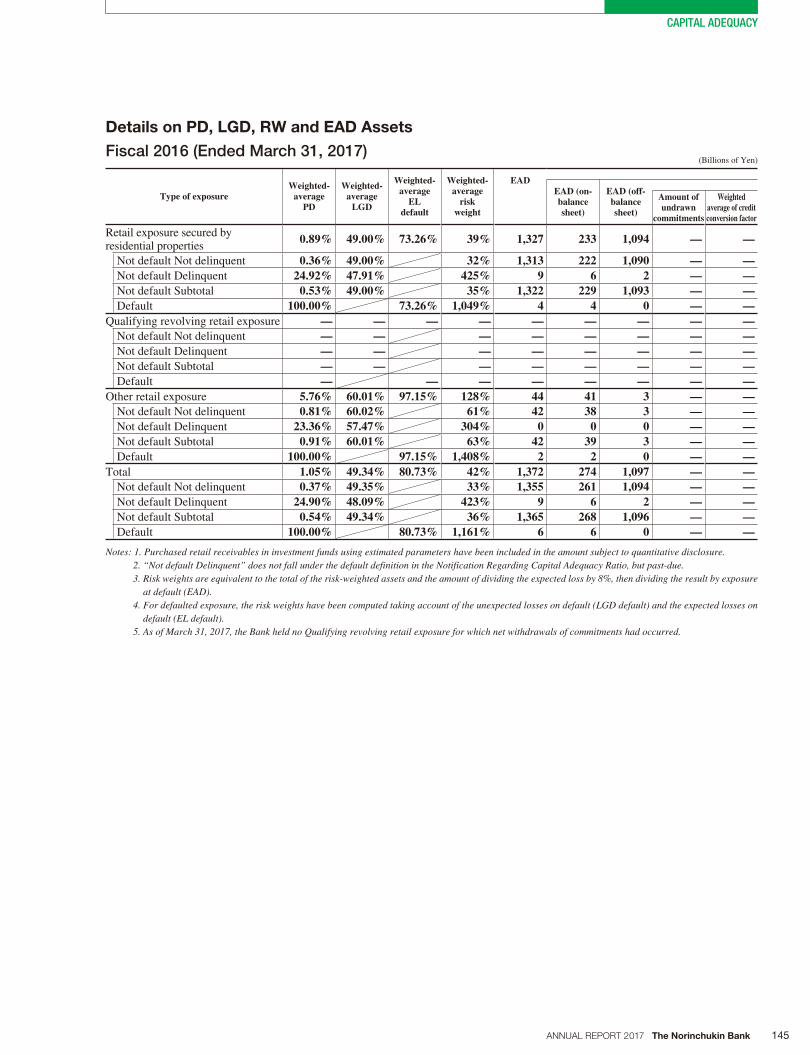
On retail exposure, the Bank estimates parameters, namely
PD, LGD, and EAD for each retail pool. Each of those
parameters is estimated based on observed data of defaults
and losses net of recovered amounts as well as external
data. The applicable EAD is the end-of-period balance,
since the Bank has no exposure for revolving products,
with which balances may be changed within the predeter-
mined credit lines at the discretions of the obligors.
The Bank’s definition of default used in estimating and
validating the parameters satisfies the criteria stipulated in
the Notification Regarding Capital Adequacy Ratio.
b. Retail Exposure
Relationship between Retail Pools and Parameter Estimates
145ANNUAL REPORT 2017 The Norinchukin Bank
CAPITAL ADEQUACY
Details on PD, LGD, RW and EAD Assets
Fiscal 2016 (Ended March 31, 2017) (Billions of Yen)
Type of exposureWeighted-
average PD
Weighted-average
LGD
Weighted-average
ELdefault
Weighted-average
risk weight
EADEAD (on-balance sheet)
EAD (off-balancesheet)
Amount of undrawn
commitments
Weighted average of credit conversion factor
Retail exposure secured by residential properties
0.89% 49.00% 73.26% 39% 1,327 233 1,094 — —
Not default Not delinquent 0.36% 49.00% 32% 1,313 222 1,090 — —Not default Delinquent 24.92% 47.91% 425% 9 6 2 — —Not default Subtotal 0.53% 49.00% 35% 1,322 229 1,093 — —Default 100.00% 73.26% 1,049% 4 4 0 — —
Qualifying revolving retail exposure — — — — — — — — —Not default Not delinquent — — — — — — — —Not default Delinquent — — — — — — — —Not default Subtotal — — — — — — — —Default — — — — — — — —
Other retail exposure 5.76% 60.01% 97.15% 128% 44 41 3 — —Not default Not delinquent 0.81% 60.02% 61% 42 38 3 — —Not default Delinquent 23.36% 57.47% 304% 0 0 0 — —Not default Subtotal 0.91% 60.01% 63% 42 39 3 — —Default 100.00% 97.15% 1,408% 2 2 0 — —
Total 1.05% 49.34% 80.73% 42% 1,372 274 1,097 — —Not default Not delinquent 0.37% 49.35% 33% 1,355 261 1,094 — —Not default Delinquent 24.90% 48.09% 423% 9 6 2 — —Not default Subtotal 0.54% 49.34% 36% 1,365 268 1,096 — —Default 100.00% 80.73% 1,161% 6 6 0 — —
Notes: 1. Purchased retail receivables in investment funds using estimated parameters have been included in the amount subject to quantitative disclosure.2. “Not default Delinquent” does not fall under the default definition in the Notification Regarding Capital Adequacy Ratio, but past-due.3. Risk weights are equivalent to the total of the risk-weighted assets and the amount of dividing the expected loss by 8%, then dividing the result by exposure
at default (EAD).4. For defaulted exposure, the risk weights have been computed taking account of the unexpected losses on default (LGD default) and the expected losses on
default (EL default).5. As of March 31, 2017, the Bank held no Qualifying revolving retail exposure for which net withdrawals of commitments had occurred.
146 ANNUAL REPORT 2017 The Norinchukin Bank
CAPITAL ADEQUACY
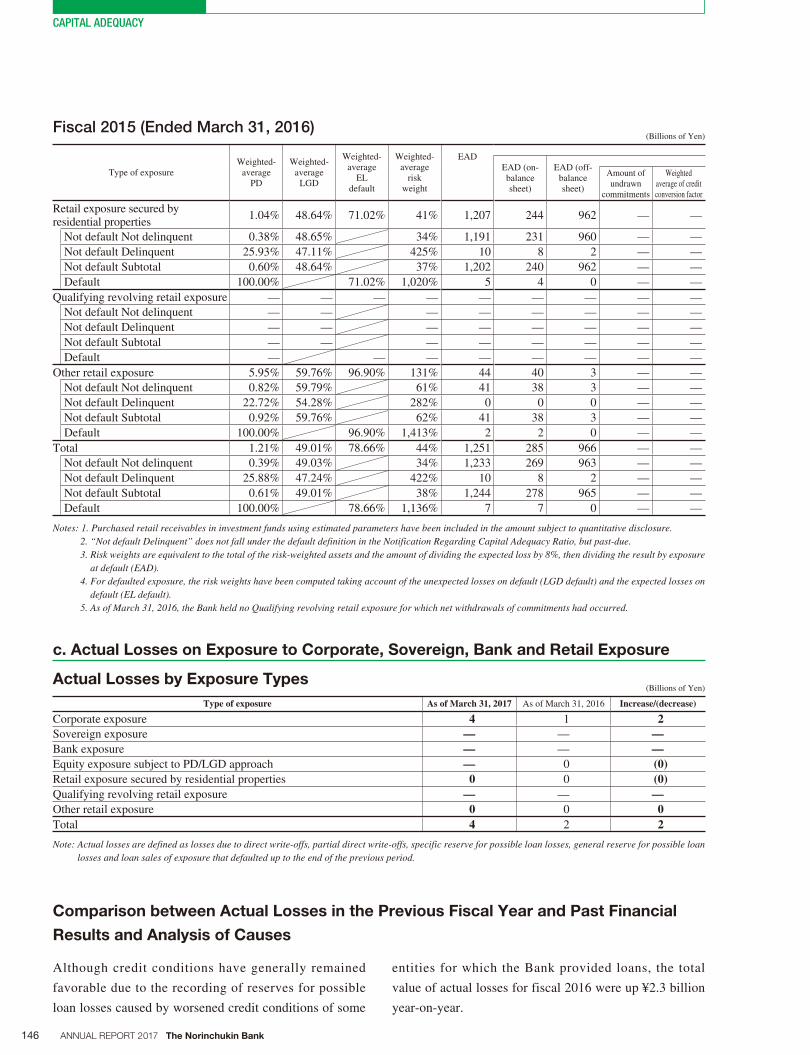
Fiscal 2015 (Ended March 31, 2016) (Billions of Yen)
Type of exposureWeighted-
average PD
Weighted-average
LGD
Weighted-average
ELdefault
Weighted-average
risk weight
EADEAD (on-balance sheet)
EAD (off-balancesheet)
Amount of undrawn
commitments
Weighted average of credit conversion factor
Retail exposure secured by residential properties
1.04% 48.64% 71.02% 41% 1,207 244 962 — —
Not default Not delinquent 0.38% 48.65% 34% 1,191 231 960 — —
Not default Delinquent 25.93% 47.11% 425% 10 8 2 — —
Not default Subtotal 0.60% 48.64% 37% 1,202 240 962 — —
Default 100.00% 71.02% 1,020% 5 4 0 — —
Qualifying revolving retail exposure — — — — — — — — —
Not default Not delinquent — — — — — — — —
Not default Delinquent — — — — — — — —
Not default Subtotal — — — — — — — —
Default — — — — — — — —
Other retail exposure 5.95% 59.76% 96.90% 131% 44 40 3 — —
Not default Not delinquent 0.82% 59.79% 61% 41 38 3 — —
Not default Delinquent 22.72% 54.28% 282% 0 0 0 — —
Not default Subtotal 0.92% 59.76% 62% 41 38 3 — —
Default 100.00% 96.90% 1,413% 2 2 0 — —
Total 1.21% 49.01% 78.66% 44% 1,251 285 966 — —
Not default Not delinquent 0.39% 49.03% 34% 1,233 269 963 — —
Not default Delinquent 25.88% 47.24% 422% 10 8 2 — —
Not default Subtotal 0.61% 49.01% 38% 1,244 278 965 — —
Default 100.00% 78.66% 1,136% 7 7 0 — —
Notes: 1. Purchased retail receivables in investment funds using estimated parameters have been included in the amount subject to quantitative disclosure.2. “Not default Delinquent” does not fall under the default definition in the Notification Regarding Capital Adequacy Ratio, but past-due.3. Risk weights are equivalent to the total of the risk-weighted assets and the amount of dividing the expected loss by 8%, then dividing the result by exposure
at default (EAD).4. For defaulted exposure, the risk weights have been computed taking account of the unexpected losses on default (LGD default) and the expected losses on
default (EL default).5. As of March 31, 2016, the Bank held no Qualifying revolving retail exposure for which net withdrawals of commitments had occurred.
c. Actual Losses on Exposure to Corporate, Sovereign, Bank and Retail Exposure
Actual Losses by Exposure Types (Billions of Yen)
Type of exposure As of March 31, 2017 As of March 31, 2016 Increase/(decrease)
Corporate exposure 4 1 2Sovereign exposure — — —Bank exposure — — —Equity exposure subject to PD/LGD approach — 0 (0)Retail exposure secured by residential properties 0 0 (0)Qualifying revolving retail exposure — — —Other retail exposure 0 0 0Total 4 2 2
Note: Actual losses are defined as losses due to direct write-offs, partial direct write-offs, specific reserve for possible loan losses, general reserve for possible loan losses and loan sales of exposure that defaulted up to the end of the previous period.
Comparison between Actual Losses in the Previous Fiscal Year and Past Financial
Results and Analysis of Causes
Although credit conditions have generally remained
favorable due to the recording of reserves for possible
loan losses caused by worsened credit conditions of some
entities for which the Bank provided loans, the total
value of actual losses for fiscal 2016 were up ¥2.3 billion
year-on-year.
147ANNUAL REPORT 2017 The Norinchukin Bank
CAPITAL ADEQUACY
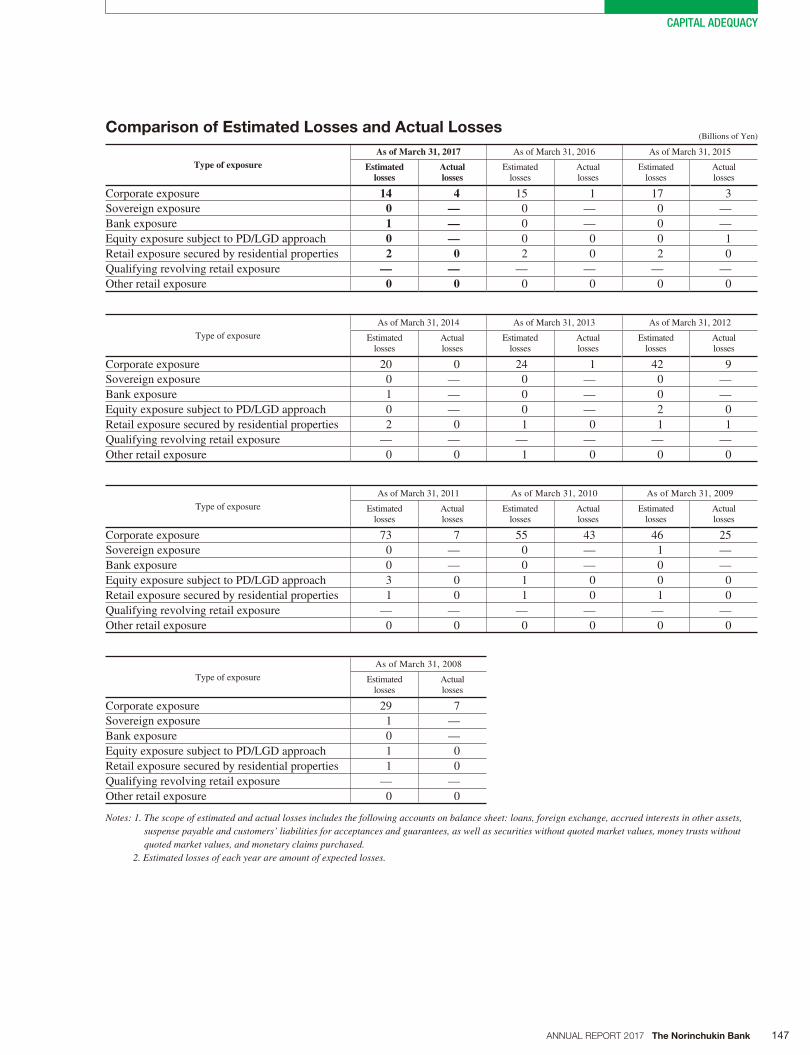
Comparison of Estimated Losses and Actual Losses (Billions of Yen)
Type of exposureAs of March 31, 2017 As of March 31, 2016 As of March 31, 2015
Estimated losses
Actual losses
Estimated losses
Actual losses
Estimated losses
Actual losses
Corporate exposure 14 4 15 1 17 3
Sovereign exposure 0 — 0 — 0 —
Bank exposure 1 — 0 — 0 —
Equity exposure subject to PD/LGD approach 0 — 0 0 0 1
Retail exposure secured by residential properties 2 0 2 0 2 0
Qualifying revolving retail exposure — — — — — —
Other retail exposure 0 0 0 0 0 0
Type of exposure
As of March 31, 2014 As of March 31, 2013 As of March 31, 2012
Estimated losses
Actual losses
Estimated losses
Actual losses
Estimated losses
Actual losses
Corporate exposure 20 0 24 1 42 9
Sovereign exposure 0 — 0 — 0 —
Bank exposure 1 — 0 — 0 —
Equity exposure subject to PD/LGD approach 0 — 0 — 2 0
Retail exposure secured by residential properties 2 0 1 0 1 1
Qualifying revolving retail exposure — — — — — —
Other retail exposure 0 0 1 0 0 0
Type of exposure
As of March 31, 2011 As of March 31, 2010 As of March 31, 2009
Estimated losses
Actual losses
Estimated losses
Actual losses
Estimated losses
Actual losses
Corporate exposure 73 7 55 43 46 25
Sovereign exposure 0 — 0 — 1 —
Bank exposure 0 — 0 — 0 —
Equity exposure subject to PD/LGD approach 3 0 1 0 0 0
Retail exposure secured by residential properties 1 0 1 0 1 0
Qualifying revolving retail exposure — — — — — —
Other retail exposure 0 0 0 0 0 0
Type of exposure
As of March 31, 2008
Estimated losses
Actual losses
Corporate exposure 29 7
Sovereign exposure 1 —
Bank exposure 0 —
Equity exposure subject to PD/LGD approach 1 0
Retail exposure secured by residential properties 1 0
Qualifying revolving retail exposure — —
Other retail exposure 0 0
Notes: 1. The scope of estimated and actual losses includes the following accounts on balance sheet: loans, foreign exchange, accrued interests in other assets, suspense payable and customers’ liabilities for acceptances and guarantees, as well as securities without quoted market values, money trusts without quoted market values, and monetary claims purchased.
2. Estimated losses of each year are amount of expected losses.

148 ANNUAL REPORT 2017 The Norinchukin Bank
CAPITAL ADEQUACY
d. Exposure to Specialized Lending Products Subject to Supervisory Slotting Criteria
by Risk Weight
Amount of Specialized Lending Exposure Subject to Supervisory Slotting Criteria
by Risk Weight (Billions of Yen)
Classification As of March 31, 2017 As of March 31, 2016
Specialized Lending exposure subject to supervisory slotting criteria 587 373
Specialized Lending, excluding High-Volatility Commercial Real Estate (HVCRE) 587 373
Risk weight of 50% 57 43
Risk weight of 70% 366 201
Risk weight of 90% 91 84
Risk weight of 115% 16 7
Risk weight of 250% 17 18
Risk weight of 0% (default) 38 19
High-Volatility Commercial Real Estate (HVCRE) — —
Risk weight of 70% — —
Risk weight of 95% — —
Risk weight of 120% — —
Risk weight of 140% — —
Risk weight of 250% — —
Risk weight of 0% (default) — —
Notes: 1. “Specialized Lending” refers to loans for Project Finance (PF), Object Finance (OF), Commodity Finance (CF) and Income-Producing Real Estate (IPRE) (as defined in the Notification Regarding Capital Adequacy Ratio, Article 1-1-41).
2. “High-Volatility Commercial Real Estate (HVCRE)” refers to loans that are the financing of commercial real estate that exhibits a higher rate of loss volatility compared to other types of Specialized Lending, as specified in the Notification Regarding Capital Adequacy Ratio, Article 1-1-43.
3. “Specialized Lending exposure subject to supervisory slotting criteria” refers to the amounts of Specialized Lending, subject to the Bank’s internal rating system, and have been allotted to the risk asset classifications given in the Notification Regarding Capital Adequacy Ratio, Article 130-4 and Article 130-6, after taking account of risk weights.
4. For risk weights, the Bank has applied the stipulations contained in the Notification Regarding Capital Adequacy Ratio, Article 130-4 and Article 130-6.
e. Equity Exposure Subject to the Simple Risk-Weighted Method of the Market-Based
Approach by Risk Weight
Amount of Equity Exposure Subject to the Simple Risk-Weighted Method
of the Market-Based Approach (Billions of Yen)
Classification As of March 31, 2017 As of March 31, 2016
Equity exposure subject to the simple risk-weighted method of the market-based approach by RW 100 89
Risk weight of 300% — —
Risk weight of 400% 100 89
Note: The “simple risk-weighted method of the market-based approach by RW” is a method for computing the amount of risk-weighted assets of equity and other investments. Under this method, the market value of listed stocks is multiplied by a risk weight of 300%, and the estimated value of unlisted stocks is multiplied by a risk weight of 400% (Notification Regarding Capital Adequacy Ratio, Article 143-4).
149ANNUAL REPORT 2017 The Norinchukin Bank
CAPITAL ADEQUACY
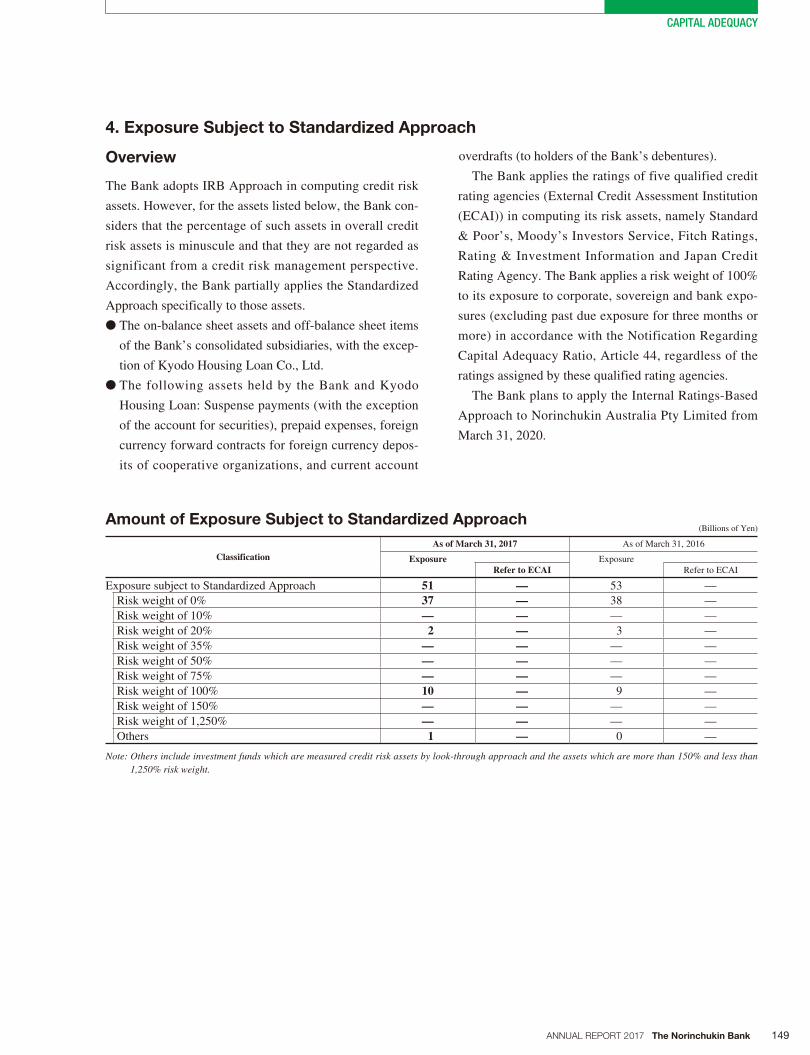
Overview
The Bank adopts IRB Approach in computing credit risk
assets. However, for the assets listed below, the Bank con-
siders that the percentage of such assets in overall credit
risk assets is minuscule and that they are not regarded as
significant from a credit risk management perspective.
Accordingly, the Bank partially applies the Standardized
Approach specifically to those assets.
● The on-balance sheet assets and off-balance sheet items
of the Bank’s consolidated subsidiaries, with the excep-
tion of Kyodo Housing Loan Co., Ltd.
● The following assets held by the Bank and Kyodo
Housing Loan: Suspense payments (with the exception
of the account for securities), prepaid expenses, foreign
currency forward contracts for foreign currency depos-
its of cooperative organizations, and current account
overdrafts (to holders of the Bank’s debentures).
The Bank applies the ratings of five qualified credit
rating agencies (External Credit Assessment Institution
(ECAI)) in computing its risk assets, namely Standard
& Poor’s, Moody’s Investors Service, Fitch Ratings,
Rating & Investment Information and Japan Credit
Rating Agency. The Bank applies a risk weight of 100%
to its exposure to corporate, sovereign and bank expo-
sures (excluding past due exposure for three months or
more) in accordance with the Notification Regarding
Capital Adequacy Ratio, Article 44, regardless of the
ratings assigned by these qualified rating agencies.
The Bank plans to apply the Internal Ratings-Based
Approach to Norinchukin Australia Pty Limited from
March 31, 2020.
Amount of Exposure Subject to Standardized Approach (Billions of Yen)
ClassificationAs of March 31, 2017 As of March 31, 2016
Exposure ExposureRefer to ECAI Refer to ECAI
Exposure subject to Standardized Approach 51 — 53 —
Risk weight of 0% 37 — 38 —
Risk weight of 10% — — — —
Risk weight of 20% 2 — 3 —
Risk weight of 35% — — — —
Risk weight of 50% — — — —
Risk weight of 75% — — — —
Risk weight of 100% 10 — 9 —
Risk weight of 150% — — — —
Risk weight of 1,250% — — — —
Others 1 — 0 —
Note: Others include investment funds which are measured credit risk assets by look-through approach and the assets which are more than 150% and less than 1,250% risk weight.
4. Exposure Subject to Standardized Approach

150 ANNUAL REPORT 2017 The Norinchukin Bank
CAPITAL ADEQUACY
Overview of Risk Management Policies
and Procedures Related to Credit Risk
Mitigation Techniques
■ Outline of Evaluation, Administrative
Policies and Procedures for Collateral
The Bank regards future cash flows generated from the
businesses of debtors as funds for recovery of its claims.
Collateral is viewed as supplementary for the recovery of its
claims. The Bank applies a collateral evaluation method to
ensure that the amount recovered from collateral is not less
than the assessed value of the collateral, even in the case
that it becomes necessary to recover claims from collateral.
Specifically, the Bank values collateral based on objec-
tive evidence such as appraisals, official land valuations
for inheritance tax purposes, and market value. Further,
it has established detailed valuation procedures that make
up its internal rules. In addition, the procedures stipulate
the frequency of valuation reviews according to collateral
type and the creditworthiness of debtors, which routinely
reflects changes in value. The Bank conducts verification
whenever possible, even when setting policies for debtors
and during self-assessment. The Bank also estimates the
recoverable amount by multiplying the weighing factor
based on collateral type, and then uses that estimate as a
secured amount for the depreciation allowance.
As a part of collateral management, the Bank stipulates
the procedures of reviewing the legal efficacy and enforce-
ability of collateral not only at the time of the collateral
pledge but also periodically through the term of contract.
■ Principal Types of Collateral
The principal types of collateral are marketable securities,
commercial bills and real estate.
■ Types of Guarantors and Principal
Counterparties in Credit Derivatives
and Explanation of their Credit
Standing
The types of guarantors in such transactions are mainly
sovereigns, including central and local governments,
financial institutions and corporates. When evaluating the
creditworthiness of guarantors, the Bank evaluates their
financial soundness after assigning a debtor rating and
assessing their creditworthiness. There is no transaction
for which credit risk is mitigated by a credit derivative.
■ Scope of Credit Risk Mitigation
Taking account of the conditions stated in the Notification
Regarding Capital Adequacy Ratio and the Bank’s oper-
ating practices, the Bank adopts Credit Risk Mitigation
(CRM) as follows.
Eligible Financial Collateral
For repo-type transactions and secured derivative transac-
tions (transactions based on a CSA contract), the Bank
recognizes the effectiveness of CRM as stipulated in the
Notification Regarding Capital Adequacy Ratio.
For transactions other than repo-type transactions and
secured derivative transactions, the Bank recognizes the
effectiveness of CRM in such case where deposits with the
Bank (including Norinchukin Bank Debentures) or stocks,
etc., are pledged as collateral.
Other Eligible Collateral
The Bank does not take into account the effects of CRM
for collateral such as real estate, commercial bills, and
other eligible assets.
Setoff for Loans and Deposits
The Bank does not take into account the effects of CRM
for deposits held with the Bank unless they are pledged
as collateral.
Guarantees and Credit Derivatives
Guarantees derived from guarantors recognized for main-
taining effective guarantees take into account the effects of
CRM, including the assignment of a debtor rating higher
than that of the guaranteed party. Furthermore, these are not
transactions that use credit derivatives to reduce credit risk.
Legally Binding Bilateral Netting
Contracts for Derivatives and Repo-Type
Transactions
The Bank considers legally binding bilateral netting con-
tracts for derivatives subject to netting in the ISDA Master
Credit Risk Mitigation Techniques (Consolidated)
151ANNUAL REPORT 2017 The Norinchukin Bank
CAPITAL ADEQUACY
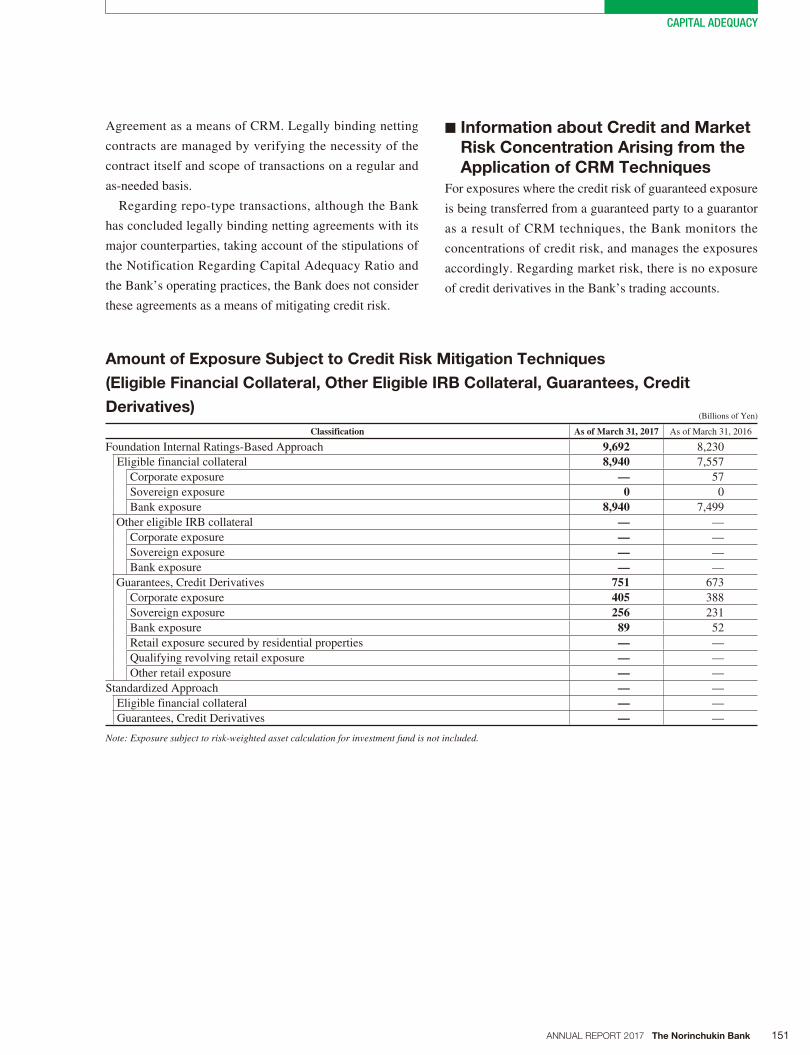
Agreement as a means of CRM. Legally binding netting
contracts are managed by verifying the necessity of the
contract itself and scope of transactions on a regular and
as-needed basis.
Regarding repo-type transactions, although the Bank
has concluded legally binding netting agreements with its
major counterparties, taking account of the stipulations of
the Notification Regarding Capital Adequacy Ratio and
the Bank’s operating practices, the Bank does not consider
these agreements as a means of mitigating credit risk.
■ Information about Credit and Market
Risk Concentration Arising from the
Application of CRM Techniques
For exposures where the credit risk of guaranteed exposure
is being transferred from a guaranteed party to a guarantor
as a result of CRM techniques, the Bank monitors the
concentrations of credit risk, and manages the exposures
accordingly. Regarding market risk, there is no exposure
of credit derivatives in the Bank’s trading accounts.
Amount of Exposure Subject to Credit Risk Mitigation Techniques
(Eligible Financial Collateral, Other Eligible IRB Collateral, Guarantees, Credit
Derivatives) (Billions of Yen)
Classification As of March 31, 2017 As of March 31, 2016
Foundation Internal Ratings-Based Approach 9,692 8,230
Eligible financial collateral 8,940 7,557
Corporate exposure — 57
Sovereign exposure 0 0
Bank exposure 8,940 7,499
Other eligible IRB collateral — —
Corporate exposure — —
Sovereign exposure — —
Bank exposure — —
Guarantees, Credit Derivatives 751 673
Corporate exposure 405 388
Sovereign exposure 256 231
Bank exposure 89 52
Retail exposure secured by residential properties — —
Qualifying revolving retail exposure — —
Other retail exposure — —
Standardized Approach — —
Eligible financial collateral — —
Guarantees, Credit Derivatives — —
Note: Exposure subject to risk-weighted asset calculation for investment fund is not included.
152 ANNUAL REPORT 2017 The Norinchukin Bank
CAPITAL ADEQUACY
Overview of Risk Management Policies
and Procedures for Counterparty Credit
Risk in Derivatives and Transactions with
a Long Settlement Period
■ Policies for Allocation of Risk Capital
and Credit Lines
The Bank manages credit risk involving derivative transac-
tions with financial institutions within the risk limits (Bank
Ceiling) established in each group financial institution.
A Bank Ceiling is established for each front section on
the basis of each entity within the group and each type
of transaction (derivatives, financial transactions, loans,
etc.). Credit exposures related to derivative transactions
are managed so as not to exceed the limits. Under the Bank
Ceiling system, the exposure of derivatives that are to
be managed is calculated utilizing the current exposure
method (the replacement cost (mark-to-market) of the
transaction plus an add-on deemed to reflect the potential
future exposure).
■ Policies for Calculating the Value of
Collateral as Security for Claims and
Reserve for Possible Loan Losses
For derivative transactions, the Bank has concluded a CSA
contract with major counterparties. In some cases, the
Bank receives collateral from these counterparties. The
collateral posted may vary depending on the terms of the
CSA contract, but mainly it consists of Japanese govern-
ment bonds (JGBs), Japanese yen cash, U.S. Treasury
bonds, and U.S. dollar cash. Regarding replacement costs
for derivative transactions (the required cost when rene-
gotiating the same transaction on the market), the Bank
has allocated a required reserve depending on the debtor
classification of the financial institution counterparty.
■ Remarks on Impact in Case the
Bank is Required to Post Additional
Collateral when its Credit Standing
Deteriorates
If the Bank’s credit rating is downgraded, the Bank’s finan-
cial institution counterparty will reduce its credit risk limit
and may demand the Bank to post collateral. However, the
Bank has a sufficiently high level of liquid assets, such
as government bonds that can be used as collateral, and
the amount of those assets is periodically checked by the
Portfolio Management Committee. For this reason, even
if the Bank is required to post additional collateral, the
impact on the Bank will be minimal.
Counterparty Credit Risk in Derivative Transactions (Consolidated)
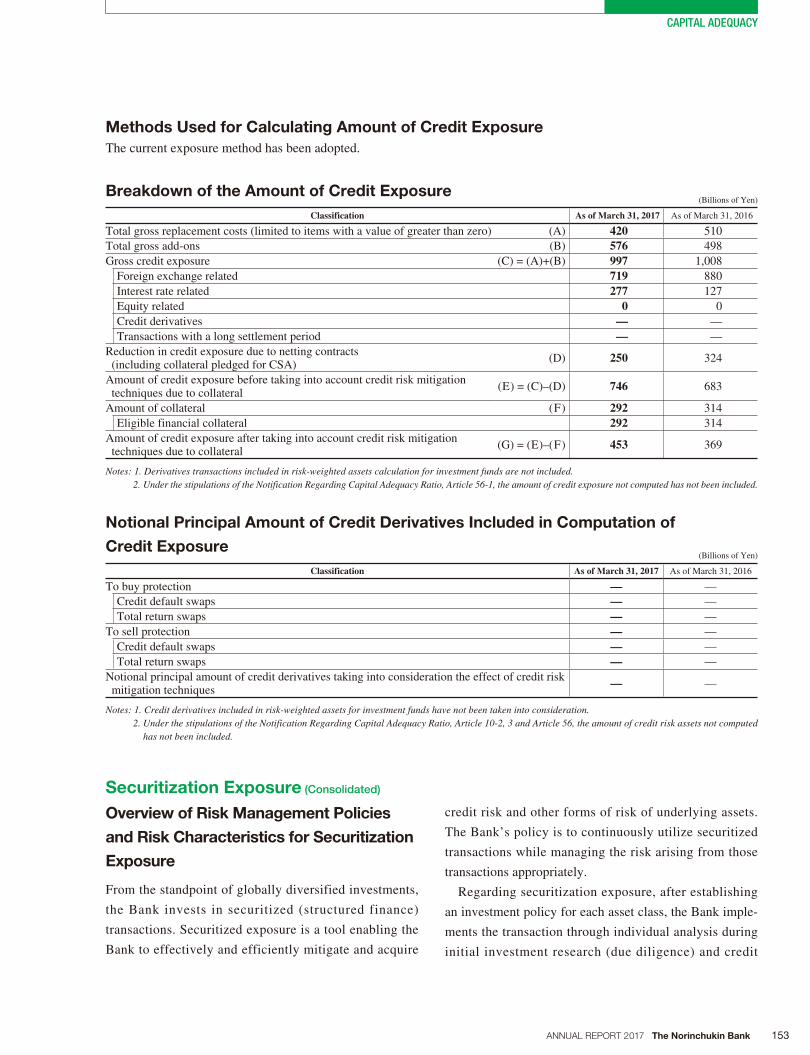
153ANNUAL REPORT 2017 The Norinchukin Bank
CAPITAL ADEQUACY
Methods Used for Calculating Amount of Credit Exposure
The current exposure method has been adopted.
Breakdown of the Amount of Credit Exposure (Billions of Yen)
Classification As of March 31, 2017 As of March 31, 2016
Total gross replacement costs (limited to items with a value of greater than zero) (A) 420 510
Total gross add-ons (B) 576 498
Gross credit exposure (C) = (A)+(B) 997 1,008
Foreign exchange related 719 880
Interest rate related 277 127
Equity related 0 0
Credit derivatives — —
Transactions with a long settlement period — —
Reduction in credit exposure due to netting contracts (including collateral pledged for CSA)
(D) 250 324
Amount of credit exposure before taking into account credit risk mitigation techniques due to collateral
(E) = (C)–(D) 746 683
Amount of collateral (F) 292 314
Eligible financial collateral 292 314
Amount of credit exposure after taking into account credit risk mitigation techniques due to collateral
(G) = (E)–(F) 453 369
Notes: 1. Derivatives transactions included in risk-weighted assets calculation for investment funds are not included.2. Under the stipulations of the Notification Regarding Capital Adequacy Ratio, Article 56-1, the amount of credit exposure not computed has not been included.
Notional Principal Amount of Credit Derivatives Included in Computation of
Credit Exposure (Billions of Yen)
Classification As of March 31, 2017 As of March 31, 2016
To buy protection — —
Credit default swaps — —
Total return swaps — —
To sell protection — —
Credit default swaps — —
Total return swaps — —
Notional principal amount of credit derivatives taking into consideration the effect of credit risk mitigation techniques
— —
Notes: 1. Credit derivatives included in risk-weighted assets for investment funds have not been taken into consideration.2. Under the stipulations of the Notification Regarding Capital Adequacy Ratio, Article 10-2, 3 and Article 56, the amount of credit risk assets not computed
has not been included.
Securitization Exposure (Consolidated)
Overview of Risk Management Policies
and Risk Characteristics for Securitization
Exposure
From the standpoint of globally diversified investments,
the Bank invests in securitized (structured finance)
transactions. Securitized exposure is a tool enabling the
Bank to effectively and efficiently mitigate and acquire
credit risk and other forms of risk of underlying assets.
The Bank’s policy is to continuously utilize securitized
transactions while managing the risk arising from those
transactions appropriately.
Regarding securitization exposure, after establishing
an investment policy for each asset class, the Bank imple-
ments the transaction through individual analysis during
initial investment research (due diligence) and credit
154 ANNUAL REPORT 2017 The Norinchukin Bank
CAPITAL ADEQUACY
screening. During individual analysis, in general, because
of complex investment structures with different risk-return
profiles than the underlying assets, after identifying items
of due diligence and monitoring of each asset class as
well as securitization and re-securitization, the Bank care-
fully examines risk in underlying assets and structure and
conducts quantitative analysis of repayment capacity.
After investment, the Bank monitors the credit condition,
including underlying asset performance of each project,
and analyzes and assesses the market environment taking
into account underlying asset trends of each asset class.
In the event of credit deterioration, etc., is being seen, a
framework of risk management is created including revis-
ing investment and holding policies.
The securitization exposure which contains securitiza-
tion exposure as an underlying asset is called re-securiti-
zation exposure. Among the re-securitization exposures,
wherein the majority of underlying assets are comprised of
securitization exposures, the Bank treats them as second-
ary and tertiary re-securitization exposures and manages
them separately from other re-securitization exposures
in order to monitor and manage them closely. The Bank
does not plan to acquire new secondary or tertiary re-
securitization exposures.
Regarding its securitization exposure, the Bank appro-
priately calculates the amount of risk-weighted asset for
credit risk based on the Notification Regarding Capital
Adequacy Ratio. As a part of its integrated risk manage-
ment, based on the risk profile of the securitization expo-
sure, the Bank computes risk amount.
For securitization transactions, as described above, the
Bank has been mainly be involved as an investor, and also
involved in arranging securitization and liquidity schemes
such as using loan debt as the Group.
As of March 31, 2017, the Bank engaged in no secu-
ritization transactions in which the Bank acted as an
originator and recognized regulatory risk asset mitigation
effects. In addition, the Bank’s subsidiaries (excluding
consolidated subsidiaries) or affiliates have no securi-
tization exposure involving securitization transactions
performed by the Bank in fiscal 2016.
Calculation of Risk-Weighted Asset for
Credit Risk in Securitization Exposure
The Bank calculates the amount of risk-weighted asset
for credit risk for securitization exposure by applying
the “Ratings-Based Approach (RBA)” or “Supervisory
Formula (SF).” In cases in which it cannot apply RBA or
SF, the Bank applies a risk weight of 1,250%. In addition,
the Bank does not use the “Internal Assessment Approach
(IAA).”
The Bank has no securitization exposures containing
securitization exposure as an underlying asset, for which
risk-weighted asset for credit risk is calculated not as
re-securitization exposure but as securitization exposure
based on rules in the Notification Regarding Capital
Adequacy Ratio.
For securitization exposures to which RBA is applied,
the Bank relies on the following five qualified credit rating
agencies: Standard & Poor’s, Moody’s Investors Service,
Fitch Ratings, Rating & Investment Information and Japan
Credit Rating Agency.
The Bank treats securitized instruments in accordance
with the “Accounting Standard for Financial Instruments”
(ASBJ Statement No. 10) and “Practical Guidelines on
Accounting Standards for Financial Instruments” (JICPA
Laws and Regulations Committee Report No. 14) for
accounting purposes.
No material changes have been made to quantitative
data. Moreover, the Bank holds no assets for the purpose
of securitization transactions.
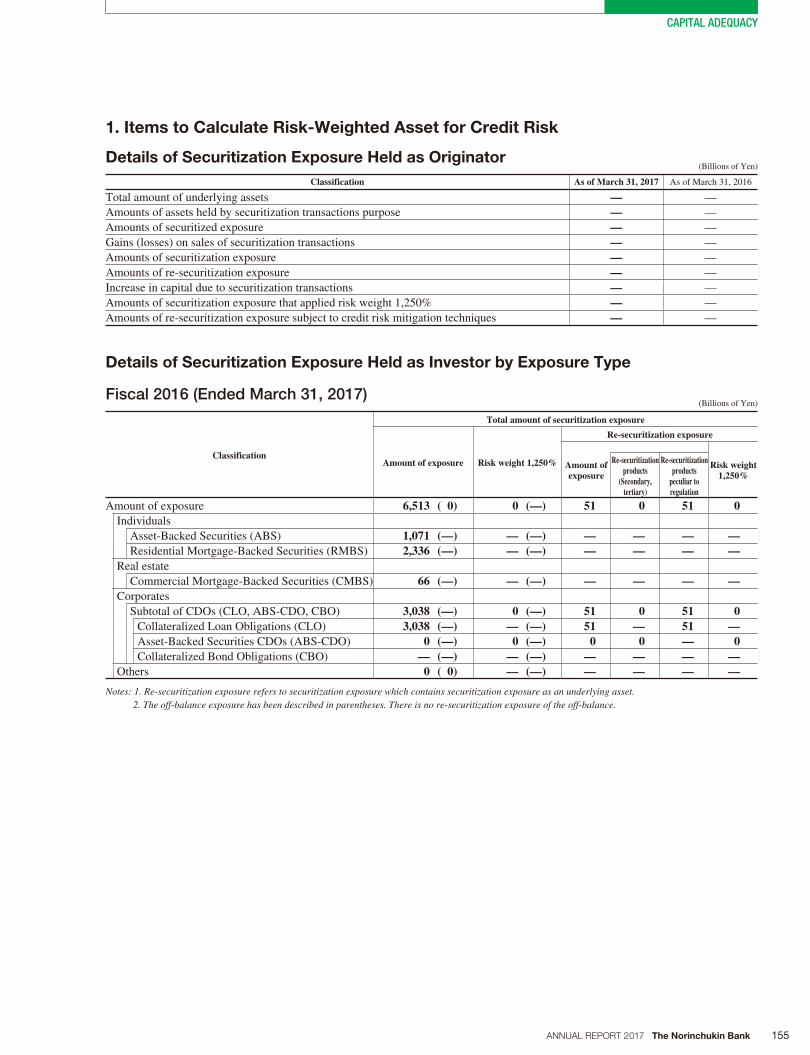
155ANNUAL REPORT 2017 The Norinchukin Bank
CAPITAL ADEQUACY
Details of Securitization Exposure Held as Originator (Billions of Yen)
Classification As of March 31, 2017 As of March 31, 2016
Total amount of underlying assets — —
Amounts of assets held by securitization transactions purpose — —
Amounts of securitized exposure — —
Gains (losses) on sales of securitization transactions — —
Amounts of securitization exposure — —
Amounts of re-securitization exposure — —
Increase in capital due to securitization transactions — —
Amounts of securitization exposure that applied risk weight 1,250% — —
Amounts of re-securitization exposure subject to credit risk mitigation techniques — —
Details of Securitization Exposure Held as Investor by Exposure Type
Fiscal 2016 (Ended March 31, 2017) (Billions of Yen)
Classification
Total amount of securitization exposure
Amount of exposure Risk weight 1,250%
Re-securitization exposure
Amount of exposure
Risk weight 1,250%
Re-securitization products
(Secondary, tertiary)
Re-securitization products
peculiar to regulation
Amount of exposure 6,513 ( 0) 0 (—) 51 0 51 0Individuals
Asset-Backed Securities (ABS) 1,071 (—) — (—) — — — —Residential Mortgage-Backed Securities (RMBS) 2,336 (—) — (—) — — — —
Real estate
Commercial Mortgage-Backed Securities (CMBS) 66 (—) — (—) — — — —Corporates
Subtotal of CDOs (CLO, ABS-CDO, CBO) 3,038 (—) 0 (—) 51 0 51 0Collateralized Loan Obligations (CLO) 3,038 (—) — (—) 51 — 51 —Asset-Backed Securities CDOs (ABS-CDO) 0 (—) 0 (—) 0 0 — 0Collateralized Bond Obligations (CBO) — (—) — (—) — — — —
Others 0 ( 0) — (—) — — — —
Notes: 1. Re-securitization exposure refers to securitization exposure which contains securitization exposure as an underlying asset.2. The off-balance exposure has been described in parentheses. There is no re-securitization exposure of the off-balance.
1. Items to Calculate Risk-Weighted Asset for Credit Risk
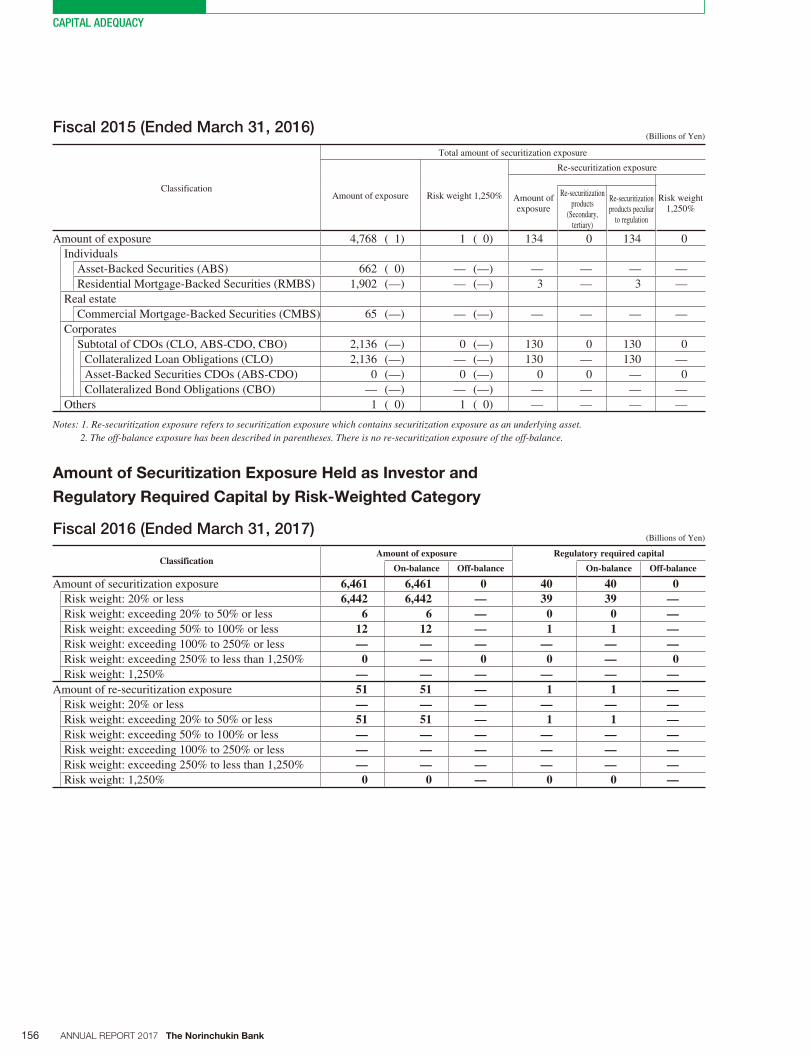
156 ANNUAL REPORT 2017 The Norinchukin Bank
CAPITAL ADEQUACY
Fiscal 2015 (Ended March 31, 2016) (Billions of Yen)
Classification
Total amount of securitization exposure
Amount of exposure Risk weight 1,250%
Re-securitization exposure
Amount of exposure
Risk weight 1,250%
Re-securitization products
(Secondary, tertiary)
Re-securitization products peculiar
to regulation
Amount of exposure 4,768 ( 1) 1 ( 0) 134 0 134 0
Individuals
Asset-Backed Securities (ABS) 662 ( 0) — (—) — — — —
Residential Mortgage-Backed Securities (RMBS) 1,902 (—) — (—) 3 — 3 —
Real estate
Commercial Mortgage-Backed Securities (CMBS) 65 (—) — (—) — — — —
Corporates
Subtotal of CDOs (CLO, ABS-CDO, CBO) 2,136 (—) 0 (—) 130 0 130 0
Collateralized Loan Obligations (CLO) 2,136 (—) — (—) 130 — 130 —
Asset-Backed Securities CDOs (ABS-CDO) 0 (—) 0 (—) 0 0 — 0
Collateralized Bond Obligations (CBO) — (—) — (—) — — — —
Others 1 ( 0) 1 ( 0) — — — —
Notes: 1. Re-securitization exposure refers to securitization exposure which contains securitization exposure as an underlying asset.2. The off-balance exposure has been described in parentheses. There is no re-securitization exposure of the off-balance.
Amount of Securitization Exposure Held as Investor and
Regulatory Required Capital by Risk-Weighted Category
Fiscal 2016 (Ended March 31, 2017) (Billions of Yen)
ClassificationAmount of exposure Regulatory required capital
On-balance Off-balance On-balance Off-balance
Amount of securitization exposure 6,461 6,461 0 40 40 0Risk weight: 20% or less 6,442 6,442 — 39 39 —Risk weight: exceeding 20% to 50% or less 6 6 — 0 0 —Risk weight: exceeding 50% to 100% or less 12 12 — 1 1 —Risk weight: exceeding 100% to 250% or less — — — — — —Risk weight: exceeding 250% to less than 1,250% 0 — 0 0 — 0Risk weight: 1,250% — — — — — —
Amount of re-securitization exposure 51 51 — 1 1 —Risk weight: 20% or less — — — — — —Risk weight: exceeding 20% to 50% or less 51 51 — 1 1 —Risk weight: exceeding 50% to 100% or less — — — — — —Risk weight: exceeding 100% to 250% or less — — — — — —Risk weight: exceeding 250% to less than 1,250% — — — — — —Risk weight: 1,250% 0 0 — 0 0 —

157ANNUAL REPORT 2017 The Norinchukin Bank
CAPITAL ADEQUACY
Fiscal 2015 (Ended March 31, 2016) (Billions of Yen)
ClassificationAmount of exposure Regulatory required capital
On-balance Off-balance On-balance Off-balance
Amount of securitization exposure 4,634 4,633 1 32 32 0
Risk weight: 20% or less 4,618 4,618 0 29 29 0
Risk weight: exceeding 20% to 50% or less 7 7 — 0 0 —
Risk weight: exceeding 50% to 100% or less 1 1 — 0 0 —
Risk weight: exceeding 100% to 250% or less 0 — 0 0 — 0
Risk weight: exceeding 250% to less than 1,250% 5 4 0 1 1 0
Risk weight: 1,250% 1 1 0 1 1 0
Amount of re-securitization exposure 134 134 — 3 3 —
Risk weight: 20% or less 3 3 — 0 0 —
Risk weight: exceeding 20% to 50% or less 130 130 — 3 3 —
Risk weight: exceeding 50% to 100% or less — — — — — —
Risk weight: exceeding 100% to 250% or less — — — — — —
Risk weight: exceeding 250% to less than 1,250% — — — — — —
Risk weight: 1,250% 0 0 — 0 0 —
Amount of Re-Securitization Exposure Held as Investor and
Subject to Credit Risk Mitigation Techniques (Billions of Yen)
ClassificationAs of March 31, 2017 As of March 31, 2016
Amount of exposure
Regulatory required capital
Amount of exposure
Regulatory required capital
Amount of re-securitization exposure — — — —
Risk weight applied to guarantor: 20% or less — — — —
Risk weight applied to guarantor: exceeding 20% to 50% or less — — — —
Risk weight applied to guarantor: exceeding 50% to 100% or less — — — —
Risk weight applied to guarantor: exceeding 100% to 250% or less — — — —
Risk weight applied to guarantor: exceeding 250% to less than 1,250% — — — —
Risk weight applied to guarantor: 1,250% — — — —
2. Securitization Exposure Subject to Market Risk
Not applicable
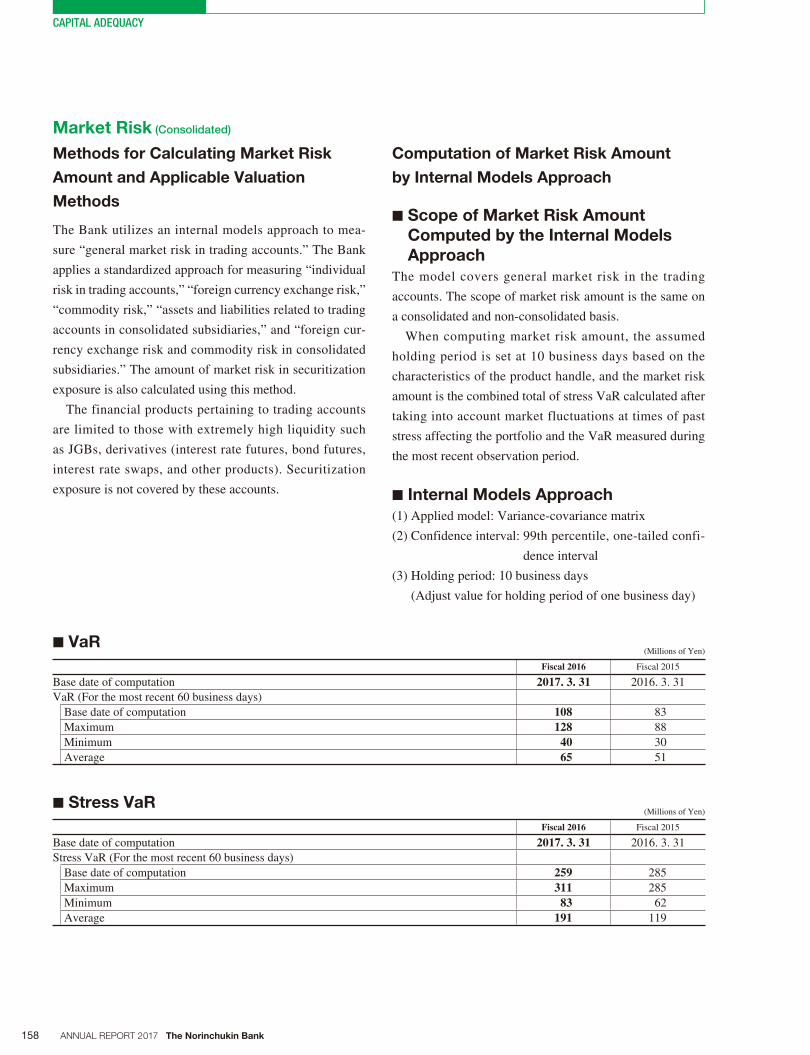
158 ANNUAL REPORT 2017 The Norinchukin Bank
CAPITAL ADEQUACY
Methods for Calculating Market Risk
Amount and Applicable Valuation
Methods
The Bank utilizes an internal models approach to mea-
sure “general market risk in trading accounts.” The Bank
applies a standardized approach for measuring “individual
risk in trading accounts,” “foreign currency exchange risk,”
“commodity risk,” “assets and liabilities related to trading
accounts in consolidated subsidiaries,” and “foreign cur-
rency exchange risk and commodity risk in consolidated
subsidiaries.” The amount of market risk in securitization
exposure is also calculated using this method.
The financial products pertaining to trading accounts
are limited to those with extremely high liquidity such
as JGBs, derivatives (interest rate futures, bond futures,
interest rate swaps, and other products). Securitization
exposure is not covered by these accounts.
Computation of Market Risk Amount
by Internal Models Approach
■ Scope of Market Risk Amount
Computed by the Internal Models
Approach
The model covers general market risk in the trading
accounts. The scope of market risk amount is the same on
a consolidated and non-consolidated basis.
When computing market risk amount, the assumed
holding period is set at 10 business days based on the
characteristics of the product handle, and the market risk
amount is the combined total of stress VaR calculated after
taking into account market fluctuations at times of past
stress affecting the portfolio and the VaR measured during
the most recent observation period.
■ Internal Models Approach
(1) Applied model: Variance-covariance matrix
(2) Confidence interval: 99th percentile, one-tailed confi-
dence interval
(3) Holding period: 10 business days
(Adjust value for holding period of one business day)
■ VaR (Millions of Yen)
Fiscal 2016 Fiscal 2015
Base date of computation 2017. 3. 31 2016. 3. 31
VaR (For the most recent 60 business days)
Base date of computation 108 83
Maximum 128 88
Minimum 40 30
Average 65 51
■ Stress VaR (Millions of Yen)
Fiscal 2016 Fiscal 2015
Base date of computation 2017. 3. 31 2016. 3. 31
Stress VaR (For the most recent 60 business days)
Base date of computation 259 285
Maximum 311 285
Minimum 83 62
Average 191 119
Market Risk (Consolidated)
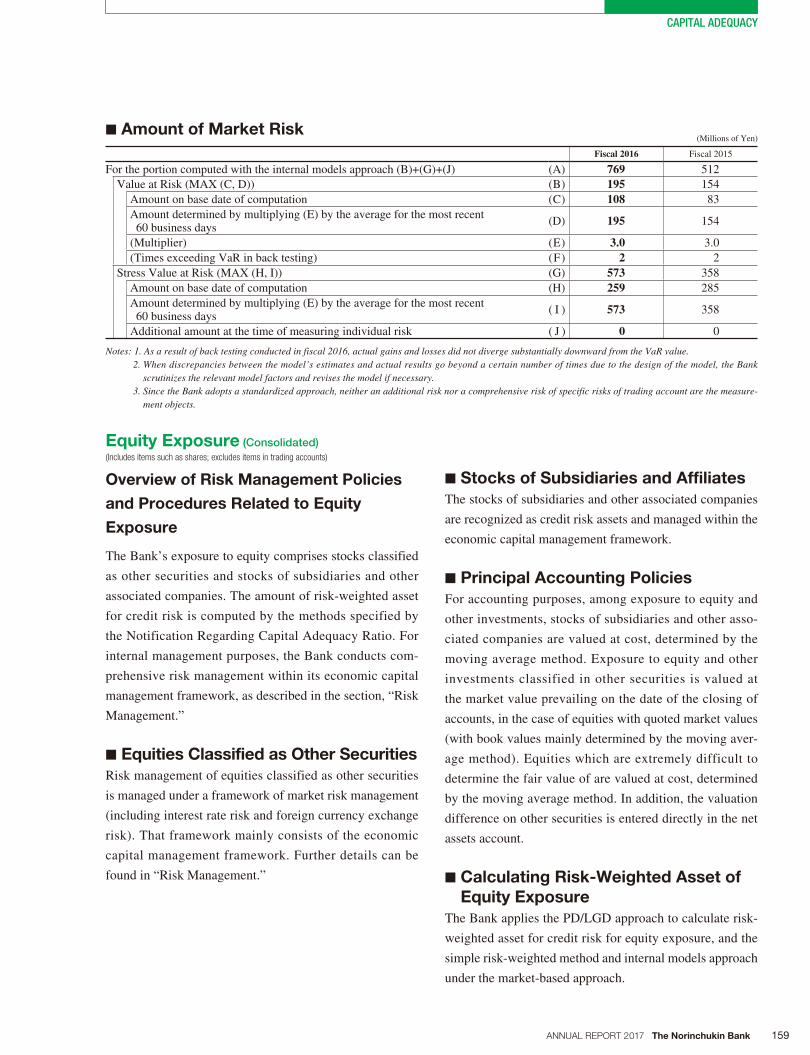
159ANNUAL REPORT 2017 The Norinchukin Bank
CAPITAL ADEQUACY
■ Amount of Market Risk (Millions of Yen)
Fiscal 2016 Fiscal 2015
For the portion computed with the internal models approach (B)+(G)+(J) (A) 769 512
Value at Risk (MAX (C, D)) (B) 195 154
Amount on base date of computation (C) 108 83
Amount determined by multiplying (E) by the average for the most recent 60 business days
(D) 195 154
(Multiplier) (E) 3.0 3.0
(Times exceeding VaR in back testing) (F) 2 2
Stress Value at Risk (MAX (H, I)) (G) 573 358
Amount on base date of computation (H) 259 285
Amount determined by multiplying (E) by the average for the most recent 60 business days
( I ) 573 358
Additional amount at the time of measuring individual risk ( J ) 0 0
Notes: 1. As a result of back testing conducted in fiscal 2016, actual gains and losses did not diverge substantially downward from the VaR value. 2. When discrepancies between the model’s estimates and actual results go beyond a certain number of times due to the design of the model, the Bank
scrutinizes the relevant model factors and revises the model if necessary.3. Since the Bank adopts a standardized approach, neither an additional risk nor a comprehensive risk of specific risks of trading account are the measure-
ment objects.
Overview of Risk Management Policies
and Procedures Related to Equity
Exposure
The Bank’s exposure to equity comprises stocks classified
as other securities and stocks of subsidiaries and other
associated companies. The amount of risk-weighted asset
for credit risk is computed by the methods specified by
the Notification Regarding Capital Adequacy Ratio. For
internal management purposes, the Bank conducts com-
prehensive risk management within its economic capital
management framework, as described in the section, “Risk
Management.”
■ Equities Classified as Other Securities
Risk management of equities classified as other securities
is managed under a framework of market risk management
(including interest rate risk and foreign currency exchange
risk). That framework mainly consists of the economic
capital management framework. Further details can be
found in “Risk Management.”
■ Stocks of Subsidiaries and Affiliates
The stocks of subsidiaries and other associated companies
are recognized as credit risk assets and managed within the
economic capital management framework.
■ Principal Accounting Policies
For accounting purposes, among exposure to equity and
other investments, stocks of subsidiaries and other asso-
ciated companies are valued at cost, determined by the
moving average method. Exposure to equity and other
investments classified in other securities is valued at
the market value prevailing on the date of the closing of
accounts, in the case of equities with quoted market values
(with book values mainly determined by the moving aver-
age method). Equities which are extremely difficult to
determine the fair value of are valued at cost, determined
by the moving average method. In addition, the valuation
difference on other securities is entered directly in the net
assets account.
■ Calculating Risk-Weighted Asset of
Equity Exposure
The Bank applies the PD/LGD approach to calculate risk-
weighted asset for credit risk for equity exposure, and the
simple risk-weighted method and internal models approach
under the market-based approach.
Equity Exposure (Consolidated)
(Includes items such as shares; excludes items in trading accounts)
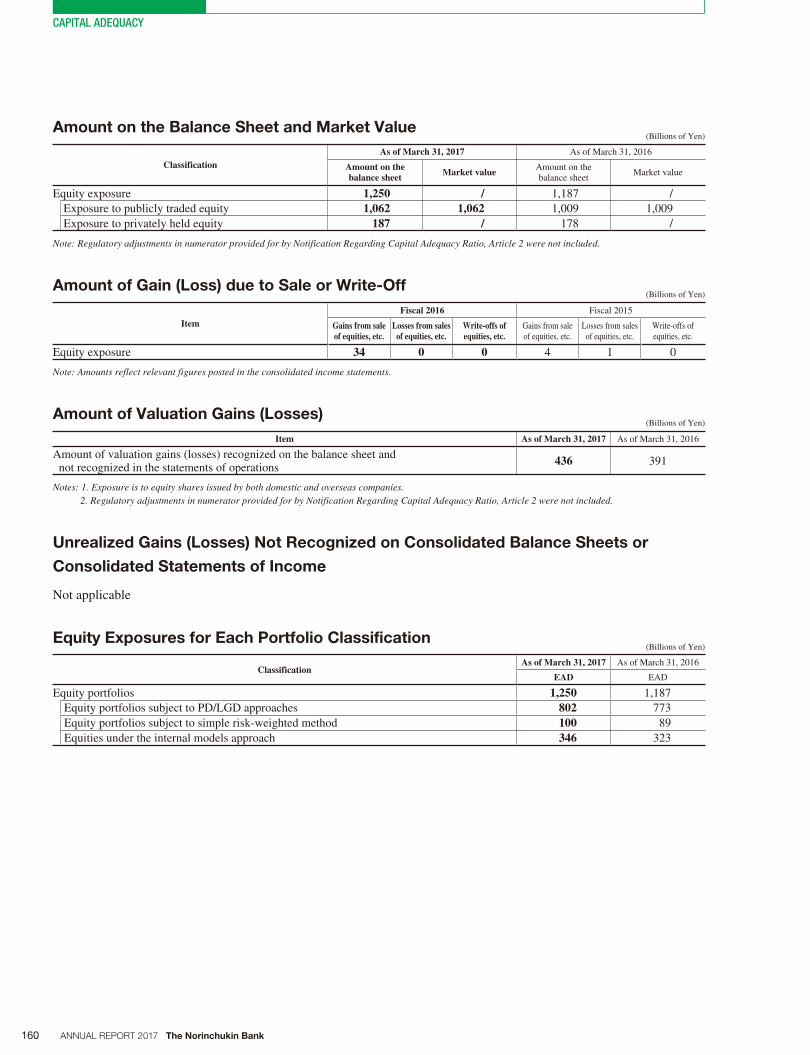
160 ANNUAL REPORT 2017 The Norinchukin Bank
CAPITAL ADEQUACY
Amount on the Balance Sheet and Market Value (Billions of Yen)
ClassificationAs of March 31, 2017 As of March 31, 2016
Amount on the balance sheet Market value Amount on the
balance sheet Market value
Equity exposure 1,250 / 1,187 /
Exposure to publicly traded equity 1,062 1,062 1,009 1,009
Exposure to privately held equity 187 / 178 /
Note: Regulatory adjustments in numerator provided for by Notification Regarding Capital Adequacy Ratio, Article 2 were not included.
Amount of Gain (Loss) due to Sale or Write-Off (Billions of Yen)
ItemFiscal 2016 Fiscal 2015
Gains from saleof equities, etc.
Losses from sales of equities, etc.
Write-offs of equities, etc.
Gains from sale of equities, etc.
Losses from sales of equities, etc.
Write-offs of equities, etc.
Equity exposure 34 0 0 4 1 0
Note: Amounts reflect relevant figures posted in the consolidated income statements.
Amount of Valuation Gains (Losses) (Billions of Yen)
Item As of March 31, 2017 As of March 31, 2016
Amount of valuation gains (losses) recognized on the balance sheet and not recognized in the statements of operations
436 391
Notes: 1. Exposure is to equity shares issued by both domestic and overseas companies.2. Regulatory adjustments in numerator provided for by Notification Regarding Capital Adequacy Ratio, Article 2 were not included.
Unrealized Gains (Losses) Not Recognized on Consolidated Balance Sheets or
Consolidated Statements of Income
Not applicable
Equity Exposures for Each Portfolio Classification (Billions of Yen)
ClassificationAs of March 31, 2017 As of March 31, 2016
EAD EAD
Equity portfolios 1,250 1,187
Equity portfolios subject to PD/LGD approaches 802 773
Equity portfolios subject to simple risk-weighted method 100 89
Equities under the internal models approach 346 323
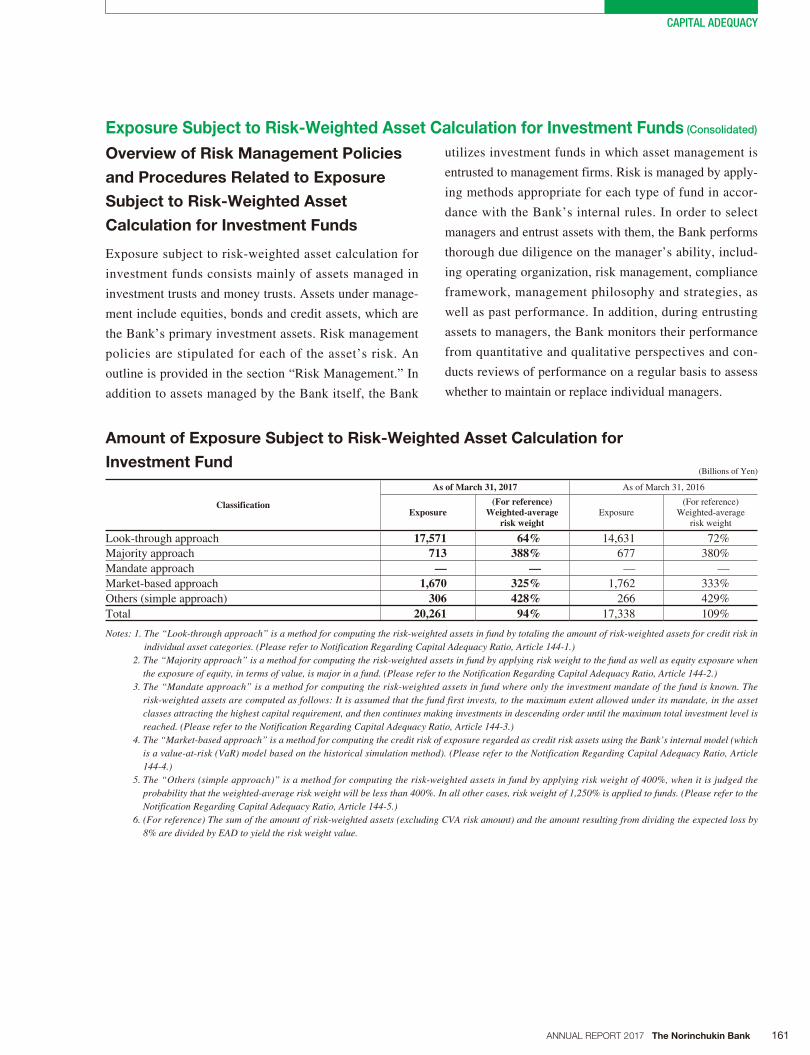
161ANNUAL REPORT 2017 The Norinchukin Bank
CAPITAL ADEQUACY
Overview of Risk Management Policies
and Procedures Related to Exposure
Subject to Risk-Weighted Asset
Calculation for Investment Funds
Exposure subject to risk-weighted asset calculation for
investment funds consists mainly of assets managed in
investment trusts and money trusts. Assets under manage-
ment include equities, bonds and credit assets, which are
the Bank’s primary investment assets. Risk management
policies are stipulated for each of the asset’s risk. An
outline is provided in the section “Risk Management.” In
addition to assets managed by the Bank itself, the Bank
utilizes investment funds in which asset management is
entrusted to management firms. Risk is managed by apply-
ing methods appropriate for each type of fund in accor-
dance with the Bank’s internal rules. In order to select
managers and entrust assets with them, the Bank performs
thorough due diligence on the manager’s ability, includ-
ing operating organization, risk management, compliance
framework, management philosophy and strategies, as
well as past performance. In addition, during entrusting
assets to managers, the Bank monitors their performance
from quantitative and qualitative perspectives and con-
ducts reviews of performance on a regular basis to assess
whether to maintain or replace individual managers.
Amount of Exposure Subject to Risk-Weighted Asset Calculation for
Investment Fund (Billions of Yen)
Classification
As of March 31, 2017 As of March 31, 2016
Exposure(For reference)
Weighted-average risk weight
Exposure(For reference)
Weighted-average risk weight
Look-through approach 17,571 64% 14,631 72%
Majority approach 713 388% 677 380%
Mandate approach — — — —
Market-based approach 1,670 325% 1,762 333%
Others (simple approach) 306 428% 266 429%
Total 20,261 94% 17,338 109%
Notes: 1. The “Look-through approach” is a method for computing the risk-weighted assets in fund by totaling the amount of risk-weighted assets for credit risk in individual asset categories. (Please refer to Notification Regarding Capital Adequacy Ratio, Article 144-1.)
2. The “Majority approach” is a method for computing the risk-weighted assets in fund by applying risk weight to the fund as well as equity exposure when the exposure of equity, in terms of value, is major in a fund. (Please refer to the Notification Regarding Capital Adequacy Ratio, Article 144-2.)
3. The “Mandate approach” is a method for computing the risk-weighted assets in fund where only the investment mandate of the fund is known. The risk-weighted assets are computed as follows: It is assumed that the fund first invests, to the maximum extent allowed under its mandate, in the asset classes attracting the highest capital requirement, and then continues making investments in descending order until the maximum total investment level is reached. (Please refer to the Notification Regarding Capital Adequacy Ratio, Article 144-3.)
4. The “Market-based approach” is a method for computing the credit risk of exposure regarded as credit risk assets using the Bank’s internal model (which is a value-at-risk (VaR) model based on the historical simulation method). (Please refer to the Notification Regarding Capital Adequacy Ratio, Article 144-4.)
5. The “Others (simple approach)” is a method for computing the risk-weighted assets in fund by applying risk weight of 400%, when it is judged the probability that the weighted-average risk weight will be less than 400%. In all other cases, risk weight of 1,250% is applied to funds. (Please refer to the Notification Regarding Capital Adequacy Ratio, Article 144-5.)
6. (For reference) The sum of the amount of risk-weighted assets (excluding CVA risk amount) and the amount resulting from dividing the expected loss by 8% are divided by EAD to yield the risk weight value.
Exposure Subject to Risk-Weighted Asset Calculation for Investment Funds (Consolidated)
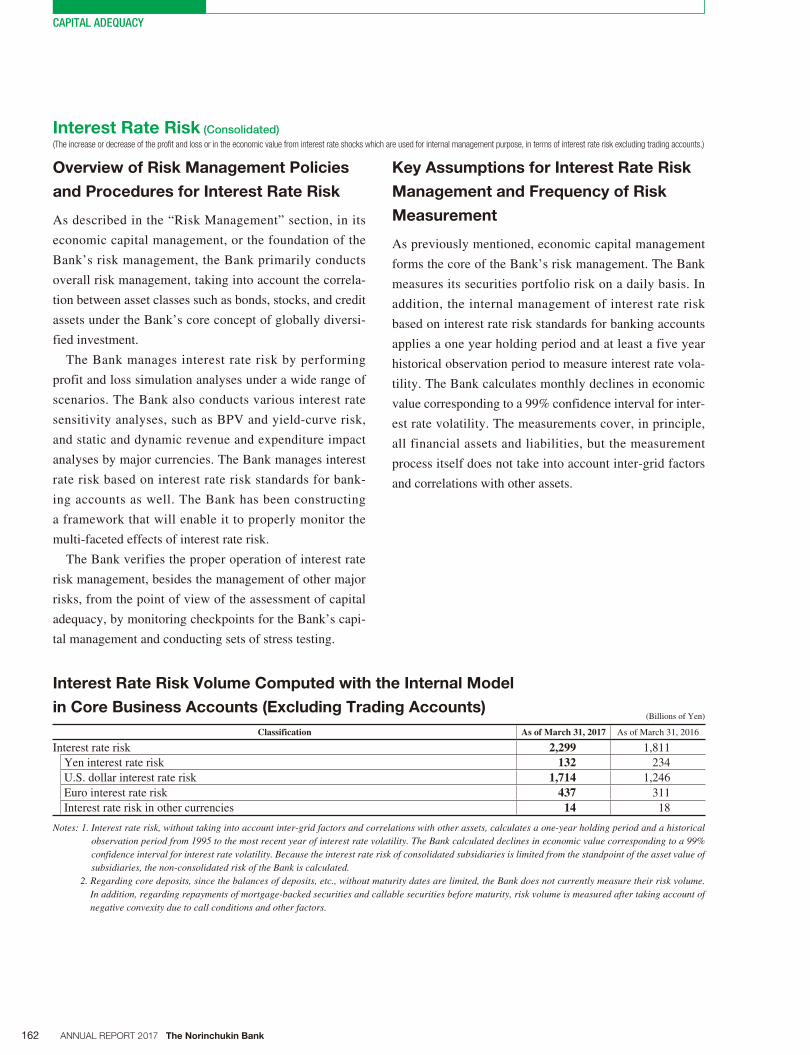
162 ANNUAL REPORT 2017 The Norinchukin Bank
CAPITAL ADEQUACY
Overview of Risk Management Policies
and Procedures for Interest Rate Risk
As described in the “Risk Management” section, in its
economic capital management, or the foundation of the
Bank’s risk management, the Bank primarily conducts
overall risk management, taking into account the correla-
tion between asset classes such as bonds, stocks, and credit
assets under the Bank’s core concept of globally diversi-
fied investment.
The Bank manages interest rate risk by performing
profit and loss simulation analyses under a wide range of
scenarios. The Bank also conducts various interest rate
sensitivity analyses, such as BPV and yield-curve risk,
and static and dynamic revenue and expenditure impact
analyses by major currencies. The Bank manages interest
rate risk based on interest rate risk standards for bank-
ing accounts as well. The Bank has been constructing
a framework that will enable it to properly monitor the
multi-faceted effects of interest rate risk.
The Bank verifies the proper operation of interest rate
risk management, besides the management of other major
risks, from the point of view of the assessment of capital
adequacy, by monitoring checkpoints for the Bank’s capi-
tal management and conducting sets of stress testing.
Key Assumptions for Interest Rate Risk
Management and Frequency of Risk
Measurement
As previously mentioned, economic capital management
forms the core of the Bank’s risk management. The Bank
measures its securities portfolio risk on a daily basis. In
addition, the internal management of interest rate risk
based on interest rate risk standards for banking accounts
applies a one year holding period and at least a five year
historical observation period to measure interest rate vola-
tility. The Bank calculates monthly declines in economic
value corresponding to a 99% confidence interval for inter-
est rate volatility. The measurements cover, in principle,
all financial assets and liabilities, but the measurement
process itself does not take into account inter-grid factors
and correlations with other assets.
Interest Rate Risk Volume Computed with the Internal Model
in Core Business Accounts (Excluding Trading Accounts) (Billions of Yen)
Classification As of March 31, 2017 As of March 31, 2016
Interest rate risk 2,299 1,811
Yen interest rate risk 132 234
U.S. dollar interest rate risk 1,714 1,246
Euro interest rate risk 437 311
Interest rate risk in other currencies 14 18
Notes: 1. Interest rate risk, without taking into account inter-grid factors and correlations with other assets, calculates a one-year holding period and a historical observation period from 1995 to the most recent year of interest rate volatility. The Bank calculated declines in economic value corresponding to a 99% confidence interval for interest rate volatility. Because the interest rate risk of consolidated subsidiaries is limited from the standpoint of the asset value of subsidiaries, the non-consolidated risk of the Bank is calculated.
2. Regarding core deposits, since the balances of deposits, etc., without maturity dates are limited, the Bank does not currently measure their risk volume. In addition, regarding repayments of mortgage-backed securities and callable securities before maturity, risk volume is measured after taking account of negative convexity due to call conditions and other factors.
Interest Rate Risk (Consolidated)
(The increase or decrease of the profit and loss or in the economic value from interest rate shocks which are used for internal management purpose, in terms of interest rate risk excluding trading accounts.)
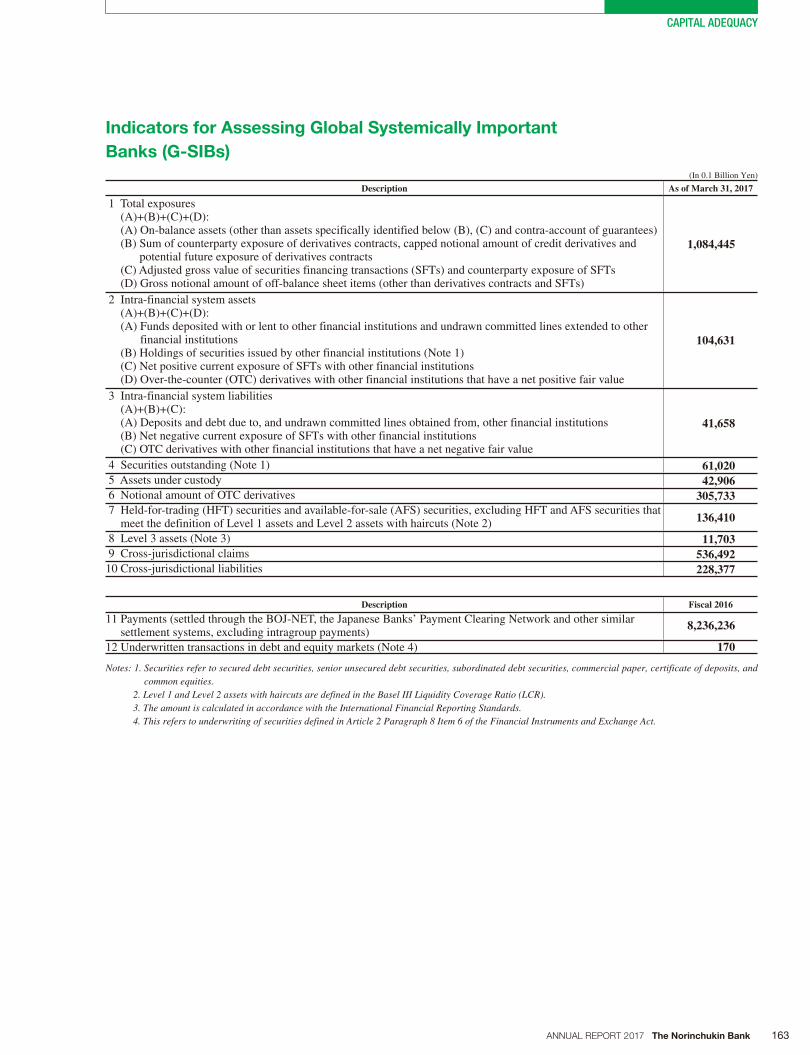
163ANNUAL REPORT 2017 The Norinchukin Bank
CAPITAL ADEQUACY
Indicators for Assessing Global Systemically Important
Banks (G-SIBs)
(In 0.1 Billion Yen)
Description As of March 31, 2017
1 Total exposures (A)+(B)+(C)+(D): (A) On-balance assets (other than assets specifically identified below (B), (C) and contra-account of guarantees) (B) Sum of counterparty exposure of derivatives contracts, capped notional amount of credit derivatives and
potential future exposure of derivatives contracts (C) Adjusted gross value of securities financing transactions (SFTs) and counterparty exposure of SFTs (D) Gross notional amount of off-balance sheet items (other than derivatives contracts and SFTs)
1,084,445
2 Intra-financial system assets (A)+(B)+(C)+(D): (A) Funds deposited with or lent to other financial institutions and undrawn committed lines extended to other
financial institutions (B) Holdings of securities issued by other financial institutions (Note 1) (C) Net positive current exposure of SFTs with other financial institutions (D) Over-the-counter (OTC) derivatives with other financial institutions that have a net positive fair value
104,631
3 Intra-financial system liabilities (A)+(B)+(C): (A) Deposits and debt due to, and undrawn committed lines obtained from, other financial institutions (B) Net negative current exposure of SFTs with other financial institutions (C) OTC derivatives with other financial institutions that have a net negative fair value
41,658
4 Securities outstanding (Note 1) 61,020 5 Assets under custody 42,906 6 Notional amount of OTC derivatives 305,733 7 Held-for-trading (HFT) securities and available-for-sale (AFS) securities, excluding HFT and AFS securities that
meet the definition of Level 1 assets and Level 2 assets with haircuts (Note 2) 136,410
8 Level 3 assets (Note 3) 11,703 9 Cross-jurisdictional claims 536,49210 Cross-jurisdictional liabilities 228,377
Description Fiscal 2016
11 Payments (settled through the BOJ-NET, the Japanese Banks’ Payment Clearing Network and other similar settlement systems, excluding intragroup payments)
8,236,236
12 Underwritten transactions in debt and equity markets (Note 4) 170
Notes: 1. Securities refer to secured debt securities, senior unsecured debt securities, subordinated debt securities, commercial paper, certificate of deposits, and common equities.
2. Level 1 and Level 2 assets with haircuts are defined in the Basel III Liquidity Coverage Ratio (LCR).3. The amount is calculated in accordance with the International Financial Reporting Standards.4. This refers to underwriting of securities defined in Article 2 Paragraph 8 Item 6 of the Financial Instruments and Exchange Act.
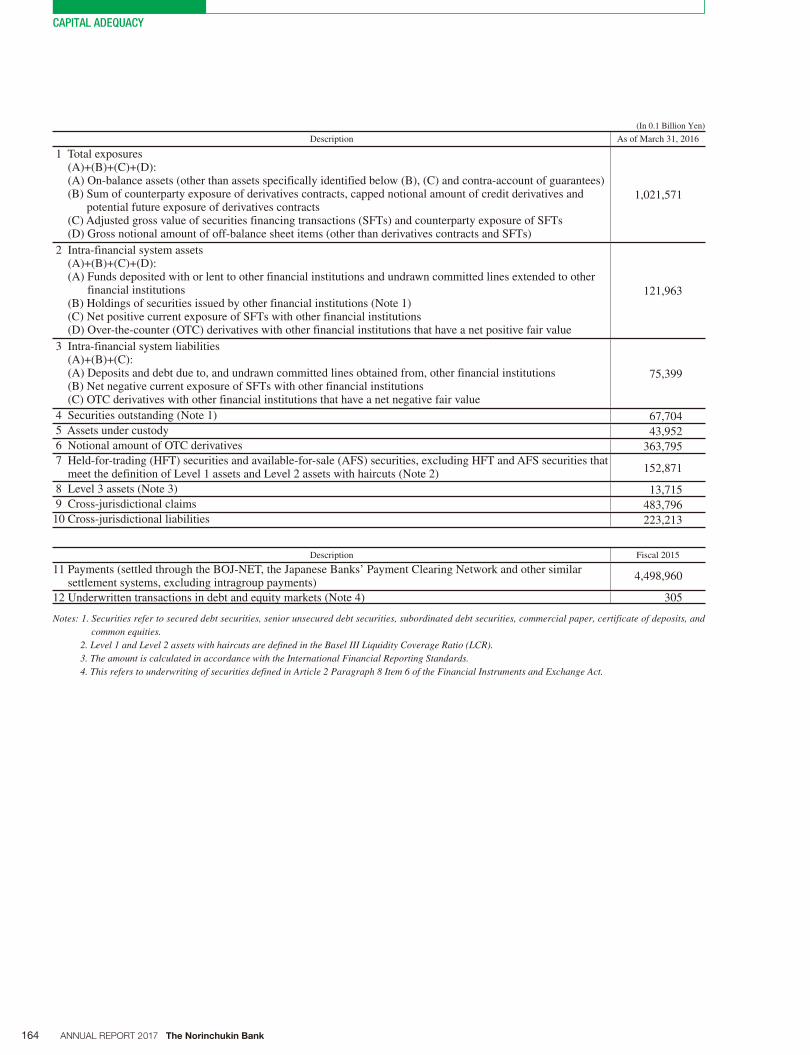
164 ANNUAL REPORT 2017 The Norinchukin Bank
CAPITAL ADEQUACY
(In 0.1 Billion Yen)
Description As of March 31, 2016
1 Total exposures (A)+(B)+(C)+(D): (A) On-balance assets (other than assets specifically identified below (B), (C) and contra-account of guarantees) (B) Sum of counterparty exposure of derivatives contracts, capped notional amount of credit derivatives and
potential future exposure of derivatives contracts (C) Adjusted gross value of securities financing transactions (SFTs) and counterparty exposure of SFTs (D) Gross notional amount of off-balance sheet items (other than derivatives contracts and SFTs)
1,021,571
2 Intra-financial system assets (A)+(B)+(C)+(D): (A) Funds deposited with or lent to other financial institutions and undrawn committed lines extended to other
financial institutions (B) Holdings of securities issued by other financial institutions (Note 1) (C) Net positive current exposure of SFTs with other financial institutions (D) Over-the-counter (OTC) derivatives with other financial institutions that have a net positive fair value
121,963
3 Intra-financial system liabilities (A)+(B)+(C): (A) Deposits and debt due to, and undrawn committed lines obtained from, other financial institutions (B) Net negative current exposure of SFTs with other financial institutions (C) OTC derivatives with other financial institutions that have a net negative fair value
75,399
4 Securities outstanding (Note 1) 67,704 5 Assets under custody 43,952 6 Notional amount of OTC derivatives 363,795 7 Held-for-trading (HFT) securities and available-for-sale (AFS) securities, excluding HFT and AFS securities that
meet the definition of Level 1 assets and Level 2 assets with haircuts (Note 2) 152,871
8 Level 3 assets (Note 3) 13,715 9 Cross-jurisdictional claims 483,79610 Cross-jurisdictional liabilities 223,213
Description Fiscal 2015
11 Payments (settled through the BOJ-NET, the Japanese Banks’ Payment Clearing Network and other similar settlement systems, excluding intragroup payments)
4,498,960
12 Underwritten transactions in debt and equity markets (Note 4) 305
Notes: 1. Securities refer to secured debt securities, senior unsecured debt securities, subordinated debt securities, commercial paper, certificate of deposits, and common equities.
2. Level 1 and Level 2 assets with haircuts are defined in the Basel III Liquidity Coverage Ratio (LCR).3. The amount is calculated in accordance with the International Financial Reporting Standards.4. This refers to underwriting of securities defined in Article 2 Paragraph 8 Item 6 of the Financial Instruments and Exchange Act.
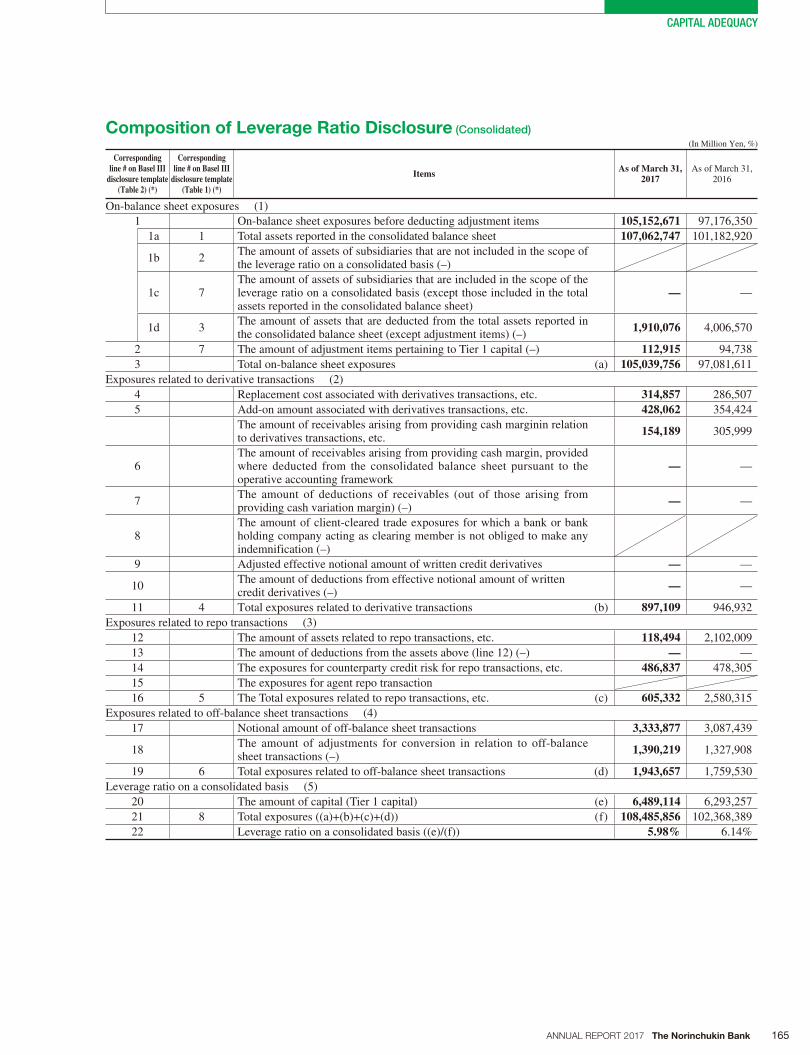
165ANNUAL REPORT 2017 The Norinchukin Bank
CAPITAL ADEQUACY
(In Million Yen, %)
Corresponding line # on Basel III
disclosure template (Table 2) (*)
Corresponding line # on Basel III
disclosure template (Table 1) (*)
Items As of March 31, 2017
As of March 31, 2016
On-balance sheet exposures (1)
1 On-balance sheet exposures before deducting adjustment items 105,152,671 97,176,350
1a 1 Total assets reported in the consolidated balance sheet 107,062,747 101,182,920
1b 2The amount of assets of subsidiaries that are not included in the scope of the leverage ratio on a consolidated basis (–)
1c 7The amount of assets of subsidiaries that are included in the scope of the leverage ratio on a consolidated basis (except those included in the total assets reported in the consolidated balance sheet)
— —
1d 3The amount of assets that are deducted from the total assets reported in the consolidated balance sheet (except adjustment items) (–)
1,910,076 4,006,570
2 7 The amount of adjustment items pertaining to Tier 1 capital (–) 112,915 94,738
3 Total on-balance sheet exposures (a) 105,039,756 97,081,611
Exposures related to derivative transactions (2)
4 Replacement cost associated with derivatives transactions, etc. 314,857 286,507
5 Add-on amount associated with derivatives transactions, etc. 428,062 354,424
The amount of receivables arising from providing cash marginin relation to derivatives transactions, etc.
154,189 305,999
6The amount of receivables arising from providing cash margin, provided where deducted from the consolidated balance sheet pursuant to the operative accounting framework
— —
7The amount of deductions of receivables (out of those arising from providing cash variation margin) (–)
— —
8The amount of client-cleared trade exposures for which a bank or bank holding company acting as clearing member is not obliged to make any indemnification (–)
9 Adjusted effective notional amount of written credit derivatives — —
10The amount of deductions from effective notional amount of writtencredit derivatives (–)
— —
11 4 Total exposures related to derivative transactions (b) 897,109 946,932
Exposures related to repo transactions (3)
12 The amount of assets related to repo transactions, etc. 118,494 2,102,009
13 The amount of deductions from the assets above (line 12) (–) — —
14 The exposures for counterparty credit risk for repo transactions, etc. 486,837 478,305
15 The exposures for agent repo transaction
16 5 The Total exposures related to repo transactions, etc. (c) 605,332 2,580,315
Exposures related to off-balance sheet transactions (4)
17 Notional amount of off-balance sheet transactions 3,333,877 3,087,439
18The amount of adjustments for conversion in relation to off-balance sheet transactions (–)
1,390,219 1,327,908
19 6 Total exposures related to off-balance sheet transactions (d) 1,943,657 1,759,530
Leverage ratio on a consolidated basis (5)
20 The amount of capital (Tier 1 capital) (e) 6,489,114 6,293,257
21 8 Total exposures ((a)+(b)+(c)+(d)) (f) 108,485,856 102,368,389
22 Leverage ratio on a consolidated basis ((e)/(f)) 5.98% 6.14%
Composition of Leverage Ratio Disclosure (Consolidated)
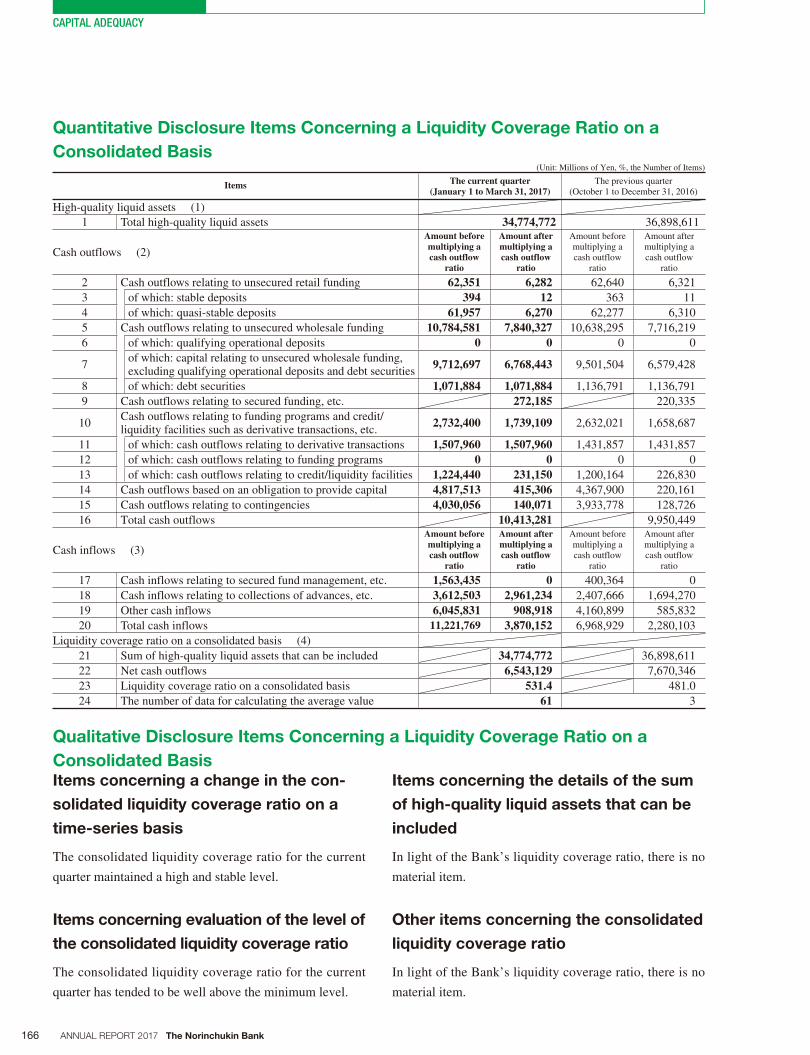
166 ANNUAL REPORT 2017 The Norinchukin Bank
CAPITAL ADEQUACY
(Unit: Millions of Yen, %, the Number of Items)
Items The current quarter (January 1 to March 31, 2017)
The previous quarter (October 1 to December 31, 2016)
High-quality liquid assets (1)
1 Total high-quality liquid assets 34,774,772 36,898,611
Cash outflows (2)
Amount before multiplying a cash outflow
ratio
Amount after multiplying a cash outflow
ratio
Amount before multiplying a cash outflow
ratio
Amount after multiplying a cash outflow
ratio
2 Cash outflows relating to unsecured retail funding 62,351 6,282 62,640 6,321
3 of which: stable deposits 394 12 363 11
4 of which: quasi-stable deposits 61,957 6,270 62,277 6,310
5 Cash outflows relating to unsecured wholesale funding 10,784,581 7,840,327 10,638,295 7,716,219
6 of which: qualifying operational deposits 0 0 0 0
7of which: capital relating to unsecured wholesale funding, excluding qualifying operational deposits and debt securities
9,712,697 6,768,443 9,501,504 6,579,428
8 of which: debt securities 1,071,884 1,071,884 1,136,791 1,136,791
9 Cash outflows relating to secured funding, etc. 272,185 220,335
10Cash outflows relating to funding programs and credit/liquidity facilities such as derivative transactions, etc.
2,732,400 1,739,109 2,632,021 1,658,687
11 of which: cash outflows relating to derivative transactions 1,507,960 1,507,960 1,431,857 1,431,857
12 of which: cash outflows relating to funding programs 0 0 0 0
13 of which: cash outflows relating to credit/liquidity facilities 1,224,440 231,150 1,200,164 226,830
14 Cash outflows based on an obligation to provide capital 4,817,513 415,306 4,367,900 220,161
15 Cash outflows relating to contingencies 4,030,056 140,071 3,933,778 128,726
16 Total cash outflows 10,413,281 9,950,449
Cash inflows (3)
Amount before multiplying a cash outflow
ratio
Amount after multiplying a cash outflow
ratio
Amount before multiplying a cash outflow
ratio
Amount after multiplying a cash outflow
ratio
17 Cash inflows relating to secured fund management, etc. 1,563,435 0 400,364 0
18 Cash inflows relating to collections of advances, etc. 3,612,503 2,961,234 2,407,666 1,694,270
19 Other cash inflows 6,045,831 908,918 4,160,899 585,832
20 Total cash inflows 11,221,769 3,870,152 6,968,929 2,280,103
Liquidity coverage ratio on a consolidated basis (4)
21 Sum of high-quality liquid assets that can be included 34,774,772 36,898,611
22 Net cash outflows 6,543,129 7,670,346
23 Liquidity coverage ratio on a consolidated basis 531.4 481.0
24 The number of data for calculating the average value 61 3
Quantitative Disclosure Items Concerning a Liquidity Coverage Ratio on a
Consolidated Basis
Items concerning a change in the con-
solidated liquidity coverage ratio on a
time-series basis
The consolidated liquidity coverage ratio for the current
quarter maintained a high and stable level.
Items concerning evaluation of the level of
the consolidated liquidity coverage ratio
The consolidated liquidity coverage ratio for the current
quarter has tended to be well above the minimum level.
Qualitative Disclosure Items Concerning a Liquidity Coverage Ratio on a
Consolidated BasisItems concerning the details of the sum
of high-quality liquid assets that can be
included
In light of the Bank’s liquidity coverage ratio, there is no
material item.
Other items concerning the consolidated
liquidity coverage ratio
In light of the Bank’s liquidity coverage ratio, there is no
material item.
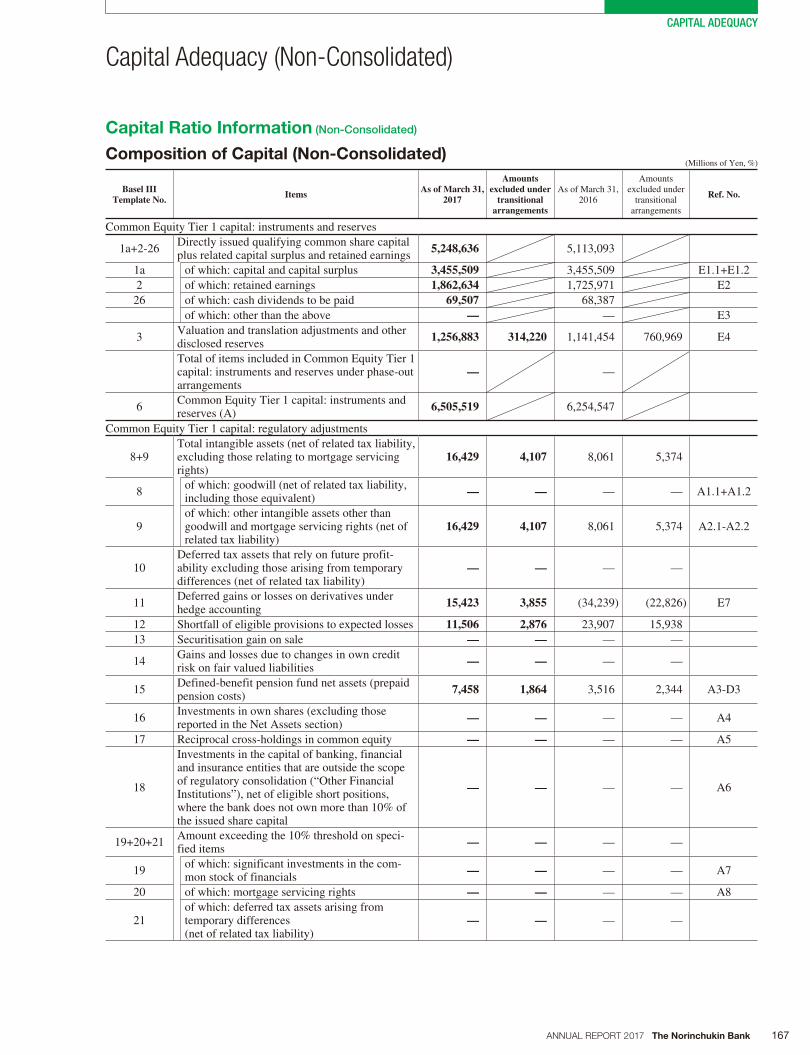
167ANNUAL REPORT 2017 The Norinchukin Bank
CAPITAL ADEQUACY
(Millions of Yen, %)
Basel III Template No. Items As of March 31,
2017
Amounts excluded under
transitional arrangements
As of March 31, 2016
Amounts excluded under
transitional arrangements
Ref. No.
Common Equity Tier 1 capital: instruments and reserves
1a+2-26Directly issued qualifying common share capital plus related capital surplus and retained earnings
5,248,636 5,113,093
1a of which: capital and capital surplus 3,455,509 3,455,509 E1.1+E1.2
2 of which: retained earnings 1,862,634 1,725,971 E2
26 of which: cash dividends to be paid 69,507 68,387
of which: other than the above — — E3
3Valuation and translation adjustments and other disclosed reserves
1,256,883 314,220 1,141,454 760,969 E4
Total of items included in Common Equity Tier 1 capital: instruments and reserves under phase-out arrangements
— —
6Common Equity Tier 1 capital: instruments and reserves (A)
6,505,519 6,254,547
Common Equity Tier 1 capital: regulatory adjustments
8+9Total intangible assets (net of related tax liability, excluding those relating to mortgage servicing rights)
16,429 4,107 8,061 5,374
8of which: goodwill (net of related tax liability, including those equivalent)
— — — — A1.1+A1.2
9of which: other intangible assets other than goodwill and mortgage servicing rights (net of related tax liability)
16,429 4,107 8,061 5,374 A2.1-A2.2
10Deferred tax assets that rely on future profit-ability excluding those arising from temporary differences (net of related tax liability)
— — — —
11Deferred gains or losses on derivatives under hedge accounting
15,423 3,855 (34,239) (22,826) E7
12 Shortfall of eligible provisions to expected losses 11,506 2,876 23,907 15,938
13 Securitisation gain on sale — — — —
14Gains and losses due to changes in own credit risk on fair valued liabilities
— — — —
15Defined-benefit pension fund net assets (prepaid pension costs)
7,458 1,864 3,516 2,344 A3-D3
16Investments in own shares (excluding those reported in the Net Assets section)
— — — — A4
17 Reciprocal cross-holdings in common equity — — — — A5
18
Investments in the capital of banking, financial and insurance entities that are outside the scope of regulatory consolidation (“Other Financial Institutions”), net of eligible short positions, where the bank does not own more than 10% of the issued share capital
— — — — A6
19+20+21Amount exceeding the 10% threshold on speci-fied items
— — — —
19of which: significant investments in the com-mon stock of financials
— — — — A7
20 of which: mortgage servicing rights — — — — A8
21of which: deferred tax assets arising from temporary differences (net of related tax liability)
— — — —
Capital Ratio Information (Non-Consolidated)
Composition of Capital (Non-Consolidated)
Capital Adequacy (Non-Consolidated)
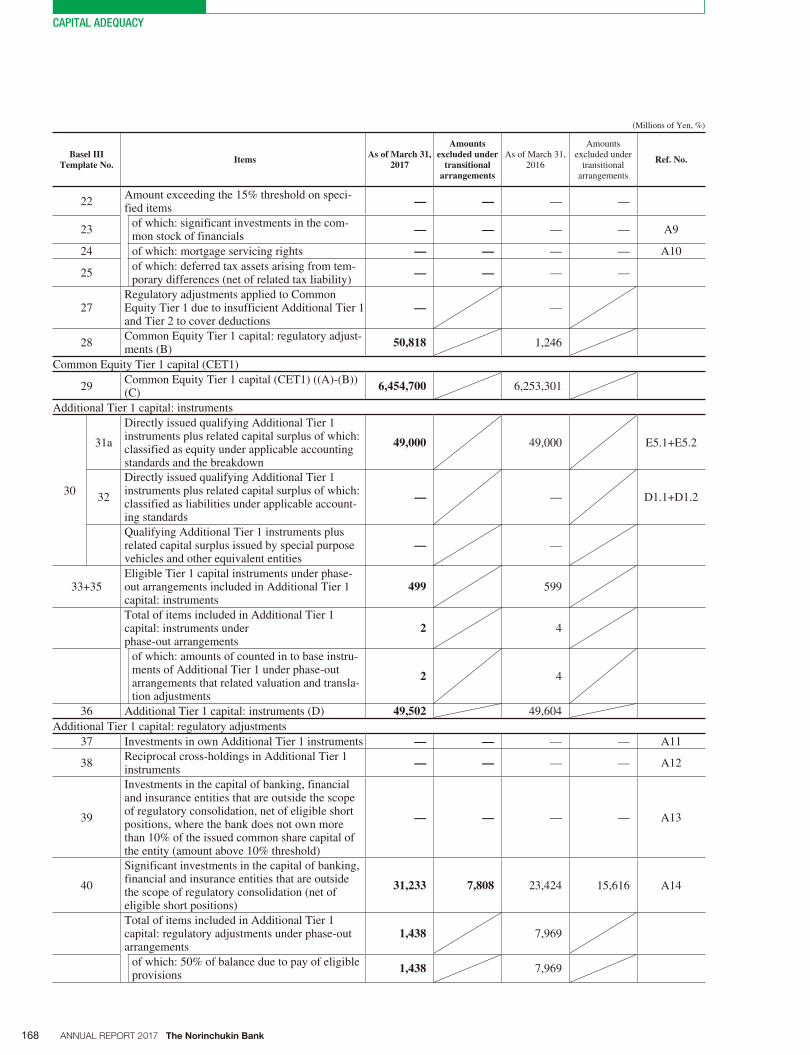
168 ANNUAL REPORT 2017 The Norinchukin Bank
CAPITAL ADEQUACY
(Millions of Yen, %)
Basel III Template No. Items As of March 31,
2017
Amounts excluded under
transitional arrangements
As of March 31, 2016
Amounts excluded under
transitional arrangements
Ref. No.
22Amount exceeding the 15% threshold on speci-fied items
— — — —
23of which: significant investments in the com-mon stock of financials
— — — — A9
24 of which: mortgage servicing rights — — — — A10
25of which: deferred tax assets arising from tem-porary differences (net of related tax liability)
— — — —
27Regulatory adjustments applied to Common Equity Tier 1 due to insufficient Additional Tier 1 and Tier 2 to cover deductions
— —
28Common Equity Tier 1 capital: regulatory adjust-ments (B)
50,818 1,246
Common Equity Tier 1 capital (CET1)
29Common Equity Tier 1 capital (CET1) ((A)-(B)) (C)
6,454,700 6,253,301
Additional Tier 1 capital: instruments
30
31a
Directly issued qualifying Additional Tier 1 instruments plus related capital surplus of which: classified as equity under applicable accounting standards and the breakdown
49,000 49,000 E5.1+E5.2
32
Directly issued qualifying Additional Tier 1 instruments plus related capital surplus of which: classified as liabilities under applicable account-ing standards
— — D1.1+D1.2
Qualifying Additional Tier 1 instruments plus related capital surplus issued by special purpose vehicles and other equivalent entities
— —
33+35Eligible Tier 1 capital instruments under phase-out arrangements included in Additional Tier 1 capital: instruments
499 599
Total of items included in Additional Tier 1 capital: instruments under phase-out arrangements
2 4
of which: amounts of counted in to base instru-ments of Additional Tier 1 under phase-out arrangements that related valuation and transla-tion adjustments
2 4
36 Additional Tier 1 capital: instruments (D) 49,502 49,604
Additional Tier 1 capital: regulatory adjustments
37 Investments in own Additional Tier 1 instruments — — — — A11
38Reciprocal cross-holdings in Additional Tier 1 instruments
— — — — A12
39
Investments in the capital of banking, financial and insurance entities that are outside the scope of regulatory consolidation, net of eligible short positions, where the bank does not own more than 10% of the issued common share capital of the entity (amount above 10% threshold)
— — — — A13
40
Significant investments in the capital of banking, financial and insurance entities that are outside the scope of regulatory consolidation (net of eligible short positions)
31,233 7,808 23,424 15,616 A14
Total of items included in Additional Tier 1 capital: regulatory adjustments under phase-out arrangements
1,438 7,969
of which: 50% of balance due to pay of eligible provisions
1,438 7,969
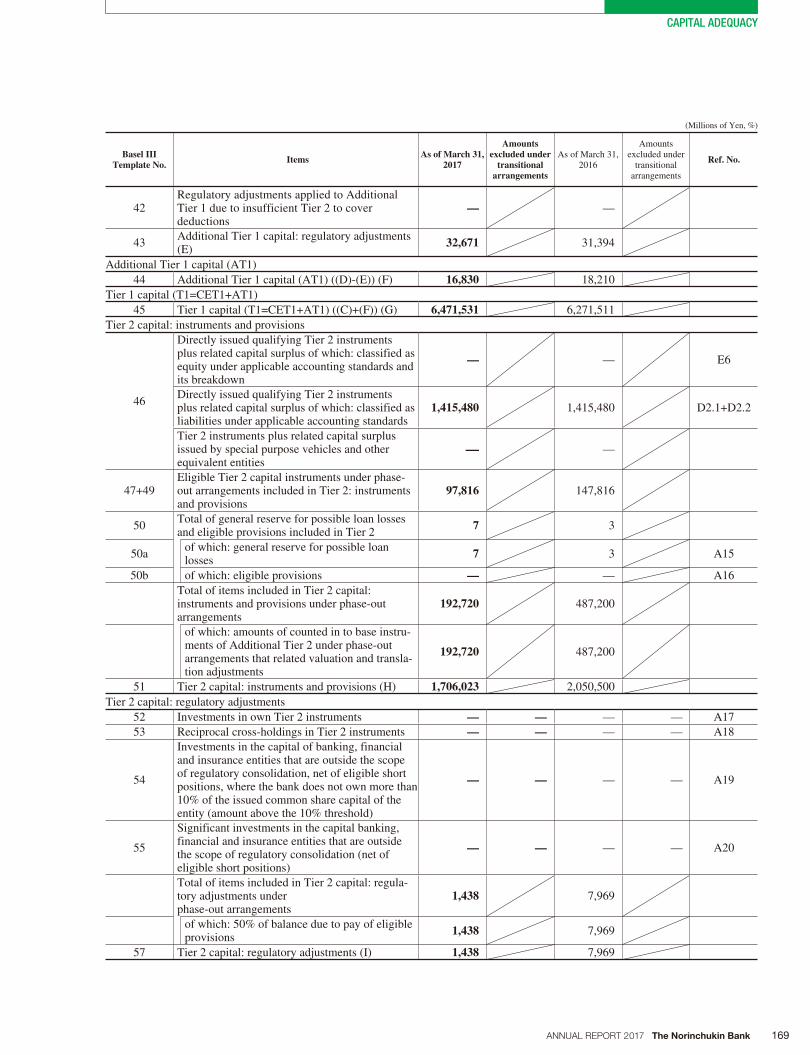
169ANNUAL REPORT 2017 The Norinchukin Bank
CAPITAL ADEQUACY
(Millions of Yen, %)
Basel III Template No. Items As of March 31,
2017
Amounts excluded under
transitional arrangements
As of March 31, 2016
Amounts excluded under
transitional arrangements
Ref. No.
42Regulatory adjustments applied to Additional Tier 1 due to insufficient Tier 2 to cover deductions
— —
43Additional Tier 1 capital: regulatory adjustments (E)
32,671 31,394
Additional Tier 1 capital (AT1)
44 Additional Tier 1 capital (AT1) ((D)-(E)) (F) 16,830 18,210
Tier 1 capital (T1=CET1+AT1)
45 Tier 1 capital (T1=CET1+AT1) ((C)+(F)) (G) 6,471,531 6,271,511
Tier 2 capital: instruments and provisions
46
Directly issued qualifying Tier 2 instruments plus related capital surplus of which: classified as equity under applicable accounting standards and its breakdown
— — E6
Directly issued qualifying Tier 2 instruments plus related capital surplus of which: classified as liabilities under applicable accounting standards
1,415,480 1,415,480 D2.1+D2.2
Tier 2 instruments plus related capital surplus issued by special purpose vehicles and other equivalent entities
— —
47+49Eligible Tier 2 capital instruments under phase-out arrangements included in Tier 2: instruments and provisions
97,816 147,816
50Total of general reserve for possible loan losses and eligible provisions included in Tier 2
7 3
50aof which: general reserve for possible loan losses
7 3 A15
50b of which: eligible provisions — — A16
Total of items included in Tier 2 capital: instruments and provisions under phase-out arrangements
192,720 487,200
of which: amounts of counted in to base instru-ments of Additional Tier 2 under phase-out arrangements that related valuation and transla-tion adjustments
192,720 487,200
51 Tier 2 capital: instruments and provisions (H) 1,706,023 2,050,500
Tier 2 capital: regulatory adjustments
52 Investments in own Tier 2 instruments — — — — A17
53 Reciprocal cross-holdings in Tier 2 instruments — — — — A18
54
Investments in the capital of banking, financial and insurance entities that are outside the scope of regulatory consolidation, net of eligible short positions, where the bank does not own more than 10% of the issued common share capital of the entity (amount above the 10% threshold)
— — — — A19
55
Significant investments in the capital banking, financial and insurance entities that are outside the scope of regulatory consolidation (net of eligible short positions)
— — — — A20
Total of items included in Tier 2 capital: regula-tory adjustments under phase-out arrangements
1,438 7,969
of which: 50% of balance due to pay of eligible provisions
1,438 7,969
57 Tier 2 capital: regulatory adjustments (I) 1,438 7,969
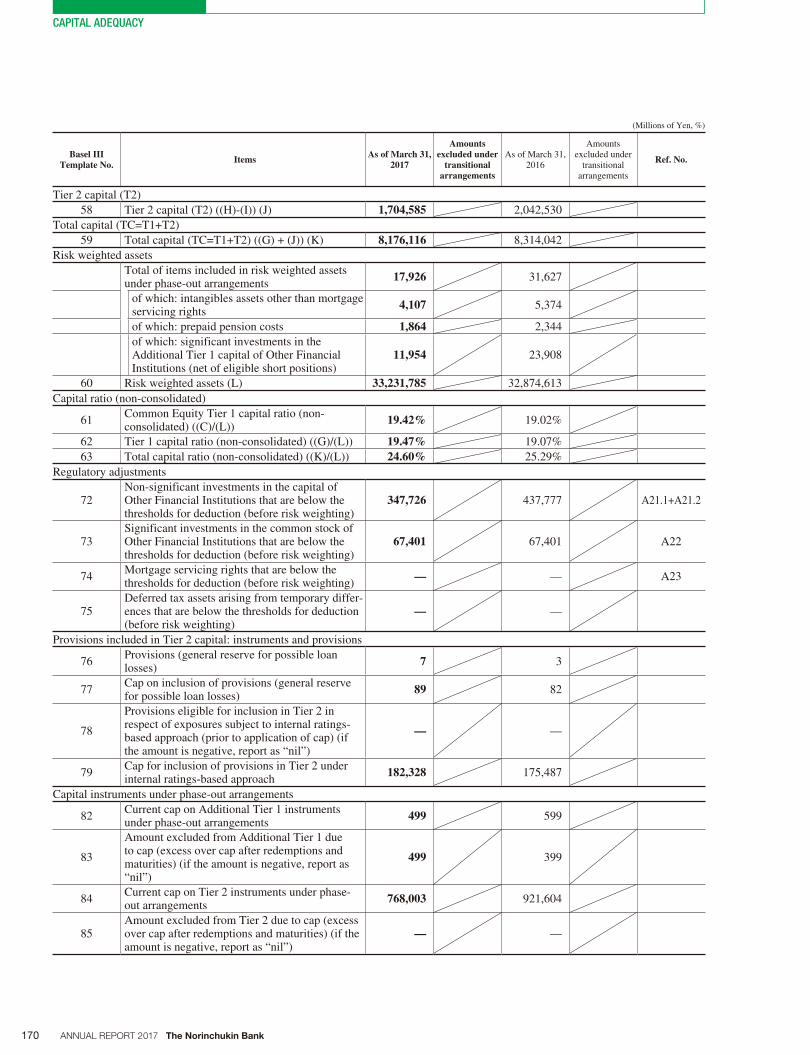
170 ANNUAL REPORT 2017 The Norinchukin Bank
CAPITAL ADEQUACY
(Millions of Yen, %)
Basel III Template No. Items As of March 31,
2017
Amounts excluded under
transitional arrangements
As of March 31, 2016
Amounts excluded under
transitional arrangements
Ref. No.
Tier 2 capital (T2)
58 Tier 2 capital (T2) ((H)-(I)) (J) 1,704,585 2,042,530
Total capital (TC=T1+T2)
59 Total capital (TC=T1+T2) ((G) + (J)) (K) 8,176,116 8,314,042
Risk weighted assets
Total of items included in risk weighted assets under phase-out arrangements
17,926 31,627
of which: intangibles assets other than mortgage servicing rights
4,107 5,374
of which: prepaid pension costs 1,864 2,344
of which: significant investments in the Additional Tier 1 capital of Other Financial Institutions (net of eligible short positions)
11,954 23,908
60 Risk weighted assets (L) 33,231,785 32,874,613
Capital ratio (non-consolidated)
61Common Equity Tier 1 capital ratio (non-consolidated) ((C)/(L))
19.42% 19.02%
62 Tier 1 capital ratio (non-consolidated) ((G)/(L)) 19.47% 19.07%
63 Total capital ratio (non-consolidated) ((K)/(L)) 24.60% 25.29%
Regulatory adjustments
72Non-significant investments in the capital of Other Financial Institutions that are below the thresholds for deduction (before risk weighting)
347,726 437,777 A21.1+A21.2
73Significant investments in the common stock of Other Financial Institutions that are below the thresholds for deduction (before risk weighting)
67,401 67,401 A22
74Mortgage servicing rights that are below the thresholds for deduction (before risk weighting)
— — A23
75Deferred tax assets arising from temporary differ-ences that are below the thresholds for deduction (before risk weighting)
— —
Provisions included in Tier 2 capital: instruments and provisions
76Provisions (general reserve for possible loan losses)
7 3
77Cap on inclusion of provisions (general reserve for possible loan losses)
89 82
78
Provisions eligible for inclusion in Tier 2 in respect of exposures subject to internal ratings-based approach (prior to application of cap) (if the amount is negative, report as “nil”)
— —
79Cap for inclusion of provisions in Tier 2 under internal ratings-based approach
182,328 175,487
Capital instruments under phase-out arrangements
82Current cap on Additional Tier 1 instruments under phase-out arrangements
499 599
83
Amount excluded from Additional Tier 1 due to cap (excess over cap after redemptions and maturities) (if the amount is negative, report as “nil”)
499 399
84Current cap on Tier 2 instruments under phase-out arrangements
768,003 921,604
85Amount excluded from Tier 2 due to cap (excess over cap after redemptions and maturities) (if the amount is negative, report as “nil”)
— —
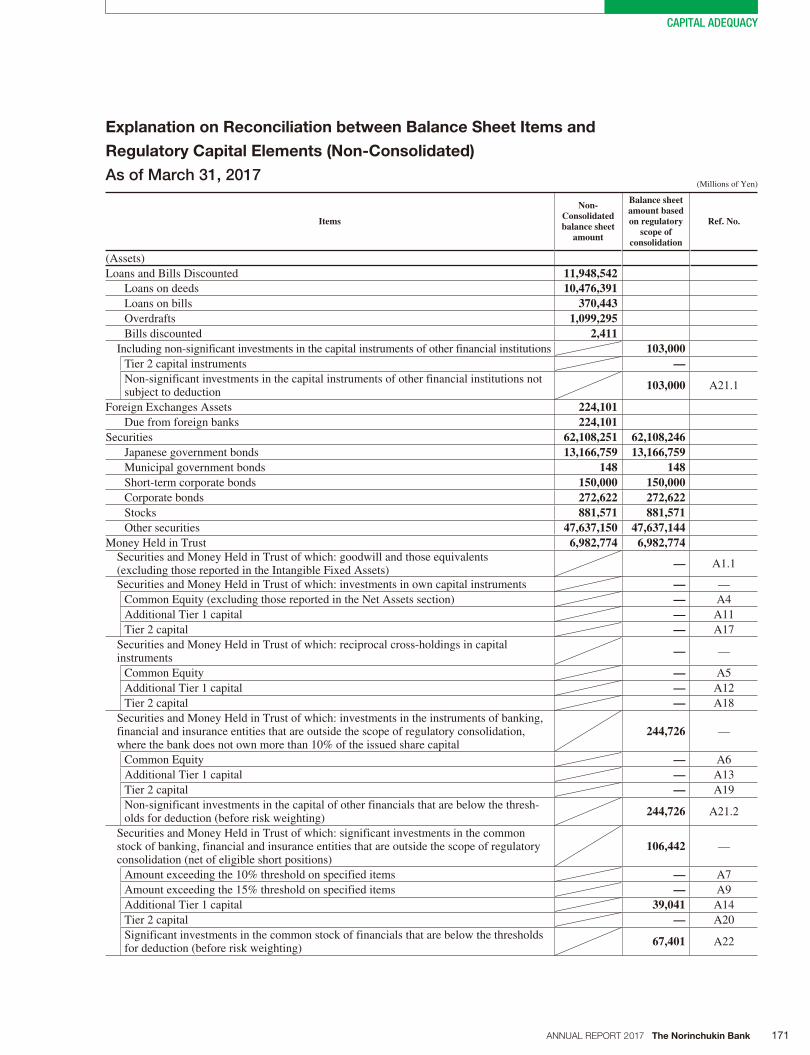
171ANNUAL REPORT 2017 The Norinchukin Bank
CAPITAL ADEQUACY
Explanation on Reconciliation between Balance Sheet Items and
Regulatory Capital Elements (Non-Consolidated)
As of March 31, 2017 (Millions of Yen)
Items
Non-Consolidated balance sheet
amount
Balance sheet amount based on regulatory
scope of consolidation
Ref. No.
(Assets)
Loans and Bills Discounted 11,948,542Loans on deeds 10,476,391Loans on bills 370,443Overdrafts 1,099,295Bills discounted 2,411
Including non-significant investments in the capital instruments of other financial institutions 103,000Tier 2 capital instruments — Non-significant investments in the capital instruments of other financial institutions not subject to deduction
103,000 A21.1
Foreign Exchanges Assets 224,101Due from foreign banks 224,101
Securities 62,108,251 62,108,246Japanese government bonds 13,166,759 13,166,759Municipal government bonds 148 148Short-term corporate bonds 150,000 150,000Corporate bonds 272,622 272,622Stocks 881,571 881,571Other securities 47,637,150 47,637,144
Money Held in Trust 6,982,774 6,982,774Securities and Money Held in Trust of which: goodwill and those equivalents (excluding those reported in the Intangible Fixed Assets)
— A1.1
Securities and Money Held in Trust of which: investments in own capital instruments — —
Common Equity (excluding those reported in the Net Assets section) — A4
Additional Tier 1 capital — A11
Tier 2 capital — A17
Securities and Money Held in Trust of which: reciprocal cross-holdings in capital instruments
— —
Common Equity — A5
Additional Tier 1 capital — A12
Tier 2 capital — A18
Securities and Money Held in Trust of which: investments in the instruments of banking, financial and insurance entities that are outside the scope of regulatory consolidation, where the bank does not own more than 10% of the issued share capital
244,726 —
Common Equity — A6
Additional Tier 1 capital — A13
Tier 2 capital — A19
Non-significant investments in the capital of other financials that are below the thresh-olds for deduction (before risk weighting)
244,726 A21.2
Securities and Money Held in Trust of which: significant investments in the common stock of banking, financial and insurance entities that are outside the scope of regulatory consolidation (net of eligible short positions)
106,442 —
Amount exceeding the 10% threshold on specified items — A7
Amount exceeding the 15% threshold on specified items — A9
Additional Tier 1 capital 39,041 A14
Tier 2 capital — A20
Significant investments in the common stock of financials that are below the thresholds for deduction (before risk weighting)
67,401 A22
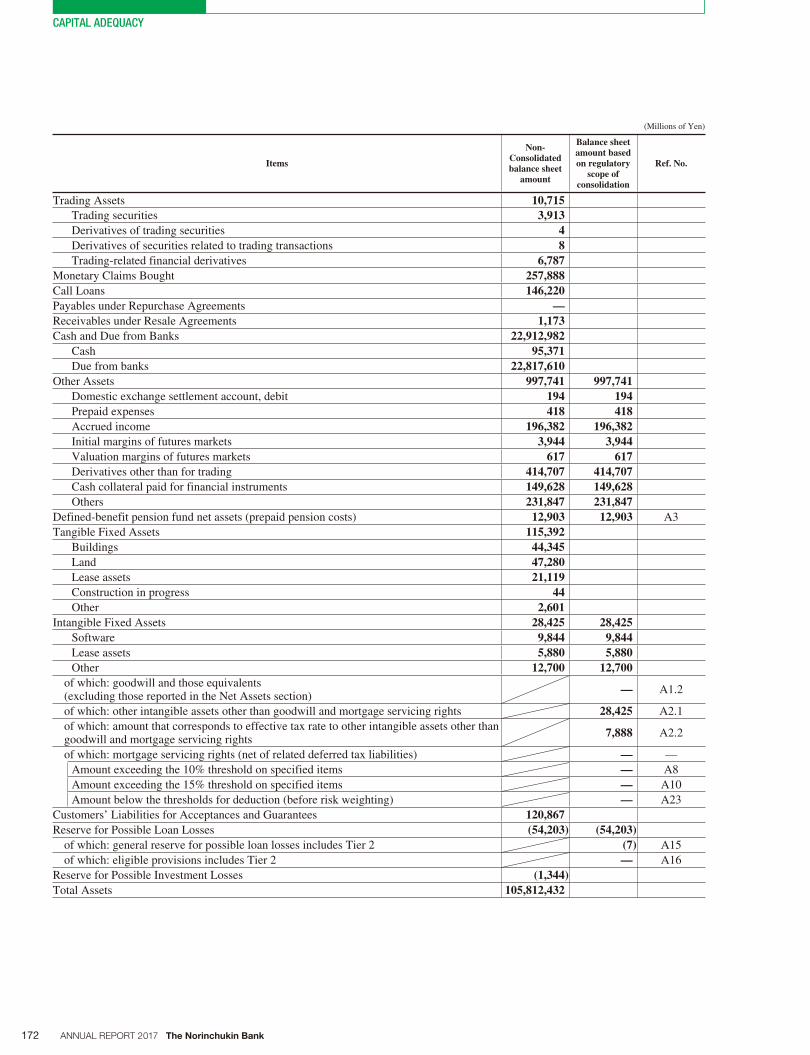
172 ANNUAL REPORT 2017 The Norinchukin Bank
CAPITAL ADEQUACY
(Millions of Yen)
Items
Non-Consolidated balance sheet
amount
Balance sheet amount based on regulatory
scope of consolidation
Ref. No.
Trading Assets 10,715Trading securities 3,913Derivatives of trading securities 4Derivatives of securities related to trading transactions 8Trading-related financial derivatives 6,787
Monetary Claims Bought 257,888Call Loans 146,220Payables under Repurchase Agreements — Receivables under Resale Agreements 1,173Cash and Due from Banks 22,912,982
Cash 95,371Due from banks 22,817,610
Other Assets 997,741 997,741Domestic exchange settlement account, debit 194 194Prepaid expenses 418 418Accrued income 196,382 196,382Initial margins of futures markets 3,944 3,944Valuation margins of futures markets 617 617Derivatives other than for trading 414,707 414,707Cash collateral paid for financial instruments 149,628 149,628Others 231,847 231,847
Defined-benefit pension fund net assets (prepaid pension costs) 12,903 12,903 A3
Tangible Fixed Assets 115,392Buildings 44,345Land 47,280Lease assets 21,119Construction in progress 44Other 2,601
Intangible Fixed Assets 28,425 28,425Software 9,844 9,844Lease assets 5,880 5,880Other 12,700 12,700
of which: goodwill and those equivalents (excluding those reported in the Net Assets section)
— A1.2
of which: other intangible assets other than goodwill and mortgage servicing rights 28,425 A2.1
of which: amount that corresponds to effective tax rate to other intangible assets other than goodwill and mortgage servicing rights
7,888 A2.2
of which: mortgage servicing rights (net of related deferred tax liabilities) — —
Amount exceeding the 10% threshold on specified items — A8
Amount exceeding the 15% threshold on specified items — A10
Amount below the thresholds for deduction (before risk weighting) — A23
Customers’ Liabilities for Acceptances and Guarantees 120,867Reserve for Possible Loan Losses (54,203) (54,203)
of which: general reserve for possible loan losses includes Tier 2 (7) A15
of which: eligible provisions includes Tier 2 — A16
Reserve for Possible Investment Losses (1,344)Total Assets 105,812,432
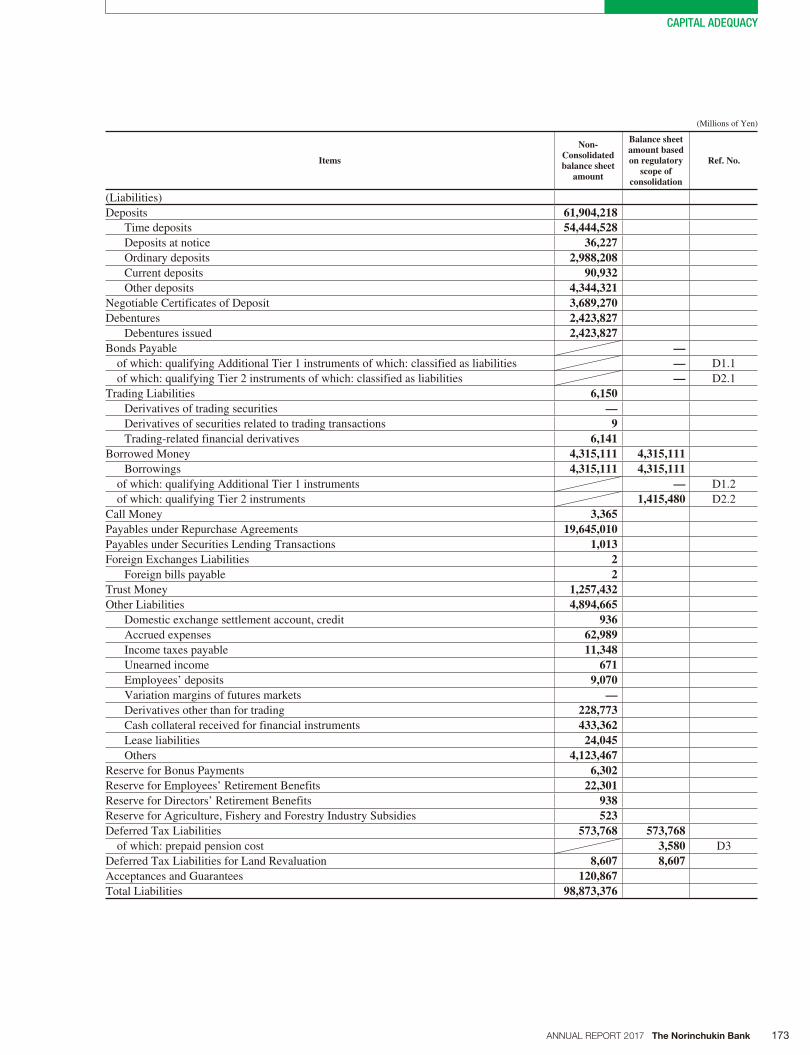
173ANNUAL REPORT 2017 The Norinchukin Bank
CAPITAL ADEQUACY
(Millions of Yen)
Items
Non-Consolidated balance sheet
amount
Balance sheet amount based on regulatory
scope of consolidation
Ref. No.
(Liabilities)
Deposits 61,904,218Time deposits 54,444,528Deposits at notice 36,227Ordinary deposits 2,988,208Current deposits 90,932Other deposits 4,344,321
Negotiable Certificates of Deposit 3,689,270Debentures 2,423,827
Debentures issued 2,423,827Bonds Payable —
of which: qualifying Additional Tier 1 instruments of which: classified as liabilities — D1.1
of which: qualifying Tier 2 instruments of which: classified as liabilities — D2.1
Trading Liabilities 6,150Derivatives of trading securities —Derivatives of securities related to trading transactions 9Trading-related financial derivatives 6,141
Borrowed Money 4,315,111 4,315,111Borrowings 4,315,111 4,315,111
of which: qualifying Additional Tier 1 instruments — D1.2
of which: qualifying Tier 2 instruments 1,415,480 D2.2
Call Money 3,365Payables under Repurchase Agreements 19,645,010Payables under Securities Lending Transactions 1,013Foreign Exchanges Liabilities 2
Foreign bills payable 2Trust Money 1,257,432Other Liabilities 4,894,665
Domestic exchange settlement account, credit 936Accrued expenses 62,989Income taxes payable 11,348Unearned income 671Employees’ deposits 9,070Variation margins of futures markets —Derivatives other than for trading 228,773Cash collateral received for financial instruments 433,362Lease liabilities 24,045Others 4,123,467
Reserve for Bonus Payments 6,302Reserve for Employees’ Retirement Benefits 22,301Reserve for Directors’ Retirement Benefits 938Reserve for Agriculture, Fishery and Forestry Industry Subsidies 523Deferred Tax Liabilities 573,768 573,768
of which: prepaid pension cost 3,580 D3
Deferred Tax Liabilities for Land Revaluation 8,607 8,607Acceptances and Guarantees 120,867Total Liabilities 98,873,376
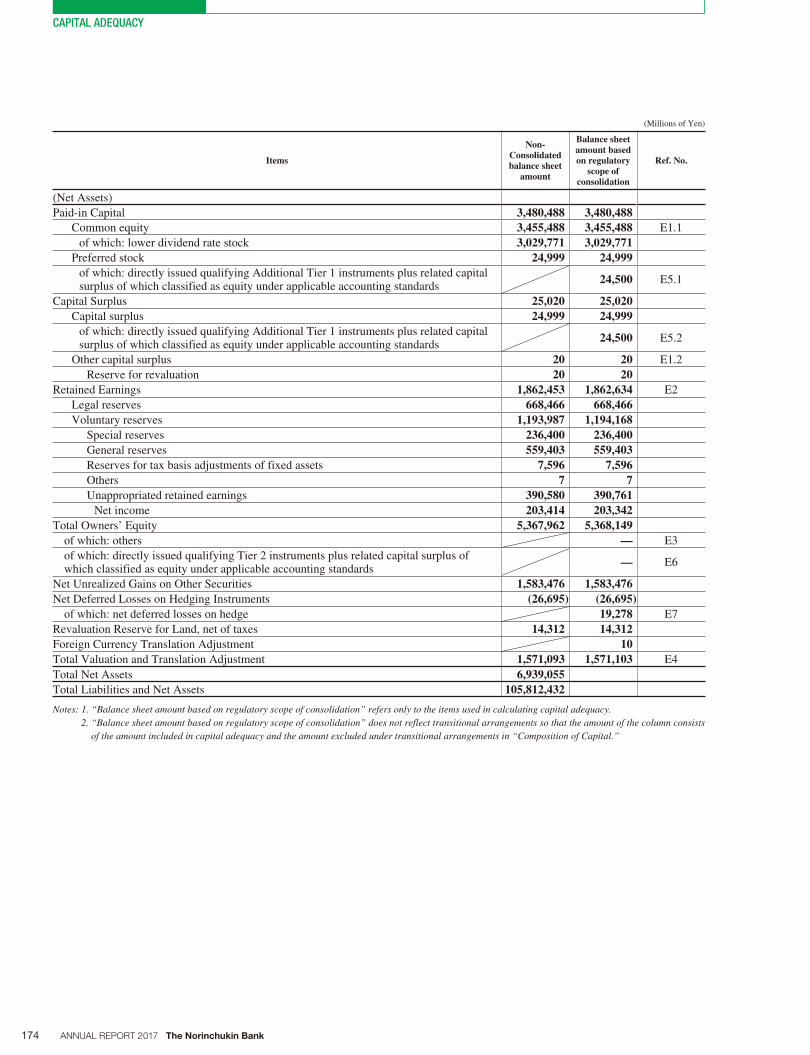
174 ANNUAL REPORT 2017 The Norinchukin Bank
CAPITAL ADEQUACY
(Millions of Yen)
Items
Non-Consolidated balance sheet
amount
Balance sheet amount based on regulatory
scope of consolidation
Ref. No.
(Net Assets)
Paid-in Capital 3,480,488 3,480,488Common equity 3,455,488 3,455,488 E1.1
of which: lower dividend rate stock 3,029,771 3,029,771Preferred stock 24,999 24,999
of which: directly issued qualifying Additional Tier 1 instruments plus related capital surplus of which classified as equity under applicable accounting standards
24,500 E5.1
Capital Surplus 25,020 25,020Capital surplus 24,999 24,999
of which: directly issued qualifying Additional Tier 1 instruments plus related capital surplus of which classified as equity under applicable accounting standards
24,500 E5.2
Other capital surplus 20 20 E1.2
Reserve for revaluation 20 20Retained Earnings 1,862,453 1,862,634 E2
Legal reserves 668,466 668,466Voluntary reserves 1,193,987 1,194,168
Special reserves 236,400 236,400General reserves 559,403 559,403Reserves for tax basis adjustments of fixed assets 7,596 7,596Others 7 7Unappropriated retained earnings 390,580 390,761
Net income 203,414 203,342Total Owners’ Equity 5,367,962 5,368,149
of which: others — E3
of which: directly issued qualifying Tier 2 instruments plus related capital surplus of which classified as equity under applicable accounting standards
— E6
Net Unrealized Gains on Other Securities 1,583,476 1,583,476Net Deferred Losses on Hedging Instruments (26,695) (26,695)
of which: net deferred losses on hedge 19,278 E7
Revaluation Reserve for Land, net of taxes 14,312 14,312Foreign Currency Translation Adjustment 10Total Valuation and Translation Adjustment 1,571,093 1,571,103 E4
Total Net Assets 6,939,055Total Liabilities and Net Assets 105,812,432
Notes: 1. “Balance sheet amount based on regulatory scope of consolidation” refers only to the items used in calculating capital adequacy. 2. “Balance sheet amount based on regulatory scope of consolidation” does not reflect transitional arrangements so that the amount of the column consists
of the amount included in capital adequacy and the amount excluded under transitional arrangements in “Composition of Capital.”
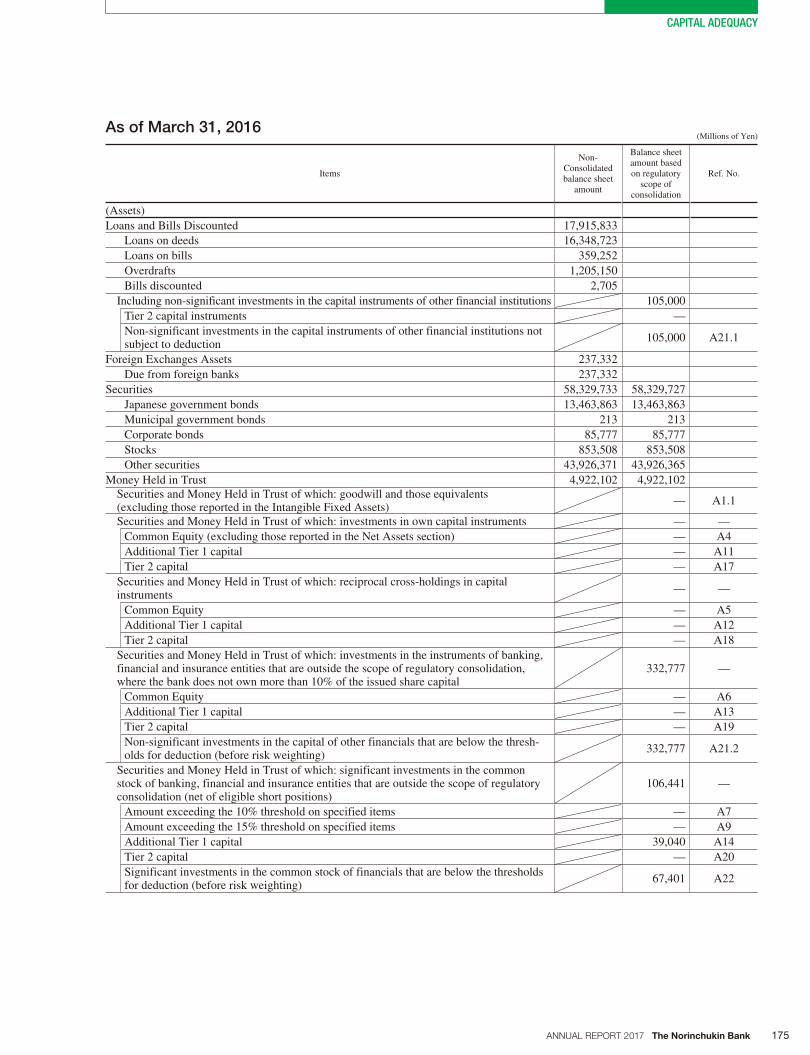
175ANNUAL REPORT 2017 The Norinchukin Bank
CAPITAL ADEQUACY
As of March 31, 2016 (Millions of Yen)
Items
Non-Consolidated balance sheet
amount
Balance sheet amount based on regulatory
scope of consolidation
Ref. No.
(Assets)
Loans and Bills Discounted 17,915,833
Loans on deeds 16,348,723
Loans on bills 359,252
Overdrafts 1,205,150
Bills discounted 2,705
Including non-significant investments in the capital instruments of other financial institutions 105,000
Tier 2 capital instruments —
Non-significant investments in the capital instruments of other financial institutions not subject to deduction
105,000 A21.1
Foreign Exchanges Assets 237,332
Due from foreign banks 237,332
Securities 58,329,733 58,329,727
Japanese government bonds 13,463,863 13,463,863
Municipal government bonds 213 213
Corporate bonds 85,777 85,777
Stocks 853,508 853,508
Other securities 43,926,371 43,926,365
Money Held in Trust 4,922,102 4,922,102Securities and Money Held in Trust of which: goodwill and those equivalents (excluding those reported in the Intangible Fixed Assets)
— A1.1
Securities and Money Held in Trust of which: investments in own capital instruments — —
Common Equity (excluding those reported in the Net Assets section) — A4
Additional Tier 1 capital — A11
Tier 2 capital — A17
Securities and Money Held in Trust of which: reciprocal cross-holdings in capital instruments
— —
Common Equity — A5
Additional Tier 1 capital — A12
Tier 2 capital — A18
Securities and Money Held in Trust of which: investments in the instruments of banking, financial and insurance entities that are outside the scope of regulatory consolidation, where the bank does not own more than 10% of the issued share capital
332,777 —
Common Equity — A6
Additional Tier 1 capital — A13
Tier 2 capital — A19
Non-significant investments in the capital of other financials that are below the thresh-olds for deduction (before risk weighting)
332,777 A21.2
Securities and Money Held in Trust of which: significant investments in the common stock of banking, financial and insurance entities that are outside the scope of regulatory consolidation (net of eligible short positions)
106,441 —
Amount exceeding the 10% threshold on specified items — A7
Amount exceeding the 15% threshold on specified items — A9
Additional Tier 1 capital 39,040 A14
Tier 2 capital — A20
Significant investments in the common stock of financials that are below the thresholds for deduction (before risk weighting)
67,401 A22
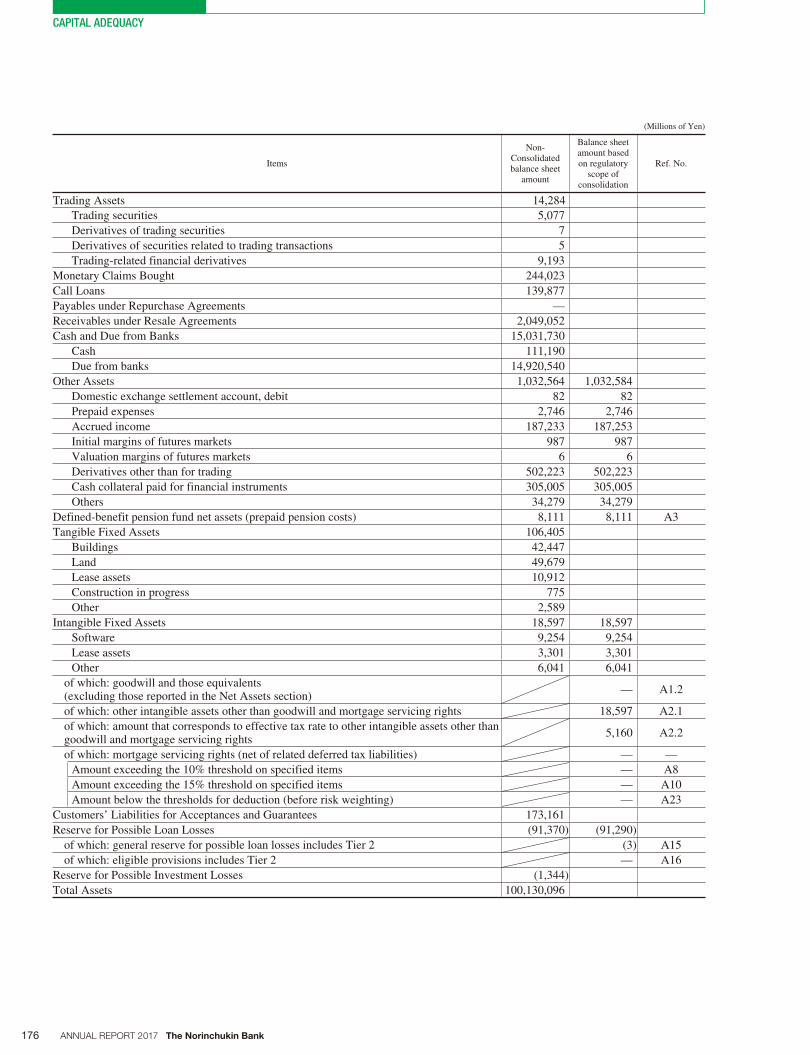
176 ANNUAL REPORT 2017 The Norinchukin Bank
CAPITAL ADEQUACY
(Millions of Yen)
Items
Non-Consolidated balance sheet
amount
Balance sheet amount based on regulatory
scope of consolidation
Ref. No.
Trading Assets 14,284
Trading securities 5,077
Derivatives of trading securities 7
Derivatives of securities related to trading transactions 5
Trading-related financial derivatives 9,193
Monetary Claims Bought 244,023
Call Loans 139,877
Payables under Repurchase Agreements —
Receivables under Resale Agreements 2,049,052
Cash and Due from Banks 15,031,730
Cash 111,190
Due from banks 14,920,540
Other Assets 1,032,564 1,032,584
Domestic exchange settlement account, debit 82 82
Prepaid expenses 2,746 2,746
Accrued income 187,233 187,253
Initial margins of futures markets 987 987
Valuation margins of futures markets 6 6
Derivatives other than for trading 502,223 502,223
Cash collateral paid for financial instruments 305,005 305,005
Others 34,279 34,279
Defined-benefit pension fund net assets (prepaid pension costs) 8,111 8,111 A3
Tangible Fixed Assets 106,405
Buildings 42,447
Land 49,679
Lease assets 10,912
Construction in progress 775
Other 2,589
Intangible Fixed Assets 18,597 18,597
Software 9,254 9,254
Lease assets 3,301 3,301
Other 6,041 6,041
of which: goodwill and those equivalents (excluding those reported in the Net Assets section)
— A1.2
of which: other intangible assets other than goodwill and mortgage servicing rights 18,597 A2.1
of which: amount that corresponds to effective tax rate to other intangible assets other than goodwill and mortgage servicing rights
5,160 A2.2
of which: mortgage servicing rights (net of related deferred tax liabilities) — —
Amount exceeding the 10% threshold on specified items — A8
Amount exceeding the 15% threshold on specified items — A10
Amount below the thresholds for deduction (before risk weighting) — A23
Customers’ Liabilities for Acceptances and Guarantees 173,161
Reserve for Possible Loan Losses (91,370) (91,290)
of which: general reserve for possible loan losses includes Tier 2 (3) A15
of which: eligible provisions includes Tier 2 — A16
Reserve for Possible Investment Losses (1,344)
Total Assets 100,130,096
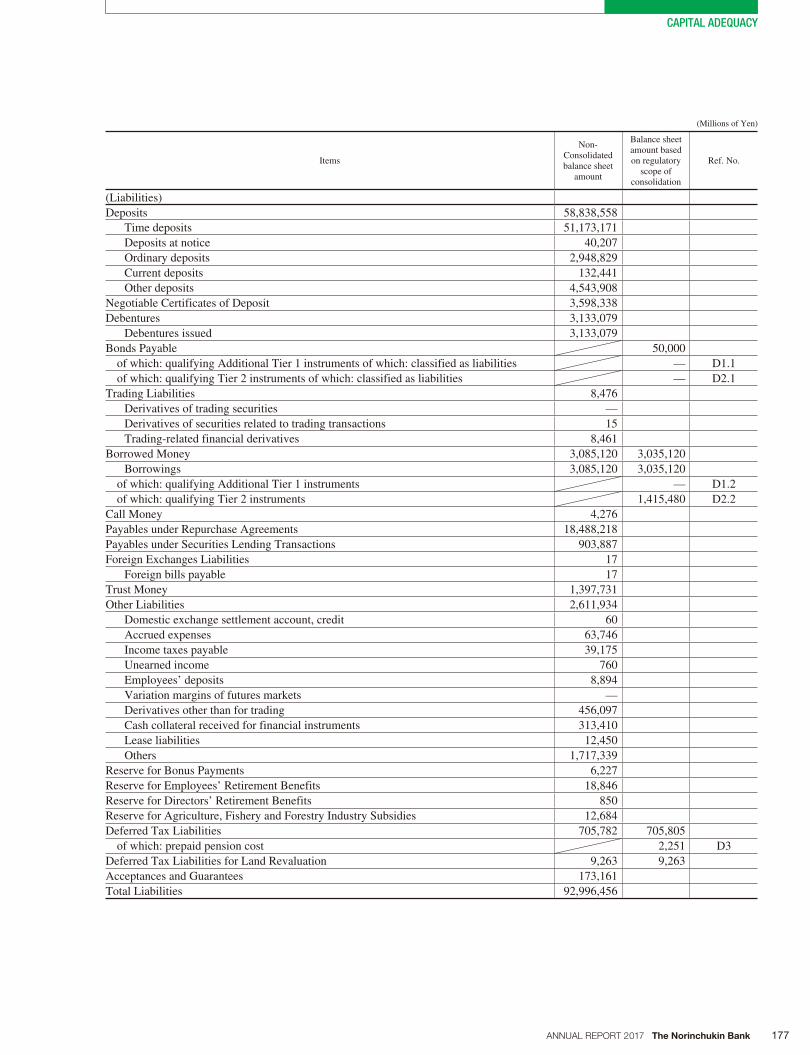
177ANNUAL REPORT 2017 The Norinchukin Bank
CAPITAL ADEQUACY
(Millions of Yen)
Items
Non-Consolidated balance sheet
amount
Balance sheet amount based on regulatory
scope of consolidation
Ref. No.
(Liabilities)
Deposits 58,838,558
Time deposits 51,173,171
Deposits at notice 40,207
Ordinary deposits 2,948,829
Current deposits 132,441
Other deposits 4,543,908
Negotiable Certificates of Deposit 3,598,338
Debentures 3,133,079
Debentures issued 3,133,079
Bonds Payable 50,000
of which: qualifying Additional Tier 1 instruments of which: classified as liabilities — D1.1
of which: qualifying Tier 2 instruments of which: classified as liabilities — D2.1
Trading Liabilities 8,476
Derivatives of trading securities —
Derivatives of securities related to trading transactions 15
Trading-related financial derivatives 8,461
Borrowed Money 3,085,120 3,035,120
Borrowings 3,085,120 3,035,120
of which: qualifying Additional Tier 1 instruments — D1.2
of which: qualifying Tier 2 instruments 1,415,480 D2.2
Call Money 4,276
Payables under Repurchase Agreements 18,488,218
Payables under Securities Lending Transactions 903,887
Foreign Exchanges Liabilities 17
Foreign bills payable 17
Trust Money 1,397,731
Other Liabilities 2,611,934
Domestic exchange settlement account, credit 60
Accrued expenses 63,746
Income taxes payable 39,175
Unearned income 760
Employees’ deposits 8,894
Variation margins of futures markets —
Derivatives other than for trading 456,097
Cash collateral received for financial instruments 313,410
Lease liabilities 12,450
Others 1,717,339
Reserve for Bonus Payments 6,227
Reserve for Employees’ Retirement Benefits 18,846
Reserve for Directors’ Retirement Benefits 850
Reserve for Agriculture, Fishery and Forestry Industry Subsidies 12,684
Deferred Tax Liabilities 705,782 705,805
of which: prepaid pension cost 2,251 D3
Deferred Tax Liabilities for Land Revaluation 9,263 9,263
Acceptances and Guarantees 173,161
Total Liabilities 92,996,456
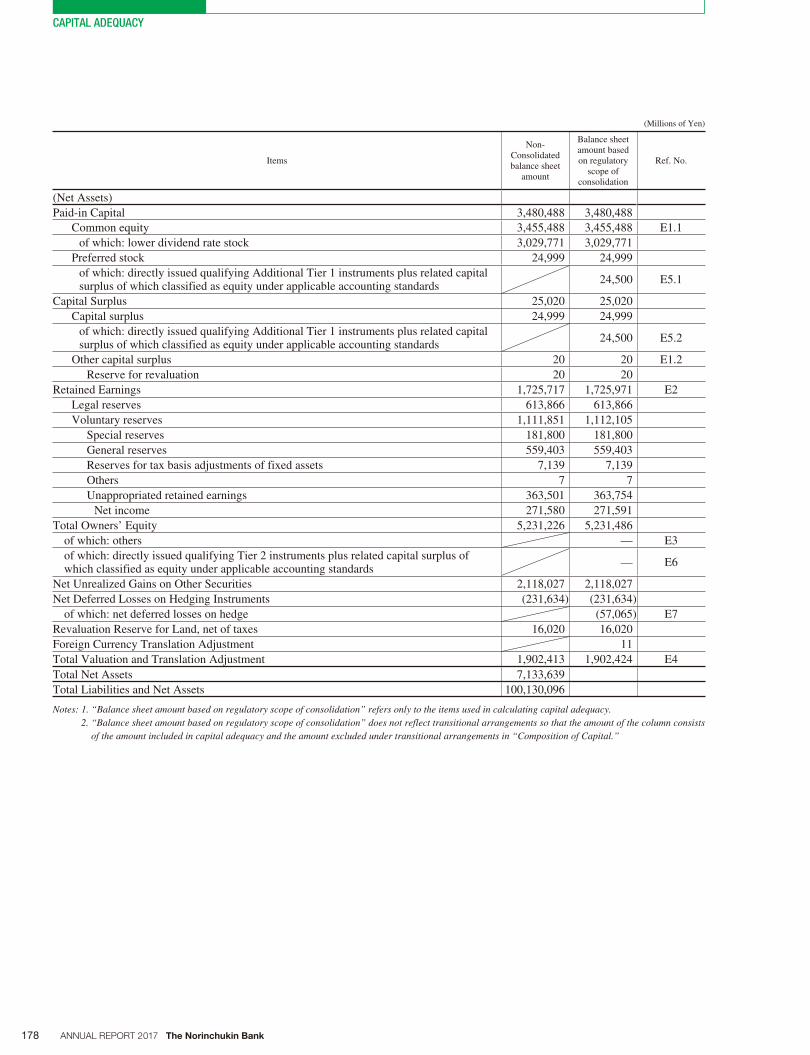
178 ANNUAL REPORT 2017 The Norinchukin Bank
CAPITAL ADEQUACY
(Millions of Yen)
Items
Non-Consolidated balance sheet
amount
Balance sheet amount based on regulatory
scope of consolidation
Ref. No.
(Net Assets)
Paid-in Capital 3,480,488 3,480,488
Common equity 3,455,488 3,455,488 E1.1
of which: lower dividend rate stock 3,029,771 3,029,771
Preferred stock 24,999 24,999
of which: directly issued qualifying Additional Tier 1 instruments plus related capital surplus of which classified as equity under applicable accounting standards
24,500 E5.1
Capital Surplus 25,020 25,020
Capital surplus 24,999 24,999
of which: directly issued qualifying Additional Tier 1 instruments plus related capital surplus of which classified as equity under applicable accounting standards
24,500 E5.2
Other capital surplus 20 20 E1.2
Reserve for revaluation 20 20
Retained Earnings 1,725,717 1,725,971 E2
Legal reserves 613,866 613,866
Voluntary reserves 1,111,851 1,112,105
Special reserves 181,800 181,800
General reserves 559,403 559,403
Reserves for tax basis adjustments of fixed assets 7,139 7,139
Others 7 7
Unappropriated retained earnings 363,501 363,754
Net income 271,580 271,591
Total Owners’ Equity 5,231,226 5,231,486
of which: others — E3
of which: directly issued qualifying Tier 2 instruments plus related capital surplus of which classified as equity under applicable accounting standards
— E6
Net Unrealized Gains on Other Securities 2,118,027 2,118,027
Net Deferred Losses on Hedging Instruments (231,634) (231,634)
of which: net deferred losses on hedge (57,065) E7
Revaluation Reserve for Land, net of taxes 16,020 16,020
Foreign Currency Translation Adjustment 11
Total Valuation and Translation Adjustment 1,902,413 1,902,424 E4
Total Net Assets 7,133,639
Total Liabilities and Net Assets 100,130,096
Notes: 1. “Balance sheet amount based on regulatory scope of consolidation” refers only to the items used in calculating capital adequacy. 2. “Balance sheet amount based on regulatory scope of consolidation” does not reflect transitional arrangements so that the amount of the column consists
of the amount included in capital adequacy and the amount excluded under transitional arrangements in “Composition of Capital.”
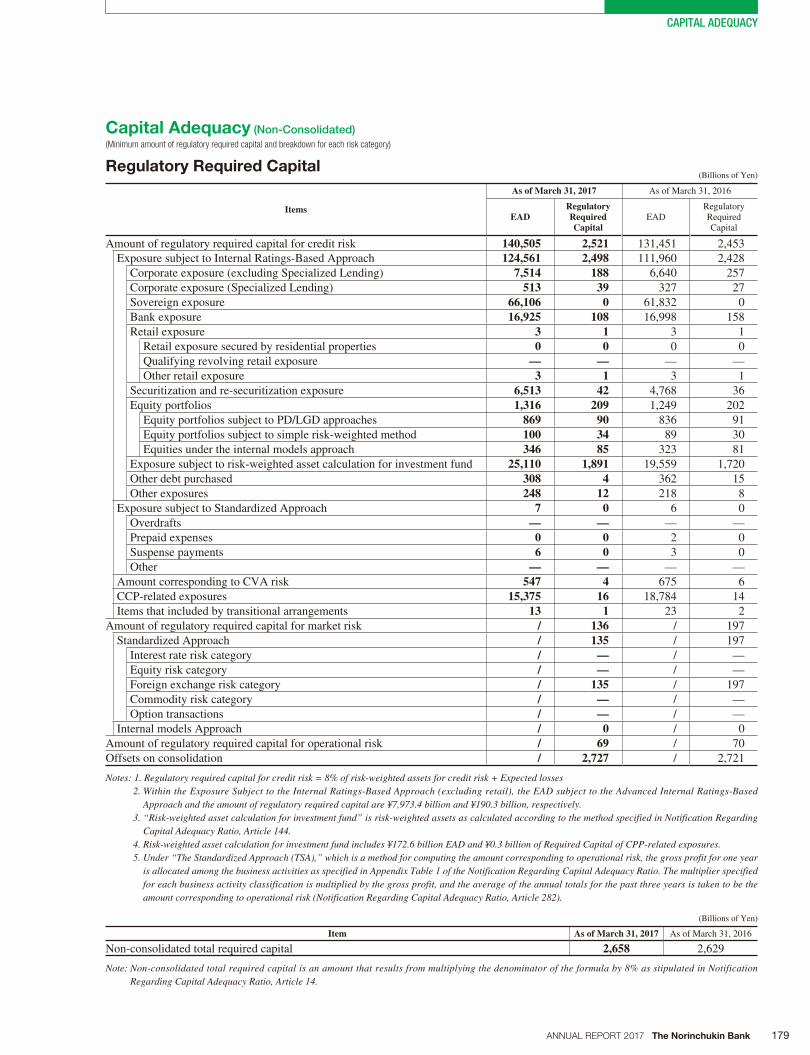
179ANNUAL REPORT 2017 The Norinchukin Bank
CAPITAL ADEQUACY
Capital Adequacy (Non-Consolidated)
(Minimum amount of regulatory required capital and breakdown for each risk category)
Regulatory Required Capital (Billions of Yen)
Items
As of March 31, 2017 As of March 31, 2016
EADRegulatoryRequiredCapital
EADRegulatoryRequired Capital
Amount of regulatory required capital for credit risk 140,505 2,521 131,451 2,453
Exposure subject to Internal Ratings-Based Approach 124,561 2,498 111,960 2,428
Corporate exposure (excluding Specialized Lending) 7,514 188 6,640 257
Corporate exposure (Specialized Lending) 513 39 327 27
Sovereign exposure 66,106 0 61,832 0
Bank exposure 16,925 108 16,998 158
Retail exposure 3 1 3 1
Retail exposure secured by residential properties 0 0 0 0
Qualifying revolving retail exposure — — — —
Other retail exposure 3 1 3 1
Securitization and re-securitization exposure 6,513 42 4,768 36
Equity portfolios 1,316 209 1,249 202
Equity portfolios subject to PD/LGD approaches 869 90 836 91
Equity portfolios subject to simple risk-weighted method 100 34 89 30
Equities under the internal models approach 346 85 323 81
Exposure subject to risk-weighted asset calculation for investment fund 25,110 1,891 19,559 1,720
Other debt purchased 308 4 362 15
Other exposures 248 12 218 8
Exposure subject to Standardized Approach 7 0 6 0
Overdrafts — — — —
Prepaid expenses 0 0 2 0
Suspense payments 6 0 3 0
Other — — — —
Amount corresponding to CVA risk 547 4 675 6
CCP-related exposures 15,375 16 18,784 14
Items that included by transitional arrangements 13 1 23 2
Amount of regulatory required capital for market risk / 136 / 197
Standardized Approach / 135 / 197
Interest rate risk category / — / —
Equity risk category / — / —
Foreign exchange risk category / 135 / 197
Commodity risk category / — / —
Option transactions / — / —
Internal models Approach / 0 / 0
Amount of regulatory required capital for operational risk / 69 / 70
Offsets on consolidation / 2,727 / 2,721
Notes: 1. Regulatory required capital for credit risk = 8% of risk-weighted assets for credit risk + Expected losses2. Within the Exposure Subject to the Internal Ratings-Based Approach (excluding retail), the EAD subject to the Advanced Internal Ratings-Based
Approach and the amount of regulatory required capital are ¥7,973.4 billion and ¥190.3 billion, respectively.3. “Risk-weighted asset calculation for investment fund” is risk-weighted assets as calculated according to the method specified in Notification Regarding
Capital Adequacy Ratio, Article 144.4. Risk-weighted asset calculation for investment fund includes ¥172.6 billion EAD and ¥0.3 billion of Required Capital of CPP-related exposures.5. Under “The Standardized Approach (TSA),” which is a method for computing the amount corresponding to operational risk, the gross profit for one year
is allocated among the business activities as specified in Appendix Table 1 of the Notification Regarding Capital Adequacy Ratio. The multiplier specified for each business activity classification is multiplied by the gross profit, and the average of the annual totals for the past three years is taken to be the amount corresponding to operational risk (Notification Regarding Capital Adequacy Ratio, Article 282).
(Billions of Yen)
Item As of March 31, 2017 As of March 31, 2016
Non-consolidated total required capital 2,658 2,629
Note: Non-consolidated total required capital is an amount that results from multiplying the denominator of the formula by 8% as stipulated in Notification Regarding Capital Adequacy Ratio, Article 14.
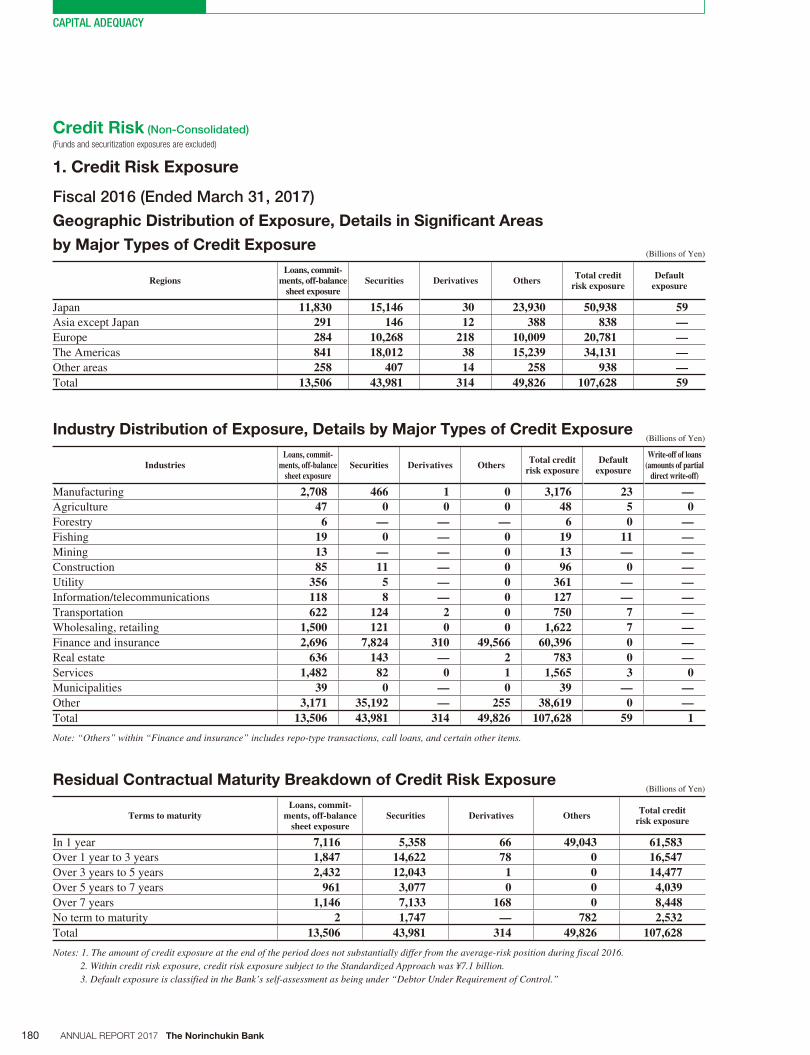
180 ANNUAL REPORT 2017 The Norinchukin Bank
CAPITAL ADEQUACY
Fiscal 2016 (Ended March 31, 2017)
Geographic Distribution of Exposure, Details in Significant Areas
by Major Types of Credit Exposure (Billions of Yen)
RegionsLoans, commit-
ments, off-balancesheet exposure
Securities Derivatives Others Total credit risk exposure
Default exposure
Japan 11,830 15,146 30 23,930 50,938 59Asia except Japan 291 146 12 388 838 —Europe 284 10,268 218 10,009 20,781 —The Americas 841 18,012 38 15,239 34,131 —Other areas 258 407 14 258 938 —Total 13,506 43,981 314 49,826 107,628 59
Industry Distribution of Exposure, Details by Major Types of Credit Exposure (Billions of Yen)
IndustriesLoans, commit-
ments, off-balancesheet exposure
Securities Derivatives Others Total credit risk exposure
Default exposure
Write-off of loans(amounts of partial
direct write-off)
Manufacturing 2,708 466 1 0 3,176 23 —Agriculture 47 0 0 0 48 5 0Forestry 6 — — — 6 0 —Fishing 19 0 — 0 19 11 —Mining 13 — — 0 13 — —Construction 85 11 — 0 96 0 —Utility 356 5 — 0 361 — —Information/telecommunications 118 8 — 0 127 — —Transportation 622 124 2 0 750 7 —Wholesaling, retailing 1,500 121 0 0 1,622 7 —Finance and insurance 2,696 7,824 310 49,566 60,396 0 —Real estate 636 143 — 2 783 0 —Services 1,482 82 0 1 1,565 3 0Municipalities 39 0 — 0 39 — —Other 3,171 35,192 — 255 38,619 0 —Total 13,506 43,981 314 49,826 107,628 59 1
Note: “Others” within “Finance and insurance” includes repo-type transactions, call loans, and certain other items.
Residual Contractual Maturity Breakdown of Credit Risk Exposure (Billions of Yen)
Terms to maturityLoans, commit-
ments, off-balancesheet exposure
Securities Derivatives Others Total credit risk exposure
In 1 year 7,116 5,358 66 49,043 61,583Over 1 year to 3 years 1,847 14,622 78 0 16,547Over 3 years to 5 years 2,432 12,043 1 0 14,477Over 5 years to 7 years 961 3,077 0 0 4,039Over 7 years 1,146 7,133 168 0 8,448No term to maturity 2 1,747 — 782 2,532Total 13,506 43,981 314 49,826 107,628
Notes: 1. The amount of credit exposure at the end of the period does not substantially differ from the average-risk position during fiscal 2016.2. Within credit risk exposure, credit risk exposure subject to the Standardized Approach was ¥7.1 billion.3. Default exposure is classified in the Bank’s self-assessment as being under “Debtor Under Requirement of Control.”
Credit Risk (Non-Consolidated)
(Funds and securitization exposures are excluded)
1. Credit Risk Exposure
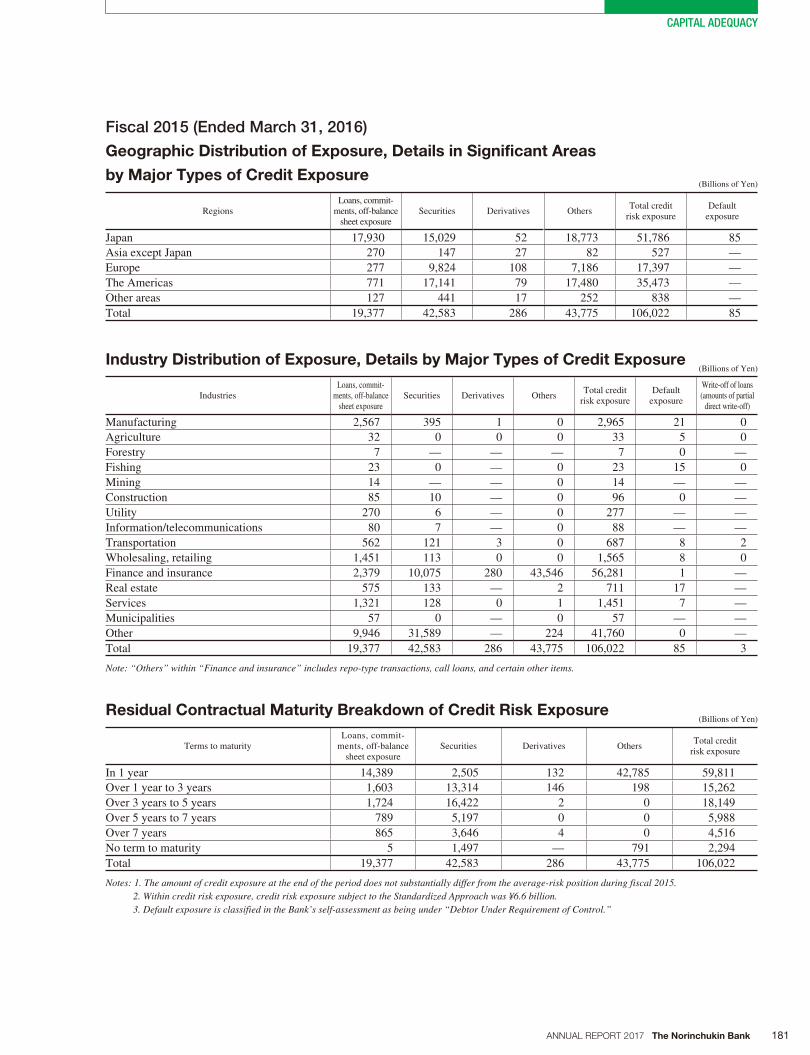
181ANNUAL REPORT 2017 The Norinchukin Bank
CAPITAL ADEQUACY
Fiscal 2015 (Ended March 31, 2016)
Geographic Distribution of Exposure, Details in Significant Areas
by Major Types of Credit Exposure (Billions of Yen)
RegionsLoans, commit-
ments, off-balancesheet exposure
Securities Derivatives OthersTotal credit
risk exposureDefault
exposure
Japan 17,930 15,029 52 18,773 51,786 85
Asia except Japan 270 147 27 82 527 —
Europe 277 9,824 108 7,186 17,397 —
The Americas 771 17,141 79 17,480 35,473 —
Other areas 127 441 17 252 838 —
Total 19,377 42,583 286 43,775 106,022 85
Industry Distribution of Exposure, Details by Major Types of Credit Exposure (Billions of Yen)
IndustriesLoans, commit-
ments, off-balancesheet exposure
Securities Derivatives OthersTotal credit
risk exposureDefault
exposure
Write-off of loans(amounts of partial
direct write-off)
Manufacturing 2,567 395 1 0 2,965 21 0
Agriculture 32 0 0 0 33 5 0
Forestry 7 — — — 7 0 —
Fishing 23 0 — 0 23 15 0
Mining 14 — — 0 14 — —
Construction 85 10 — 0 96 0 —
Utility 270 6 — 0 277 — —
Information/telecommunications 80 7 — 0 88 — —
Transportation 562 121 3 0 687 8 2
Wholesaling, retailing 1,451 113 0 0 1,565 8 0
Finance and insurance 2,379 10,075 280 43,546 56,281 1 —
Real estate 575 133 — 2 711 17 —
Services 1,321 128 0 1 1,451 7 —
Municipalities 57 0 — 0 57 — —
Other 9,946 31,589 — 224 41,760 0 —
Total 19,377 42,583 286 43,775 106,022 85 3
Note: “Others” within “Finance and insurance” includes repo-type transactions, call loans, and certain other items.
Residual Contractual Maturity Breakdown of Credit Risk Exposure (Billions of Yen)
Terms to maturityLoans, commit-
ments, off-balancesheet exposure
Securities Derivatives OthersTotal credit
risk exposure
In 1 year 14,389 2,505 132 42,785 59,811
Over 1 year to 3 years 1,603 13,314 146 198 15,262
Over 3 years to 5 years 1,724 16,422 2 0 18,149
Over 5 years to 7 years 789 5,197 0 0 5,988
Over 7 years 865 3,646 4 0 4,516
No term to maturity 5 1,497 — 791 2,294
Total 19,377 42,583 286 43,775 106,022
Notes: 1. The amount of credit exposure at the end of the period does not substantially differ from the average-risk position during fiscal 2015.2. Within credit risk exposure, credit risk exposure subject to the Standardized Approach was ¥6.6 billion.3. Default exposure is classified in the Bank’s self-assessment as being under “Debtor Under Requirement of Control.”
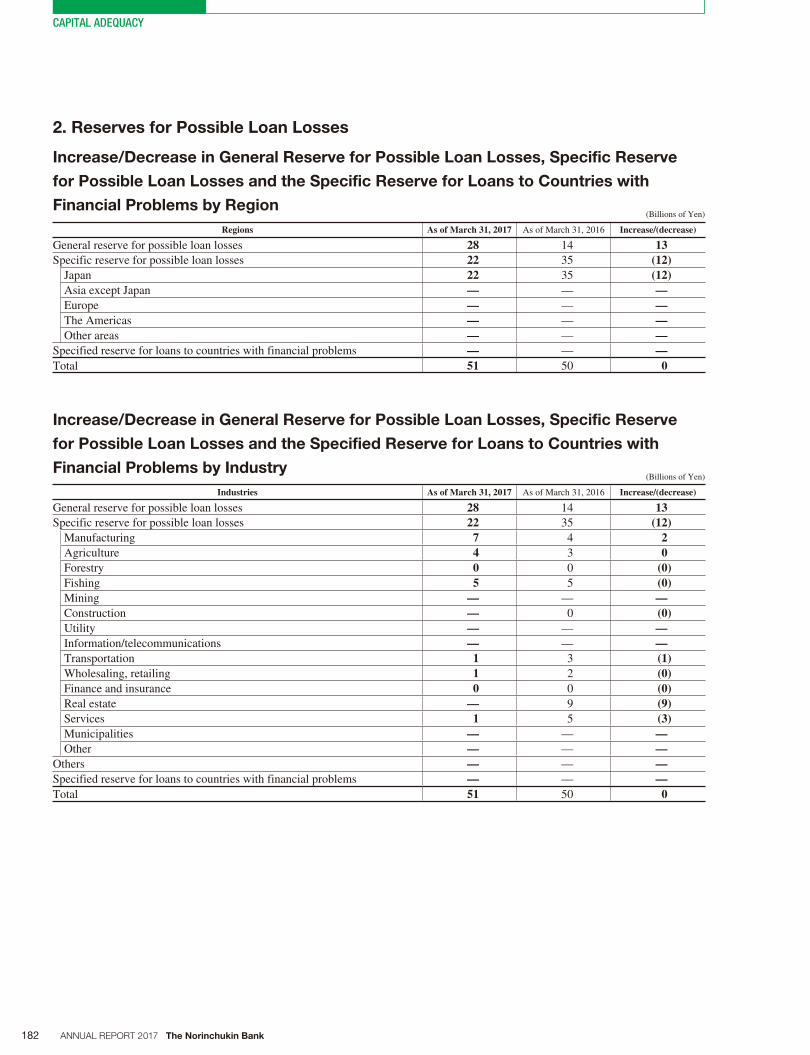
182 ANNUAL REPORT 2017 The Norinchukin Bank
CAPITAL ADEQUACY
2. Reserves for Possible Loan Losses
Increase/Decrease in General Reserve for Possible Loan Losses, Specific Reserve
for Possible Loan Losses and the Specific Reserve for Loans to Countries with
Financial Problems by Region (Billions of Yen)
Regions As of March 31, 2017 As of March 31, 2016 Increase/(decrease)
General reserve for possible loan losses 28 14 13Specific reserve for possible loan losses 22 35 (12)
Japan 22 35 (12)Asia except Japan — — —Europe — — —The Americas — — —Other areas — — —
Specified reserve for loans to countries with financial problems — — —Total 51 50 0
Increase/Decrease in General Reserve for Possible Loan Losses, Specific Reserve
for Possible Loan Losses and the Specified Reserve for Loans to Countries with
Financial Problems by Industry (Billions of Yen)
Industries As of March 31, 2017 As of March 31, 2016 Increase/(decrease)
General reserve for possible loan losses 28 14 13 Specific reserve for possible loan losses 22 35 (12)
Manufacturing 7 4 2 Agriculture 4 3 0 Forestry 0 0 (0)Fishing 5 5 (0)Mining — — —Construction — 0 (0)Utility — — —Information/telecommunications — — —Transportation 1 3 (1)Wholesaling, retailing 1 2 (0)Finance and insurance 0 0 (0)Real estate — 9 (9)Services 1 5 (3)Municipalities — — —Other — — —
Others — — —Specified reserve for loans to countries with financial problems — — —Total 51 50 0
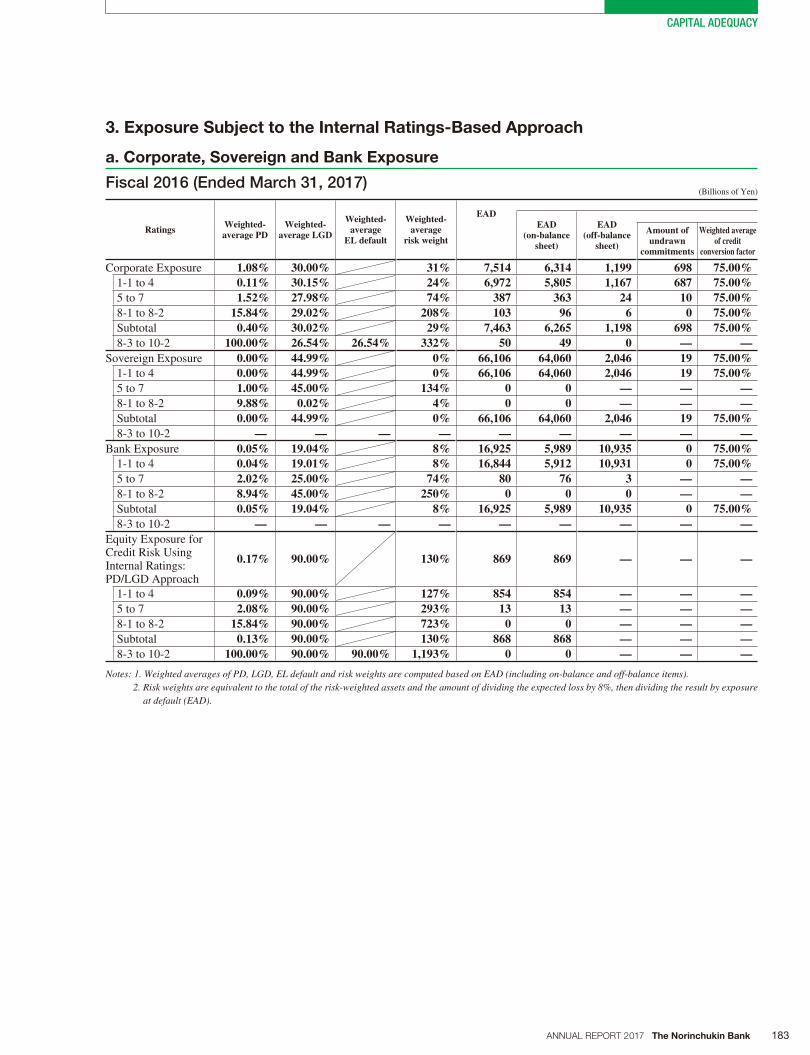
183ANNUAL REPORT 2017 The Norinchukin Bank
CAPITAL ADEQUACY
a. Corporate, Sovereign and Bank Exposure
Fiscal 2016 (Ended March 31, 2017) (Billions of Yen)
Ratings Weighted-average PD
Weighted-average LGD
Weighted-average
EL default
Weighted-average
risk weight
EAD EAD
(on-balance sheet)
EAD (off-balance
sheet)
Amount of undrawn
commitments
Weighted average of credit
conversion factor
Corporate Exposure 1.08% 30.00% 31% 7,514 6,314 1,199 698 75.00%1-1 to 4 0.11% 30.15% 24% 6,972 5,805 1,167 687 75.00%5 to 7 1.52% 27.98% 74% 387 363 24 10 75.00%8-1 to 8-2 15.84% 29.02% 208% 103 96 6 0 75.00%Subtotal 0.40% 30.02% 29% 7,463 6,265 1,198 698 75.00%8-3 to 10-2 100.00% 26.54% 26.54% 332% 50 49 0 — —
Sovereign Exposure 0.00% 44.99% 0% 66,106 64,060 2,046 19 75.00%1-1 to 4 0.00% 44.99% 0% 66,106 64,060 2,046 19 75.00%5 to 7 1.00% 45.00% 134% 0 0 — — —8-1 to 8-2 9.88% 0.02% 4% 0 0 — — —Subtotal 0.00% 44.99% 0% 66,106 64,060 2,046 19 75.00%8-3 to 10-2 — — — — — — — — —
Bank Exposure 0.05% 19.04% 8% 16,925 5,989 10,935 0 75.00%1-1 to 4 0.04% 19.01% 8% 16,844 5,912 10,931 0 75.00%5 to 7 2.02% 25.00% 74% 80 76 3 — —8-1 to 8-2 8.94% 45.00% 250% 0 0 0 — —Subtotal 0.05% 19.04% 8% 16,925 5,989 10,935 0 75.00%8-3 to 10-2 — — — — — — — — —
Equity Exposure for Credit Risk Using Internal Ratings: PD/LGD Approach
0.17% 90.00% 130% 869 869 — — —
1-1 to 4 0.09% 90.00% 127% 854 854 — — —5 to 7 2.08% 90.00% 293% 13 13 — — —8-1 to 8-2 15.84% 90.00% 723% 0 0 — — —Subtotal 0.13% 90.00% 130% 868 868 — — —8-3 to 10-2 100.00% 90.00% 90.00% 1,193% 0 0 — — —
Notes: 1. Weighted averages of PD, LGD, EL default and risk weights are computed based on EAD (including on-balance and off-balance items).2. Risk weights are equivalent to the total of the risk-weighted assets and the amount of dividing the expected loss by 8%, then dividing the result by exposure
at default (EAD).
3. Exposure Subject to the Internal Ratings-Based Approach
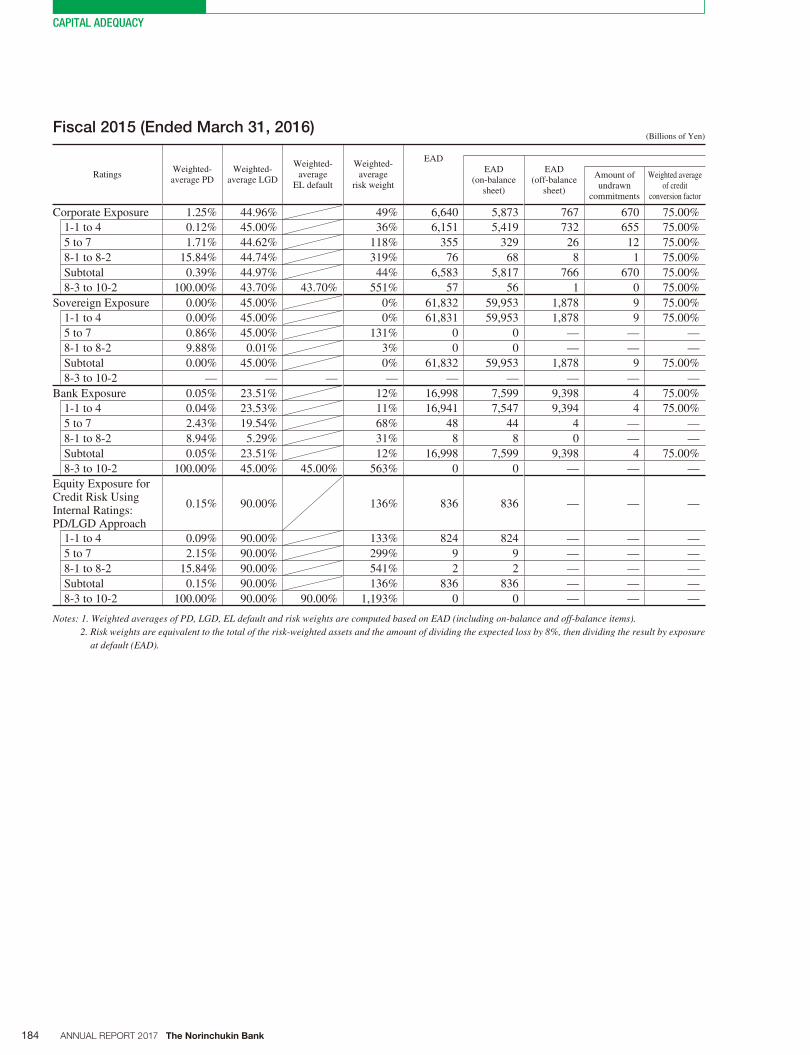
184 ANNUAL REPORT 2017 The Norinchukin Bank
CAPITAL ADEQUACY
Fiscal 2015 (Ended March 31, 2016) (Billions of Yen)
RatingsWeighted-average PD
Weighted-average LGD
Weighted-average
EL default
Weighted-average
risk weight
EADEAD
(on-balance sheet)
EAD (off-balance
sheet)
Amount of undrawn
commitments
Weighted average of credit
conversion factor
Corporate Exposure 1.25% 44.96% 49% 6,640 5,873 767 670 75.00%
1-1 to 4 0.12% 45.00% 36% 6,151 5,419 732 655 75.00%
5 to 7 1.71% 44.62% 118% 355 329 26 12 75.00%
8-1 to 8-2 15.84% 44.74% 319% 76 68 8 1 75.00%
Subtotal 0.39% 44.97% 44% 6,583 5,817 766 670 75.00%
8-3 to 10-2 100.00% 43.70% 43.70% 551% 57 56 1 0 75.00%
Sovereign Exposure 0.00% 45.00% 0% 61,832 59,953 1,878 9 75.00%
1-1 to 4 0.00% 45.00% 0% 61,831 59,953 1,878 9 75.00%
5 to 7 0.86% 45.00% 131% 0 0 — — —
8-1 to 8-2 9.88% 0.01% 3% 0 0 — — —
Subtotal 0.00% 45.00% 0% 61,832 59,953 1,878 9 75.00%
8-3 to 10-2 — — — — — — — — —
Bank Exposure 0.05% 23.51% 12% 16,998 7,599 9,398 4 75.00%
1-1 to 4 0.04% 23.53% 11% 16,941 7,547 9,394 4 75.00%
5 to 7 2.43% 19.54% 68% 48 44 4 — —
8-1 to 8-2 8.94% 5.29% 31% 8 8 0 — —
Subtotal 0.05% 23.51% 12% 16,998 7,599 9,398 4 75.00%
8-3 to 10-2 100.00% 45.00% 45.00% 563% 0 0 — — —
Equity Exposure for Credit Risk Using Internal Ratings: PD/LGD Approach
0.15% 90.00% 136% 836 836 — — —
1-1 to 4 0.09% 90.00% 133% 824 824 — — —
5 to 7 2.15% 90.00% 299% 9 9 — — —
8-1 to 8-2 15.84% 90.00% 541% 2 2 — — —
Subtotal 0.15% 90.00% 136% 836 836 — — —
8-3 to 10-2 100.00% 90.00% 90.00% 1,193% 0 0 — — —
Notes: 1. Weighted averages of PD, LGD, EL default and risk weights are computed based on EAD (including on-balance and off-balance items).2. Risk weights are equivalent to the total of the risk-weighted assets and the amount of dividing the expected loss by 8%, then dividing the result by exposure
at default (EAD).
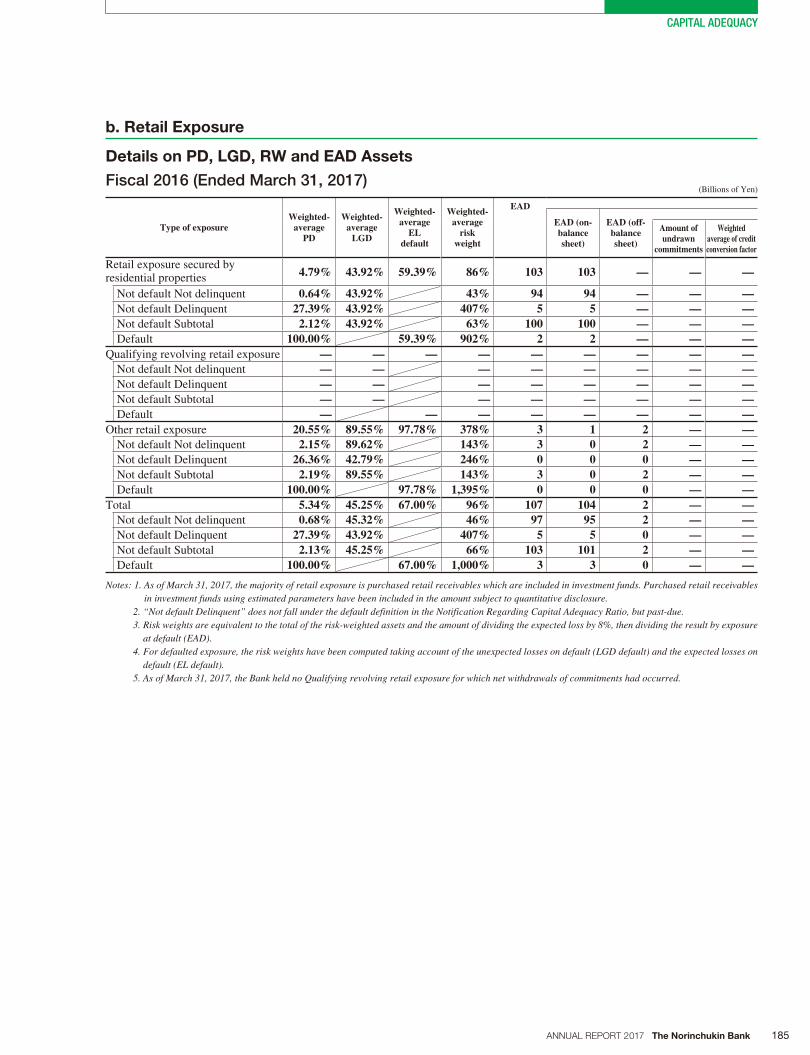
185ANNUAL REPORT 2017 The Norinchukin Bank
CAPITAL ADEQUACY
b. Retail Exposure
Details on PD, LGD, RW and EAD Assets
Fiscal 2016 (Ended March 31, 2017) (Billions of Yen)
Type of exposureWeighted-
average PD
Weighted-average
LGD
Weighted-average
ELdefault
Weighted-average
riskweight
EAD
EAD (on-balance sheet)
EAD (off-balancesheet)
Amount of undrawn
commitments
Weighted average of credit conversion factor
Retail exposure secured by residential properties 4.79% 43.92% 59.39% 86% 103 103 — — —
Not default Not delinquent 0.64% 43.92% 43% 94 94 — — — Not default Delinquent 27.39% 43.92% 407% 5 5 — — — Not default Subtotal 2.12% 43.92% 63% 100 100 — — — Default 100.00% 59.39% 902% 2 2 — — —
Qualifying revolving retail exposure — — — — — — — — — Not default Not delinquent — — — — — — — — Not default Delinquent — — — — — — — — Not default Subtotal — — — — — — — — Default — — — — — — — —
Other retail exposure 20.55% 89.55% 97.78% 378% 3 1 2 — — Not default Not delinquent 2.15% 89.62% 143% 3 0 2 — — Not default Delinquent 26.36% 42.79% 246% 0 0 0 — — Not default Subtotal 2.19% 89.55% 143% 3 0 2 — — Default 100.00% 97.78% 1,395% 0 0 0 — —
Total 5.34% 45.25% 67.00% 96% 107 104 2 — — Not default Not delinquent 0.68% 45.32% 46% 97 95 2 — — Not default Delinquent 27.39% 43.92% 407% 5 5 0 — — Not default Subtotal 2.13% 45.25% 66% 103 101 2 — — Default 100.00% 67.00% 1,000% 3 3 0 — —
Notes: 1. As of March 31, 2017, the majority of retail exposure is purchased retail receivables which are included in investment funds. Purchased retail receivables in investment funds using estimated parameters have been included in the amount subject to quantitative disclosure.
2. “Not default Delinquent” does not fall under the default definition in the Notification Regarding Capital Adequacy Ratio, but past-due.3. Risk weights are equivalent to the total of the risk-weighted assets and the amount of dividing the expected loss by 8%, then dividing the result by exposure
at default (EAD).4. For defaulted exposure, the risk weights have been computed taking account of the unexpected losses on default (LGD default) and the expected losses on
default (EL default).5. As of March 31, 2017, the Bank held no Qualifying revolving retail exposure for which net withdrawals of commitments had occurred.
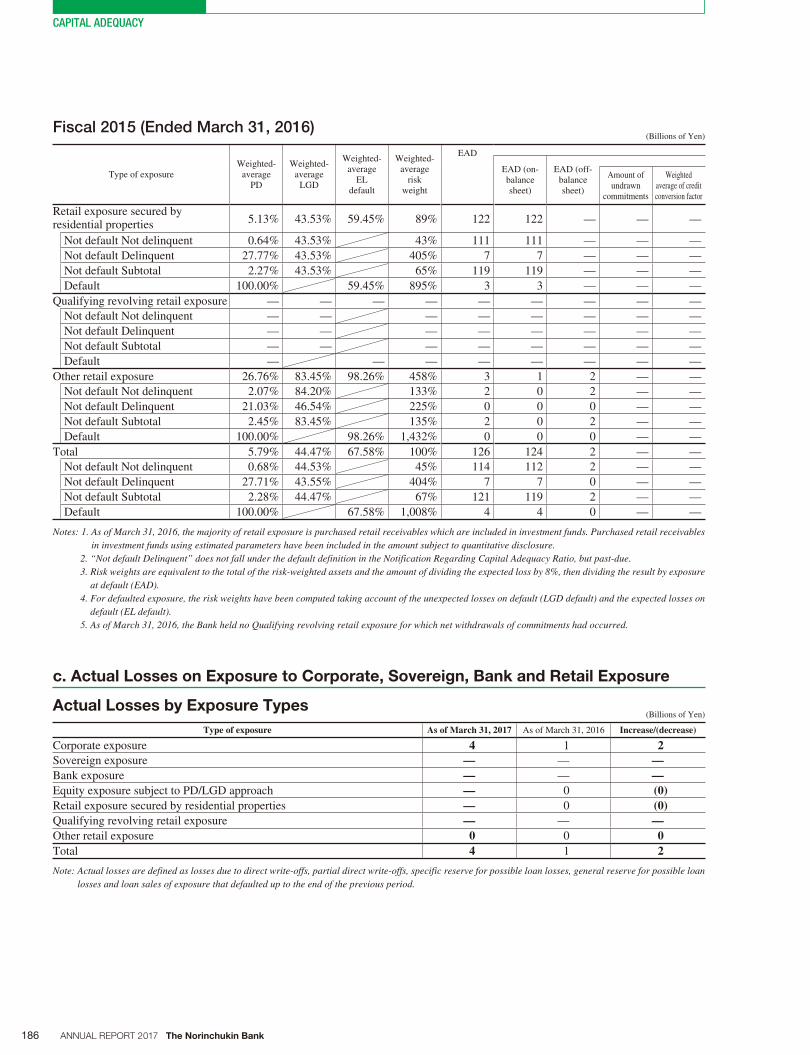
186 ANNUAL REPORT 2017 The Norinchukin Bank
CAPITAL ADEQUACY
Fiscal 2015 (Ended March 31, 2016) (Billions of Yen)
Type of exposureWeighted-
average PD
Weighted-average
LGD
Weighted-average
ELdefault
Weighted-average
riskweight
EAD
EAD (on-balance sheet)
EAD (off-balancesheet)
Amount of undrawn
commitments
Weighted average of credit conversion factor
Retail exposure secured by residential properties 5.13% 43.53% 59.45% 89% 122 122 — — —
Not default Not delinquent 0.64% 43.53% 43% 111 111 — — —
Not default Delinquent 27.77% 43.53% 405% 7 7 — — —
Not default Subtotal 2.27% 43.53% 65% 119 119 — — —
Default 100.00% 59.45% 895% 3 3 — — —
Qualifying revolving retail exposure — — — — — — — — —
Not default Not delinquent — — — — — — — —
Not default Delinquent — — — — — — — —
Not default Subtotal — — — — — — — —
Default — — — — — — — —
Other retail exposure 26.76% 83.45% 98.26% 458% 3 1 2 — —
Not default Not delinquent 2.07% 84.20% 133% 2 0 2 — —
Not default Delinquent 21.03% 46.54% 225% 0 0 0 — —
Not default Subtotal 2.45% 83.45% 135% 2 0 2 — —
Default 100.00% 98.26% 1,432% 0 0 0 — —
Total 5.79% 44.47% 67.58% 100% 126 124 2 — —
Not default Not delinquent 0.68% 44.53% 45% 114 112 2 — —
Not default Delinquent 27.71% 43.55% 404% 7 7 0 — —
Not default Subtotal 2.28% 44.47% 67% 121 119 2 — —
Default 100.00% 67.58% 1,008% 4 4 0 — —
Notes: 1. As of March 31, 2016, the majority of retail exposure is purchased retail receivables which are included in investment funds. Purchased retail receivables in investment funds using estimated parameters have been included in the amount subject to quantitative disclosure.
2. “Not default Delinquent” does not fall under the default definition in the Notification Regarding Capital Adequacy Ratio, but past-due.3. Risk weights are equivalent to the total of the risk-weighted assets and the amount of dividing the expected loss by 8%, then dividing the result by exposure
at default (EAD).4. For defaulted exposure, the risk weights have been computed taking account of the unexpected losses on default (LGD default) and the expected losses on
default (EL default).5. As of March 31, 2016, the Bank held no Qualifying revolving retail exposure for which net withdrawals of commitments had occurred.
c. Actual Losses on Exposure to Corporate, Sovereign, Bank and Retail Exposure
Actual Losses by Exposure Types (Billions of Yen)
Type of exposure As of March 31, 2017 As of March 31, 2016 Increase/(decrease)
Corporate exposure 4 1 2Sovereign exposure — — —Bank exposure — — —Equity exposure subject to PD/LGD approach — 0 (0)Retail exposure secured by residential properties — 0 (0)Qualifying revolving retail exposure — — —Other retail exposure 0 0 0Total 4 1 2
Note: Actual losses are defined as losses due to direct write-offs, partial direct write-offs, specific reserve for possible loan losses, general reserve for possible loan losses and loan sales of exposure that defaulted up to the end of the previous period.
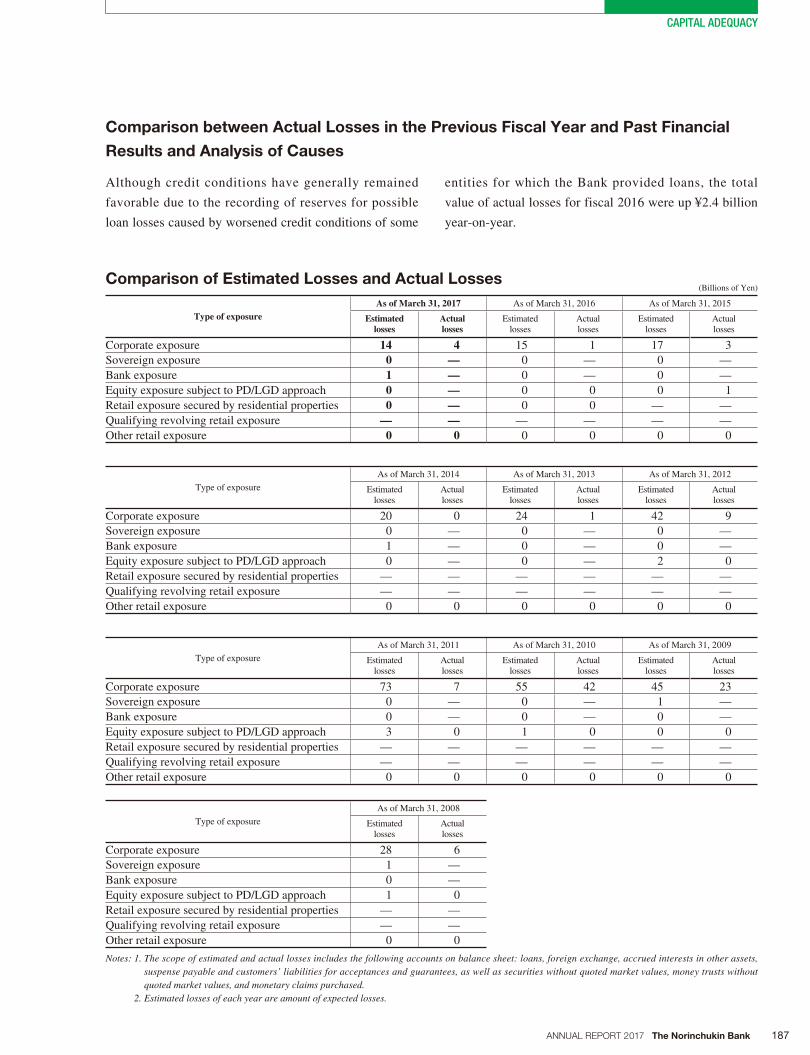
187ANNUAL REPORT 2017 The Norinchukin Bank
CAPITAL ADEQUACY
Comparison between Actual Losses in the Previous Fiscal Year and Past Financial
Results and Analysis of Causes
Comparison of Estimated Losses and Actual Losses (Billions of Yen)
Type of exposureAs of March 31, 2017 As of March 31, 2016 As of March 31, 2015
Estimated losses
Actual losses
Estimated losses
Actual losses
Estimated losses
Actual losses
Corporate exposure 14 4 15 1 17 3
Sovereign exposure 0 — 0 — 0 —
Bank exposure 1 — 0 — 0 —
Equity exposure subject to PD/LGD approach 0 — 0 0 0 1
Retail exposure secured by residential properties 0 — 0 0 — —
Qualifying revolving retail exposure — — — — — —
Other retail exposure 0 0 0 0 0 0
Type of exposure
As of March 31, 2014 As of March 31, 2013 As of March 31, 2012
Estimated losses
Actual losses
Estimated losses
Actual losses
Estimated losses
Actual losses
Corporate exposure 20 0 24 1 42 9
Sovereign exposure 0 — 0 — 0 —
Bank exposure 1 — 0 — 0 —
Equity exposure subject to PD/LGD approach 0 — 0 — 2 0
Retail exposure secured by residential properties — — — — — —
Qualifying revolving retail exposure — — — — — —
Other retail exposure 0 0 0 0 0 0
Type of exposure
As of March 31, 2011 As of March 31, 2010 As of March 31, 2009
Estimated losses
Actual losses
Estimated losses
Actual losses
Estimated losses
Actual losses
Corporate exposure 73 7 55 42 45 23
Sovereign exposure 0 — 0 — 1 —
Bank exposure 0 — 0 — 0 —
Equity exposure subject to PD/LGD approach 3 0 1 0 0 0
Retail exposure secured by residential properties — — — — — —
Qualifying revolving retail exposure — — — — — —
Other retail exposure 0 0 0 0 0 0
Type of exposure
As of March 31, 2008
Estimated losses
Actual losses
Corporate exposure 28 6
Sovereign exposure 1 —
Bank exposure 0 —
Equity exposure subject to PD/LGD approach 1 0
Retail exposure secured by residential properties — —
Qualifying revolving retail exposure — —
Other retail exposure 0 0
Notes: 1. The scope of estimated and actual losses includes the following accounts on balance sheet: loans, foreign exchange, accrued interests in other assets, suspense payable and customers’ liabilities for acceptances and guarantees, as well as securities without quoted market values, money trusts without quoted market values, and monetary claims purchased.
2. Estimated losses of each year are amount of expected losses.
Although credit conditions have generally remained
favorable due to the recording of reserves for possible
loan losses caused by worsened credit conditions of some
entities for which the Bank provided loans, the total
value of actual losses for fiscal 2016 were up ¥2.4 billion
year-on-year.
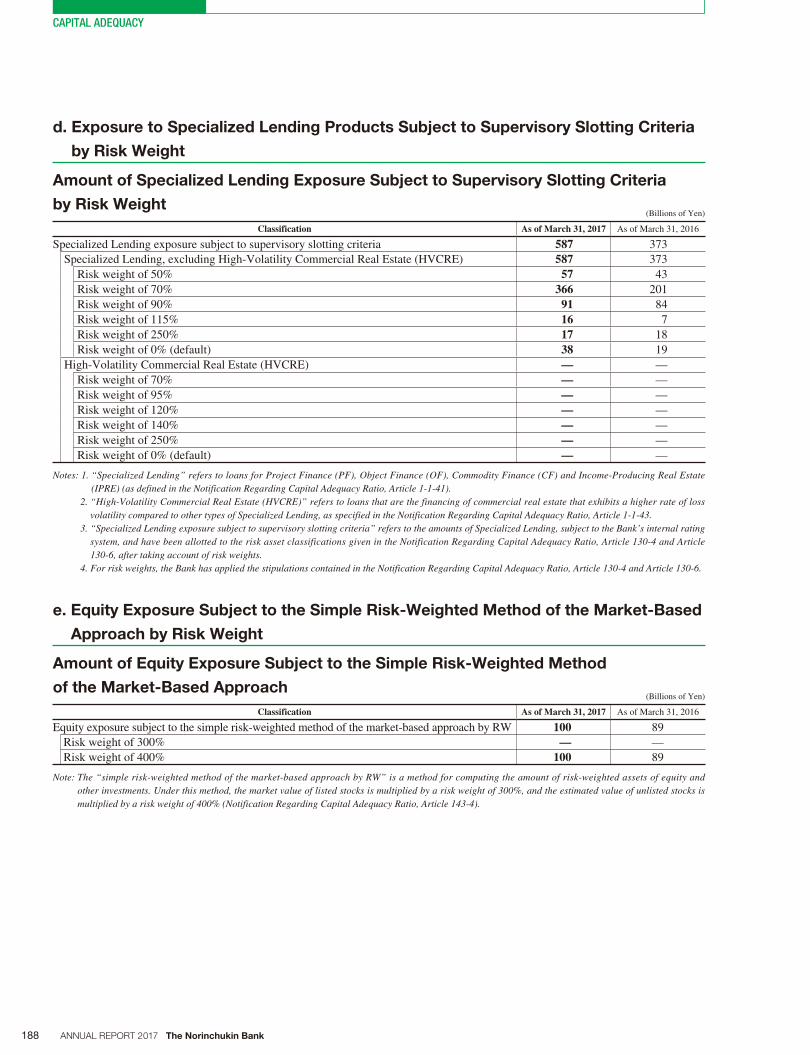
188 ANNUAL REPORT 2017 The Norinchukin Bank
CAPITAL ADEQUACY
d. Exposure to Specialized Lending Products Subject to Supervisory Slotting Criteria
by Risk Weight
Amount of Specialized Lending Exposure Subject to Supervisory Slotting Criteria
by Risk Weight (Billions of Yen)
Classification As of March 31, 2017 As of March 31, 2016
Specialized Lending exposure subject to supervisory slotting criteria 587 373
Specialized Lending, excluding High-Volatility Commercial Real Estate (HVCRE) 587 373
Risk weight of 50% 57 43
Risk weight of 70% 366 201
Risk weight of 90% 91 84
Risk weight of 115% 16 7
Risk weight of 250% 17 18
Risk weight of 0% (default) 38 19
High-Volatility Commercial Real Estate (HVCRE) — —
Risk weight of 70% — —
Risk weight of 95% — —
Risk weight of 120% — —
Risk weight of 140% — —
Risk weight of 250% — —
Risk weight of 0% (default) — —
Notes: 1. “Specialized Lending” refers to loans for Project Finance (PF), Object Finance (OF), Commodity Finance (CF) and Income-Producing Real Estate (IPRE) (as defined in the Notification Regarding Capital Adequacy Ratio, Article 1-1-41).
2. “High-Volatility Commercial Real Estate (HVCRE)” refers to loans that are the financing of commercial real estate that exhibits a higher rate of loss volatility compared to other types of Specialized Lending, as specified in the Notification Regarding Capital Adequacy Ratio, Article 1-1-43.
3. “Specialized Lending exposure subject to supervisory slotting criteria” refers to the amounts of Specialized Lending, subject to the Bank’s internal rating system, and have been allotted to the risk asset classifications given in the Notification Regarding Capital Adequacy Ratio, Article 130-4 and Article 130-6, after taking account of risk weights.
4. For risk weights, the Bank has applied the stipulations contained in the Notification Regarding Capital Adequacy Ratio, Article 130-4 and Article 130-6.
e. Equity Exposure Subject to the Simple Risk-Weighted Method of the Market-Based
Approach by Risk Weight
Amount of Equity Exposure Subject to the Simple Risk-Weighted Method
of the Market-Based Approach (Billions of Yen)
Classification As of March 31, 2017 As of March 31, 2016
Equity exposure subject to the simple risk-weighted method of the market-based approach by RW 100 89
Risk weight of 300% — —
Risk weight of 400% 100 89
Note: The “simple risk-weighted method of the market-based approach by RW” is a method for computing the amount of risk-weighted assets of equity and other investments. Under this method, the market value of listed stocks is multiplied by a risk weight of 300%, and the estimated value of unlisted stocks is multiplied by a risk weight of 400% (Notification Regarding Capital Adequacy Ratio, Article 143-4).

189ANNUAL REPORT 2017 The Norinchukin Bank
CAPITAL ADEQUACY
Amount of Exposure Subject to Standardized Approach (Billions of Yen)
Classification
As of March 31, 2017 As of March 31, 2016
Exposure Exposure
Refer to ECAI Refer to ECAI
Exposure subject to Standardized Approach 7 — 6 —
Risk weight of 0% — — — —
Risk weight of 10% — — — —
Risk weight of 20% — — — —
Risk weight of 35% — — — —
Risk weight of 50% — — — —
Risk weight of 75% — — — —
Risk weight of 100% 7 — 6 —
Risk weight of 150% — — — —
Risk weight of 1,250% — — — —
Others — — — —
Note: Others include investment funds which are measured credit risk assets by look-through approach and the assets which are more than 150% and less than 1,250% risk weight.
Credit Risk Mitigation Techniques (Non-Consolidated)
Amount of Exposure Subject to Credit Risk Mitigation Techniques
(Eligible Financial Collateral, Other Eligible IRB Collateral, Guarantees, Credit
Derivatives) (Billions of Yen)
Classification As of March 31, 2017 As of March 31, 2016
Foundation Internal Ratings-Based Approach 9,692 8,230
Eligible financial collateral 8,940 7,557
Corporate exposure — 57
Sovereign exposure 0 0
Bank exposure 8,940 7,499
Other eligible IRB collateral — —
Corporate exposure — —
Sovereign exposure — —
Bank exposure — —
Guarantees, Credit Derivatives 751 673
Corporate exposure 405 388
Sovereign exposure 256 231
Bank exposure 89 52
Retail exposure secured by residential properties — —
Qualifying revolving retail exposure — —
Other retail exposure — —
Standardized Approach — —
Eligible financial collateral — —
Guarantees, Credit Derivatives — —
Note: Exposure subject to risk-weighted asset calculation for investment fund is not included.
4. Exposure Subject to Standardized Approach
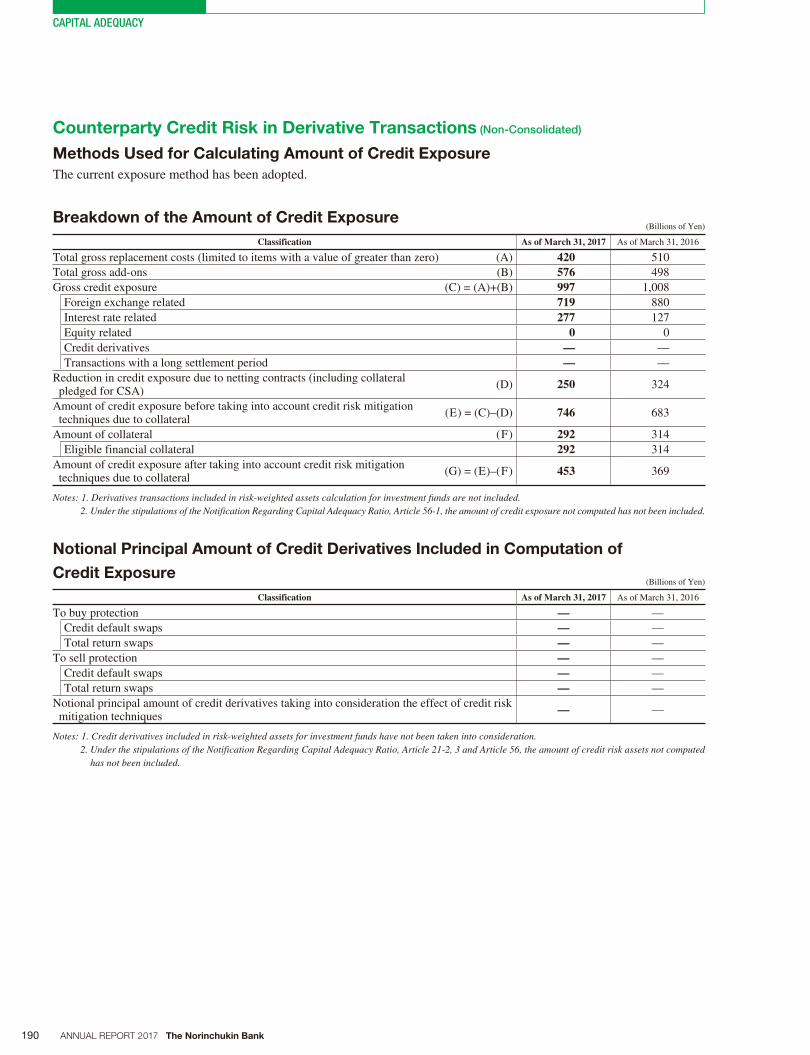
190 ANNUAL REPORT 2017 The Norinchukin Bank
CAPITAL ADEQUACY
Counterparty Credit Risk in Derivative Transactions (Non-Consolidated)
Methods Used for Calculating Amount of Credit Exposure
The current exposure method has been adopted.
Breakdown of the Amount of Credit Exposure (Billions of Yen)
Classification As of March 31, 2017 As of March 31, 2016
Total gross replacement costs (limited to items with a value of greater than zero) (A) 420 510
Total gross add-ons (B) 576 498
Gross credit exposure (C) = (A)+(B) 997 1,008
Foreign exchange related 719 880
Interest rate related 277 127
Equity related 0 0
Credit derivatives — —
Transactions with a long settlement period — —
Reduction in credit exposure due to netting contracts (including collateral pledged for CSA)
(D) 250 324
Amount of credit exposure before taking into account credit risk mitigation techniques due to collateral
(E) = (C)–(D) 746 683
Amount of collateral (F) 292 314
Eligible financial collateral 292 314
Amount of credit exposure after taking into account credit risk mitigation techniques due to collateral
(G) = (E)–(F) 453 369
Notes: 1. Derivatives transactions included in risk-weighted assets calculation for investment funds are not included.2. Under the stipulations of the Notification Regarding Capital Adequacy Ratio, Article 56-1, the amount of credit exposure not computed has not been included.
Notional Principal Amount of Credit Derivatives Included in Computation of
Credit Exposure (Billions of Yen)
Classification As of March 31, 2017 As of March 31, 2016
To buy protection — —
Credit default swaps — —
Total return swaps — —
To sell protection — —
Credit default swaps — —
Total return swaps — —
Notional principal amount of credit derivatives taking into consideration the effect of credit risk mitigation techniques
— —
Notes: 1. Credit derivatives included in risk-weighted assets for investment funds have not been taken into consideration.2. Under the stipulations of the Notification Regarding Capital Adequacy Ratio, Article 21-2, 3 and Article 56, the amount of credit risk assets not computed
has not been included.
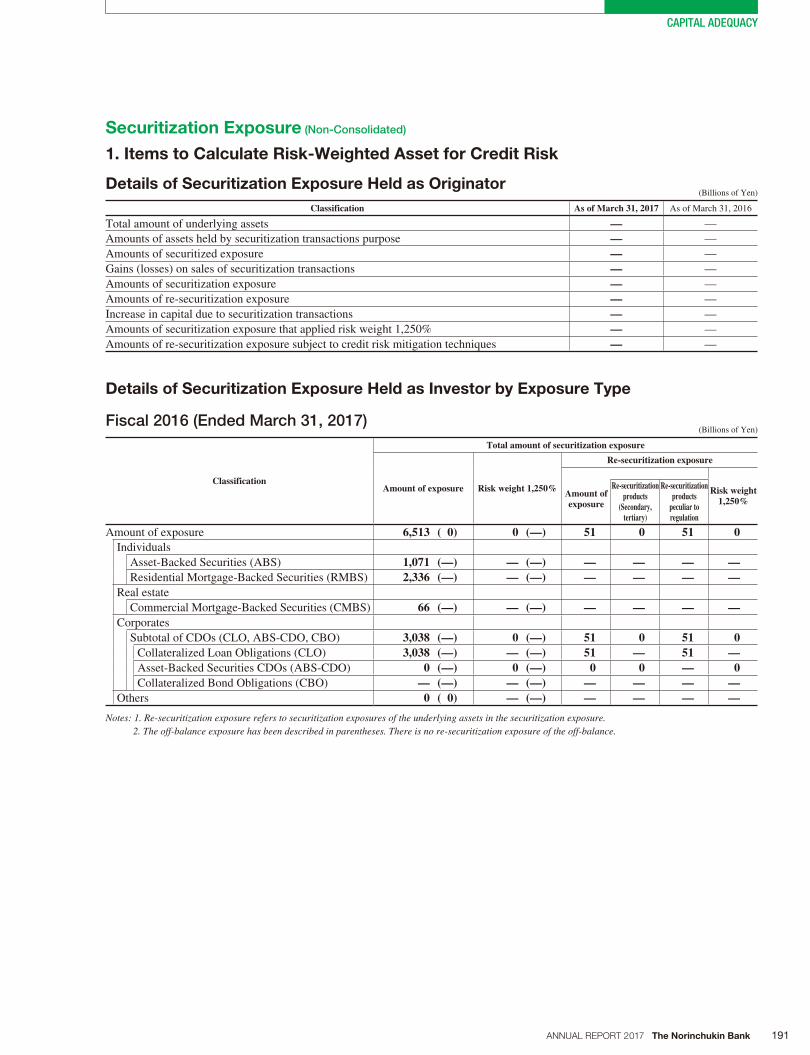
191ANNUAL REPORT 2017 The Norinchukin Bank
CAPITAL ADEQUACY
Details of Securitization Exposure Held as Originator (Billions of Yen)
Classification As of March 31, 2017 As of March 31, 2016
Total amount of underlying assets — —
Amounts of assets held by securitization transactions purpose — —
Amounts of securitized exposure — —
Gains (losses) on sales of securitization transactions — —
Amounts of securitization exposure — —
Amounts of re-securitization exposure — —
Increase in capital due to securitization transactions — —
Amounts of securitization exposure that applied risk weight 1,250% — —
Amounts of re-securitization exposure subject to credit risk mitigation techniques — —
Details of Securitization Exposure Held as Investor by Exposure Type
Fiscal 2016 (Ended March 31, 2017) (Billions of Yen)
Classification
Total amount of securitization exposure
Amount of exposure Risk weight 1,250%
Re-securitization exposure
Risk weight 1,250%
Amount of exposure
Re-securitization products
(Secondary, tertiary)
Re-securitization products
peculiar to regulation
Amount of exposure 6,513 ( 0) 0 (—) 51 0 51 0Individuals
Asset-Backed Securities (ABS) 1,071 (—) — (—) — — — —Residential Mortgage-Backed Securities (RMBS) 2,336 (—) — (—) — — — —
Real estate
Commercial Mortgage-Backed Securities (CMBS) 66 (—) — (—) — — — —Corporates
Subtotal of CDOs (CLO, ABS-CDO, CBO) 3,038 (—) 0 (—) 51 0 51 0Collateralized Loan Obligations (CLO) 3,038 (—) — (—) 51 — 51 —Asset-Backed Securities CDOs (ABS-CDO) 0 (—) 0 (—) 0 0 — 0Collateralized Bond Obligations (CBO) — (—) — (—) — — — —
Others 0 ( 0) — (—) — — — —
Notes: 1. Re-securitization exposure refers to securitization exposures of the underlying assets in the securitization exposure.2. The off-balance exposure has been described in parentheses. There is no re-securitization exposure of the off-balance.
Securitization Exposure (Non-Consolidated)
1. Items to Calculate Risk-Weighted Asset for Credit Risk
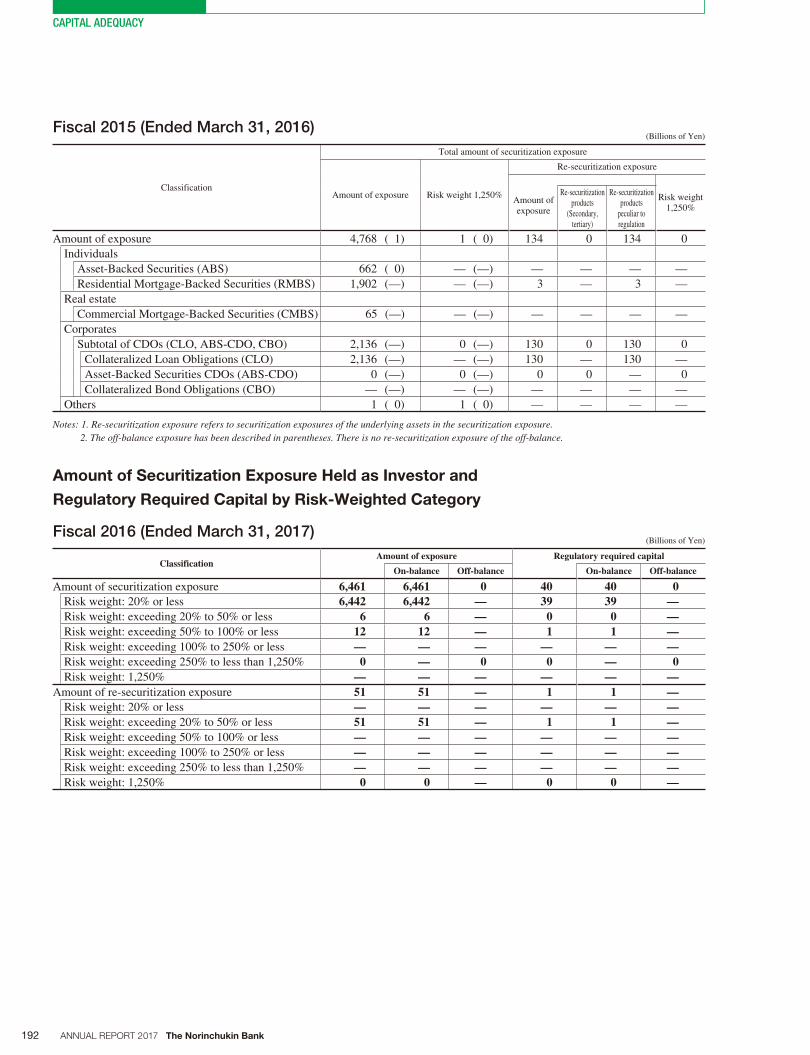
192 ANNUAL REPORT 2017 The Norinchukin Bank
CAPITAL ADEQUACY
Fiscal 2015 (Ended March 31, 2016) (Billions of Yen)
Classification
Total amount of securitization exposure
Amount of exposure Risk weight 1,250%
Re-securitization exposure
Risk weight 1,250%
Amount of exposure
Re-securitization products
(Secondary, tertiary)
Re-securitization products
peculiar to regulation
Amount of exposure 4,768 ( 1) 1 ( 0) 134 0 134 0
Individuals
Asset-Backed Securities (ABS) 662 ( 0) — (—) — — — —
Residential Mortgage-Backed Securities (RMBS) 1,902 (—) — (—) 3 — 3 —
Real estate
Commercial Mortgage-Backed Securities (CMBS) 65 (—) — (—) — — — —
Corporates
Subtotal of CDOs (CLO, ABS-CDO, CBO) 2,136 (—) 0 (—) 130 0 130 0
Collateralized Loan Obligations (CLO) 2,136 (—) — (—) 130 — 130 —
Asset-Backed Securities CDOs (ABS-CDO) 0 (—) 0 (—) 0 0 — 0
Collateralized Bond Obligations (CBO) — (—) — (—) — — — —
Others 1 ( 0) 1 ( 0) — — — —
Notes: 1. Re-securitization exposure refers to securitization exposures of the underlying assets in the securitization exposure.2. The off-balance exposure has been described in parentheses. There is no re-securitization exposure of the off-balance.
Amount of Securitization Exposure Held as Investor and
Regulatory Required Capital by Risk-Weighted Category
Fiscal 2016 (Ended March 31, 2017) (Billions of Yen)
ClassificationAmount of exposure Regulatory required capital
On-balance Off-balance On-balance Off-balance
Amount of securitization exposure 6,461 6,461 0 40 40 0Risk weight: 20% or less 6,442 6,442 — 39 39 —Risk weight: exceeding 20% to 50% or less 6 6 — 0 0 —Risk weight: exceeding 50% to 100% or less 12 12 — 1 1 —Risk weight: exceeding 100% to 250% or less — — — — — —Risk weight: exceeding 250% to less than 1,250% 0 — 0 0 — 0Risk weight: 1,250% — — — — — —
Amount of re-securitization exposure 51 51 — 1 1 —Risk weight: 20% or less — — — — — —Risk weight: exceeding 20% to 50% or less 51 51 — 1 1 —Risk weight: exceeding 50% to 100% or less — — — — — —Risk weight: exceeding 100% to 250% or less — — — — — —Risk weight: exceeding 250% to less than 1,250% — — — — — —Risk weight: 1,250% 0 0 — 0 0 —
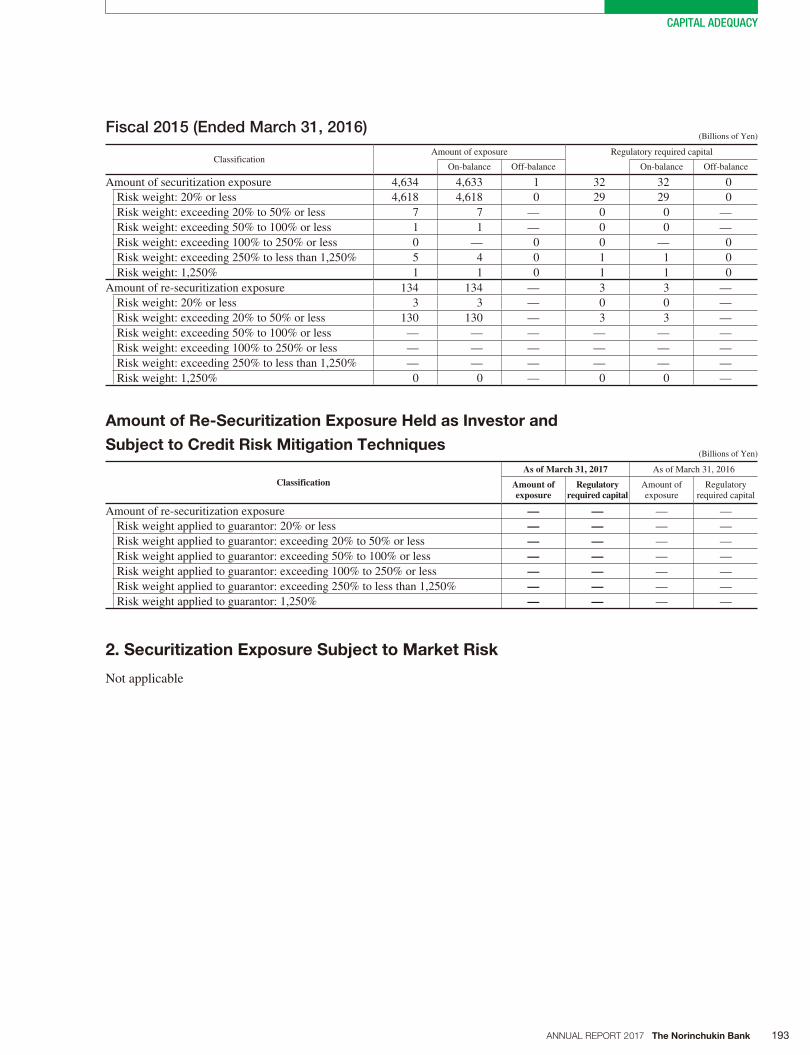
193ANNUAL REPORT 2017 The Norinchukin Bank
CAPITAL ADEQUACY
Fiscal 2015 (Ended March 31, 2016) (Billions of Yen)
ClassificationAmount of exposure Regulatory required capital
On-balance Off-balance On-balance Off-balance
Amount of securitization exposure 4,634 4,633 1 32 32 0
Risk weight: 20% or less 4,618 4,618 0 29 29 0
Risk weight: exceeding 20% to 50% or less 7 7 — 0 0 —
Risk weight: exceeding 50% to 100% or less 1 1 — 0 0 —
Risk weight: exceeding 100% to 250% or less 0 — 0 0 — 0
Risk weight: exceeding 250% to less than 1,250% 5 4 0 1 1 0
Risk weight: 1,250% 1 1 0 1 1 0
Amount of re-securitization exposure 134 134 — 3 3 —
Risk weight: 20% or less 3 3 — 0 0 —
Risk weight: exceeding 20% to 50% or less 130 130 — 3 3 —
Risk weight: exceeding 50% to 100% or less — — — — — —
Risk weight: exceeding 100% to 250% or less — — — — — —
Risk weight: exceeding 250% to less than 1,250% — — — — — —
Risk weight: 1,250% 0 0 — 0 0 —
Amount of Re-Securitization Exposure Held as Investor and
Subject to Credit Risk Mitigation Techniques (Billions of Yen)
ClassificationAs of March 31, 2017 As of March 31, 2016
Amount of exposure
Regulatory required capital
Amount of exposure
Regulatory required capital
Amount of re-securitization exposure — — — —
Risk weight applied to guarantor: 20% or less — — — —
Risk weight applied to guarantor: exceeding 20% to 50% or less — — — —
Risk weight applied to guarantor: exceeding 50% to 100% or less — — — —
Risk weight applied to guarantor: exceeding 100% to 250% or less — — — —
Risk weight applied to guarantor: exceeding 250% to less than 1,250% — — — —
Risk weight applied to guarantor: 1,250% — — — —
2. Securitization Exposure Subject to Market Risk
Not applicable
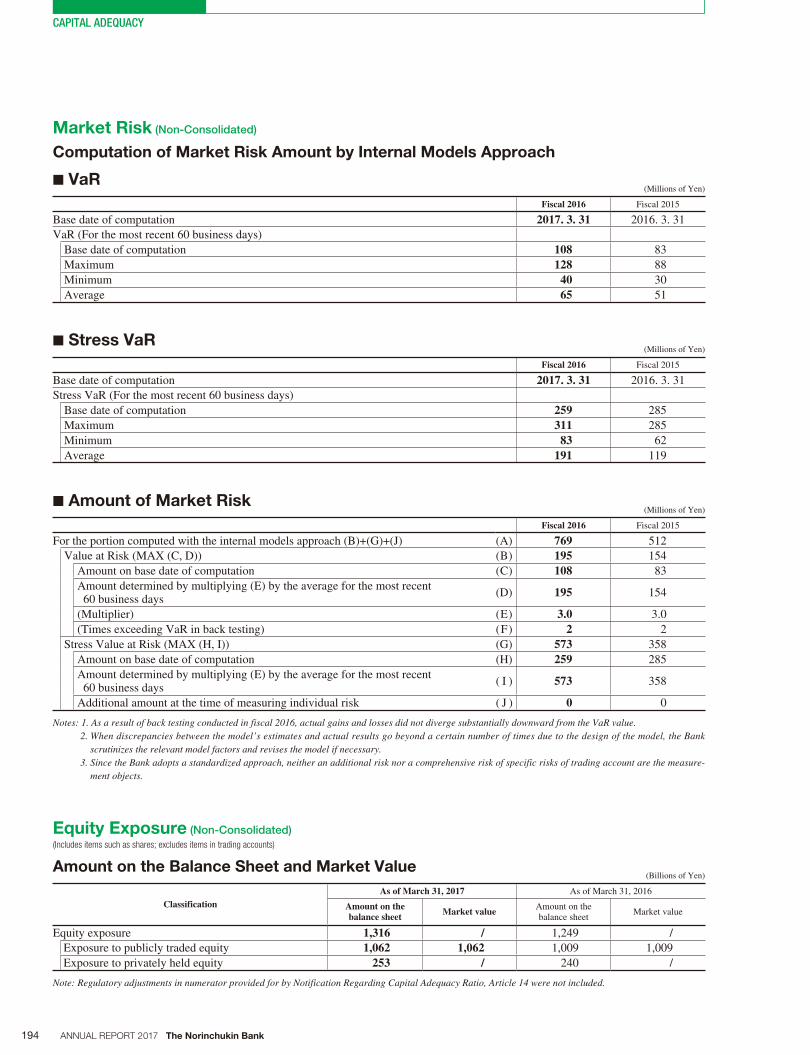
194 ANNUAL REPORT 2017 The Norinchukin Bank
CAPITAL ADEQUACY
Market Risk (Non-Consolidated)
Computation of Market Risk Amount by Internal Models Approach
■ VaR (Millions of Yen)
Fiscal 2016 Fiscal 2015
Base date of computation 2017. 3. 31 2016. 3. 31
VaR (For the most recent 60 business days)
Base date of computation 108 83
Maximum 128 88
Minimum 40 30
Average 65 51
■ Stress VaR (Millions of Yen)
Fiscal 2016 Fiscal 2015
Base date of computation 2017. 3. 31 2016. 3. 31
Stress VaR (For the most recent 60 business days)
Base date of computation 259 285
Maximum 311 285
Minimum 83 62
Average 191 119
■ Amount of Market Risk (Millions of Yen)
Fiscal 2016 Fiscal 2015
For the portion computed with the internal models approach (B)+(G)+(J) (A) 769 512
Value at Risk (MAX (C, D)) (B) 195 154
Amount on base date of computation (C) 108 83
Amount determined by multiplying (E) by the average for the most recent 60 business days
(D) 195 154
(Multiplier) (E) 3.0 3.0
(Times exceeding VaR in back testing) (F) 2 2
Stress Value at Risk (MAX (H, I)) (G) 573 358
Amount on base date of computation (H) 259 285
Amount determined by multiplying (E) by the average for the most recent 60 business days
( I ) 573 358
Additional amount at the time of measuring individual risk ( J ) 0 0
Notes: 1. As a result of back testing conducted in fiscal 2016, actual gains and losses did not diverge substantially downward from the VaR value.2. When discrepancies between the model’s estimates and actual results go beyond a certain number of times due to the design of the model, the Bank
scrutinizes the relevant model factors and revises the model if necessary.3. Since the Bank adopts a standardized approach, neither an additional risk nor a comprehensive risk of specific risks of trading account are the measure-
ment objects.
Equity Exposure (Non-Consolidated)
(Includes items such as shares; excludes items in trading accounts)
Amount on the Balance Sheet and Market Value (Billions of Yen)
ClassificationAs of March 31, 2017 As of March 31, 2016
Amount on the balance sheet Market value Amount on the
balance sheet Market value
Equity exposure 1,316 / 1,249 /
Exposure to publicly traded equity 1,062 1,062 1,009 1,009
Exposure to privately held equity 253 / 240 /
Note: Regulatory adjustments in numerator provided for by Notification Regarding Capital Adequacy Ratio, Article 14 were not included.
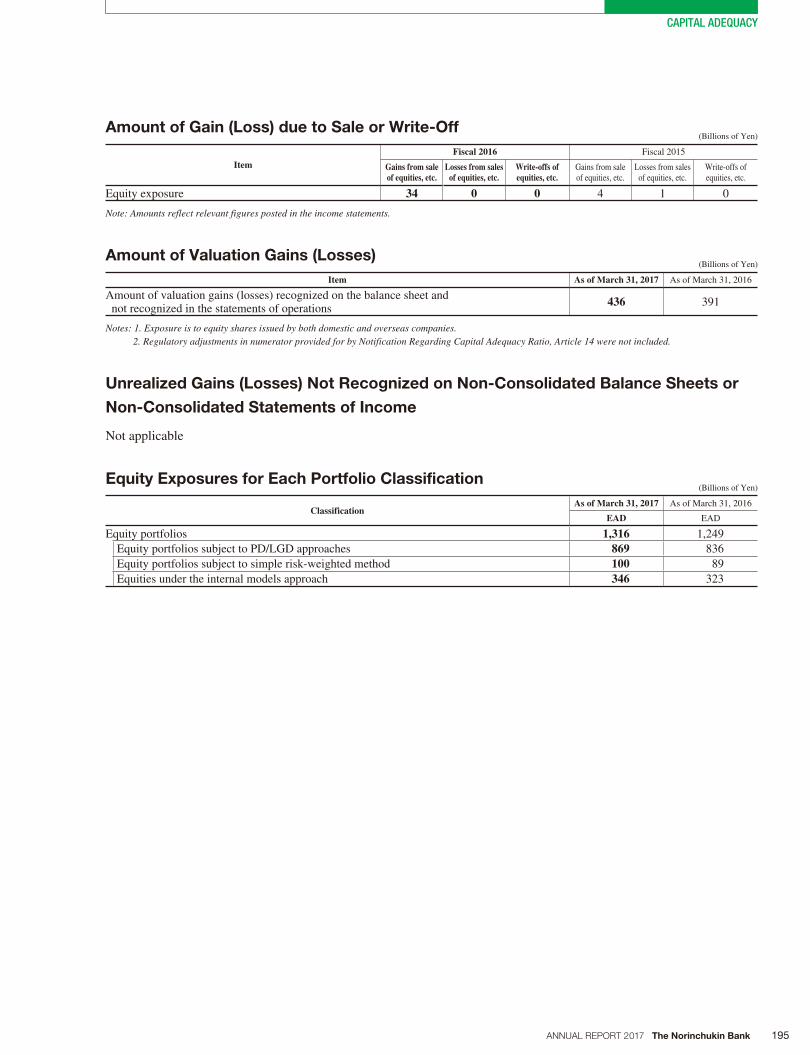
195ANNUAL REPORT 2017 The Norinchukin Bank
CAPITAL ADEQUACY
Amount of Gain (Loss) due to Sale or Write-Off (Billions of Yen)
ItemFiscal 2016 Fiscal 2015
Gains from saleof equities, etc.
Losses from sales of equities, etc.
Write-offs of equities, etc.
Gains from sale of equities, etc.
Losses from sales of equities, etc.
Write-offs of equities, etc.
Equity exposure 34 0 0 4 1 0
Note: Amounts reflect relevant figures posted in the income statements.
Amount of Valuation Gains (Losses) (Billions of Yen)
Item As of March 31, 2017 As of March 31, 2016
Amount of valuation gains (losses) recognized on the balance sheet and not recognized in the statements of operations
436 391
Notes: 1. Exposure is to equity shares issued by both domestic and overseas companies.2. Regulatory adjustments in numerator provided for by Notification Regarding Capital Adequacy Ratio, Article 14 were not included.
Unrealized Gains (Losses) Not Recognized on Non-Consolidated Balance Sheets or
Non-Consolidated Statements of Income
Not applicable
Equity Exposures for Each Portfolio Classification (Billions of Yen)
ClassificationAs of March 31, 2017 As of March 31, 2016
EAD EAD
Equity portfolios 1,316 1,249
Equity portfolios subject to PD/LGD approaches 869 836
Equity portfolios subject to simple risk-weighted method 100 89
Equities under the internal models approach 346 323
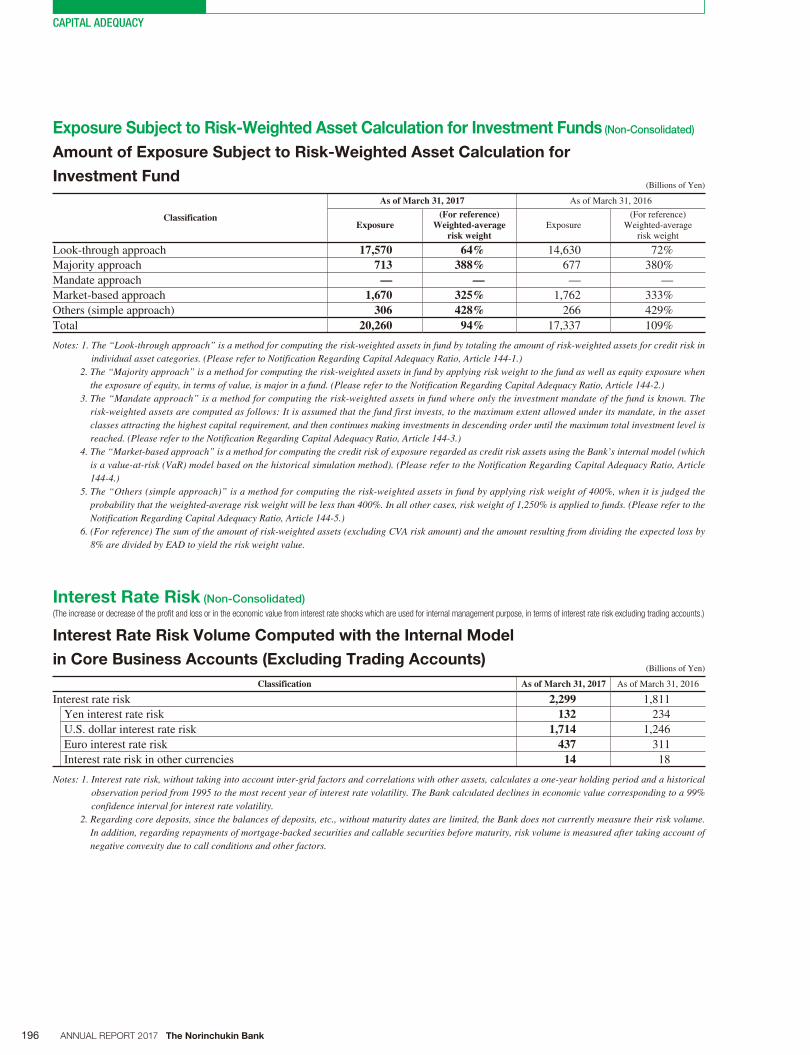
196 ANNUAL REPORT 2017 The Norinchukin Bank
CAPITAL ADEQUACY
Exposure Subject to Risk-Weighted Asset Calculation for Investment Funds (Non-Consolidated)
Amount of Exposure Subject to Risk-Weighted Asset Calculation for
Investment Fund (Billions of Yen)
Classification
As of March 31, 2017 As of March 31, 2016
Exposure(For reference)
Weighted-average risk weight
Exposure(For reference)
Weighted-average risk weight
Look-through approach 17,570 64% 14,630 72%
Majority approach 713 388% 677 380%
Mandate approach — — — —
Market-based approach 1,670 325% 1,762 333%
Others (simple approach) 306 428% 266 429%
Total 20,260 94% 17,337 109%
Notes: 1. The “Look-through approach” is a method for computing the risk-weighted assets in fund by totaling the amount of risk-weighted assets for credit risk in individual asset categories. (Please refer to Notification Regarding Capital Adequacy Ratio, Article 144-1.)
2. The “Majority approach” is a method for computing the risk-weighted assets in fund by applying risk weight to the fund as well as equity exposure when the exposure of equity, in terms of value, is major in a fund. (Please refer to the Notification Regarding Capital Adequacy Ratio, Article 144-2.)
3. The “Mandate approach” is a method for computing the risk-weighted assets in fund where only the investment mandate of the fund is known. The risk-weighted assets are computed as follows: It is assumed that the fund first invests, to the maximum extent allowed under its mandate, in the asset classes attracting the highest capital requirement, and then continues making investments in descending order until the maximum total investment level is reached. (Please refer to the Notification Regarding Capital Adequacy Ratio, Article 144-3.)
4. The “Market-based approach” is a method for computing the credit risk of exposure regarded as credit risk assets using the Bank’s internal model (which is a value-at-risk (VaR) model based on the historical simulation method). (Please refer to the Notification Regarding Capital Adequacy Ratio, Article 144-4.)
5. The “Others (simple approach)” is a method for computing the risk-weighted assets in fund by applying risk weight of 400%, when it is judged the probability that the weighted-average risk weight will be less than 400%. In all other cases, risk weight of 1,250% is applied to funds. (Please refer to the Notification Regarding Capital Adequacy Ratio, Article 144-5.)
6. (For reference) The sum of the amount of risk-weighted assets (excluding CVA risk amount) and the amount resulting from dividing the expected loss by 8% are divided by EAD to yield the risk weight value.
Interest Rate Risk (Non-Consolidated)
(The increase or decrease of the profit and loss or in the economic value from interest rate shocks which are used for internal management purpose, in terms of interest rate risk excluding trading accounts.)
Interest Rate Risk Volume Computed with the Internal Model
in Core Business Accounts (Excluding Trading Accounts) (Billions of Yen)
Classification As of March 31, 2017 As of March 31, 2016
Interest rate risk 2,299 1,811
Yen interest rate risk 132 234
U.S. dollar interest rate risk 1,714 1,246
Euro interest rate risk 437 311
Interest rate risk in other currencies 14 18
Notes: 1. Interest rate risk, without taking into account inter-grid factors and correlations with other assets, calculates a one-year holding period and a historical observation period from 1995 to the most recent year of interest rate volatility. The Bank calculated declines in economic value corresponding to a 99% confidence interval for interest rate volatility.
2. Regarding core deposits, since the balances of deposits, etc., without maturity dates are limited, the Bank does not currently measure their risk volume. In addition, regarding repayments of mortgage-backed securities and callable securities before maturity, risk volume is measured after taking account of negative convexity due to call conditions and other factors.
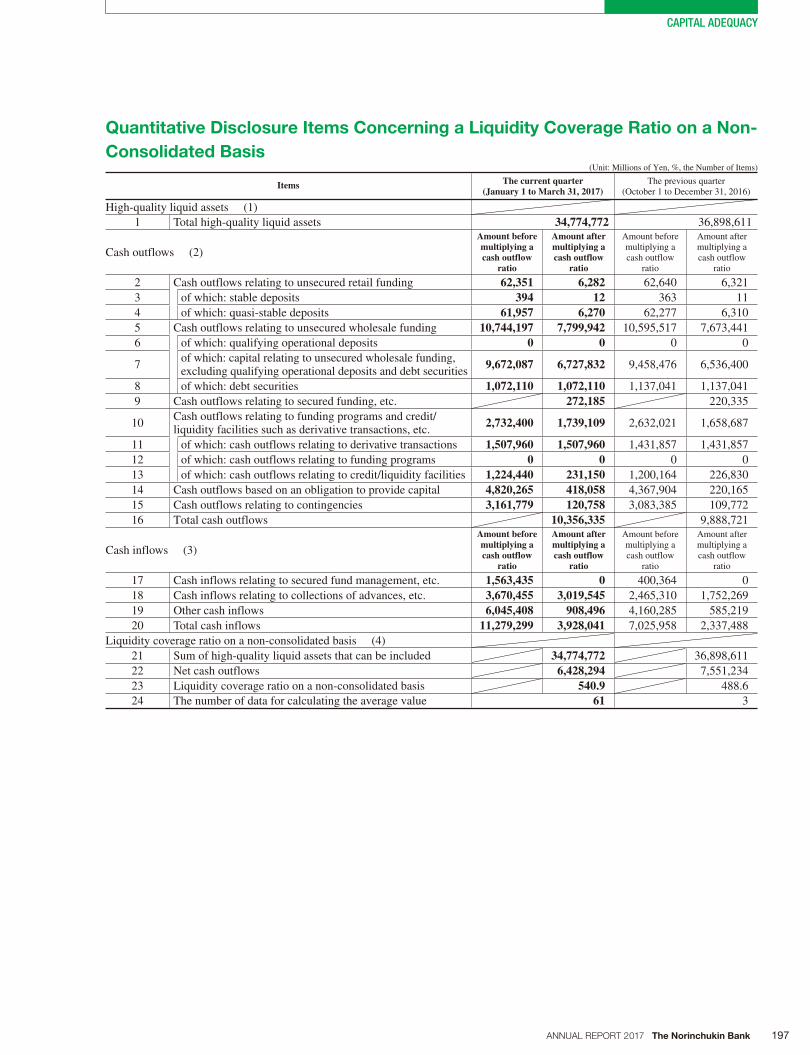
197ANNUAL REPORT 2017 The Norinchukin Bank
CAPITAL ADEQUACY
(Unit: Millions of Yen, %, the Number of Items)
Items The current quarter (January 1 to March 31, 2017)
The previous quarter (October 1 to December 31, 2016)
High-quality liquid assets (1)
1 Total high-quality liquid assets 34,774,772 36,898,611
Cash outflows (2)
Amount before multiplying a cash outflow
ratio
Amount after multiplying a cash outflow
ratio
Amount before multiplying a cash outflow
ratio
Amount after multiplying a cash outflow
ratio
2 Cash outflows relating to unsecured retail funding 62,351 6,282 62,640 6,321
3 of which: stable deposits 394 12 363 11
4 of which: quasi-stable deposits 61,957 6,270 62,277 6,310
5 Cash outflows relating to unsecured wholesale funding 10,744,197 7,799,942 10,595,517 7,673,441
6 of which: qualifying operational deposits 0 0 0 0
7of which: capital relating to unsecured wholesale funding, excluding qualifying operational deposits and debt securities
9,672,087 6,727,832 9,458,476 6,536,400
8 of which: debt securities 1,072,110 1,072,110 1,137,041 1,137,041
9 Cash outflows relating to secured funding, etc. 272,185 220,335
10Cash outflows relating to funding programs and credit/liquidity facilities such as derivative transactions, etc.
2,732,400 1,739,109 2,632,021 1,658,687
11 of which: cash outflows relating to derivative transactions 1,507,960 1,507,960 1,431,857 1,431,857
12 of which: cash outflows relating to funding programs 0 0 0 0
13 of which: cash outflows relating to credit/liquidity facilities 1,224,440 231,150 1,200,164 226,830
14 Cash outflows based on an obligation to provide capital 4,820,265 418,058 4,367,904 220,165
15 Cash outflows relating to contingencies 3,161,779 120,758 3,083,385 109,772
16 Total cash outflows 10,356,335 9,888,721
Cash inflows (3)
Amount before multiplying a cash outflow
ratio
Amount after multiplying a cash outflow
ratio
Amount before multiplying a cash outflow
ratio
Amount after multiplying a cash outflow
ratio
17 Cash inflows relating to secured fund management, etc. 1,563,435 0 400,364 0
18 Cash inflows relating to collections of advances, etc. 3,670,455 3,019,545 2,465,310 1,752,269
19 Other cash inflows 6,045,408 908,496 4,160,285 585,219
20 Total cash inflows 11,279,299 3,928,041 7,025,958 2,337,488
Liquidity coverage ratio on a non-consolidated basis (4)
21 Sum of high-quality liquid assets that can be included 34,774,772 36,898,611
22 Net cash outflows 6,428,294 7,551,234
23 Liquidity coverage ratio on a non-consolidated basis 540.9 488.6
24 The number of data for calculating the average value 61 3
Quantitative Disclosure Items Concerning a Liquidity Coverage Ratio on a Non-
Consolidated Basis
198 ANNUAL REPORT 2017 The Norinchukin Bank
CAPITAL ADEQUACY
Items concerning a change in the non-
consolidated liquidity coverage ratio on
a time-series basis
The non-consolidated liquidity coverage ratio for the cur-
rent quarter maintained a high and stable level.
Items concerning evaluation of the level
of the non-consolidated liquidity cover-
age ratio
The non-consolidated liquidity coverage ratio for the cur-
rent quarter has tended to be well above the minimum level.
Qualitative Disclosure Items Concerning a Liquidity Coverage Ratio on a Non-
Consolidated Basis
Items concerning the details of the sum
of high-quality liquid assets that can be
included
In light of the Bank’s liquidity coverage ratio, there is no
material item.
Other items concerning the non-consoli-
dated liquidity coverage ratio
In light of the Bank’s liquidity coverage ratio, there is no
material item.