a novel method for predicting and mapping the presence of
TRANSCRIPT

A novel method for predicting and mapping the presence of sun glare using
Google Street View
Xiaojiang Li a, Bill Yang Cai a, Waishan Qiu a, Jinhua Zhao b, Carlo Ratti a
a MIT Senseable City lab, Department of Urban Studies and Planning, Massachusetts Institute of Technology, Room 9-250, 77 Massachusetts Avenue, Cambridge, MA, 02139, United States, USA b Department of Urban Studies and Planning, Massachusetts Institute of Technology, Cambridge, MA 02139, United States
Abstract: The sun glare is one of the major environmental hazards that cause traffic accidents.
Every year, many people died and injured in traffic accidents related to sun glare. Providing
accurate information about when and where sun glare happens would be helpful to prevent sun
glare caused traffic accidents and save lives. In this study, we proposed to use publicly accessible
Google Street View (GSV) panorama images to estimate and predict the occurrence of sun glare.
GSV images have view sight similar to drivers, which would make GSV images suitable for
estimating the visibility of sun glare to drivers. A recently developed convolutional neural
network algorithm was used to segment GSV images and predict obstructions on sun glare.
Based on the predicted obstructions for given locations, we further estimated the time windows
of sun glare by estimating the sun positions and the relative angles between drivers and the sun
for those locations. We conducted a case study in Cambridge, Massachusetts, USA. Results
show that the method can predict the presence of sun glare precisely. The proposed method
would provide an important tool for drivers and traffic planners to mitigate the sun glare and
decrease the potential traffic accidents caused by the sun glare.
1. Introduction

The sun glare is one of the major safety hazards that cause traffic accident for drivers (Hagita
and Mori, 2014; Jurado-Piña, 2010). When the sun is low during rising and setting and the
sunlight may enter the field of view of drivers at some time with the right azimuth angles. The
glare caused by sun would create a risk to drivers. The sun glare would impair driver’s vision
and cause temporarily blindness to drivers, both of which are annoying and dangerous for drivers
(Aune, 2017). Hagita and Mori (2014) investigated the effects of sun glare on traffic accidents.
Results show that sun glare is connected with traffic accidents of cars and cyclists. Hagita and
Mori (2013) examined the association between sun glare and bicycle and pedestrian accidents in
Chiba prefecture, Japan. Results show that sun glare increases traffic accidents in cases of
oncoming bicycles and pedestrians encountering turning vehicles significantly. Sun glare would
also slow down traffic flows (Andrew et al., 2012; Auffray et al., 2008). Auffray et al (2008)
found that the presence of sun glare would affect the traffic flow during both congested and
uncongested periods. Andrew et al (2012) studied the connection between the sun glare and the
freeway congestion, and result shows that the presence of sun glare would slow traffics and
cause traffic congestions.
Visor and tinting are very commonly used method to avoid sun glare. However, the visor
would obstruct driver’s overall vision, while driving without obstruction is one of the basic
requirements for safe driving. In addition, the visor and the tinting can only cover small portion
of the front windshield and cannot screen out the sun (Hagita and Mori, 2013). The visor would
also block the driver’s view sight to see the overhead traffic light. For drivers, knowing when
and where the sun glare occurs would help to take some measures to avoid the potential sun glare
caused traffic accidents and congestions. For road builders, knowing the spatio-temporal
distributions of sun glare would help to design safer road networks and provide better driving

experiences to drivers with minimum sun glare. Accurate prediction of the presence of the sun
glare is thus needed.
The occurrence of sun glares is determined by sun’s angle in relation to cars, which is further
influenced by the sun elevation, azimuth, driving direction, and slope. The terrains changes and
obstructions along roads could block the sunlight from shining to driver’s eyes. Currently, using
the digital terrain model and the road network map is the most widely used method to predict the
presence of the sun glare (Hagita and Mori, 2014; Kjetil et al., 2017). The sun position at a
specific time of the vehicle’s relative location can be precisely estimated. Based on the
geometrical model between the driving car and the sun position, the occurrence of the sun glare
can be predicted (Jurado-Piña and Pardillo-Mayora, 2010). While the digital terrain model
considers of the obstruction effect of sun glare caused by the terrain, however, the obstruction of
the building blocks and trees on both sides of roads are not considered in the digital terrain based
method. In addition, the high spatial resolution digital terrain model is usually required for
accurate sun glare prediction. However, high spatial resolution digital terrain models usually are
not available.
In this study, we proposed to use the Google Street View (GSV) panorama images to predict
the occurrence of sun glare. Since GSV images were taken by moving vehicles on the road (Li et
al., 2015), those street-level images would perfectly represent driver’s visual experience in
driving. In addition, GSV images capture the obstructions along roads at a fine level, which
would further provide accurate information of obstructions along roads. We used the state-of-
the-art deep convolutional neural network algorithm to segment GSV images and classify those
obstruction pixels from GSV images. Based on the image segmentation results and the
geometrical model of the sun and drivers, we predicted the presence of sun glare with
consideration of all obstructions such as, terrain changes, trees, buildings, etc. This study would
provide a very cheap and efficient way to predict the spatio-temporal distribution of the sun glare
at a large scale precisely.
2. Methodology
2.1 Study area and dataset preparation
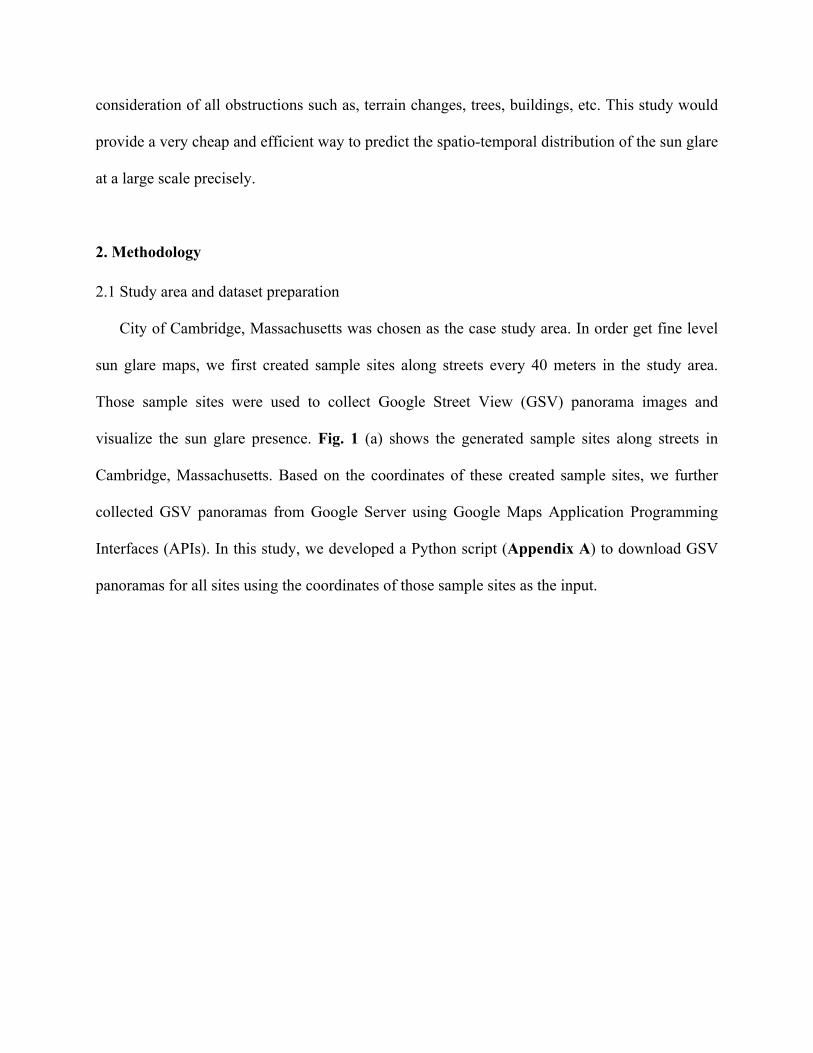
City of Cambridge, Massachusetts was chosen as the case study area. In order get fine level
sun glare maps, we first created sample sites along streets every 40 meters in the study area.
Those sample sites were used to collect Google Street View (GSV) panorama images and
visualize the sun glare presence. Fig. 1 (a) shows the generated sample sites along streets in
Cambridge, Massachusetts. Based on the coordinates of these created sample sites, we further
collected GSV panoramas from Google Server using Google Maps Application Programming
Interfaces (APIs). In this study, we developed a Python script (Appendix A) to download GSV
panoramas for all sites using the coordinates of those sample sites as the input.

Fig. 1. The workflow for GSV panorama collection in Cambridge, (a) the created sample sites (b) the metadata of GSV panoramas, (c) a GSV panorama of one sample site.
2.2 Google Street View (GSV) panoramas segmentation
Recent progresses in artificial intelligence make it possible to recognize obstructions along
streets from GSV panoramas accurately. In this study, we applied the Pyramid Scene Parsing
Network (PSPNet), a deep convolutional neural network trained on the ADE20K dataset (Zhao
et al., 2017; Zhou et al., 2017) to segment GSV panoramas. The PSPNet achieved the state-of-
the-art performance in pixel-level segmentation of complex visual scenes in the ADE20K dataset.

Hence, the validated performance of the PSPNet trained on the ADE20K dataset gives us
confidence in our use of the PSPNet to accurately classify GSV panoramas into sky, buildings,
trees, ground, and other environmental factors. Fig. 2 shows the image segmentation results on
sample GSV images and panoramas using the PSPNet trained on ADE20K dataset. Those non-
sky pixels were considered as obstructions, which would block the glaring sun.
Fig. 2. Image segmentation results on GSV panoramas using pyramid scene parsing convolutional neural network (PSPnet).
2.3 Sun glare prediction

The position of sun (sun elevation θ and azimuth angle φ) can be estimated accurately for any
location (lon, lat) at one specific time (t).
θ = f (lon,lat,t)φ = g(lon,lat,t)
(1)
In this study, we used an open source python module “pysolar” to estimate the sun position
for any location at a specific time.
Fig. 3. The geometrical model of the sun position and the location of vehicle on driveway.

Fig. 3 (a) shows the geometrical model of the sun position and the location of a car driving
through point (lon, lat), therefore, the relative horizontal direction between sun and the car is
(Fig. 3(b)),
h_ glare =|φ −ϕ | (2)
where the φ is the azimuth angle of the sun. The relative vertical angle of the car and sun is
(Fig. 3 (c)),
v _ glare =|θ −θ ' | (3)
where θ’ is the slope angle of the driveway. The driving direction and the slope angle of the
driveway can be accessed from the GSV metadata. Based on previous studies (Jurado-Piña and
Mayora, 2009b; Aune, 2017), if the h_glare and v_glare both are lower than 25 degree and there
is no obstruction of the sun light, sun would cause glare to drivers.
The existence of the obstructions on both sides of the driveways could block the sun glare. In
this study, GSV panoramas were used to judge if the sun glare is obstructed or not based on the
segmented GSV panoramas. Fig. 4 shows the geometrical model of projecting sun positions on
GSV panoramas. The incidence point located on the cylindrical GSV panorama should be (xc,
yc),
xc =ϕ −φ2π
Wc +Cx
yc =Cy −θ −θ 'r0
Hc
(4)
where φ is the azimuth angle of the sun, ϕ is the driving direction, θ is the sun elevation, and θ’
is the tilt angle of GSV panorama, and the (Cx, Cy) is the central pixel of the GSV panorama,

Cx =
Wc
2
Cy =Hc
2
(5)
Whether the sun is obstructed or not can be estimated by judging whether the incidence point
on the GSV panorama is open sky pixel or non-sky obstruction pixel. If the incidence point on
the GSV panorama is non-sky pixels, therefore, the sun is obstructed, and the driver at this
location of this time has no sun glare problem.
Fig. 4. The geometrical model of projecting sun position at a certain time on a cylindrical GSV panorama.
3. Results

The sun glare usually happens during sun rising and sun setting when the sun is very low in
the sky. Fig. 5 shows the profiles of sun elevation and azimuth angles from 5 am to 8 pm on 20th
days of different months in one year at Cambridge, Massachusetts. In Cambridge, June has the
highest sun in one year, and December has the lowest sun in one year (Fig. 5(a-b)).
Fig. 5. The sun elevation and sun azimuth angles from 5am to 8pm on 20th day of different months in Cambridge, MA, (a) the sun diagram of Cambridge in one year, (b) the profiles of the

sun elevation angles from 5 am to 8pm on 20th day of different months, (c) the profiles of sun azimuth angles in one day from 5 am to 8pm on 20th day of different months.
If obstructions are not considered, sun glare happens when the relative horizontal direction
and the relative vertical angle between sun and the car both are less than 25 degree (Fig. 3(b),
(c)). The presence of sun glare is influenced by the locations and the orientations of streets.
Those streets on the direction of the southeast and southwest have larger possibility to have sun
glare in one day. In summer, those streets toward the northeast and northwest will also have the
possibility of having sun glare at morning and afternoon, respectively. In winter, the sun position
is more southward, and the streets on the direction of the northeast and northwest have no sunrise
and sunset sun glare. Table 1 presents the time at hour level and ranges of the street orientations
for sun glare presence for 20th day in different months of 2018 is the obstruction along streets is
not considered. Under no obstruction situation, the street orientation ranges for sun glare
presence shift in different months of one year. Generally, in winter (e.g. December 20th, January
20th), driving toward northeast and northwest will have no risk of meeting sun glare in one day.
The sunrise sun glare and sunset sun glare happen while driving toward southeast and southwest,
respectively. In summer (e.g. June 20th, July 20th), because sun is highest in one year, driving
toward northeast and northwest will have the sunrise and sunset sun glare, respectively.
Table 1. The ranges of street orientations with sunrise and sunset sun glare at Cambridge, MA (42.376, -71.117) based on the 25-degree criteria. Date, 2018 Sunrise sun glare (time, ranges) Sunset sun glare (time, ranges)
January 20th 8 am, [100.87, 150.87] 9 am, [112.51, 162.51] 10 am, [125.72, 175.72]
2 pm, [186.47, 236.47] 3 pm, [199.44, 249.44] 4 pm, [210.87, 260.87]

February 20th 7 am, [83.46, 133.46] 8 am, [94.29, 144.29] 9 am, [106.58, 156.58]
3 pm, [204.39, 254.39] 4 pm, [216.58, 266.58] 5 pm, [227.36, 277.36]
March 20th 8 am, [76.74, 126.74] 9 am, [87.93, 137.93]
5 pm, [225.43, 275.43] 6 pm, [236.31, 286.31]
April 20th 7 am, [59.16, 109.16] 8 am, [69.24, 119.24]
6 pm, [246.62, 296.62] 7 pm, [256.53, 306.53]
May 20th 6 am, [43.47, 93.47] 7 am, [52.95, 102.95]
6 pm, [253.74, 303.74] 7 pm, [263.17, 313.17]
June 20th 6 am, [40.15, 90.15] 7 am, [49.40, 99.40]
6 pm, [255.77, 305.77] 7 pm, [264.92, 314.92] 8 pm, [274.40, 324.40]
July 20th 6 am, [41.43, 91.43] 7 am, [50.93, 100.93]
6 pm, [252.54, 302.54] 7 pm, [261.93, 311.93]
August 20th 7 am, [57.82, 107.82] 8 am, [67.84, 117.84]
6 pm, [246.25, 296.25] 7 pm, [256.14, 306.14]
September 20th 7 am, [68.01, 118.01] 8 am, [78.45, 128.45]
5 pm, [228.65, 278.65] 6 pm, [239.27, 289.27]
October, 20th 8 am, [88.26, 138.26] 9 am, [99.75 149.75]
4 pm, [210.60, 260.60] 5 pm, [222.02, 272.02]
November 20th 7 am, [94.54, 144.54] 8 am, [105.44, 155.44] 9 am, [117.76, 167.76] 10 am, [131.72, 181.32]
1 pm, [178.34, 228.34] 2 pm, [192.28, 242.28] 3 pm, [204.57, 254.57] 4 pm, [215.45, 265.45]
December 20th 8 am, [105.45, 155.45] 9 am, [117.08, 167.08] 10 am, [130.15, 180.15] 11 am, [144.52, 194.52]
12 pm, [159.55, 209.55] 1 pm, [174.28, 224.28] 2 pm, [187.92, 237.92] 3 pm, [200.11, 250.11]

Based on the ranges of street orientation (Table 1), those streets have sunrise glare and
sunset glare on Dec 20th have orientations in range of 105 to 195 and 159 to 251, respectively.
This can be further confirmed by the spatial patterns of the sunrise sun glare (Fig. 6(a)) and
sunset sun glare (Fig. 6(b) on Dec 20th. Those streets orient to southeast have sunrise sun glare,
those streets orient southwest have sunset sun glare. On June 20th, streets with orientation in
ranges of 40 to 60 and 255 to 324 have sunrise and sunset sun glares, respectively. Fig. 6(c, d)
shows the spatial distributions of the sunrise and sunset glares on June 20th, respectively. Those
streets orient to southeast have sunrise sun glare, those streets orient southwest have sunset sun
glare.
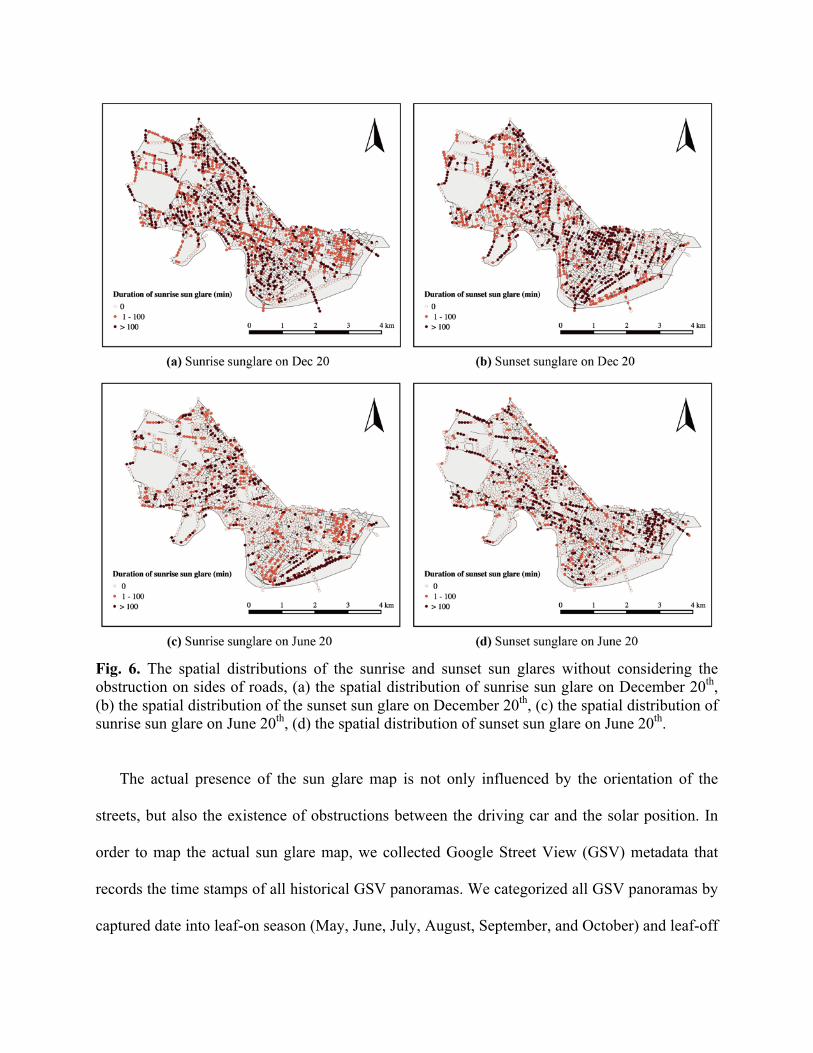
Fig. 6. The spatial distributions of the sunrise and sunset sun glares without considering the obstruction on sides of roads, (a) the spatial distribution of sunrise sun glare on December 20th, (b) the spatial distribution of the sunset sun glare on December 20th, (c) the spatial distribution of sunrise sun glare on June 20th, (d) the spatial distribution of sunset sun glare on June 20th.
The actual presence of the sun glare map is not only influenced by the orientation of the
streets, but also the existence of obstructions between the driving car and the solar position. In
order to map the actual sun glare map, we collected Google Street View (GSV) metadata that
records the time stamps of all historical GSV panoramas. We categorized all GSV panoramas by
captured date into leaf-on season (May, June, July, August, September, and October) and leaf-off
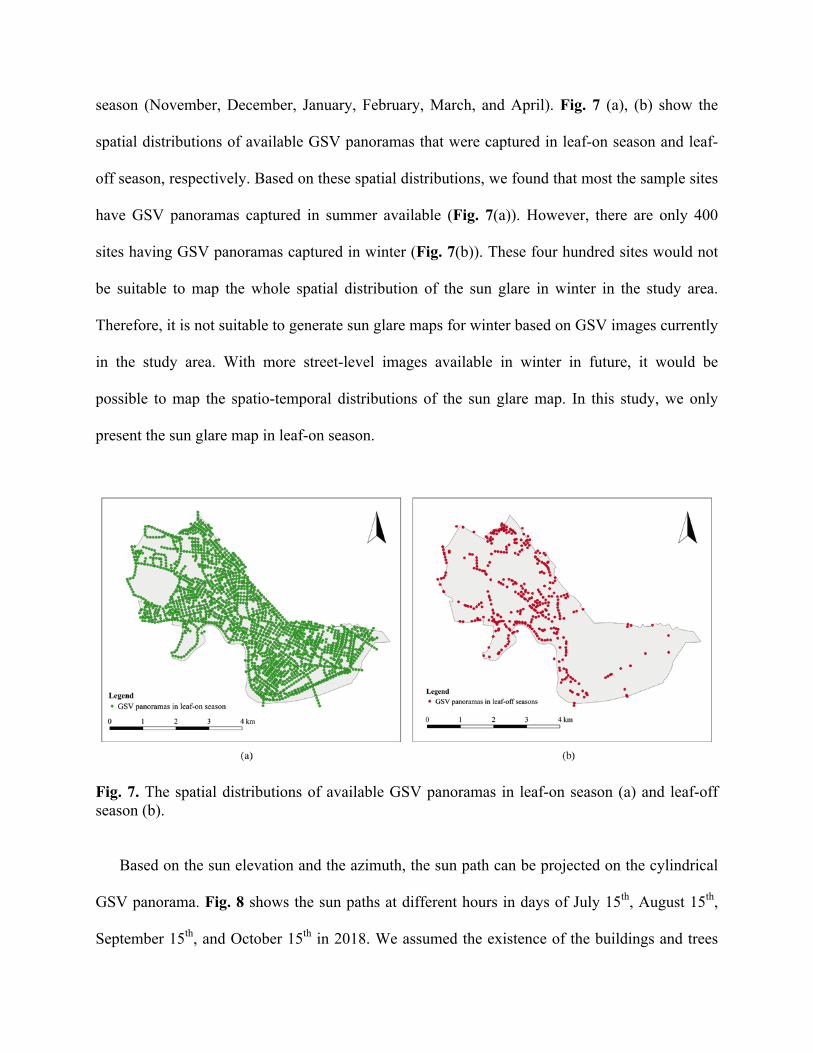
season (November, December, January, February, March, and April). Fig. 7 (a), (b) show the
spatial distributions of available GSV panoramas that were captured in leaf-on season and leaf-
off season, respectively. Based on these spatial distributions, we found that most the sample sites
have GSV panoramas captured in summer available (Fig. 7(a)). However, there are only 400
sites having GSV panoramas captured in winter (Fig. 7(b)). These four hundred sites would not
be suitable to map the whole spatial distribution of the sun glare in winter in the study area.
Therefore, it is not suitable to generate sun glare maps for winter based on GSV images currently
in the study area. With more street-level images available in winter in future, it would be
possible to map the spatio-temporal distributions of the sun glare map. In this study, we only
present the sun glare map in leaf-on season.
Fig. 7. The spatial distributions of available GSV panoramas in leaf-on season (a) and leaf-off season (b).
Based on the sun elevation and the azimuth, the sun path can be projected on the cylindrical
GSV panorama. Fig. 8 shows the sun paths at different hours in days of July 15th, August 15th,
September 15th, and October 15th in 2018. We assumed the existence of the buildings and trees

would block the sun glare. Therefore, sun glare would be obstructed if sun position were not on
sky pixels.
Fig. 8. The sun paths in July 15th, August 15th, September 15th, and October 15th on cylindrical Google Street View panoramas (a) and the segmented cylindrical panoramas (b) at three sites of the study area.
In order to validate the proposed method, we further took in situ measurement in the study
area. Fig. 9 shows the comparison of the predicted sun path of July 5th and actual sun positions
on photos taken at the same location. The predicted result shows that the sun is obstructed at 6:45
pm and the photos taken in fieldwork show that the sun is obstructed at 6:46 pm. We further

compared the predicted sun paths and the actual sun positions at 7 other locations. The validation
results show that the proposed method can estimate the exact time point of sun glare been
blocked with an error of less than 3 minutes, which further prove that the proposed method can
estimate the sun glare with high accuracy.
Fig. 9. The comparison of the predicted sun path on a GSV panorama and three photos taken at the same location at three different time points of July 5th, 2018, (a) the sun path of July 5th on a GSV panorama, (b) three photos taken at the same location at different times, (c) the overlay of sun path of July 5th on the segmented GSV panorama, black part represents obstruction pixels and white part represent the sky pixels.
Fig. 10 shows the spatial distributions of the sun glare in the study area on June 20th and
September 20th with consideration of obstructions along the streets. Compared with the sun glare
maps without considering the obstruction (Fig. 6), the existence of obstructions along the street

sides reduces the occurrence and duration of sunrise and sunset sun glares significantly. On June
20th, these streets in the southern Cambridge, especially the Memorial Drive, are exposed to
sunrise sun glare more than the rest areas. Those streets in the northwestern and the eastern
Cambridge have more potential sunset sun glare presence than other regions on June 20th.
Fig. 10. The spatial distributions of sun glares in Cambridge, MA on June 20th and September 20th, 2018 with consideration of obstructions, (a) the spatial distribution of the sunrise glare on June 20th, (b) the spatial distribution of the sunset glare on June 20th, (c) the spatial distribution of sunrise glare on September 20th, (d) the spatial distribution of actual sunset glare on September 20th.

4. Discussion
Sun glare is one of the most annoying and dangerous hazards caused by weather for most
drivers. It is important for drivers to be informed the potential presence of sun glare in order to
avoid sun glare caused accidents. Based on the geometrical model of sun position and the
locations of drivers, it is possible to predict the occurrence of sun glare by judging the relative
angle with sun from the perspective of drivers. In order to predict the occurrence of sun glare,
three major factors need to be considered, sun position, the driving direction, and the
surrounding obstructions. Different from previous studies using digital terrain models to predict
the sun glare, this study proposed to use the publicly accessible and globally available Google
Street View (GSV) panoramas to predict and map the presence of sunrise and sunset sun glares.
Considering the fact that GSV images were captured by vehicles on driveways, therefore, the
GSV represents what drivers can see on driveways, which would make GSV based method more
suitable to predict the sun glare. The presence of obstruction of sun glare at one location of a
specific time can be judged by overlaying the sun position on the corresponding GSV panorama
and checking whether the sun is located on obstruction or sky pixels in segmented GSV
panorama. Therefore, the proposed GSV based sun glare prediction method can predict the
presence of the sun glare more accurately and objectively.
The proposed method was applied to Cambridge, Massachusetts to map the spatio-temporal
distributions of sunrise and sunset sun glares. Results show that the sun glare distributions
change significantly in different months of one year. The orientation ranges of streets that
potentially have sun glares change monthly, because of the changing sun paths in different
months. Validation results show that the method can help to predict the sun glare precisely.
Theoretically, the method can generate the presence of the sun glare map at day level. In this

study, for illustration purpose, we presented the sun glare maps in two days of different months
in one year.
The proposed method is totally automatic, and without any human intervention. Therefore,
the proposed method provides a simple way to predict the sun glare on driveways at large scales.
In addition, the study is based on road networks and the publicly accessible GSV images.
Therefore, the method can be applied to any place with GSV service available. This would be
very important for those areas with no high spatial resolution spatial data (digital terrain model
and building height model, or digital surface model) available.
Previous studies have used the digital terrain models to predict the presence of the sun glare.
However, the digital terrain models usually have very low spatial resolutions, and buildings and
trees, which would obstruct the sun glares, are usually not considered. Different from the digital
terrain model based model for sun glare prediction, the proposed GSV based method applies the
geometrical model of the sun and cars to cylindrical GSV panoramas to predict the obstruction of
sun glares at any given time for any given location from driver’s perspective. The GSV based
method considers the influence of fine-level obstructions on roadsides, such as trees and building
blocks.
The proposed method for sun glare prediction would help drivers to be informed about the
potential sun glares while driving. For navigators and auto insurance companies, the sun glare
map can help them to notify the potential sun glare presences to drivers and customers, which
would help drivers and customers to get a better and safer driving experience. The proposed
method for sun glare prediction can also provide useful information for the Department of
Transportation. The maintainers of roads can zone those high risky areas and take measure to
minimize the potential negative impacts of sun glare on drivers.

There are still some limitations in this study. The seasonal change of the street greenery
would also influence the presence of the sun glare considering the fact that street greenery cannot
block the sun glare in leaf-off season. In this study, we only generated the sun glare maps during
leaf-on season since the unavailability of GSV images taken in leaf-off season. Future studies
should also generate the sun glare presence map for leaf-off season, when the street-level images
are available for leaf-off season. Secondly, current method only considers the occurrence of the
sun glare and the intensity of the sun glare is not considered. Future studies should also consider
the intensities of sun glares and the impacts of different sun glare intensities on people of
different age-gender groups. In addition, more studies need to be done about how the sun glare
influencing the driving experience and the traffic accidents at a large scale.
5. Conclusions
This study proves that it is possible to use Google Street View images to predict and map the
occurrence of the sun glare accurately. The proposed method in this study would help to generate
the spatio-temporal distribution of the occurrence of sun glare, which would help drivers, cyclists,
and pedestrians to minimize the negative impacts of sun glare and decrease the potential traffic
accidents caused by sun glares. The generated spatio-temporal distribution of sun glare would
also help policy makers to redesign road infrastructures to curb the influence of sun glare on
drivers, cyclists, and pedestrians. Considering the public accessibility and global availability of
street-level images, this study would bring a general way to predict the sun glare and forecast the
sun glare for anywhere with street-level images available.

Reference
Aune, K. (2017). Sun Glare Detection and Visualization (Master's thesis, NTNU).
Andrew M. Churchill, Yorghos Tripodis, and David J. Lovell. Sun glare impacts on freeway
congestion: Geometric model and empirical analysis. Journal of Transportation
Engineering, 138(10): 1196–1204, 2012.
Hagita and Mori, (2013), Analysis of the Influence of Sun Glare on Bicycle or Pedestrian
Accidents with Turning Vehicle, 13th World Conference on Transport Research.
Hagita, K., & Mori, K. (2014). The effect of sun glare on traffic accidents in Chiba prefecture,
Japan. Asian Transport Studies, 3(2), 205-219.
Jurado-Pina, R. and Pardillo-Mayora, J. M. (2009a): Methodology to Predict Driver Vision
Impairment Situations Caused by Sun Glare, TRB 2009 Annual Meeting CD-ROM, 09-
1429
Jurado-Piña, R., & Pardillo Mayora, J. (2009b). Methodology to predict driver vision impairment
situations caused by sun glare. Transportation Research Record: Journal of the
Transportation Research Board, (2120), 12-17.
Jurado-Pina, R., Pardillo-Mayora, J. M. and Jimenez, R. (2010): Methodology to Analyze Sun-
Glare-Related Safety Problems at Highway Tunnel Exits, Journal of Transportation
Engineering, No.6, p545-553.
Li, X., Ratti, C., & Seiferling, I. (2018). Quantifying the shade provision of street trees in urban
landscape: A case study in Boston, USA, using Google Street View. Landscape and Urban
Planning, 169, 81-91.
Zhou, B., Zhao, H., Puig, X., Fidler, S., Barriuso, A. and Torralba, A., 2017, July. Scene parsing
through ADE20K dataset. In Proc. CVPR.
Zhao, H., Shi, J., Qi, X., Wang, X. and Jia, J., 2017, July. Pyramid scene parsing network. In
IEEE Conf. on Computer Vision and Pattern Recognition (CVPR) (pp. 2881-2890).