a new model for estimating peak vo2 based on post · pdf filesee discussions, stats, and...
TRANSCRIPT
Seediscussions,stats,andauthorprofilesforthispublicationat:http://www.researchgate.net/publication/281710686
ANewModelforEstimatingPeakVO2BasedonPost-ExerciseMeasurementsinSwimming
ARTICLEinINTERNATIONALJOURNALOFSPORTSPHYSIOLOGYANDPERFORMANCE·SEPTEMBER2015
ImpactFactor:2.68·DOI:10.1123/ijspp.2015-0227
DOWNLOADS
27
VIEWS
65
5AUTHORS,INCLUDING:
DiegoChaverri
UniversityofBarcelona
19PUBLICATIONS17CITATIONS
SEEPROFILE
T.Schuller
DeutscheSporthochschuleKöln
8PUBLICATIONS1CITATION
SEEPROFILE
XavierIglesias
NationalInstituteofPhysicalEducation(INE…
77PUBLICATIONS111CITATIONS
SEEPROFILE
FerranA.Rodríguez
UniversityofBarcelona
170PUBLICATIONS1,017CITATIONS
SEEPROFILE
Availablefrom:FerranA.Rodríguez
Retrievedon:21September2015
For Peer Review
A Model for Estimating Peak Oxygen Uptake Based on Post-
Exercise Measurements in Swimming
Journal: International Journal of Sports Physiology and Performance
Manuscript ID: IJSPP.2015-0227.R2
Manuscript Type: Original Investigation
Keywords: exercise physiology, sport physiology, kinetics, aerobic
Human Kinetics, 1607 N Market St, Champaign, IL 61825
International Journal of Sports Physiology and Performance

For Peer Review
1
Submission Type: Original Investigation 1
Text-Only Word Count: 2510 2
Abstract Word Count: 222 3
Running Head: Peak VO2 estimation in swimming 4
Table: 1; Figures: 2 5
6
7
A New Model for Estimating Peak VO2 Based on Post-Exercise Measurements in 8
Swimming 9
10
Diego Chaverri1, Thorsten Schuller2, Xavier Iglesias1, Uwe Hoffmann2, Ferran A. 11
Rodríguez1 12
13
14 1 INEFC-Barcelona Sport Sciences Research Group, Institut Nacional d’Educació Física 15
de Catalunya, Universitat de Barcelona, Barcelona, Spain 16 2 Institut für Physiologie und Anatomie, Deutsche Sporthochschule Köln, Cologne, 17
Germany 18
19
20
21
22
23
24
� Prof. Ferran A. Rodríguez 25
Institut Nacional d’Educació Física de Catalunya (INEFC) 26
Universitat de Barcelona 27
Av. de l´Estadi 12-22, 08038 Barcelona, Spain. 28
Phone: + 34 93 425 54 45 29
E-mail: [email protected] 30
Page 1 of 14
Human Kinetics, 1607 N Market St, Champaign, IL 61825
International Journal of Sports Physiology and Performance

For Peer Review
2
ABSTRACT 31
Purpose: Assessing cardiopulmonary function during swimming is a complex and 32
cumbersome procedure. Backward extrapolation is often used for predicting peak 33
oxygen uptake ( 2peakoV& ) during unimpeded swimming, but error can derive from a delay 34
at the onset of recovery. We assessed the validity of a mathematical model based 35
on heart rate (HR) and post-exercise kinetics for the estimation of 2peakoV& during 36
exercise. Methods: 34 elite swimmers performed a maximal front crawl 200-m swim. 37
was measured breath-by-breath and HR from beat-to-beat intervals. Data were time 38
aligned and 1-s interpolated. Exercise 2peakoV& was the average of the last 20 s of 39
exercise. Post-exercise was the first 20-s average during the immediate recovery. 40
Predicted values ( ) were computed using the equation:41
)HR(HR· )( o=)( o exercise-end22 ttVtVp && . Average values were calculated for different 42
time intervals and compared to measured exercise 2peakoV& . Results: Post-exercise 43
(0-20 s) underestimated 2peakoV& by 3.3% (95% CI = -9.8 under- to 3.2% overestimation; 44
mean difference = -116 ml·min-1; SEE = 4.2%; p = 0.001). The best 2peakoV& estimates 45
were offered by from 0-20 s (r2 = .96; mean diff. = 17 ml·min-1; SEE = 3.8%). 46
Conclusions: The high correlation (r2 = .86–-.96) and agreement between exercise and 47
predicted support the validity of the model, which provides accurate 2peakoV& 48
estimations after a single maximal swim whilst avoiding the error of backward 49
extrapolation and allowing the subject to swim completely unimpeded. 50
Key words: maximal oxygen uptake; oxygen kinetics; backward extrapolation; 51
modelling; heart rate 52
53
INTRODUCTION 54
The assessment of cardiopulmonary gas exchange and oxygen uptake ( ) in 55
swimming is a complex and cumbersome procedure and still faces limitations imposed 56
by the water environment and the equipment (see Sousa et al.1 for a review). 57
Specifically, in-water measurements require breathing through a snorkel connected with 58
a system of tubes and built-in valves that allows collecting the expired gases whilst 59
keeping dry the inspiratory and expiratory tubes, as well as the analysers. From a 60
technical standpoint, two main indirect calorimetric approaches have been used to 61
collect and analyse expiratory gases in swimming: (1) measurements during exercise 62
using snorkels with built-in valves connected to Douglas bags,2-4 open-circuit metabolic 63
charts,5,6 or breath-by-breath portable gas analysers;7 and (2) post-exercise 64
measurements with gas collection via facemask or mouthpiece connected to Douglas 65
bags8 or open-circuit metabolic charts.9 66
To enable continuous measurements in the field, portable gas analysers are now 67
preferred by many investigators because of their more advantageous sampling 68
capability, practicality, and acceptable level of accuracy.7,10 However, the inability for 69
swimmers to execute diving starts and underwater gliding after starts and turns, which 70
play a major role in the overall swimming performance, also impairs the ecological 71
validity of measurements. Even if these constraints do not prevent to investigatethe 72
investigation of many aspects of the physiological response during swimming, the 73
2oV&
2oV&
2oV&
2oV&
2oV& 2oVp &
2oV&
2peakOVp &
2oV&
2oV&
2oV&
Page 2 of 14
Human Kinetics, 1607 N Market St, Champaign, IL 61825
International Journal of Sports Physiology and Performance

For Peer Review
3
measurement of the respiratory function during exercise does restrict the full expression 74
of performance capacity in pool conditions, particularly during maximal swimming. For 75
instance, all-out 100-m front crawl and breastroke swims were ~5-6% slower when 76
using a snorkel compared to unimpeded swimming.11 An alternative procedure to 77
‘during-swimming’ measures is the backward extrapolation (BE) of the O2 recovery 78
curve, first described by di Prampero et al.12 and validated by Léger et al.13 Montpetit et 79
al. compared values obtained using the Douglas bag technique in a multistage 80
free-swimming test with those predicted using the BE method (i.e., recovery from the 81
same swimming test), as well as with those measured during an uphill treadmill running 82
test.8 Despite finding good method agreement, they concluded that, to ensure the 83
validity of the method, short duration exercises (<5 min) and supramaximal intensities 84
should be avoided as a delay in the onset of O2 recovery may appear. Another approach 85
was used by Costill et al.,14 who showed a good agreement between during 86
maximal and submaximal swimming and a single 20-s expired gas collection taken 87
immediately after a 4-7 min swim. However, breath-by-breath post-exercise 88
measurements confirmed the occurrence of a delay at the onset of the recovery 89
curve and identified a plateau in many —but not all— swimmers, suggesting this to be 90
the main source of error in these two estimation procedures.9,15 91
To overcome these limitations and to improve the estimation of from 92
post-exercise measurements, our group recently proposed a mathematical model based 93
on HR and off-transient kinetics.16 In short, based on the Fick’s principle, the 94
model calculates a predicted at a given time of recovery using the HR as a proxy 95
for changes in cardiac output, and the oxygen pulse as a proxy for the arteriovenous O2 96
difference.17 97
The aim of the present study was to assess the validity of this model by 98
comparing direct measurements during the final period of the swimming 99
exercise (reference method) with the one predicted by the model, as well as the one 100
indirectly estimated from a single 20-s measurement during recovery.14 Furthermore, 101
different recovery intervals were investigated in an attempt to enhance the accuracy of 102
estimation using the model. 103
104
METHODS 105
Subjects 106
Thirty-four elite swimmers, all members of national and Olympic teams, including 18 107
females (mean ± SD: age 20.8 ± 3.5 years, height 173.2 ± 5.8 cm, body mass 64.5 ± 5.6 108
kg) and 16 males (age 22.7 ± 3.6 years, height 186.8 ± 6.0 cm, body mass 80.8 ± 7.7 109
kg), voluntarily participated in this study. Informed consent was obtained from all 110
individual participants included in the study and their legal guardians when appropriate. 111
The study had received approval from the Ethics Committee for Clinical Sport Research 112
of Catalonia in accordance of the 1964 Helsinki declaration and its later amendments. 113
114
Design 115
All tests were conducted in a 50-m indoor pool (temperature: water 26–-27ºC, air 27–-116
28ºC). After a ~30 min swimming-based warm-up followed by 10 min of passive 117
recovery on pool side, participants completed an all-out 200-m front crawl swim to 118
determine exercise . After exercise, the swimmers remained still in an upright 119
peak2oV&
peak2oV&
2oV&
peak2oV&
2oV&
2oV&
peak2oV&
peak2oV&
peakV 2o&
Page 3 of 14
Human Kinetics, 1607 N Market St, Champaign, IL 61825
International Journal of Sports Physiology and Performance
For Peer Review
4
position immersed up to the sternum. In-water starts and touched open turns with no 120
underwater gliding were performed. 121
122
Methodology 123
was measured using a telemetric portable gas analyser (K4 b2, Cosmed, Italy) held 124
over the head of the swimmer by an assistant following the swimmers along the pool. 125
The equipment was connected to the swimmer by a low hydrodynamic resistance 126
respiratory snorkel and valve system, previously validated both in vivo18 and using a gas 127
exchange simulator.19 The gas analysers were calibrated before each test with gases of 128
known concentration (16% O2, 5% CO2) and the turbine volume transducer was 129
calibrated by using a 3-l syringe according to the manufacturer’s instructions. 130
Pulmonary gas exchanges were measured breath-by-breath 1 min before, during, and 3 131
min post-exercise. HR was continuously measured using waterproof beat-to-beat 132
monitors (CardioSwim, Freelap, Switzerland). 133
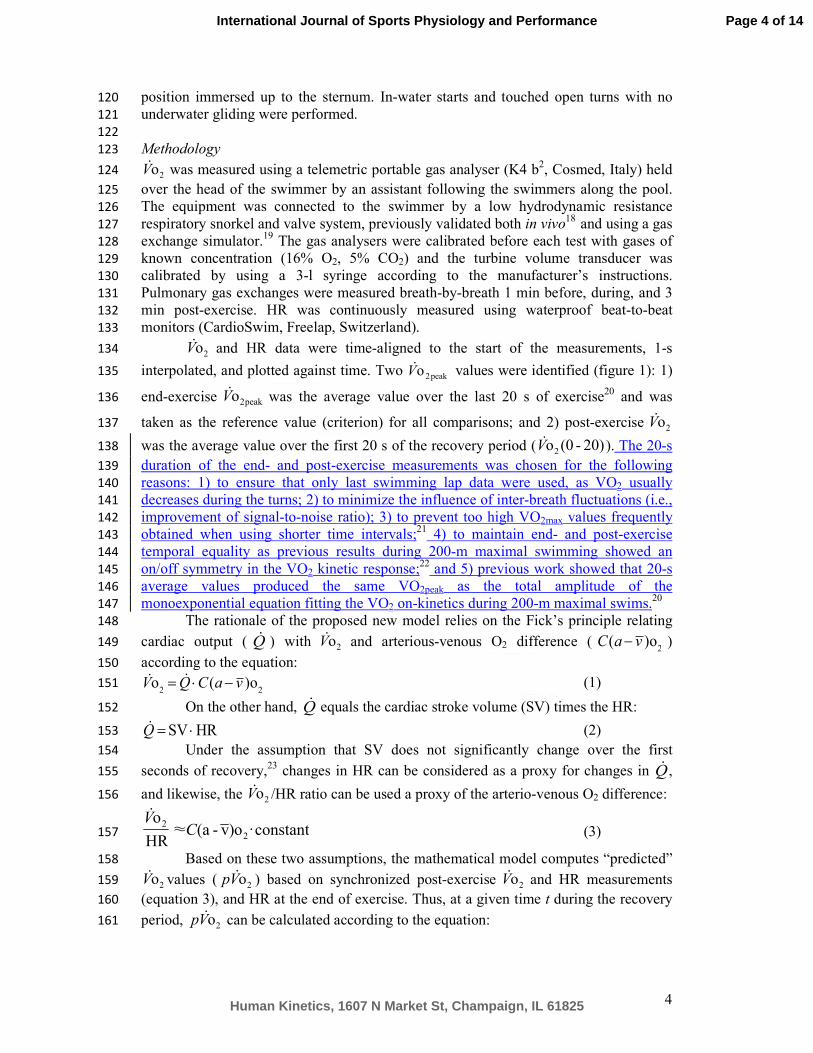
and HR data were time-aligned to the start of the measurements, 1-s 134
interpolated, and plotted against time. Two values were identified (figure 1): 1) 135
end-exercise was the average value over the last 20 s of exercise20 and was 136
taken as the reference value (criterion) for all comparisons; and 2) post-exercise 137
was the average value over the first 20 s of the recovery period ( ). The 20-s 138
duration of the end- and post-exercise measurements was chosen for the following 139
reasons: 1) to ensure that only last swimming lap data were used, as VO2 usually 140
decreases during the turns; 2) to minimize the influence of inter-breath fluctuations (i.e., 141
improvement of signal-to-noise ratio); 3) to prevent too high VO2max values frequently 142
obtained when using shorter time intervals;21 4) to maintain end- and post-exercise 143
temporal equality as previous results during 200-m maximal swimming showed an 144
on/off symmetry in the VO2 kinetic response;22 and 5) previous work showed that 20-s 145
average values produced the same VO2peak as the total amplitude of the 146
monoexponential equation fitting the VO2 on-kinetics during 200-m maximal swims.20 147
The rationale of the proposed new model relies on the Fick’s principle relating 148
cardiac output ( ) with and arterious-venous O2 difference ( ) 149
according to the equation: 150
&Vo2= &Q ⋅C(a− v )o
2 (1) 151
On the other hand, equals the cardiac stroke volume (SV) times the HR: 152
(2) 153
Under the assumption that SV does not significantly change over the first 154
seconds of recovery,23 changes in HR can be considered as a proxy for changes in , 155
and likewise, the /HR ratio can be used a proxy of the arterio-venous O2 difference: 156
constant ·o)v-a(≈HR
o2
2C
V& (3) 157
Based on these two assumptions, the mathematical model computes “predicted” 158
values ( ) based on synchronized post-exercise and HR measurements 159
(equation 3), and HR at the end of exercise. Thus, at a given time t during the recovery 160
period, can be calculated according to the equation: 161
2oV&
2oV&
peak2oV&
peak2oV&
2oV&
20)-(0o2V&
&Q 2oV& C(a− v )o2
&Q
&Q =SV ⋅HR
&Q
2oV&
2oV& 2oVp & 2oV&
2oVp &
Page 4 of 14
Human Kinetics, 1607 N Market St, Champaign, IL 61825
International Journal of Sports Physiology and Performance

For Peer Review
5
exercise-end2
2 HR)HR(
)( o=)( o
t
tVtVp
&& (4) 162
where, is the predicted(modelled) post-exercise 2oV& at time t; is the 163
post-exercise 1-s interpolated at time t; HR(t) is the post-exercise 1-s interpolated 164
HR value at time t; and HRend-exercise is the highest value of the last 10-s average HR at 165
the end of exercise (excluding single peaks higher than 5 bpm than the rest, 166
corresponding to ~1 SD from mean HR during the last 10 s of exercise). 167
In an attempt to enhance the accuracy of the estimation, was compared 168
with at different time intervals (t=0–20, 5–20, 10–20, 15–20, 5–15, and 10–15 s), 169
which were expressed as , , , , 170
, and . 171
172
Statistical analysis 173
Descriptive data are presented as mean, standard deviation (± SD), and mean difference. 174
Normality of distributions and homogeneity of variances were verified using the 175
Shapiro-Wilk’s and Levene’s tests, respectively. A one-way analysis of variance with 176
repeated measures (RM-ANOVA) and post-hoc Tukey's test if appropriate were used 177
for multiple comparisons between (criterion value) and each of the post-exercise 178
measured and predicted values. The Pearson's coefficient of determination (r2) was used 179
to assess correlation between variables. Mean difference plots24 were used to assess 180
agreement between measured and predicted values. The level of significance was set at 181
p < 0.05. Statistical analyses were conducted using SPSS 15.0 (SPSS Inc., Chicago, 182
USA). 183
184
RESULTS 185
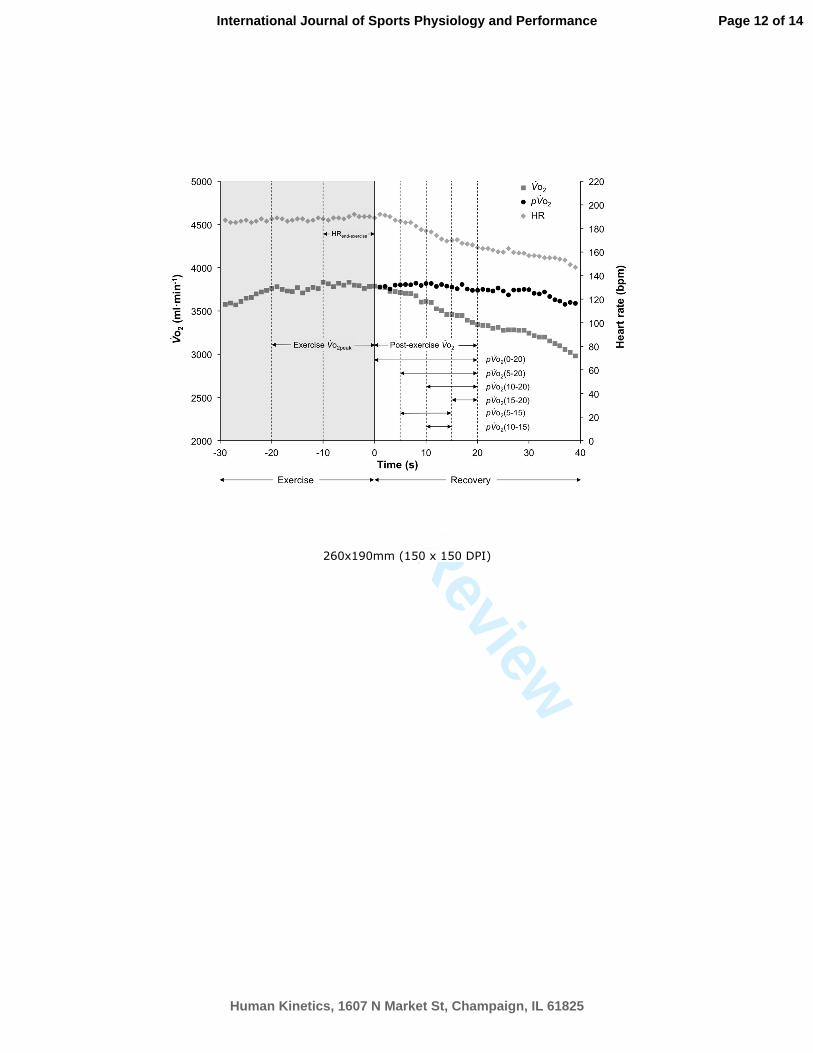
Figure 1 shows an example of HR and over the last 30 s of the exercise and the 186
immediate recovery, as well as the predicted values for different post-exercise 187
intervals in one participant. In accordance with previous results,22,25 no evidence of a 188
slow component was observed in any swimmer as exercise duration constrained the 189
appearance of phase III of the kinetics.26 190
191
***Figure 1*** 192
193
Table 1 summarizes the comparisons between measured during exercise and 194
post-exercise measured and predicted values at different time intervals. End-exercise 195
(criterion value) was 3.3% higher than post-exercise . All predicted 196
were highly correlated with (r2 = 0.86–-0.96) and were not different from the 197
criterion value (p > 1.0-0.76–1.0). The best estimate (i.e. lowest bias) of exercise 198
was offered by (r2 = 0.96; mean diff. = 17 ml·min-1, SEE = 3.8%) 199
and (r2= = .94; mean diff. = 13 ml·min-1, SEE = = 4.7%). 200
201
***Table 1*** 202
203
)(o2 tVp & &Vo2(t)
2oV&
peak2oV&
2oVp &
)200(o2 −Vp & )205(o2 −Vp & )2010(o2 −Vp & )2015(o2 −Vp &
)155(o2 −Vp & )1510(o2 −Vp &
peak2oV&
2oV&
2oVp &
2oV&
peak2oV&
peak2oV& 20)-(0o2V&
2oVp &
peak2oV& )200(o2 −Vp &
)205(o2 −Vp &
Page 5 of 14
Human Kinetics, 1607 N Market St, Champaign, IL 61825
International Journal of Sports Physiology and Performance

For Peer Review
6
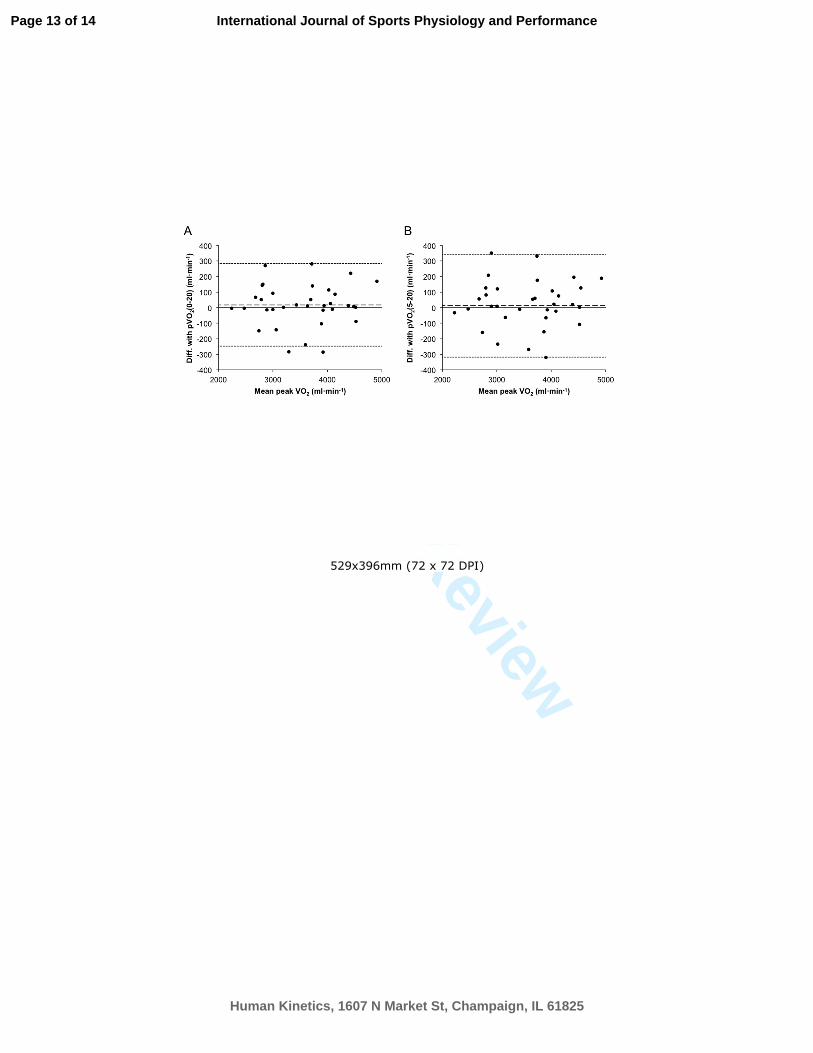
Figure 2 provides the Bland-Altman difference plots showing good agreement between 204
exercise and predicted recovery and data. 205
206
***Figure 2*** 207
208
209
DISCUSSION 210
Our main finding was that the proposed mathematical model based on HR kinetics and 211
post-exercise measurements in a maximal 200-m swim is a valid procedure of 212
estimating in competitive swimmers, with optimal predictive capacity if based 213
on measurements obtained during 20 s after the cessation of exercise. We also found 214
that assessing by using a single 20-s measurement during recovery as proposed 215
by Costill and coauthors14 is likely to underestimate true exercise by 3.3% on 216
average (95% CI =: 9.8 under- to 3.2% overestimation). 217
As previously explained, the model relies on the Fick’s principle (eq. 1 and 2), 218
and its basic assumption is that SV remains nearly constant during the first seconds of 219
recovery (eq. 3). The validity of this assumption needs further discussion. Following 220
light to moderate exercise, it has been shown that SV does not fall as rapidly as HR 221
does after exercise and remains above exercise levels23 for as long as 3 to 5 min,23,27,28 222
especially in the upright position.28 Sustained high during the recovery phase was 223
also demonstrated, explaining the on-/off-transient kinetics asymmetry (i.e. slower 224
off-transient time constant, also confirmed in 200-m maximal swimming22), appearing 225
to be a result of both SV and HR being maintained to ensure a sufficiently high O2 flow 226
to the muscle during recovery at a time when the muscle remains high.29 Therefore, 227
the decrease in (and consequently ) would occur mainly by decreased post-228
exercise HR. On the other hand, Sheldahl et al.30 suggested that the central 229
redistribution of blood volume with head-out water immersion cycling exercise at 40, 230
60 and 80% of 2maxoV& , leading to an increase in SV without a proportional decrease in 231
HR, evidences that is regulated at a higher level during upright exercise in water 232
compared with that on land. Although there is no available evidence that this response 233
pattern takes place during maximal exercise, in line with these reports, some of our 234
subjects showed a little rise in while HR remained constant immediately after the 235
cessation of exercise, which can be loosely interpreted as a rise in SV. This rise could 236
also be explained by the change in body position from horizontal to vertical; the lower 237
part of the body is now deep immersed and under a hydrostatic pressure gradient, which 238
would translocate blood from the lower limbs and abdomen into the thoracic region, 239
thus increasing venous return and SV compared to the horizontal position.31 We suggest 240
that this increase in SV is possibly the reason for the small overestimation of exercise 241
when shorter time intervals were used, such as in calculating and 242
(table 1). 243
A second assumption of the model is that remains nearly constant 244
during the first seconds of recovery. This assumption relies on the fact that a certain 245
venous volume with constant O2 saturation can be assumed to occur during the 246
immediate recovery while arterial saturation is constant. Because of the distance 247
peak2oV& )200(o2 −Vp & )205(o2 −Vp &
2oV&
peak2oV&
peak2oV&
peak2oV&
&Q
2oV&
2oV&
&Q 2oV&
&Q
2oV&
peak2oV& )155(o2 −Vp &
)1510(o2 −Vp &
C(a− v )o2
Page 6 of 14
Human Kinetics, 1607 N Market St, Champaign, IL 61825
International Journal of Sports Physiology and Performance

For Peer Review
7
between muscle and mouth, substantial changes in over the first seconds of 248
recovery are not to be expected, as shown by Drescher et al.17 As shown in figure 1,249
values do not decline over the first 20 s after the cessation of exercise, which is 250
likely the time for the onset of changes in perceivable in the exhaled air. On 251
the other hand, the high correlation and the low mean difference between during 252
exercise and strengthen the validity of the physiological assumptions of 253
the model. In the present findings, the off-kinetics isare virtually parallel to HR off- 254
kinetics during the first 20 s of recovery, suggesting that no substantial changes in 255
and SV occurred within this time period. Therefore, it seems justified to use 256
HR on- and off-kinetics as a proxy of dynamic response during the early recovery 257
within the limited scope of practical application of the model. 258
From another standpoint, the observation that and 259
provided the smallest estimation bias of during exercise is in agreement with 260
previous findings, showing a time-variable delay in the recovery curve after 261
maximal swimming.15 Our results show that this was likely to be the reason for (1) the 262
~20% overestimation of found by Lavoie et al. after an 400-m swim,32 and (2) 263
the similar results reported by Costill et al., who found a decline in during the first 264
20 s after the cessation of exercise causing a ~6% overestimation of after 4-7 min 265
of tethered swimming.14 Differences in methods of assessment and instrumentation 266
among these studies (e.g., Douglas bags vs. modern breath-by-breath oximeters) would 267
certainly explain at least some of these discrepancies. Concerning the variability of the 268
estimated parameters (figure 2, table 1), in which some predicted values deviate up to 269
~8% from measured values, we need to consider that the SEE for , the best 270
predictor variable, was 3.82%, very similar to the SEE for postexercise measured 271
(4.15%). This suggests that the main reason for these larger deviations is measurement 272
error, not inherent to the modelling procedure. Hyperventilation during the immediate 273
recovery appears to be the most straightforward explanation. 274
275
Practical applications 276
The proposed model allows to minimize the error in predicting from recovery 277
measurements after a maximal swim, with the practical advantage of avoiding the use of 278
respiratory equipment during swimming and, thus, allowing the swimmer to utilise their 279
normal breathing pattern and the full use of high-speed swimming technique and of the 280
specifically trained muscle mass in pool conditions. 281
From a technical standpoint, three conditions are required to ensure the validity 282
of the results: 1) obtaining quality beat-to-beat HR recordings, 2) obtaining the first 283
breath-by-breath values as fast as possible while avoiding missing breaths and 284
hyperventilation (e.g., as when swimmers are incorrectly advised to hold their breath 285
during the final strokes), and 3) monitoring HR and during a recovery period of at 286
least 20 s to avoid over- or underestimation. 287
Further validation of the model would imply comparing direct 2oV& 288
measurements with model-predicted values on swimming bouts of different duration 289
C(a− v )o2
2oVp &
C(a− v )o2
peak2oV&
)200(o2 −Vp &
2oV&
C(a− v )o2
2oV&
)200(o2 −Vp & )205(o2 −Vp &
peak2oV&
2oV&
peak2oV&
2oV&
2oV&
)200(o2 −Vp &
2oV&
peak2oV&
2oV&
2oV&
Page 7 of 14
Human Kinetics, 1607 N Market St, Champaign, IL 61825
International Journal of Sports Physiology and Performance

For Peer Review
8
and intensity (e.g., 100- to 400-m submaximal and maximal swims). In addition, more 290
basic studies investigating directly measured kinetics after maximal swimming 291
exercise would be required to confirm the physiological assumptions of the model. 292
293
CONCLUSION 294
We propose the new model, based on continuous beat-to-beat HR and post-exercise 295
breath-by-breath measurements during 20 s, as a valid and accurate procedure for 296
estimating in competitive swimmers. This calculation method avoids the bias of 297
estimations incurred by using the backward extrapolation method and 298
overcomes the constraints imposed by the use of respiratory equipment during 299
swimming. 300
301
ACKNOWLEDGEMENTS 302
This work was partially supported by grants awarded by the Ministry of Science and 303
Innovation of Spain (DEP2009-09181), Higher Sports Council of Spain (CSD 304
35/UPB/10, 005/UPB10/11, 112/UPB10/12, CAR-UGr 2009, CAR-UGr 2011), and 305
INEFC (Research Support Grants 2011, 2012). The contribution of Anna Barrero 306
(INEFC) in data acquisition is acknowledged. We are indebted to the coaches and staff 307
of the participating teams: Fred Vergnoux (C. N. Sabadell and RFEN); Jordi Murio, 308
Juan J. Castillo and Víctor Mancha (RFEN); David Lyles, Jenny Lyles and Xu Feng Jie 309
(Shanghai Province Swimming and Chinese Swimming Federation); Miha Potočnik, 310
Gorazd Podržavnik and Roni Pikec (Slovenian Swimming Federation); Rohan Taylor, 311
Jeremy Oliver and Danielle Stefano (Victorian Institute of Sport); and Patrick Pearson 312
(EIFFEL Swimmers PSV-Eindhoven). A very special note of appreciation goes to each 313
and all the swimmers who served as subjects and rendered their valuable time and 314
effort. 315
316
REFERENCES 317
1. Sousa A, Figueiredo P, Pendergast D, Kjendlie PL, Vilas-Boas JP, Fernandes 318
RJ. Critical evaluation of oxygen-uptake assessment in swimming. Int J Sports 319
Physiol Perform. Mar 2014;9(2):190-202. 320
2. Holmér I. Oxygen uptake during swimming in man. J Appl Physiol. Oct 321
1972;33(4):502-509. 322
3. Holmér I. Energy cost of arm stroke, leg kick, and the whole stroke in 323
competitive swimming styles. Eur J Appl Physiol Occup Physiol. 324
1974;33(2):105-118. 325
4. Kjendlie PL, Ingjer F, Madsen O, Stallman RK, Stray-Gundersen J. Differences 326
in the energy cost between children and adults during front crawl swimming. 327
Eur J Appl Physiol. Apr 2004;91(4):473-480. 328
5. Vilas-Boas JP, Santos P. Comparison of swimming economy in three 329
breaststroke techniques. In: Miyashita M, Mutoh Y, Richardson AB, eds. 330
Medicine and science in aquatic sports. Basel: Karger; 1994:48-54. 331
6. Fernandes RJ, Cardoso CS, Soares SM, Ascensão A, Colaço PJ, Vilas-Boas JP. 332
Time limit and VO2 slow component at intensities corresponding to VO2max in 333
swimmers. Int J Sports Med 2003;24(08):576-581. 334
7. Rodríguez FA, Keskinen KL, Keskinen OP, Malvela M. Oxygen uptake kinetics 335
during free swimming: a pilot study. In: Chatard J-C, ed. Biomechanics and 336
&Q
2oV&
peak2oV&
peak2oV&
Page 8 of 14
Human Kinetics, 1607 N Market St, Champaign, IL 61825
International Journal of Sports Physiology and Performance

For Peer Review
9
medicine in swimming IX. Saint-Étienne: Publications de l’Université de Saint-337
Étienne; 2003:379-384. 338
8. Montpetit RR, Léger LA, Lavoie JM, Cazorla G. VO2 peak during free 339
swimming using the backward extrapolation of the O2 recovery curve. Eur J 340
Appl Physiol Occup Physiol. 1981;47(4):385-391. 341
9. Rodríguez FA. Metabolic evaluation of swimmers and water polo players. 342
Kinesiology. Journal of Biology of Exercise. 1997 1997;2(1):19-29. 343
10. Fernandes RJ, Figueiredo P, Vilas-Boas JP. About the use and conclusions 344
extracted from a single tube snorkel used for respiratory data acquisition during 345
swimming. J Physiol Sci. Mar 2013;63(2):155-157. 346
11. Barbosa T, Silva AJ, Reis AM, Costa M, Garrido N, Policarpo F, Reis VM. 347
Kinematical changes in swimming front crawl and breaststroke with the 348
AquaTrainer snorkel. Eur J Appl Physiol. Aug 2010;109(6):1155-1162. 349
12. Di Prampero PE, Cortili G, Mognoni P, Saibene F. Energy cost of speec skating 350
and efficiency of work against air resistance. J Appl Physiol. Apr 351
1976;40(4):584-591. 352
13. Léger LA, Seliger V, Brassard L. Backward extrapolation of VO2max values 353
from the O2 recovery curve. Med Sci Sports Exerc. Spring 1980;12(1):24-27. 354
14. Costill DL, Kovaleski J, Porter D, Kirwan J, Fielding R, King D. Energy 355
expenditure during front crawl swimming: predicting success in middle-distance 356
events. Int J Sports Med. Oct 1985;6(5):266-270. 357
15. Rodríguez FA. Cardiorespiratory and metabolic field testing in swimming and 358
water polo: from physiological concepts to practical methods. In: Keskinen KL, 359
Komi PV, Hollander AP, eds. Biomechanics and medicine in swimming VIII. 360
University of Jyväskylä, Finland: Gummerus Printing; 1999:219-226. 361
16. Schuller T, Rodríguez FA, Iglesias X, Barrero A, Chaverri D, Hoffmann U. A 362
new model for estimating peak oxygen uptake based on post-exercise 363
measurements and heart rate kinetics in swimming. In: Balagué N, Torrents C, 364
Vilanova A, Cadefau J, Tarragó R, Tsolakidis E, eds. Proceedings of the 18th 365
Annual Congress of the European College of Sport Science. Barcelona: Open 366
Print; 2013:42. 367
17. Drescher U, Essfeld D, Hoffmann U. Modeling muscular V’O2-kinetics on the 368
basis of respiratory V’O2 and cardiac output measurements. In: Kurkusuz F, ed. 369
15th Annual Congress of the European College of Sport Science. Antalya: 370
Middle East Technical University; 2010:214. 371
18. Keskinen KL, Rodríguez FA, Keskinen OP. Respiratory snorkel and valve 372
system for breath-by-breath gas analysis in swimming. Scand J Med Sci Sports. 373
Oct 2003;13(5):322-329. 374
19. Rodríguez FA, Keskinen KL, Kusch M, Hoffmann U. Validity of a swimming 375
snorkel for metabolic testing. Int J Sports Med. Feb 2008;29(2):120-128. 376
20. Rodríguez FA, Iglesias X, Feriche B, Calderon-Soto C, Chaverri D, Wachsmuth 377
NB, Schmidt W, and Levine BD. Altitude training in elite swimmers for sea 378
level performance (Altitude Project). Med Sci Sports Exerc. 2015;47(9):1965-379
1978. 380
21. de Jesus K, Guidetti L, de Jesus K, Vilas-Boas JP, Baldari C, and Fernandes RJ. 381
Which are the best VO2 sampling intervals to characterize low to severe 382
swimming intensities? Int J Sports Med. Jun 2014;35(12):1030-1036. 383
22. Sousa A, Figueiredo P, Keskinen KL, Rodríguez FA, Machado L, Vilas-Boas 384
JP, Fernandes RJ. VO2 off transient kinetics in extreme intensity swimming. J 385
Sports Sci Med. 2011;10(3):546-552. 386
Page 9 of 14
Human Kinetics, 1607 N Market St, Champaign, IL 61825
International Journal of Sports Physiology and Performance
For Peer Review
10
23. Eriksen M, Waaler BA, Walloe L, Wesche J. Dynamics and dimensions of 387
cardiac output changes in humans at the onset and at the end of moderate 388
rhythmic exercise. J Physiol. Jul 1990;426:423-437. 389
24. Bland JM, Altman DG. Statistical methods for assessing agreement between two 390
methods of clinical measurement. The Lancet. 1986;327(8476):307-310. 391
25. Sousa AC, Figueiredo P, Oliveira NL, Oliveira J, Silva AJ, Keskinen KL, 392
Rodríguez FA, Machado LJ, Vilas-Boas JP, Fernandes RJ. VO2 kinetics in 200-393
m race-pace front crawl swimming. Int J Sports Med. Oct 2011;32(10):765-770. 394
26. Scheuermann BW, Barstow TJ. O2 uptake kinetics during exercise at peak O2 395
uptake. J Appl Physiol. Nov 2003;95(5):2014-2022. 396
27. Miyamoto Y, Higuchi J, Abe Y, Hiura T, Nakazono Y, Mikami T. Dynamics of 397
cardiac output and systolic time intervals in supine and upright exercise. J Appl 398
Physiol Respir Environ Exerc Physiol. Dec 1983;55(6):1674-1681. 399
28. Takahashi T, Hayano J, Okada A, Saitoh T, Kamiya A. Effects of the muscle 400
pump and body posture on cardiovascular responses during recovery from cycle 401
exercise. Eur J Appl Physiol. Aug 2005;94(5-6):576-583. 402
29. Yoshida T, Whipp BJ. Dynamic asymmetries of cardiac output transients in 403
response to muscular exercise in man. J Physiol. Oct 15 1994;480 ( Pt 2):355-404
359. 405
30. Sheldahl LM, Tristani FE, Clifford PS, Hughes CV, Sobocinski KA, Morris RD. 406
Effect of head-out water immersion on cardiorespiratory response to dynamic 407
exercise. J Amer Coll Cardiol. 1987;10(6):1254-1258. 408
31. Arborelius M, Jr., Ballidin UI, Lilja B, Lundgren CE. Hemodynamic changes in 409
man during immersion with the head above water. Aerosp Med. Jun 410
1972;43(6):592-598. 411
32. Lavoie J-M, Léger LA, Montpetit RR, Chabot S. Backward extrapolation of 412
VO2 from the O2 recovery curve after a voluntary maximal 400m swim. In: 413
Hollander AP, Huijing PA, De Groot G, eds. Biomechanics and medicine in 414
swimming: Human Kinetics, Champaign, Illinois.; 1983:222-227. 415
Page 10 of 14
Human Kinetics, 1607 N Market St, Champaign, IL 61825
International Journal of Sports Physiology and Performance
For Peer Review
11
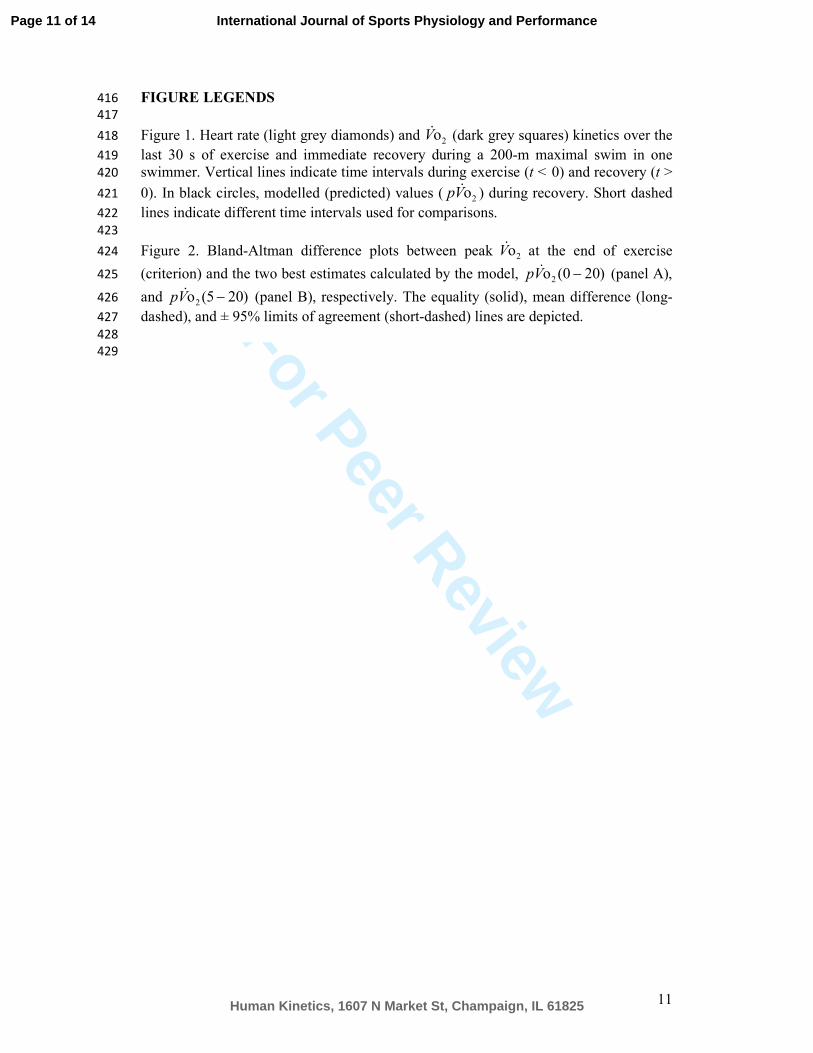
FIGURE LEGENDS 416
417
Figure 1. Heart rate (light grey diamonds) and (dark grey squares) kinetics over the 418
last 30 s of exercise and immediate recovery during a 200-m maximal swim in one 419
swimmer. Vertical lines indicate time intervals during exercise (t < 0) and recovery (t > 420
0). In black circles, modelled (predicted) values ( ) during recovery. Short dashed 421
lines indicate different time intervals used for comparisons. 422
423
Figure 2. Bland-Altman difference plots between peak at the end of exercise 424
(criterion) and the two best estimates calculated by the model, (panel A), 425
and (panel B), respectively. The equality (solid), mean difference (long-426
dashed), and ± 95% limits of agreement (short-dashed) lines are depicted. 427
428
429
2oV&
2oVp &
2oV&
)200(o2 −Vp &
)205(o2 −Vp &
Page 11 of 14
Human Kinetics, 1607 N Market St, Champaign, IL 61825
International Journal of Sports Physiology and Performance
For Peer Review
260x190mm (150 x 150 DPI)
Page 12 of 14
Human Kinetics, 1607 N Market St, Champaign, IL 61825
International Journal of Sports Physiology and Performance
For Peer Review
529x396mm (72 x 72 DPI)
Page 13 of 14
Human Kinetics, 1607 N Market St, Champaign, IL 61825
International Journal of Sports Physiology and Performance

For Peer Review
Table 1. Oxygen uptake measurements during exercise (criterion value) and recovery (post-exercise), and values predicted by the model at
different time intervals.
2oV&
Time interval 95% CI Mean diff. r2 SEE Significance
(s) (ml·min-1
) (ml·min-1
) (ml·min-1
) (ml·min-1
) (%) (p-value)
Exercise (criterion) -20–0 3547 ± 692 3305 3788 0 – – – –
Post-exercise 0–20 3431 ± 685 3192 3670 -116 .959 142 4.15 .001*
Predicted 0–20 3564 ± 698 3320 3807 17 .963 136 3.82 1.0
5–20 3559 ± 705 3313 3805 13 .943 168 4.72 1.0
10–20 3520 ± 725 3267 3773 -27 .900 222 6.30 1.0
15–20 3438 ± 722 3186 3690 -109 .856 267 7.76 .76
5–15 3623 ± 707 3376 3869 76 .963 135 3.74 .07
10–15 3604 ± 731 3349 3859 57 .923 195 5.42 1.0
Values are mean ± SD. 95% CI, 95% confidence interval; Mean diff., mean difference with criterion value; r2, Pearson’s coefficient of
determination; SEE, standard error of estimate; Significance, compared with criterion value; *Significantly different from criterion value (p
< 0.05).
2oV&
Page 14 of 14
Human Kinetics, 1607 N Market St, Champaign, IL 61825
International Journal of Sports Physiology and Performance