a new measure of employee engagement: a …
TRANSCRIPT

Amity Journal of Management Amity Business School, Amity University Madhya Pradesh Vol. IX, No. 1, January – June 2021 ISSN: 2347-1832 (Print)| ISSN: 2581-5261 (Online)
7
A NEW MEASURE OF EMPLOYEE ENGAGEMENT: A COMPARATIVE STUDY
Maureen Snow Andrade1, Ronald Mellado Miller2 and Emily Siwachok3
ABSTRACT Employee engagement is reportedly lacking in U.S. contexts with only about a third of workers indicating enthusiasm for their work. Engaged employees devote themselves to organizational mission, build relationships with customers, and extend brand loyalty. Engagement is commonly measured with the Utrecht Work Engagement Scale and the Job Enrichment Scale. This study introduces the Arbinger 360 Survey and compares the three instruments. Findings indicate significant correlations among the scales in the three instruments. The Arbinger 360 survey has much potential for future practical workplace application as well as further research on employee engagement. Keywords: employee engagement, engagement measures, Job Enrichment Scale, Utrecht Work Engagement Scale, Arbinger 360 Survey INTRODUCTION Both employers and employees benefit from engagement. Employee engagement is typically thought of as the degree to which employees are passionate about their work. This passion leads to organizational commitment and the use of discretionary time for the benefit of the organization. According to a recent poll, however, only 32% of workers in the United States are engaged, defined in the study as ―involved in, enthusiastic about and committed to their work and workplace‖ (Gallup, 2017, para 1). Engaged employees are connected to the organization‘s mission, build relationships with customers, expand brand support, tend to stay with their organizations, and as such, contribute positively to business outcomes (Gallup, 2017).
Measuring engagement is a first step to improving engagement. Employers have a vested interest in knowing the level of engagement of their employees so that the former can determine strategies to improve engagement if needed. The most widely used measure for this purpose is the Utrecht Work Engagement Scale (UWES) (Schaufeli et al., 2002). The UWES is based on the belief that engagement is not the opposite of burnout, or exhaustion and cynicism (Schaufeli & Bakker, 2004), as has been assumed by some researchers and measures (e.g., the Maslach Burnout Inventory; Maslach et al., 1996; Maslach & Leiter, 1997). It is quite plausible that workers can be both engaged and burned-out; similarly, a lack of engagement does not imply burn-out. However, criticisms of the UWES indicate that the scale does not empirically distinguish between burnout (as measured by the Maslach Burnout Inventory or MBI) and engagement (Cole et al., 2012). Another measure, the Job Enrichment Scale (JES) (Rich et al., 2010) purports to be based on Kahn‘s (1990) definitions of engagement, which is comprised of three dimensions—physical, cognitive, and emotional. Comparisons of the UWES and JES have determined that they are correlated but not interchangeable (Byrne et al., 2016). The
1. Utah Valley University, Department of Organizational Leadership, 800 W. University Parkway MS 205, Orem, Utah, 84058 USA, Phone 801.863.5917, Fax 801.863.8604, Email: maureen.andrade@uvu. edu
2. Utah Valley University, Department of Strategic Management and Operations, 800 W. University Parkway MS 119, Orem, Utah, 84058 USA, Phone 801.863.8232, Fax 801.863.8604. Email: [email protected]
3. The Arbinger Institute1379 N 1075 W #100, Farmington, Utah 84025 USA, Phone 801.447.9244, Fax 801.447.9376, Email: [email protected]

8
former may be more appropriate for measuring job attitudes and employees‘ physical, cognitive, and emotional investment (Kahn, 1990), while the JES has a narrower focus related predominantly to job role (Byrne et al., 2016). The current study compares three instruments, the UWES, JES, and the Arbinger 360 to determine their relationships. The Arbinger 360 measures traits considered essential to the effectiveness of an organization. The questions are designed to assess to what degree individuals have these traits in relation to their managers, co-workers, and direct reports. This study thus contributes new insights into the measurement of employee engagement. LITERATURE REVIEW Engagement is manifest in three ways: affective (making connections with supervisors and co-workers), cognitive (pursuing information, questioning, problem-solving), and physical (demonstrating active physical movement in the workplace) (Kahn, 1990). This combination of behaviors is dependent on the conditions of psychological availability, meaningfulness, and psychological safety. In other words, discretionary effort involves believing that one can invest oneself physically, cognitively, and psychologically on the job; contributing meaningfully to the success of the organization; having rewarding relationships with associates at work; and being assured of the resources required to accomplish one‘s responsibilities. The concept of employee engagement, as introduced by Kahn, challenged the popular notion that employees needed to be a good fit and be financially rewarded, and top-down approaches to motivation; at the time, what employees thought about their workplace was believed to be more important than what they felt (Rheem, 2018). Kahn (1990) emphasized the integration of work and relationships,
which he posited to result in the investment of self to the betterment of the organization. The idea behind Kahn‘s theory is that employers should partner with employees to design roles and tasks and pursue needed organizational change. Employees should feel safe to have an open dialogue with their employers. Impact of Employee Engagement Kahn‘s conceptualization of employee engagement has influenced a number of motivation theories and their applications. One example is the job characteristics model, consisting of three components: job characteristics, psychological states, and outcomes (Hackman & Oldham, 1975). Briefly, job characteristics involve skill and task identity, task significance, autonomy, and feedback; these influence specific psychological states, or viewing one‘s work as meaningful, feeling responsible for outcomes, and having a knowledge of results. These variables affect the degree to which positive outcomes are realized, specifically job satisfaction, motivation, performance, and low levels of absenteeism and turnover (Brass, 1985; Humphrey et al., 2007; Johns et al., 1982; Renn & Vandenberg, 1995). The degree to which job characteristics are motivating can vary by employee, but employers can change these perceptions through dialogue and by demonstrating the meaningfulness of tasks and their results. Kahn‘s work is related to that of Herzberg (Herzberg et al., 1959; Herzberg, 1965), which focused on what satisfies and dissatisfies employees. Herzberg‘s research demonstrated that factors that satisfy, called hygiene factors, (e.g., work policies, conditions, salary, safety, security) are unrelated to those that satisfy or motivate (achievement, recognition, responsibility, advancement, growth). However, the theory has been subject to much criticism (Cummings & Elsalmi, 1968; House & Wigdor, 1967).

9
Other motivation theories, such as self-determination theory and Motivation 3.0 have similar foundational variables to those identified by Kahn (1990). Self-determination theory posits that intrinsic motivation is impacted by meaningfulness, autonomy, and connectedness (Deci et al., 1999; Deci & Ryan, 2002; Ryan & Deci, 2000; Gagné & Deci, 2005) (consider Kahn‘s emphasis on investment in the organization, meaningful contributions, and rewarding relationships). Motivation 3.0 includes autonomy as a factor (as does the job characteristics model; Hackman & Oldham, 1975). Mastery and purpose also play a role in this theory. Essentially, when employees have autonomy to engage in their work, creativity and innovation increase. Mastery involves challenging oneself, improving, learning, and practicing (consider Herzberg‘s motivating factors). Purpose emphasizes understanding organizational goals and working toward something meaningful that engages minds and hearts (consider Kahn‘s meaningful contributions and Hackman and Oldham‘s emphasis on meaningful work). Employee Engagement Measures While the theories reviewed have common threads, they also have distinct elements. Organizations and managers within them are most interested in knowing, on a practical level, what they can do to positively impact employee engagement. Employee engagement differs from job satisfaction (although this can play a role) in that satisfaction can result from little or no work or limited contributions to an organization. Organizations that focus on measuring job satisfaction, or the level of contentment of employees, may lack knowledge of employee motivation, involvement, and dedication, and make changes that improve satisfaction but not performance (Custom Insight, 2019). Thus, employers need to ensure they are using appropriate measures. The most common means of measuring employee engagement are the UWES
(Schaufeli, Salanova, et al., 2002), and the JES (Rich et l., 2010). The validity of the UWES has been challenged in spite of its wide use (Newman & Harrison, 2008; Wefald et al., 2011) while the JES has stronger support in this regard (Alfes et al., 2013; Chen et al., 2014; He et al., 2014; Rich et al., 2010; Shuck et al., 2014). Comparisons of the two scales demonstrate that, although they are correlated, they do not measure the same theoretical constructs and thus are not interchangeable (Byrne et al., 2016). The UWES conceptualizes employee engagement as being the opposite of burn-out and focuses on measuring general work attitudes (Schaufeli et al. 2002) whereas the JES may be more appropriate for research purposes in order to distinguish among constructs. Thus, the UWES is likely more useful for assessing engagement in organizations where employers want to focus on overall perceptions of employees (Byrne et al., 2016). The Arbinger 360 Instrument The Arbinger Institute (arbingerinstitute.com) is the outgrowth of the academic work of its founder, Professor C. Terry Warner. This work answers what had been the unanswerable question at the root of psychology: how can self-deception be explained? Its work has been deemed to be highly influential in the world of practical business, (e.g., business books recommended by Bill Gates, Barack Obama, and other successful people; Mejia, 2018), where Slack co-founder and CEO Stewart Butterfield, called one of the Arbinger books, Leadership and Self-Deception, ―the most useful books‖ he's ever read and one he has recommended to his entire executive team‖ (Mejia, 2018, para. 1). From Arbinger‘s perspective, it has long been understood that humans are in large part self-deceived about their motives, influence on others, and perspectives. Warner‘s theory of self-deception offers tenable explanations on how and why we become self-deceived. This theory of self-
10
deception is central to business performance because several of its deterrents can be traced to the practice of self-deception including conflict, low productivity, poor communication, toxic work environments, and a lack of collaboration and innovation. Thus, Arbinger‘s approach is twofold: (1) It brings its scholarly and practical work to bear in helping people and organizations overcome self-deception and subsequently achieve high-performing results; (2) it then equips them to use those results to become more profitable. To realize these objectives, the Arbinger Institute developed a 360 survey. This survey intends to assess whether or not (or to what degree) individuals possess certain characteristics deemed within Arbinger as ―outward characteristics.‖ These traits are considered essential to a successful organization because they overcome and prevent the state of being self-deceived. These qualities include focusing on results, helping others achieve results, focusing on solutions, actively learning and teaching, holding ourselves accountable, taking correction easily, taking responsibility, and inspiring trust. The survey questions have been designed to assess to what degree individuals have these traits in relation to their managers, co-workers, and direct reports. Finally, this 360 survey has been crafted to be what might be termed as a ‗reverse 360 survey.‘ Foundational to Western philosophy is Descartes‘ conception of the self, Cogito, ergo sum (―I think, therefore I am‖) in which a person‘s thoughts qualify them as an existing being and gives definition to who they are. Drawing from this principle, Arbinger‘s 360 survey is designed to assess individuals based on their thoughts, specifically in regard to how they think about others. Thus, while most 360 surveys ask an employee‘s perspective on their manager to assess the manager, this 360 survey does the reverse and uses those responses to assess the individual. In
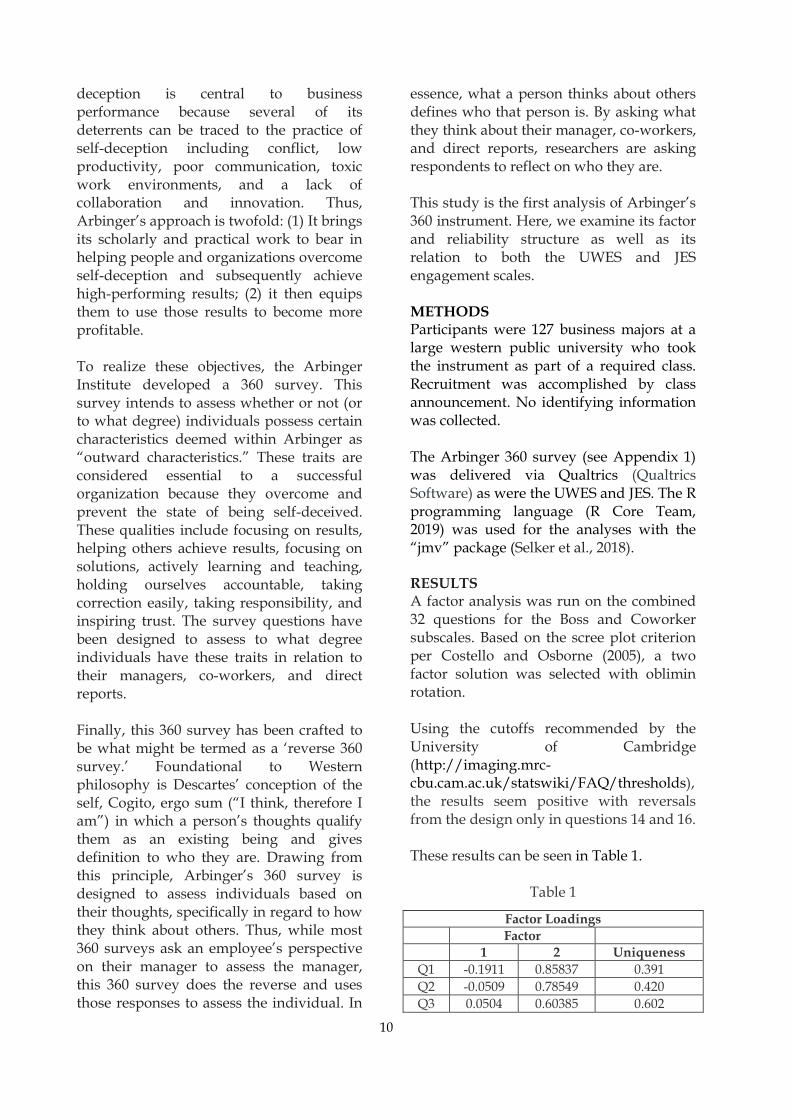
essence, what a person thinks about others defines who that person is. By asking what they think about their manager, co-workers, and direct reports, researchers are asking respondents to reflect on who they are. This study is the first analysis of Arbinger‘s 360 instrument. Here, we examine its factor and reliability structure as well as its relation to both the UWES and JES engagement scales. METHODS Participants were 127 business majors at a large western public university who took the instrument as part of a required class. Recruitment was accomplished by class announcement. No identifying information was collected. The Arbinger 360 survey (see Appendix 1) was delivered via Qualtrics (Qualtrics Software) as were the UWES and JES. The R programming language (R Core Team, 2019) was used for the analyses with the ―jmv‖ package (Selker et al., 2018). RESULTS A factor analysis was run on the combined 32 questions for the Boss and Coworker subscales. Based on the scree plot criterion per Costello and Osborne (2005), a two factor solution was selected with oblimin rotation. Using the cutoffs recommended by the University of Cambridge (http://imaging.mrc-cbu.cam.ac.uk/statswiki/FAQ/thresholds), the results seem positive with reversals from the design only in questions 14 and 16. These results can be seen in Table 1.
Table 1
Factor Loadings
Factor
1 2 Uniqueness
Q1 -0.1911 0.85837 0.391
Q2 -0.0509 0.78549 0.420
Q3 0.0504 0.60385 0.602

11
Q4 0.0601 0.68481 0.486
Q5 0.0601 0.70446 0.458
Q6 0.1563 0.66733 0.426
Q7 -0.1901 0.85514 0.395
Q8 0.1494 0.66261 0.440
Q9 0.2264 0.50168 0.584
Q10 0.2522 0.60463 0.418
Q11 0.2010 0.53068 0.571
Q12 0.2178 0.44179 0.661
Q13 0.3168 0.42398 0.586
Q14 0.4406 0.38991 0.482
Q15 0.2076 0.58875 0.488
Q16 0.4069 0.32733 0.594
Q17 0.3471 0.27601 0.708
Q18 0.6228 -0.12953 0.676
Q19 0.6854 0.12573 0.428
Q20 0.6736 -0.07553 0.591
Q21 0.6827 0.01228 0.525
Q22 0.3482 0.02503 0.869
Q23 0.4442 0.18499 0.686
Q24 0.5807 0.00812 0.658
Q25 0.4410 0.37484 0.500
Q26 0.4753 0.10329 0.714
Q27 0.7343 0.10325 0.374
Q28 0.6179 0.04796 0.586
Q29 0.7863 -0.09222 0.446
Q30 0.6009 0.11966 0.553
Q31 0.7675 -0.09777 0.476
Q32 0.5818 0.03378 0.641
Table 2 shows that the two factors explain 45.5% of the variance.
Table 2
Summary
Factor SS Loadings % of Variance Cumulative %
1 7.34 22.9 22.9
2 7.23 22.6 45.5
Table 3 shows the RMSEA and TLI (Tucker Lewis Index), as well as other pertinent tests of fitness.
Table 3
Model Fit Measures
RMSEA
90% CI
Model Test
RMSEA Lower Upper TLI BIC χ² df p
0.130 0.0990 NaN 0.650 -1051 852 433 < .001
Table 4 shows the results from Bartlett's Test of Sphericity, indicating that the variables here are amenable to factor analysis.
Table 4
Bartlett's Test of Sphericity
χ² df p
1902 496 < .001
Table 5 shows the results from KMO Measure of Sampling Adequacy, indicating that the sampling is adequate (above 0.60) for all variables.
Table 5
KMO Measure of Sampling Adequacy
MSA
Overall 0.841
Q1 0.794
Q2 0.804
Q3 0.856
Q4 0.832
Q5 0.907
Q6 0.885
Q7 0.784
Q8 0.880
Q9 0.848
Q10 0.845
Q11 0.857
Q12 0.863
Q13 0.836
Q14 0.885
Q15 0.820
Q16 0.845
Q17 0.833
Q18 0.714
Q19 0.909
Q20 0.845
Q21 0.870
Q22 0.657
Q23 0.854
Q24 0.809
Q25 0.907
Q26 0.754
Q27 0.854
Q28 0.829
Q29 0.897
Q30 0.859
Q31 0.840
Q32 0.722

12
Table 6 shows the reliability of the Boss instrument questions.
Table 6
Scale Reliability Statistics
mean sd Cronbach's α McDonald's ω
scale 7.24 1.57 0.933 0.935
if item dropped mean sd Cronbach's α McDonald's ω
Q1 7.11 2.14 0.929 0.931
Q2 6.93 2.13 0.930 0.931
Q3 7.42 1.95 0.931 0.933
Q4 7.15 2.41 0.928 0.930
Q5 7.01 2.38 0.928 0.929
Q6 7.15 2.39 0.927 0.929
Q7 6.91 2.34 0.929 0.930
Q8 7.63 1.91 0.928 0.929
Q9 7.38 1.80 0.930 0.932
Q10 7.18 2.25 0.927 0.929
Q11 7.64 2.10 0.928 0.930
Q12 6.47 2.73 0.932 0.933
Q13 7.30 2.33 0.930 0.932
Q14 7.33 2.32 0.928 0.930
Q15 7.97 2.09 0.928 0.929
Q16 7.33 2.08 0.930 0.932
Table 7 shows the reliability of the Co-Worker instrument questions.
Table 7
Scale Reliability Statistics
mean sd Cronbach's α McDonald's ω
scale 6.87 1.37 0.912 0.918
if item dropped mean sd Cronbach's α McDonald's ω
Q17 6.68 1.79 0.909 0.917
Q18 7.62 1.99 0.910 0.917
Q19 6.82 1.87 0.902 0.909
Q20 7.19 1.76 0.907 0.913
Q21 7.08 2.06 0.905 0.912
Q22 6.18 2.73 0.916 0.919
Q23 6.74 2.35 0.907 0.914
Q24 7.40 2.14 0.908 0.915
Q25 7.53 1.72 0.907 0.913
Q26 6.26 2.22 0.908 0.915
Q27 6.97 1.80 0.903 0.909
Q28 5.97 2.27 0.905 0.912
Q29 7.10 1.98 0.903 0.910
Q30 6.69 2.03 0.904 0.911
Q31 6.74 2.26 0.904 0.911
Q32 7.03 2.23 0.906 0.914
A correlation matrix was created from the Arbinger survey and the UWES and JES totals and subscales. The relationships can be seen in Table 8, which shows significant
correlations between each of the Arbinger scales and each of the other scales and their subscales. Significant correlations are marked.
Table 8
Correlation Matrix
UWES UWES Vigor
UWES Dedication
JES JES Physical
JES Affect JES Cognitive
Arbinger Boss
Arbinger Co-
Worker
Arbinger
UWES Pearson's r — 0.917 *** 0.938 *** 0.854 *** 0.677 *** 0.817 *** 0.695 *** 0.422 *** 0.451 *** 0.514 ***
p-value — < .001 < .001 < .001 < .001 < .001 < .001 < .001 < .001 < .001
UWES Vigor
Pearson's r — 0.722 *** 0.742 *** 0.643 *** 0.646 *** 0.636 *** 0.404 *** 0.395 *** 0.470 ***
p-value — < .001 < .001 < .001 < .001 < .001 < .001 < .001 < .001
UWES Dedication
Pearson's r — 0.836 *** 0.615 *** 0.855 *** 0.652 *** 0.381 *** 0.440 *** 0.482 ***
p-value — < .001 < .001 < .001 < .001 < .001 < .001 < .001
JES Pearson's r — 0.834 *** 0.863 *** 0.889 *** 0.409 *** 0.377 *** 0.461 ***
p-value — < .001 < .001 < .001 < .001 < .001 < .001
JES Physical Pearson's r — 0.547 *** 0.709 *** 0.501 *** 0.281 ** 0.459 ***
p-value — < .001 < .001 < .001 0.007 < .001
JES Affect Pearson's r — 0.606 *** 0.349 *** 0.381 *** 0.429 ***
p-value — < .001 < .001 < .001 < .001
JES Cognitive
Pearson's r — 0.247 * 0.297 ** 0.317 **
p-value — 0.019 0.004 0.002
Boss Pearson's r — 0.460 *** 0.857 ***
p-value — < .001 < .001
Co-Worker Pearson's r — 0.852 ***
p-value — < .001
Arbinger Pearson's r —
p-value —
Note. * p < .05, ** p < .01, *** p < .001

13
In sum, the overall evidence suggests that this iteration of the Arbinger 360 has high reliability and validity are high and is strongly related to both the UWES and the JES, as shown through factor, reliability, and correlation analyses. DISCUSSION Overall, it is interesting how related the surveys are given their differing approaches. While the UWES and the JES measure personal engagement, the Arbinger is ostensibly meant to capture employee perceptions about their supervisors and co-workers. That the Arbinger measurement of employee views is highly related to standard scientific measures of employee engagement is perhaps indicative of the power of this conceptualization. Additionally, while the UWES and the JES have some differences in their relation to each other, the Arbinger survey is statistically significantly correlated with each of the scales and subscales measured, perhaps giving the potential in the future to give insights into the constructs of focus without having to measure them with different instruments. It might be noted that this convergent validity makes further refining of the Arbinger survey appear useful, but that studies examining divergent and other validities would be important also. Perhaps another limitation that needs to be addressed is that the UWES absorption subscale was not used, given that it refers, for example, to happiness when working intensely, and getting carried away when working, among others, which may be more general habits of the workers rather than qualities or evaluative statements referring to their current jobs. CONCLUSION This study has introduced an alternative measure of employee engagement, the Arbinger 360, which is based on examining an employee‘s views of her or her supervisor and co-workers. This is a unique approach. This is the first study to not only
analyze the Arbinger 360, but to compare it to other common measures of engagement. That the Arbinger instrument has a high level of correlation between each of its scales and each of the UWES and JES scales and subscales demonstrates its potential to contribute insights into employee engagement, and thus benefits both employers and employees. REFERENCES Alfes, K., Shantz, A. D., Truss, C., & Soane,
E. C. (2013). The link between perceived human resource management practices, engagement and employee behaviour: A moderated mediation model. International Journal of Human Resource Management, 24, 330–351. http://dx.doi.org/10.1080/09585192.2012.679950
Brass, D. J. (1985). Technology and the structuring of jobs: Employee satisfaction, performance, and influence. Organizational Behavior and Human Decision Processes, 35, 216–240.
Byrne, Z. S., Peters, J. M., & Weston, J. W. (2016). The struggle with employee engagement: Measures and construct clarification using five samples. Journal of Applied Psychology, 101(9), 1201–1227.
Chen, C., Yen, C., & Tsai, F. C. (2014). Job crafting and job engagement: The mediating role of person-job fit. International Journal of Hospitality Management, 37, 21–28. http://dx.doi.org/10.1016/j.ijhm.2013.10.006
Costello, A. B., & Osborne, J. W. (2005). Best practices in exploratory factor analysis: Four recommendations for getting the most from your analysis. Practical assessment, research & evaluation, 10(7), 1–9.
Cummings, L. L., & Elsalmi, A. M. (1968). Empirical research on the bases and correlates of managerial

14
motivation. Psychological Bulletin, 70, 127–144.
Custom Insight. (2019). Employee engagement survey. https://www.custominsight.com/employee-engagement-survey/what-is-employee-engagement.asp
Deci, E. L., Koestner, R., Ryan, R. M. (1999). A meta-analytic review of experiments examining the effects of extrinsic rewards on intrinsic motivation. Psychological Bulletin, 125(6), 627–668.
Deci, E., & Ryan, R. (Eds.) (2002). Handbook of self-determination research. Rochester, NY: University of Rochester Press.
Gagné, M., & Deci, E. L. (2005). Self-determination theory and work motivation. Journal of Organizational Behavior, 26(4), 331–362.
Gallup. (2017). Gallup daily. U.S. employee engagement. https://news.gallup.com/poll/180404/gallup-daily-employee-engagement.aspx
Gallup. (2017). State of the American workforce. https://news.gallup.com/poll/180404/gallup-daily-employee-engagement.aspx
Hackman, J. R., & Oldham, G. R. (1975). Development of the job diagnostic survey. Journal of Applied Psychology, 60, 159–170.
He, H., Zhu, W., & Zheng, X. (2014). Procedural justice and employee engagement: Roles of organizational identification and moral identity centrality. Journal of Business Ethics, 122, 681–695. http://dx.doi.org/10.1007/s10551-013-1774-3
Herzberg, F., Mausner, B., & Snyderman, B. (1959). The motivation to work. New York: John Wiley.
Herzberg, F. (1965). The motivation to work among Finnish supervisors. Personnel Psychology, 18, 393–402.
House, R. J., & Wigdor, L. A. (1967). Herzberg‘s dual-factor theory of job satisfaction and motivation: A review of the evidence and a criticism. Personnel Psychology, 20, 369–389.
Humphrey, S. E., Nahrgang, J. D., & Morgeson, F. P. (2007). Integrating motivational, social, and contextual work design features: A meta-analytic summary and theoretical extension of the work design literature. Journal of Applied Psychology, 92, 1332–1356.
Johns, G., Xie, J. L., & Fang, Y. (1992). Mediating and moderating effects in job design. Journal of Management, 18, 657–676.
Kahn, W. A. (1990). Psychological conditions of personal engagement and disengagement at work. Academy of Management Journal, 33, 692–724. http://dx.doi.org/10.2307/256287
Maslach, C., Jackson, S. E., & Leiter, M. (1996). Maslach Burnout Inventory. Manual (3rd ed.). Consulting Psychologists Press.
Maslach, C., & Leiter, M. P. (1997). The truth about burnout: How organizations cause personal stress and what to do about it. Jossey-Bass.
Mejia, Z. (2018, December 17). Business books recommended by Bill Gates, Barack Obama and other successful people. https://www.cnbc.com/2018/12/17/10-great-business-books-recommended-in-2018-by-bill-gates-mark-cuban-barack-obama.html
MRC CBU Wiki. (n.d.). http://imaging.mrc-cbu.cam.ac.uk/statswiki/FAQ/thresholds
Newman, D. A., & Harrison, D. A. (2008). Been there, bottled that: Are state and behavioral work engagement new and

15
useful construct ―wines‖? Industrial and Organizational Psychology: Perspectives on Science and Practice, 1, 31–35. http://dx.doi.org/10.1111/j.1754-9434.2007.00003.x
Pink, D. H. (2011). Drive. The surprising truth about what motivates us. Riverhead Books.
Qualtrics Software. (2018). https://www.qualtrics.com
R Core Team (2019). R: A language and environment for statistical computing. R Foundation for Statistical Computing.
Renn, R. W., & Vandenberg, R. J. (1995). The critical psychological states: An underrepresented component in job characteristics model research. Journal of Management, 21, 279–303.
Ryan, R., & Deci, E. (2000). Self-determination theory and the facilitation of intrinsic motivation, social development, and well-being. American Psychologist, 55(1), 68–78.
Rheem, D. (2018). William Kahn: Father of employee engagement. https://donrheem.com/william-kahn-father-of-employee-engagement/
Rich, B. L., LePine, J. A., & Crawford, E. R. (2010). Job engagement: Antecedents and effects on job performance. Academy of Management Journal, 53, 617–635. http://dx.doi.org/10.5465/AMJ.2010.5146898
Schaufeli, W. B., Salanova, M., González-Romá, V., & Bakker, A. B. (2002). The measurement of engagement and burnout: A two sample confirmatory factor analytic approach. Journal of Happiness Studies, 3, 71–92. http://dx.doi.org/10.1023/A:1015630930326
Schaufeli, W., & Bakker, A. (2004). Utrecht Engagement Scale. Preliminary manual. Version 1.1. https://www.wilmarschaufeli.nl/publications/Schaufeli/Test%20Manuals/Test_manual_UWES_English.pdf
Selker, R., Love, J. & Dropmann, D. (2018). Jmv: The 'jamovi' analyses. R package version 0.9.6. https://CRAN.R-project.org/package=jmv
Shuck, B., Twyford, D., Reio, T. J., Jr., & Shuck, A. (2014). Human resource development practices and employee engagement: Examining the connection with employee turnover intentions. Human Resource Development Quarterly, 25, 239–270. http://dx.doi.org/10.1002/hrdq.21190
Wefald, A. J., Reichard, R. J., & Serrano, S. A. (2011). Fitting engagement into a nomological network: The relationship of engagement to leadership and personality. Journal of Leadership & Organizational Studies,18, 522–537. http://dx.doi.org/10.1177/1548051811404890

16
Appendix 1
Boss
1 My manager's goals have been clearly laid out for me:
Not at all 1 2 3 4 6 7 8 9 10 Explicitly and thoroughly
2 My manager's conception of my objectives seems:
Very Fuzzy 1 2 3 4 6 7 8 9 10 Crystal Clear
3 The overall goals of the organization are to me:
Very Fuzzy 1 2 3 4 6 7 8 9 10 Crystal Clear
4 My manager and I talk about information he/she needs:
Almost never 1 2 3 4 6 7 8 9 10 Frequently
5 In my relationship with my manager, I feel encouraged to:
Keep ideas and concerns to Myself
1 2 3 4 6 7 8 9 10 Share ideas and concerns
6 My manager allows me to creatively solve problems:
Never true 1 2 3 4 6 7 8 9 10 Often true
7 As a teacher, my manager is:
Ineffective 1 2 3 4 6 7 8 9 10 Effective
8 When it comes to the realities of working at my level, my manager seems to be:
Oblivious and confused
1 2 3 4 6 7 8 9 10 Concerned and knowledgeable
9 When I compare my opinion of my work performance to my manager's opinion, my manager's view is:
Far more negative than mine
1 2 3 4 6 7 8 9 10 The same or more positive than mine
10 When I hear that my manager has left me a message, I generally:
Dread returning the call
1 2 3 4 6 7 8 9 10 Look forward to returning the call
11 When my manager corrects me, I generally feel that he/she is trying to:
Accuse me 1 2 3 4 6 7 8 9 10 Help me
12 My manager seems to be looking for errors/problems in my work:
Often 1 2 3 4 6 7 8 9 10 Rarely
13 When my manager makes an error in work we're

17
doing together, he/she tends to:
Shift Responsibility to
me
1 2 3 4 6 7 8 9 10 Take responsibility
14 When I make a mistake, my manager eager to blame me.
Seems 1 2 3 4 6 7 8 9 10 Doesn't seem
15 My manager seem to have the capacity to trust.
Does not 1 2 3 4 6 7 8 9 10 Does
16 When I am swamped with work, my manager tends to be:
Impatient 1 2 3 4 6 7 8 9 10 Understanding
Co-workers
17 In my most difficult lateral relationship, the other person seems to understand what I am trying tto achieve:
Not at all 1 2 3 4 6 7 8 9 10 Explicitly and thoroughly
18 My co-workers' objectives hinder my objectives:
Frequently 1 2 3 4 6 7 8 9 10 Rarely
19 When I make constructive suggestions to my co-workers, they are:
Brushed aside 1 2 3 4 6 7 8 9 10 Carefully considered
20 In doing their work, my co-workers tend to:
Get in the way of my work
1 2 3 4 6 7 8 9 10 Facilitate my work
21 Among my co-workers, thinking of creative and/or effective ways to distribute resources happens:
Never 1 2 3 4 6 7 8 9 10 All the time
22 Co-workers tell me about personal problems they have with each other:
Often 1 2 3 4 6 7 8 9 10 Rarely
23 My co-worker's goals have been clearly laid out for me:
Not at all 1 2 3 4 6 7 8 9 10 Very clearly
24 My co-workers share helpful information with me:
Seldom 1 2 3 4 6 7 8 9 10 All the time
25 When there's a problem between our departments, my co-workers:
Blame me 1 2 3 4 6 7 8 9 10 Try to work out a solution
26 My co-workers feel accountable for their impact on my work.
Not at all 1 2 3 4 6 7 8 9 0 Highly
27 When I offer advice to my co-workers, they tend to be:
Defensive 1 2 3 4 6 7 8 9 0 Appreciative

18
28 When my co-workers are unhappy with me, they tend to:
Tell others 1 2 3 4 6 7 8 9 Come to me
29 When my co-workers are trying to solve problems between us, they generally
:
Ignore my opinion 1 2 3 4 6 7 8 9 10 Value my opinion
30 When it comes to process breakdowns between us, my co-workers tend to the problem.
See me as 1 2 3 4 6 7 8 9 10 See their contribution to
31 My co-workers seek my insight and feedback:
Rarely 1 2 3 4 6 7 8 9 10 Often
32 My co-workers share resources with me (budget, personnel, equipment, etc.):
Resistantly 1 2 3 4 6 7 8 9 10 Willingly
***