a new approach to map landscape variation in forest
TRANSCRIPT

J Appl Ecol. 2019;00:1–12. wileyonlinelibrary.com/journal/jpe | 1© 2019 The Authors. Journal of Applied Ecology © 2019 British Ecological Society
Received:4December2018 | Accepted:6August2019DOI:10.1111/1365-2664.13501
R E S E A R C H A R T I C L E
A new approach to map landscape variation in forest restoration success in tropical and temperate forest biomes
Renato Crouzeilles1,2,3 | Felipe S. M. Barros1,4 | Paulo G. Molin5 | Mariana S. Ferreira6 | André B. Junqueira1,2 | Robin L. Chazdon1,7,8 | David B. Lindenmayer9 | Julio R. C. Tymus10 | Bernardo B. N. Strassburg1,2,3 | Pedro H. S. Brancalion11
1InternationalInstituteforSustainability,RiodeJaneiro,Brazil;2RioConservationandSustainabilityScienceCentre,DepartmentofGeographyandtheEnvironment,PontifíciaUniversidadeCatólica,RiodeJaneiro,Brazil;3ProgramadePósGraduaçãoemEcologia,UniversidadeFederaldoRiodeJaneiro,RiodeJaneiro,Brazil;4ReferenceCenteronTechnologicalInformationandManagementSystemwithFreeSoftware(CeRTIG+SoL),NationalUniversityofMisiones,Posadas,Argentina;5CenterforNatureSciences,FederalUniversityofSãoCarlos,SãoCarlos,Brazil;6MestradoProfissionalemCiênciasdoMeioAmbiente,UniversidadeVeigadeAlmeida,RiodeJaneiro,Brazil;7DepartmentofEcologyandEvolutionaryBiology,UniversityofConnecticut,Storrs,CT,USA;8TropicalForestsandPeopleResearchCentre,UniversityoftheSunshineCoast,SunshineCoast,QLD,Australia;9SustainableFarms,FennerSchoolofEnvironmentandSociety,TheAustralianNationalUniversity,Canberra,ACT,Australia;10TheNatureConservancy,SãoPaulo,Braziland11DepartmentofForestSciences,“LuizdeQueiroz”CollegeofAgriculture,UniversityofSãoPaulo,Piracicaba,Brazil
CorrespondenceRenatoCrouzeillesEmail:[email protected]
Funding informationAustralianResearchCouncil
HandlingEditor:AlexFajardo
Abstract1. Ahighlevelofvariationofbiodiversityrecoverywithinalandscapeduringforestrestorationpresentsobstaclestoensurelarge-scale,cost-effectiveandlong-last-ingecologicalrestoration.Thereisanurgentneedtopredictlandscapevariationinforestrestorationsuccessataglobalscale.
2. Weconductedameta-analysiscomprising135study landscapestopredictandmap landscapevariation in forest restorationsuccess intropicalandtemperateforest biomes.Our analysiswasbasedon the amountof forest coverwithin alandscape—akeydriverof forest restoration success.Wecontrasted17gen-eralized linearmodelsmeasuring forestcoveratdifferent landscapesizes (withbuffersvaryingfrom5to200kmradii).Weidentifiedthemostplausiblemodelto predict andmap landscape variation in forest restoration success.We thenweightedlandscapevariationbytheamountofpotentiallyrestorableareas(agri-cultureandpasturelandareas)withinthesamelandscape.Finally,weestimatedrestorationcostsofimplementingBonnChallengecommitmentsinthreespecifictemperateandtropicalforestbiometypesintheUnitedStates,BrazilandUganda.
3. Landscapevariationdecreasedexponentially as theamountof forest cover in-creasedinthelandscape,withstrongereffectswithina5kmradius.Thirty-eightpercentofforestbiomeshavelandscapeswithmorethan27%offorestcoverandshowedlevelsoflandscapevariationbelow10%.Landscapeswithlessthan6%offorestcovershowedlevelsofvariationinforestrestorationsuccessabove50%.
4. Atthebiomelevel,TropicalandSubtropicalMoistBroadleafForestshadthelow-est(12.6%),whereasTropicalandSubtropicalDryBroadleafForestshadthehigh-est(22.9%)averageofweightedlandscapevariationinforestrestorationsuccess.

2 | Journal of Applied Ecology CROUZEILLES Et aL.
1 | INTRODUC TION
Given high levels of deforestation and degradation of previouslyforestedlandsworldwide,togetherwithseriousthreatsfromglobalclimatechange,severalinternationalandcountry-ledeffortsaimtoboost forest and landscape restoration. To date, over 59 commit-mentshavebeenpledgedtorestore170Mhaofdeforestedlandsby2030underinternationalinitiativessuchastheBonnChallengeandtheNewYorkDeclarationonForests(Chazdonetal.,2017).Theseinitiativesaresupportedbynationalgovernments,investors,devel-opmentbanks,andbilateralandmultilateralfunders(Brancalionetal.,2017).TheywillrequireanestimatedUS$18–300billionperyeartobeimplemented(Dingetal.,2017).Itisnotclearhowandwhenthesefundswillbeavailable to restoration initiatives,butconsen-susexiststhateachdollarinvestedinrestorationneedstobespentinthemostecologicallyandeconomicallyefficientway(Dingetal.,2017;Verdone&Seidl,2017).
The cost-effectiveness of restoration (e.g. actions generatinggreatestsocio-ecologicalbenefitperunitofopportunityand/orim-plementation cost) can differwidely among restoration initiatives(Birchetal.,2010;Molin,Chazdon,Ferraz,&Brancalion,2018)andmethods (Brancalion, Campoe, et al., 2019). Measured outcomescan range from near-total success in achieving specific targets tocomplete failure (Crouzeilles, Curran, et al., 2016). Outcomes arestronglyinfluencedbyspatialvariationintheecological,biophysicalandsocio-economiccharacteristicsoflandscapeswhereforestres-torationis implemented(Crouzeillesetal.,2017;Melietal.,2017).Investors operating in different businesses usually avoid high-risktransactions,whichlikelyconstrainstheflowoffinancialresourcesto restoration initiatives perceived as financially risky (Ding et al.,2017).Thus,thehighlevelofunpredictabilityinbiodiversityrecov-ery in forests undergoing restoration (hereafter restoring forests)increasestherisksassociatedwithinvestmentsinecologicalresto-rationprogrammes.Thishighlevelofunpredictabilitycanconstrainboth long-term ecological sustainability and functionality, and ex-pectedmultiplebenefitsofrestorationforbiodiversity,ecosystemservices,andhumanwell-being.
Here,wedevelopanewapproachtopredictandmaplandscapevariation in forest restoration success in tropical and temperateforest biomes. Landscape variation emerges from comparisons ofvalues of biodiversity recovery (measured through multiple eco-logicalmetrics for different taxonomic groups) between restoringandreferenceforestswithindifferentsamplingsitesinalandscape.Thus,our approachwasdevelopedby conductingameta-analysison biodiversity recovery (e.g. Crouzeilles, Curran, et al., 2016) fordeveloping spatially explicitmaps that predict landscape variationinforestrestorationsuccessbasedonecologicaland/orsocio-eco-nomicfactors.Ourmapidentifieslandscapesinpreviouslyforestedlandswhererestoration ismost likely tofosterbiodiversity recov-erytowardslevelstypicalofreferenceforestecosystems.Ournovelanalysisopensnewopportunitiesforpolicy-makers,entrepreneurs,practitionersandresearchers to (a)establish forest landscaperes-toration targets and identify cost-effective priority areas for res-toration, (b) improve regulations forbiodiversityoffsetting and (c)estimateimplementationcostsofforestrestorationataglobalscale.Animportantaspectofsuchanapproachisestimatingtheeffectsofkeyecologicaland/orsocio-economicfactorsaffectinglandscapevariationandpredictingthemataglobalscale.
Theamountofforestcoverwithinalandscapeiseasilymeasuredusingglobal landcoverdatabases,and it isakeyecologicaldriverof the forest restoration processes (reviewed by Leite, Tambosi,Romitelli,&Metzger,2013).Forestcovercanactbothasasourceofseedsforre-colonizationofnativeplantspeciesandasaproviderofcriticalhabitatforseeddispersinganimals(Chazdon,2003;Helmer,Brandeis,Lugo,&Kennaway,2008).Previousstudiesrevealedthatbiodiversity recovery in restoring forests varies substantially de-pendingontheamountofforestcoverinthelandscape(Crouzeilles&Curran,2016).Therefore,suchrelationshipcouldbeusedtomapvariationinforestrestorationsuccessofotherlandscapes.
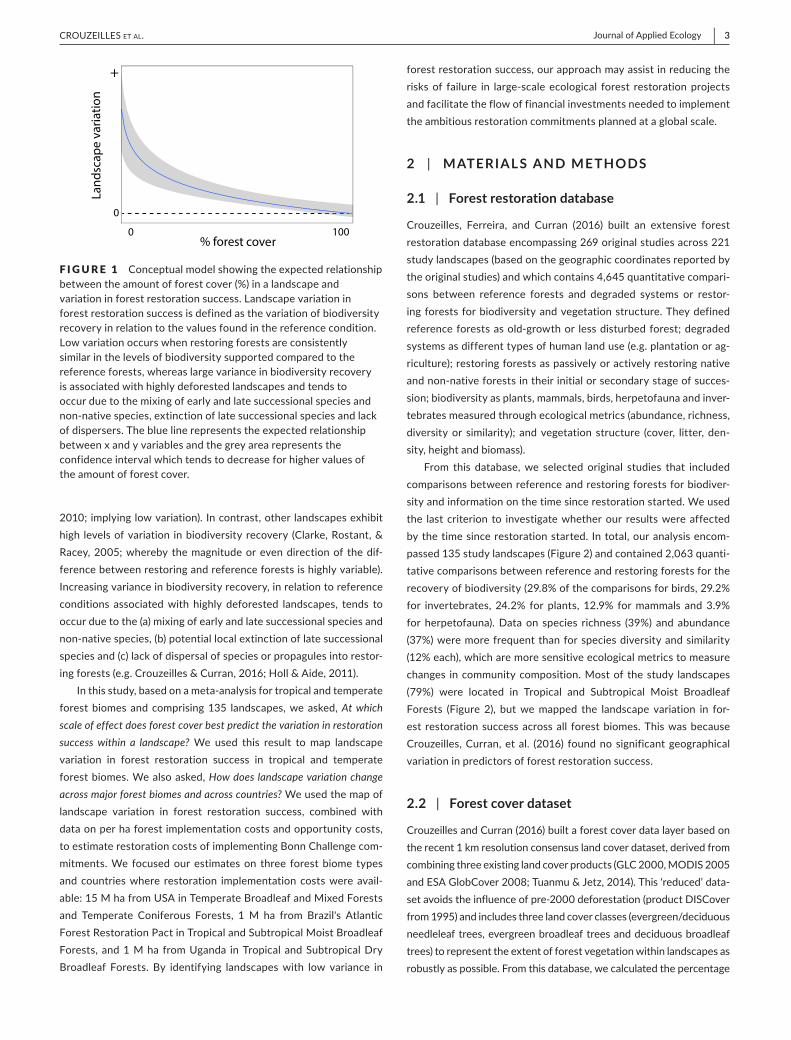
Weproposeanewconceptualmodelfortheexpectedrelation-shipbetweentheamountofforestcover ina landscapeand land-scape variation in forest restoration success (Figure 1). That is, insomelandscapes,restoringforestsaresimilartothereferencefor-estsintermsofthelevelsofbiodiversitysupported(Klanderudetal.,
Our approach can lead to a reduction in implementation costs for each BonnChallengecommitmentbetweenUS$973Miand9.9Bi.
5. Policy implications.Ourapproachidentifieslandscapecharacteristicsthatincreasethelikelihoodofbiodiversityrecoveryduringforestrestoration—andpotentiallythe chancesof natural regeneration and long-termecological sustainability andfunctionality.Identifyingareaswithlowlevelsoflandscapevariationcanhelptoreducetherisksandfinancialcostsassociatedwithimplementingambitiousresto-rationcommitments.
K E Y W O R D S
biodiversity,forestlandscaperestoration,GIS,globalrestorationcommitments,habitatloss,landscapeecology,meta-analysis,naturalregeneration
| 3Journal of Applied EcologyCROUZEILLES Et aL.
2010;implyinglowvariation).Incontrast,otherlandscapesexhibithigh levelsofvariation inbiodiversityrecovery (Clarke,Rostant,&Racey,2005;whereby themagnitudeorevendirectionof thedif-ferencebetweenrestoringandreferenceforestsishighlyvariable).Increasingvarianceinbiodiversityrecovery,inrelationtoreferenceconditions associatedwith highly deforested landscapes, tends tooccurduetothe(a)mixingofearlyandlatesuccessionalspeciesandnon-nativespecies,(b)potentiallocalextinctionoflatesuccessionalspeciesand(c)lackofdispersalofspeciesorpropagulesintorestor-ingforests(e.g.Crouzeilles&Curran,2016;Holl&Aide,2011).
Inthisstudy,basedonameta-analysisfortropicalandtemperateforestbiomesandcomprising135 landscapes,weasked,At which scale of effect does forest cover best predict the variation in restoration success within a landscape?We used this result tomap landscapevariation in forest restoration success in tropical and temperateforestbiomes.Wealsoasked,How does landscape variation change across major forest biomes and across countries?Weusedthemapoflandscape variation in forest restoration success, combined withdataonperhaforestimplementationcostsandopportunitycosts,toestimaterestorationcostsofimplementingBonnChallengecom-mitments.We focusedourestimateson three forestbiome typesandcountrieswhere restoration implementationcostswereavail-able:15MhafromUSAinTemperateBroadleafandMixedForestsand Temperate Coniferous Forests, 1M ha from Brazil's AtlanticForestRestorationPactinTropicalandSubtropicalMoistBroadleafForests, and1Mha fromUganda inTropicalandSubtropicalDryBroadleaf Forests. By identifying landscapeswith low variance in
forestrestorationsuccess,ourapproachmayassistinreducingtherisksof failure in large-scale ecological forest restorationprojectsandfacilitatetheflowoffinancialinvestmentsneededtoimplementtheambitiousrestorationcommitmentsplannedataglobalscale.
2 | MATERIAL S AND METHODS
2.1 | Forest restoration database
Crouzeilles, Ferreira, and Curran (2016) built an extensive forestrestorationdatabaseencompassing269originalstudiesacross221studylandscapes(basedonthegeographiccoordinatesreportedbytheoriginalstudies)andwhichcontains4,645quantitativecompari-sons between reference forests and degraded systems or restor-ingforestsforbiodiversityandvegetationstructure.Theydefinedreferenceforestsasold-growthor lessdisturbedforest;degradedsystemsasdifferenttypesofhumanlanduse(e.g.plantationorag-riculture);restoringforestsaspassivelyoractivelyrestoringnativeandnon-nativeforestsintheirinitialorsecondarystageofsucces-sion;biodiversityasplants,mammals,birds,herpetofaunaandinver-tebratesmeasuredthroughecologicalmetrics(abundance,richness,diversityor similarity); andvegetation structure (cover, litter,den-sity,heightandbiomass).
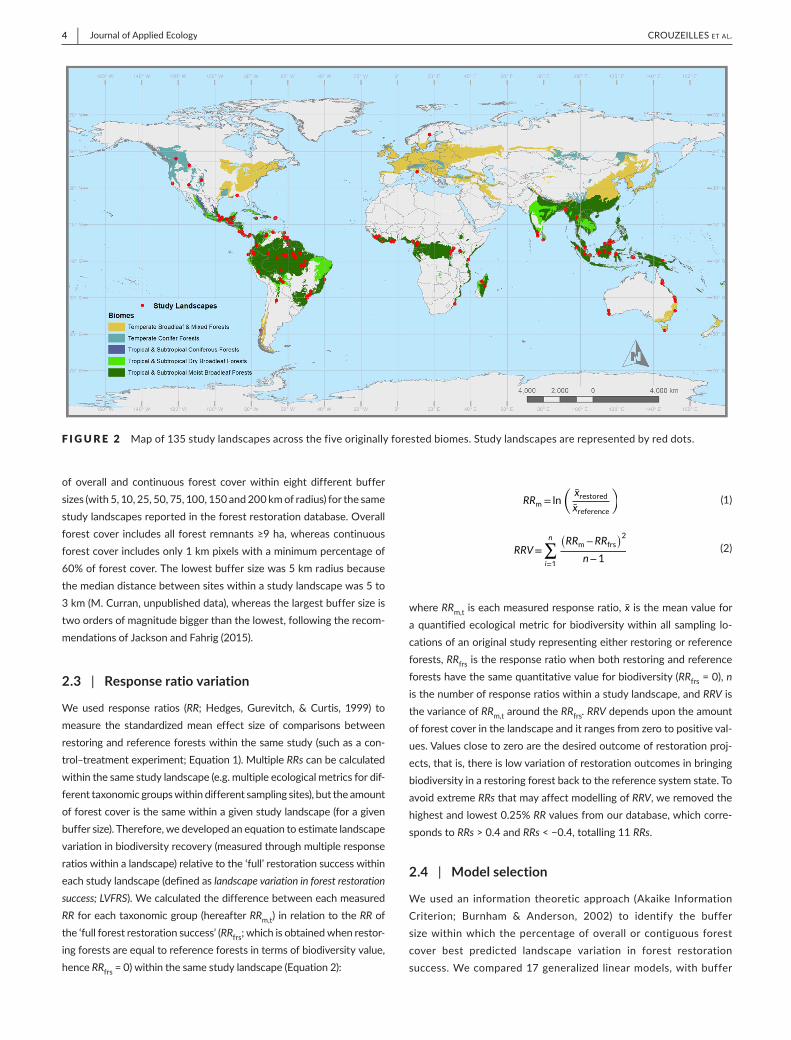
From this database,we selected original studies that includedcomparisonsbetweenreferenceandrestoringforestsforbiodiver-sityandinformationonthetimesincerestorationstarted.Weusedthe last criterion to investigatewhetherour resultswereaffectedbythetimesincerestorationstarted. Intotal,ouranalysisencom-passed135studylandscapes(Figure2)andcontained2,063quanti-tativecomparisonsbetweenreferenceandrestoringforestsfortherecoveryofbiodiversity(29.8%ofthecomparisonsforbirds,29.2%for invertebrates, 24.2% for plants, 12.9% formammals and3.9%for herpetofauna).Dataon species richness (39%) and abundance(37%)weremorefrequentthanforspeciesdiversityandsimilarity(12%each),whicharemoresensitiveecologicalmetricstomeasurechanges incommunitycomposition.Mostof thestudy landscapes(79%) were located in Tropical and Subtropical Moist BroadleafForests (Figure 2), butwemapped the landscape variation in for-est restorationsuccessacrossall forestbiomes.ThiswasbecauseCrouzeilles,Curran,etal. (2016) foundnosignificantgeographicalvariationinpredictorsofforestrestorationsuccess.
2.2 | Forest cover dataset
CrouzeillesandCurran(2016)builtaforestcoverdatalayerbasedontherecent1kmresolutionconsensuslandcoverdataset,derivedfromcombiningthreeexistinglandcoverproducts(GLC2000,MODIS2005andESAGlobCover2008;Tuanmu&Jetz,2014).This‘reduced’data-setavoidstheinfluenceofpre-2000deforestation(productDISCoverfrom1995)andincludesthreelandcoverclasses(evergreen/deciduousneedleleaftrees,evergreenbroadleaftreesanddeciduousbroadleaftrees)torepresenttheextentofforestvegetationwithinlandscapesasrobustlyaspossible.Fromthisdatabase,wecalculatedthepercentage
F I G U R E 1 Conceptualmodelshowingtheexpectedrelationshipbetweentheamountofforestcover(%)inalandscapeandvariationinforestrestorationsuccess.Landscapevariationinforestrestorationsuccessisdefinedasthevariationofbiodiversityrecoveryinrelationtothevaluesfoundinthereferencecondition.Lowvariationoccurswhenrestoringforestsareconsistentlysimilarinthelevelsofbiodiversitysupportedcomparedtothereferenceforests,whereaslargevarianceinbiodiversityrecoveryisassociatedwithhighlydeforestedlandscapesandtendstooccurduetothemixingofearlyandlatesuccessionalspeciesandnon-nativespecies,extinctionoflatesuccessionalspeciesandlackofdispersers.Thebluelinerepresentstheexpectedrelationshipbetweenxandyvariablesandthegreyarearepresentstheconfidenceintervalwhichtendstodecreaseforhighervaluesoftheamountofforestcover.
Land
scap
e va
riatio
n
0
+
% forest cover0 100
4 | Journal of Applied Ecology CROUZEILLES Et aL.
of overall and continuous forest coverwithin eight different buffersizes(with5,10,25,50,75,100,150and200kmofradius)forthesamestudylandscapesreportedintheforestrestorationdatabase.Overallforestcover includesall forest remnants≥9ha,whereascontinuousforestcoverincludesonly1kmpixelswithaminimumpercentageof60%offorestcover.Thelowestbuffersizewas5kmradiusbecausethemediandistancebetweensiteswithinastudylandscapewas5to3km(M.Curran,unpublisheddata),whereasthelargestbuffersizeistwoordersofmagnitudebiggerthanthelowest,followingtherecom-mendationsofJacksonandFahrig(2015).
2.3 | Response ratio variation
We used response ratios (RR; Hedges, Gurevitch, & Curtis, 1999) tomeasure the standardizedmean effect size of comparisons betweenrestoringandreferenceforestswithinthesamestudy(suchasacon-trol–treatmentexperiment;Equation1).MultipleRRscanbecalculatedwithinthesamestudylandscape(e.g.multipleecologicalmetricsfordif-ferenttaxonomicgroupswithindifferentsamplingsites),buttheamountofforestcoveristhesamewithinagivenstudylandscape(foragivenbuffersize).Therefore,wedevelopedanequationtoestimatelandscapevariationinbiodiversityrecovery(measuredthroughmultipleresponseratioswithinalandscape)relativetothe‘full’restorationsuccesswithineachstudylandscape(definedaslandscape variation in forest restoration success; LVFRS).WecalculatedthedifferencebetweeneachmeasuredRRforeachtaxonomicgroup(hereafterRRm,t) inrelationtotheRRofthe‘fullforestrestorationsuccess’(RRfrs;whichisobtainedwhenrestor-ingforestsareequaltoreferenceforestsintermsofbiodiversityvalue,henceRRfrs=0)withinthesamestudylandscape(Equation2):
whereRRm,tiseachmeasuredresponseratio, x̄isthemeanvalueforaquantifiedecologicalmetric forbiodiversitywithinall sampling lo-cationsofanoriginalstudyrepresentingeitherrestoringorreferenceforests,RRfrsistheresponseratiowhenbothrestoringandreferenceforestshavethesamequantitativevalueforbiodiversity(RRfrs=0),n isthenumberofresponseratioswithinastudylandscape,andRRVisthevarianceofRRm,taroundtheRRfrs. RRVdependsupontheamountofforestcoverinthelandscapeanditrangesfromzerotopositiveval-ues.Valuesclosetozeroarethedesiredoutcomeofrestorationproj-ects,thatis,thereislowvariationofrestorationoutcomesinbringingbiodiversityinarestoringforestbacktothereferencesystemstate.ToavoidextremeRRsthatmayaffectmodellingofRRV,weremovedthehighestandlowest0.25%RRvaluesfromourdatabase,whichcorre-spondstoRRs > 0.4 and RRs<−0.4,totalling11RRs.
2.4 | Model selection
Weusedan information theoretic approach (Akaike InformationCriterion; Burnham & Anderson, 2002) to identify the buffersizewithinwhich thepercentageofoverallor contiguous forestcover best predicted landscape variation in forest restorationsuccess.Wecompared17generalized linearmodels,withbuffer
(1)RRm= ln
(x̄restored
x̄reference
)
(2)RRV=
n∑i=1
(RRm−RRfrs
)2n−1
F I G U R E 2 Mapof135studylandscapesacrossthefiveoriginallyforestedbiomes.Studylandscapesarerepresentedbyreddots.
| 5Journal of Applied EcologyCROUZEILLES Et aL.
size varying from 5 to 200 km (5, 10, 25, 50, 75, 100, 150 and200kmradius)andwithdataoneithercontinuousoroverallfor-estcover,plusanullmodel.Wemodelled landscapevariation inforest restorationsuccessassumingagammadistributionwherethe values were continuous and varying between 0 and posi-tive infinite (Bolker,2008).We log-transformed thepercentagesof overall and contiguous forest cover followingCrouzeilles andCurran (2016) because these could be non-linearly relatedwithlandscape variation in forest restoration success. We avoidedpseudo-spatial-auto-correlationusingonlyonevalueoflandscapevarianceperstudylandscape.Foreachmodel,wecalculatedtheAkaike InformationCriterion corrected for small samples (AICc),theΔAICcasAICci−minimumAICc,andtheAkaikeweight (wi),whichindicatestheprobabilitythatthemodeliisthebestmodelwithintheset.Finally,wealsocalculatedanevidenceratio,whichwasusedtocomparethemodel'srelativegoodnessoffit (w1/wj,wheremodel1istheestimatedbestmodelandjindexestherestofthemodelsintheset;Burnham&Anderson,2002).ModelswithΔAICci<2canbeconsideredequallyplausible,butweconsideredthetop-rankedmodelonly (i.e. lowestAICcandhighestwi).Thiswasbecausewewereinterestedinthemodelthatbestexplainedlandscapevariationinforestrestorationsuccess.
Manyfactors(e.g.climateandlandusechange)mayaffectland-scape variation in forest restoration effectiveness for biodiversity(Spake&Doncaster,2017),buttheeffectsofsuchfactorsonland-scape variation have not previously been studied. We thereforefocusedonthestrongandrecognizedrelationshipbetweenforestcover and landscape variation in forest restoration success (e.g.Crouzeilles&Curran,2016).However,wealsoinvestigatedwhetherlandscape variation in forest restoration success was affected byeitherthenumberofresponseratioswithinastudylandscape(i.e.number of comparisons between restoring and reference forestsforbiodiversity)orthetimesincerestorationstartedusingPearsonregressions.We did not include both the number of response ra-tios and the time since restoration started in themodel selectionbecauseweaimedtobuildaspatiallyexplicitpredictivemodel,thatis,weneededtoworkonlywithvariablesthatwerepredictableinspace,which does not apply to sample size and time since resto-rationstarted.
2.5 | Mapping landscape variation in forest restoration success in tropical and temperate forest biomes
Todefineourstudyarea,weconsideredonlytropicalandtemperateforestbiomes,basedonageospatialdataset(Dinersteinetal.,2017).We thenused theupdatedversion (2016)of thegeospatial datasetfromthe21st-centuryforestcoverchangebetween2000and2012(Hansen et al., 2013; updated version is available at Global ForestWatch,2016) tomap forestedandnon-forestedareas.Thisdatasetcontains informationontheamountofvegetationtallerthan5minheightwithineach30mpixelfortheyear2000,aswellaspixelssub-jecttoforestlossbetween2001and2016.Toobtainvaluesforforest
coverin2016,weexcludedforestlosspixelsbetween2001and2016fromthe forestcovermapof2000.Weresampledthe forestcovermapof2016to1kmpixelsize,thesameresolutionoftheforestcoverdatasetfromCrouzeillesandCurran(2016).Thatis,theamountoftreecanopycoverwithina1kmpixelsizewasthemeanofthetreecanopycoverofallthe30mpixelsthatfellwithinthe1kmpixel.
Wemaskednon-restorableareaswithintheforestbiomes.Weconsiderednon-restorableareastobe1kmpixelswith100%oftreecanopy cover, urban areas,water bodies aswell as locations thatwerenotpreviouslyforested(e.g.grasslands).Weobtaineddataon1kmpixelswith100%treecanopycoverfromtheforestcovermapin2016.Weobtaineddataonurbanareasandwaterbodies fromthe global CCI-LCmap (ESAClimateChange Initiative, 2017).Wealsoconsideredwetlandsasnon-restorableplacesbecausetheres-torationofwetlandsdemandsdifferentkindsofmanagementthanexaminedinthisstudy.WeobtaineddataonwetlandsfromGIEMS-D15 (Fluet-Chouinard, Lehner, Rebelo, Papa, & Hamiton, 2015;Prigent,Papa,Rossow,&Matthews,2017).
Weused thebest fittingmodel from themodel selection (seetheResultssection)tomaplandscapevariationinforestrestorationsuccess(LVFRS).Thus,wecalculatedthepercentageofforestcoversurroundingeach1kmfocalpixelwithinabuffersizeof5kmradiusandthenappliedtheglobalequationforeachpotentialpixeltoberestored,andtheequationsisasfollows(Equation3):
wherethebuffersizeof5kmradiuswasthetop-rankedmodeltopredicttheeffectsofpercentageofforestcoveronlandscapevaria-tioninforestrestorationsuccess.Finally,westandardizedlandscapevariation in forest landscape restoration success (SLVFRS) to varybetween 0% (minimum variation) and 100% (maximum variation;Equation4):
Whenlandscapevariationis100%,itmeansthatrestorationsuc-cessforbiodiversityishighlyvariable(i.e.unpredictable).
2.6 | Bonn challenge commitments as a case study
WeusedthreeBonnChallengecommitmentstoshowhowourap-proachcanbeusedtoestimateimplementationcostsofforestres-torationindifferenttypesofforestbiomes.Theseareasfollows:15MhafromUSAinTemperateBroadleafandMixedForestsandTemperateConiferousForests,1MhafromBrazil'sAtlanticForestRestoration Pact in Tropical and Subtropical Moist BroadleafForests,and1MhafromUgandainTropicalandSubtropicalDryBroadleafForests.Ugandacommitted2.5Mhaofthreetypesofnativevegetation(forests,savannahsandgrasslands)forrestora-tion,butthelargestareasareforforestrestoration.Weassumed
(3)
LVFRS=1.37595−0.23498∗
lognatural
⎛⎜⎜⎝
%overall forest cover with a
buffer of 5km radius+1
⎞⎟⎟⎠
(4)SLVFRS=LVFRS−LVFRSmin
LVFRSmax−LVFRSmin
∗100
6 | Journal of Applied Ecology CROUZEILLES Et aL.
at least1Mhaof forestsasourtargetedareaforrestoration inUganda.
To estimate the total implementation cost of each commit-ment,wemadethefollowingassumptions:(a)implementationcostislinearlypositivelyrelatedwiththelandscapevariationinforestrestoration success (i.e. restoration is more expensive in land-scapeswithhighervariation in forest restoration success— thisisapotentialsurrogateofthelowerchancesofnaturalregenera-tionandlong-termecologicalsustainabilityandfunctionality;e.g.Strassburgetal.,2019)and(b)thetotalrestorationareapledgedwill be implemented within landscapes with either the lowestlandscapevariationorthelowestopportunitycosts.Thus,imple-mentationcostwasestimatedusing(Equation5):
whereSLVFRSisthestandardizedlandscapevariation,andfulltreeplantingcostrepresentsthemostexpensivemethodforactiveres-toration. Implementation cost will be higher when the SLVFRS islower.Theperhafull treeplantingcostwasestimatedtobe (US$mean± standard deviation): 677±363 inUSA (CrawfordCountyConservationDistricts, 2007;Stringer,2009;VirginiaDepartmentof Forestry, 2018), 3,504 ± 915 in the Brazilian Atlantic Forest(Benini & Adeodato, 2017; Serviço Florestal Brasileiro, 2017) and1,179 ± 439 inUganda (Ministry ofWater & Environment, 2016;Omejaetal.,2011;Omeja,Obua,Rwetsiba,&Chapman,2012).
We estimated the reduced implementation cost of prioritiz-ing natural regeneration when SLVFRS is low compared to thecost of implementing only full tree planting as the restorationmethodusedtoreacheachtargetcommitted.Wealsoestimatedthetotalopportunitycostforeachcommitmentwhenidentifyinglandscapeswith either the lowest landscape variation or lowestopportunity costs.Opportunity cost represents the cost of set-ting aside land for restoration instead of using it for other pur-poses.WecalculatedtotalopportunitycostbasedonNaidooandIwamura(2007).
3 | RESULTS
3.1 | At which scale of effect does forest cover best predict the variation in restoration success within a landscape?
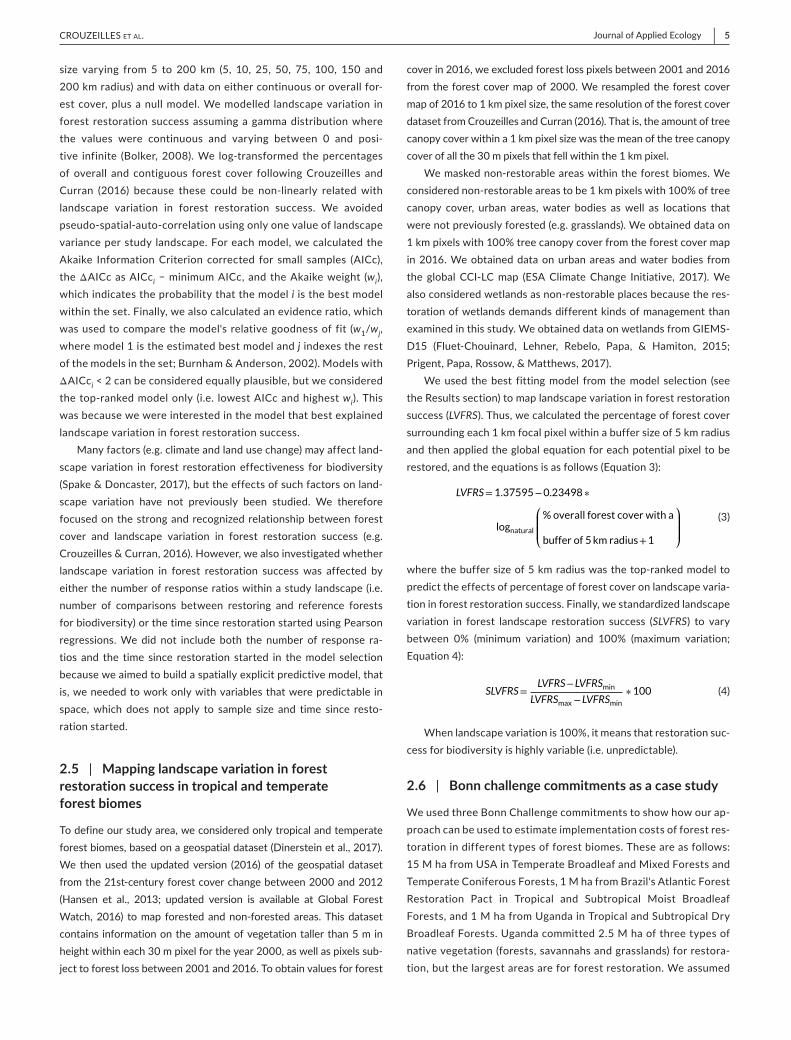
Ourtop-rankedmodelexplaininglandscapevariationinforestres-toration success included the percentage of overall forest covermeasuredatabuffersizeof5km(wi=0.4;Table1andFigure3).Thesecond-rankedmodel,whichincludedthepercentageofoverallforestcovermeasuredatabuffersizeof10kmradius,wasequallyplausible(ΔAICci=1.09,wi=0.23).Theevidenceratioofthetop-rankedmodelwasonly1.74 timeshigher than the second-rankedmodel, but400 timeshigher than thenullmodel, highlighting theimportanceofforestcoverinexplaininglandscapevariationinfor-estrestorationsuccess(Table1).Weselectedthetop-rankedmodeltobuildthemapoflandscapevariationinforestrestorationsuccess
(Table1). If the second-rankedmodelwasused,wewouldexpectsimilarresults,asvariablesincludedinthetop-rankedandsecond-rankedmodels(percentageofforestcoverat5kmand10kmradius,
(5)Inplementation cost=SLVFRS∗US$ full tree planting cost
TA B L E 1 Performanceof17modelspredictingthelandscapevariationinforestrestorationsuccess
Model AICc ΔAICc wi
Overall5km 206.33 0.00 0.40
Overall10km 207.42 1.09 0.23
Continuous200km 208.63 2.30 0.13
Overall25km 209.62 3.29 0.08
Continuous150km 209.7 3.38 0.07
Continuous100km 211.56 5.23 0.03
Overall50km 211.89 5.57 0.02
Continuous75km 213.88 7.55 0.01
Overall75km 214.51 8.18 0.01
Overall100km 215.95 9.63 0.00
Continuous50km 216.23 9.90 0.00
Continuous25km 216.92 10.59 0.00
Null 217.79 11.47 0.00
Continuous10km 218.31 11.98 0.00
Overall150km 219.25 12.92 0.00
Continuous5km 219.62 13.29 0.00
Overall200km 219.88 13.55 0.00
Note: Overall=percentageofoverallforestcover,Continuous=per-centageofcontinuousforestcover,km=kmradius.Anullmodelwasalsoincludedforcomparison.AICc=AkaikeInformationCriterioncorrectedforsmallratioofsamplesize/numberofparameters,ΔAICc=AICc−minimumAICc,wi=Akaikeweight.
F I G U R E 3 Relationshipbetweenlandscapevariationinforestrestorationsuccessforbiodiversityandpercentageofoverallforestcovermeasuredatabuffersizeof5kmradius(x-axis)forbiodiversity.Pointsrepresentvariationinforestrestorationsuccessobtainedfromallresponseratiosateachstudylandscape.Blueline=meanvalueandgreyline=95%confidenceintervals.
% forest cover
Resp
onse
ratio
var
ianc
e
1007550250
0
1
2
3
4
| 7Journal of Applied EcologyCROUZEILLES Et aL.
respectively)were98%correlated.Wefoundthatlandscapevaria-tioninforestrestorationsuccesswasneitheraffectedbythesam-plesize(Pearson'sr=.11,p=.19)norbythetimesincerestorationstarted(Pearson'sr=−.02,p=.85).
3.2 | How landscape variation change across major global forest biomes and across countries?
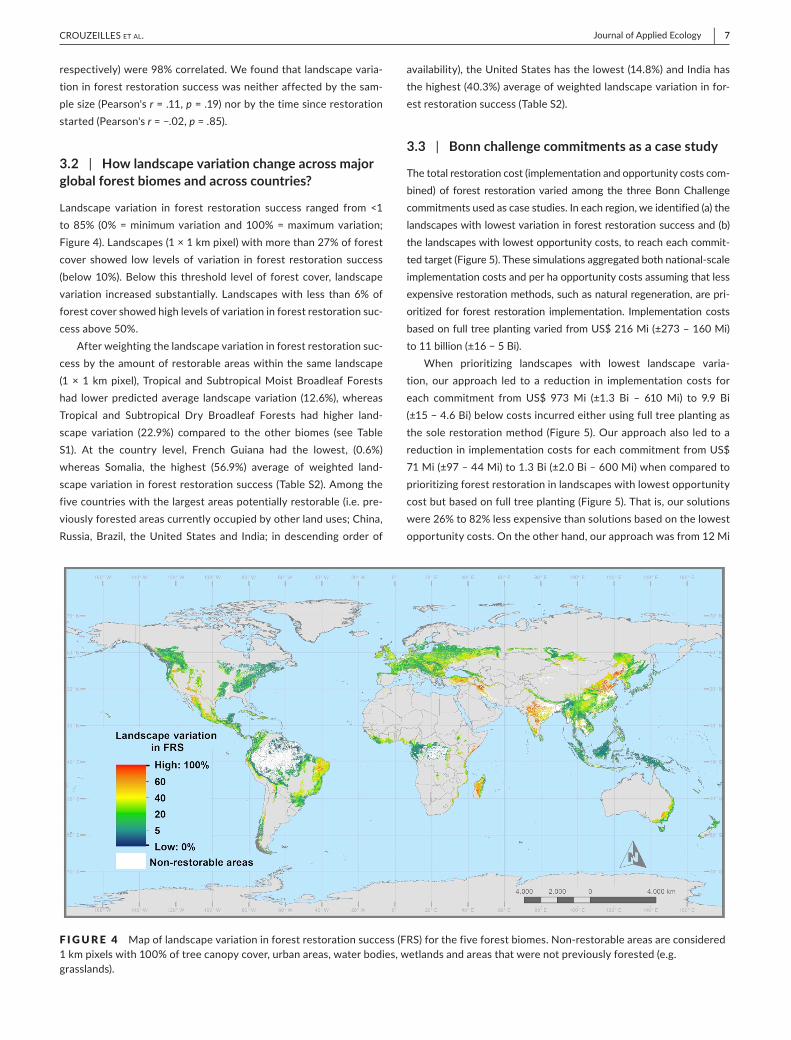
Landscape variation in forest restoration success ranged from <1to85% (0%=minimumvariationand100%=maximumvariation;Figure4).Landscapes(1×1kmpixel)withmorethan27%offorestcover showed low levels of variation in forest restoration success(below10%).Belowthis threshold levelof forestcover, landscapevariation increased substantially. Landscapeswith less than6%offorestcovershowedhighlevelsofvariationinforestrestorationsuc-cessabove50%.
Afterweightingthelandscapevariationinforestrestorationsuc-cessbytheamountofrestorableareaswithinthesamelandscape(1×1kmpixel),Tropical andSubtropicalMoistBroadleafForestshad lowerpredictedaverage landscapevariation (12.6%),whereasTropical and Subtropical Dry Broadleaf Forests had higher land-scape variation (22.9%) compared to the other biomes (see TableS1). At the country level, French Guiana had the lowest, (0.6%)whereas Somalia, the highest (56.9%) average of weighted land-scapevariationinforestrestorationsuccess(TableS2).Amongthefivecountrieswiththelargestareaspotentiallyrestorable(i.e.pre-viouslyforestedareascurrentlyoccupiedbyotherlanduses;China,Russia,Brazil, theUnitedStates and India; indescendingorderof
availability),theUnitedStateshasthelowest(14.8%)andIndiahasthehighest(40.3%)averageofweightedlandscapevariationinfor-estrestorationsuccess(TableS2).
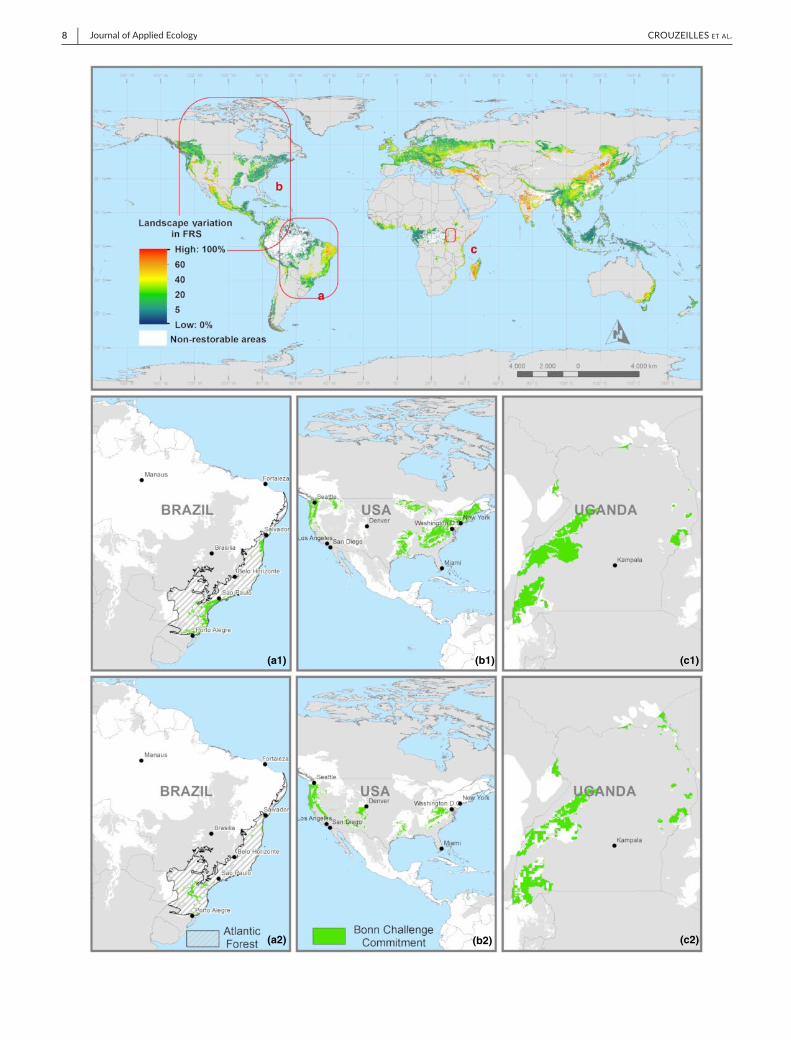
3.3 | Bonn challenge commitments as a case study
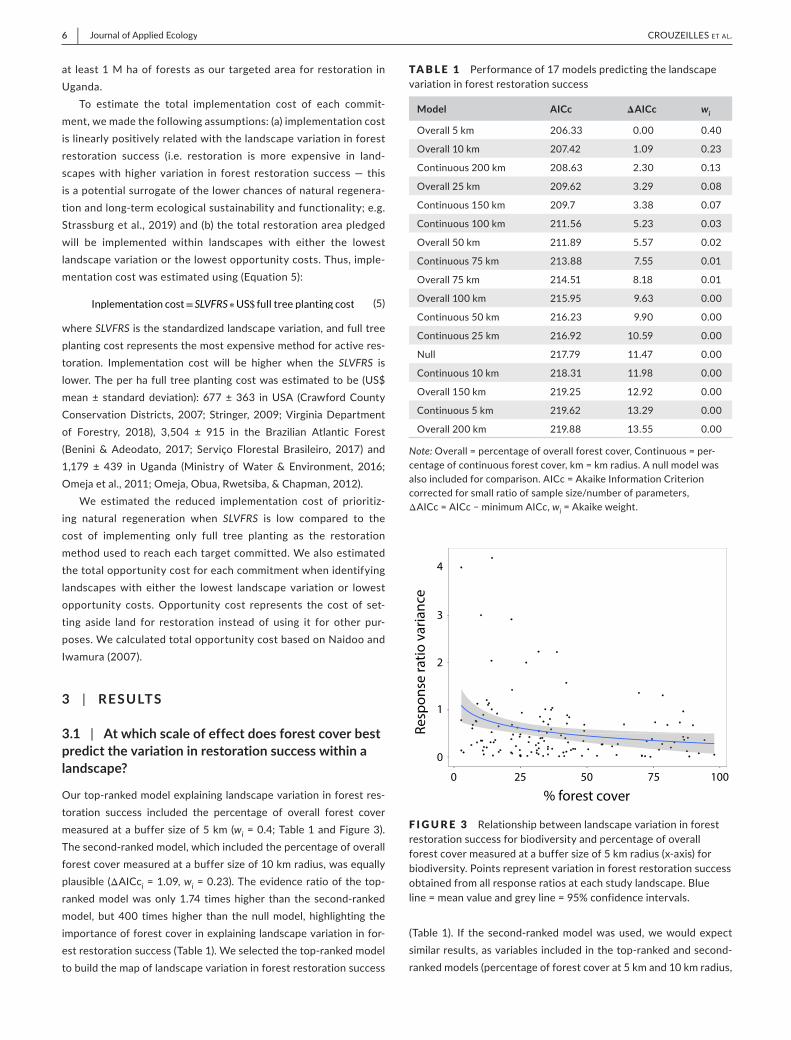
Thetotalrestorationcost(implementationandopportunitycostscom-bined)of forest restorationvariedamong the threeBonnChallengecommitmentsusedascasestudies.Ineachregion,weidentified(a)thelandscapeswithlowestvariationinforestrestorationsuccessand(b)thelandscapeswithlowestopportunitycosts,toreacheachcommit-tedtarget(Figure5).Thesesimulationsaggregatedbothnational-scaleimplementationcostsandperhaopportunitycostsassumingthatlessexpensiverestorationmethods,suchasnaturalregeneration,arepri-oritized for forest restoration implementation. ImplementationcostsbasedonfulltreeplantingvariedfromUS$216Mi(±273–160Mi)to11billion(±16−5Bi).
When prioritizing landscapes with lowest landscape varia-tion, our approach led to a reduction in implementation costs foreach commitment from US$ 973Mi (±1.3 Bi – 610Mi) to 9.9 Bi(±15−4.6Bi)belowcostsincurredeitherusingfulltreeplantingasthesolerestorationmethod (Figure5).Ourapproachalso ledtoareductioninimplementationcostsforeachcommitmentfromUS$71Mi(±97–44Mi)to1.3Bi(±2.0Bi–600Mi)whencomparedtoprioritizingforestrestorationinlandscapeswithlowestopportunitycostbutbasedonfulltreeplanting(Figure5).Thatis,oursolutionswere26%to82%lessexpensivethansolutionsbasedonthelowestopportunitycosts.Ontheotherhand,ourapproachwasfrom12Mi
F I G U R E 4 Mapoflandscapevariationinforestrestorationsuccess(FRS)forthefiveforestbiomes.Non-restorableareasareconsidered1kmpixelswith100%oftreecanopycover,urbanareas,waterbodies,wetlandsandareasthatwerenotpreviouslyforested(e.g.grasslands).
8 | Journal of Applied Ecology CROUZEILLES Et aL.
(a1)
(a2)
(b1)
(b2)
(c1)
(c2)

| 9Journal of Applied EcologyCROUZEILLES Et aL.
to282Mimoreexpensiveintermsofopportunitycostthanwhenidentifyinglandscapeswithlowestopportunitycosts.
4 | DISCUSSION
As expected, landscape variation in forest restoration success intemperate and tropical forest biomes decreased exponentially astheamountofforestcoverincreasedwithinalandscape.Wefoundthestrongestscaleofeffectswaswithinabuffersizeof5kmradius— followed by an equally plausiblemodelmeasuring forest coverat a buffer sizeof 10 km radius. That is, both restoration success(seeCrouzeilles&Curran,2016)anditsvariationinrelationtothequantitativevaluesofbiodiversity found in reference systemsarebestpredictedbyforestcoverwithinabuffersize(landscape)of5to10kminradius.
Wemapped,forthefirsttime,landscapevariationinforestres-torationsuccessacrossmajorforestbiomes,whichishigheracrosscountries than across the biomes. Landscapes where the forestcoverhasdeclinedbelow30%showincreasedlandscapevariationinforestrestorationsuccess.Nonetheless,thegoodnewsisthattheforestbiomeswithlargerpotentiallyrestorableareasarethosewithlower landscapevariationinforestrestorationsuccess(TemperateBroadleaf and Mixed Forests, Temperate Conifer Forests, andTropicalandSubtropicalMoistBroadleafForests).Despitethelargeamountofdeforested landworldwide (Hansenetal.,2013;Lewis,Edwards,&Galbraith,2015),38%ofthe172countries(238Mha)that had previously forested areas still have low levels (≤10%) oflandscapevariationinforestrestorationsuccess,onaverage(TableS2).Countrieswithmarginallyhigherweightedlandscapevariationbutmorerestorableareasalsomaybeconsideredasno-regrettar-gets forprivate restoration investments, suchasBrazilandRussia(with324Mharestorableareas).Therefore,ournewapproachcanhelp to identify landscapeswith reduced risksofecological forestrestorationsuccess,acriticalfirststeptoimplementinglarge-scale,long-lastingandcost-effectiveforestrestorationinterventions.
Ourrobustmethodologicalapproach(includinganewmetrictomeasure variation in restoration outcomes) provides a novel tem-plate for developing predictive models and maps to better guideforestrestorationinvestmentsandpolicies(seeMolinetal.,2018).Otherecologicalandsocio-economicvariablesthataffectforestres-torationatthelandscapescale(e.g.Crouzeillesetal.,2017)alsomayresultinsimilarpatternsofvariationinrestorationoutcomes,suchaspastdisturbance,ruralmigrationandprecipitation.However,suchpotentialvariationshavenotyetbeenexaminedandarebeyondthescopeofthisstudy.Futurestudiesshouldexplorewhetherthesere-lationshipscanbemeaningfullypredictedandmapped.Inourcase,landscapevariation in forest restoration successwasnotaffected
byhigherlevelsofreplication(i.e.numberofresponseratioswithinastudylandscape),butitneedstobeinvestigatedinfuturestudiesusingourapproach.Althoughtheapproachdevelopedherewasap-pliedonaglobalscale,italsocanbeeasilyreplicableatsmallerscalestosolvelocalquestionsusingon-the-groundcomparisonsofbiodi-versityrecoverybetweenrestoringandreferenceforests.
It is important to note that the studies in our meta-analysismeasured variation in forest restoration successunder favourablelandscape conditions, as publications on forest restoration mayhaveabiastowardspositiveresults(Reid,Fagan,&Zahawi,2018).Moreover,notallrestorationinitiativesmeasurerestorationsuccessbasedonbiodiversityresponsesandoftenfocusonotheroutcomessuchasecosystemservicesprovisioning,locallivelihoodsandfinan-cial returns.Nevertheless, ourmap is useful for guiding decision-makingunderseveraldifferentcircumstances,suchas(a)prioritizinglandscapesforrestorationwithafocusonrecoveryofbiodiversity,(b)improvingregulationsonbiodiversityoffsettingand(c)estimat-ing implementation costs of forest ecological restoration at theglobalscale.Complementarly,althoughotherdiverseoutcomesmaybespecificallytargetedbyrestorationprogrammes,biodiversityre-coveryisapre-requisiteforallrestorationprocesses,asitisasurro-gateofamyriadofcontributionsofrestorationtopeopleandnature.
4.1 | Helping to unlock investments in forest landscape restoration
Ourapproachmayhelpunlocktheflowoffundstoimplementtheambitiousrestorationcommitmentsplannedworldwide.Forexam-ple,thefinancialfeasibilityofrestorationisacriticalcriterionwhenidentifyingpriorityareasforcost-effectiverestoration(Brancalion,Niamir,etal.,2019;Strassburgetal.,2019).Thefinancialfeasibilityofrestorationisdependentonlandscapevariationinforestrestora-tionsuccessbecauseriskyrestorationinitiatives(withunpredictedoutcomes)areunlikelytoattractinvestors(Brancalion,Niamir,etal.,2019;Brancalionetal.,2017),mayrelymoreheavilyonpublicfunds(Dingetal.,2017)andcanhavehighercosts.Costly,labour-intensiveinterventionsmaybeneededforkickstartingrestorationprocessesand adaptive management interventions, potentially essential forsafeguarding a favourable restoration trajectory. Identifying land-scapeswithlowrisksofrestorationsuccesscanencouragegreaterrestoration investments from the private sector in countrieswithlower averageofweighted landscape variation, such as Suriname,FrenchGuiana,Solomon Islands,DominicaandPalau (the top fivecountries;alwayswithvalues<3%,TableS2).Alternatively,thepub-licsectorandgovernmentsmaydecidetospatiallycomplementpri-vate investments inrestorationthattarget lessrisky interventionsandconcentratethebulkoftheirinvestmentsonrestorationinmoreriskylandscapessuchasthoseinhighlydeforestedareas.Inthese
F I G U R E 5 ThreeBonnChallengecommitmentsusedascasestudytoidentifylandscapeswithlowesteitherlandscapevariationinforestrestorationsuccess(FLS)(a1,b1,c1)oropportunitycosts(a2,b2,c2),toreacheachcommittedtarget.Theseare(a)AtlanticForestRestorationPactwith1MhainTropicalandSubtropicalMoistBroadleafForests,(b)USAwith15MhainTemperateBroadleafandMixedForestsandTemperateConiferousForestsand(c)Ugandawith1MhainTropicalandSubtropicalDryBroadleafForests.
10 | Journal of Applied Ecology CROUZEILLES Et aL.
cases,restorationoutcomesmayfocuslessonbiodiversityrecovery,andmore on improving local food security, the supply of ecosys-temservices(e.g.carbonstorage,waterquality,fuelwoodortimber)and/orsupportinglocallivelihoods(e.g.Strassburgetal.,2019).
4.2 | Supporting biodiversity offsetting with forest landscape restoration
Thelackofarobustmechanisticunderstandingoflandscapevaria-tionunderpinningforestrestorationsuccesshasprecludedtheuseofrestorationinitiativesasareliableoperationalapproachtocom-pensate for environmental degradation (e.g. biodiversity offsets;Budihartaetal.,2018;Maronetal.,2012;Moilanen,Teeffelen,Ben-Haim,&Ferrier,2009).Thus,ourmapcanbeusedtosupportanddevelopnewregulationsandpolicies forbiodiversityoffsetting, inwhich the totalarea tobe restoredcanbeweightedbyvalues forlandscape variation in forest restoration success. This weightingwouldrequirelargerareastoberestoredwherelandscapevariationis higher, or prohibit compensatory restoration in areaswith land-scapevariationaboveagiventhreshold.Forexample,severalland-scapes across countries (top five: Somalia, Seychelles, Iraq, BeninandMadagascar;indescendingorder)withhighweightedlandscapevariation(>41%,TableS2)maybetooriskytopermitcompensatoryrestoration.Inthesecases,haltingandreversingdeforestationaboveagiven threshold in termsofamountof forestcoverwill facilitaterecoveryandreducetheriskofirreversiblebiodiversitydecline(e.g.Pardini,ArrudaBueno,Gardner,Prado,&Metzger,2010).Itiscriti-cal to highlight, however, that ourmap does not account for spe-ciesuniquenessandcomplementarity.Thus,biodiversityoffsettingmechanisms must be supported by additional critical biodiversitydata.
4.3 | Bonn challenge commitments as study cases
TherestorationtargetintheBonnChallengeis350Mhaofrestoredforestsby2030,with170Mhawithin59commitmentspledgedtodate(BonnChallenge,2018).Mostofthesecommitmentsarebasedona‘forestlandscaperestoration’approach,whichaimstoenhancethe ecological functionality of deforested landscapes (Chazdon etal., 2017). Although achieving reference ecosystem levels of bio-diversity is not themain focus of these programmes, biodiversityrecovery will certainly play a central role in recovering diverseecologicalfunctions (Kaiser-Bunburyetal.,2017;Strassburgetal.,2019).Landscapeswith lower levelsofvariation in forest restora-tionsuccessaremorelikelytobesuccessfullyrestoredastheyarecharacterizedbymoreforestcoverinsurroundingareas,whichisastrongpredictorof success (e.g.Crouzeilles&Curran,2016;Leiteetal.,2013).Wehaveshownthattheimplementationcostsoffor-estrestorationcouldpotentiallybereducedbymorethan80%–97%if our approach is adopted (i.e. identifying landscapes with low-est landscapevariation) insteadofthewidelypreferreduseoffulltreeplantingasa restorationmethod (Chazdon,2014;Chazdon&Guariguata, 2016). Although our approach increases opportunity
costsbyUS$12Mi,28Miand282Micomparedtoprioritizingres-torationinlandscapeswithlowestopportunitycost,thesecostsarecompensatedforbyareductioninimplementationcosts,whichareUS$121Mi,71Miand1.3BiforBrazilianAtlanticForest,UgandaandUScommitments, respectively.Theseresultshighlightthe im-portanceofourmapasatooltohelpdecision-makersovercomeacriticalbarrier—identifyinglandscapeswherelow-costrestorationmethods based on natural regeneration processes can be imple-mentedforlarge-scalerestoration(Chazdon&Guariguata,2016).
5 | CONCLUSIONS
We found that variation in forest restoration success at the land-scapescalewasstronglyassociatedwith the forestcover remain-ingwithinthelandscape.Ensuringthepersistenceofnativeforests(Reid et al., 2017) and integrating restoration with conservationpracticesandpoliciesarekeyelements for forest restorationsuc-cess.Fourkeyrecommendationsarisefromthisstudy.First,itises-sentialtohaltdeforestation,particularlyinareaswhereforestcoverinthelandscapedeclinesbelow30%.Second,commencingrestora-tiononlandscapeswithlow(<10%)levelsofvariationinforestresto-rationsuccessmayattractthelevelsoffinancialinvestmentneededto fund large-scale restoration focused on biodiversity recovery.Third,restorationinareaswithhighlandscapevariation(>50%)willbecostlyandmaynotbeeffectiveforrestoringnativebiodiversity.Nevertheless,landscaperestorationinitiativesintheseareascanbevitallyimportantforincreasingthesupplyofawiderangeofecosys-temservicesand improvingsocio-economicconditions.Therefore,restorationintheseareasshouldbeaplannedprocessalsoconsid-ering other landscape factors to increase forest cover as awholeandconsequentlydecrease thevariation in forest restorationsuc-cess.Fourth,givenlimitedfinancialresourcestoinvestinforestandlandscaperestoration,ourresultscanhelpguiderestorationeffortstowardslandscapeswhererestorationinterventionswillyieldhighercost-effectivenessforbiodiversityconservation.
ACKNOWLEDG EMENTS
WethankTNCBrazilforsupportingthisstudy.D.B.L.wassupportedbyanAustralianResearchCouncilLaureateFellowship.
AUTHORS' CONTRIBUTIONS
R.C.conceivedtheideaandanalysedthedata;P.H.S.B.andM.S.F.considerably improvedon it;F.S.B.andP.G.M.processedthegeo-spatialanalyses;R.L.C.ledthewritingwithassistancefromallotherauthors.Allauthorsgavefinalapprovalforpublication.
DATA AVAIL ABILIT Y S TATEMENT
Data and R scripts available from the Dryad Digital Repository https://doi.org/10.5061/dryad.7cr627n(Crouzeillesetal.,2019).

| 11Journal of Applied EcologyCROUZEILLES Et aL.
ORCID
Renato Crouzeilles https://orcid.org/0000-0002-8887-4751
Paulo G. Molin https://orcid.org/0000-0002-4587-935X
David B. Lindenmayer https://orcid.org/0000-0002-4766-4088
R E FE R E N C E S
Benini, R.M., & Adeodato, S. (2017). Forest restoration economy. (TheNatureConservancy).
Bolker, B. M. (2008). Ecological models and data in R. Princeton,NJ:PrincetonUniversityPress.
Birch,J.C.,Newton,A.C.,Aquino,C.A.,Cantarello,E.,Echeverria,C.,Kitzberger, T.,…Garavito,N. T. (2010). Cost-effectiveness of dry-land forest restoration evaluated by spatial analysis of ecosystemservices.Proceedings of the National Academy of Sciences of the United States of America. 107, 21925–21930. https://doi.org/10.1073/pnas.1003369107
Bonn Challenge. (2018). Commitments. Retrieved from http://www.bonnchallenge.org/commitments
Brancalion,P.H.S.,Campoe,O.,Mendes,J.C.T.,Noel,C.,Moreira,G.G.,vanMelis,J.,…Guillemot,J. (2019).Intensivesilvicultureenhancesbiomassaccumulationandtreediversityrecoveryintropicalforestrestoration.Ecological Applications,29,e0184.
Brancalion, P. H. S., Lamb, D., Ceccon, E., Bouchere, D., Herbohn, J.,Strassburg,B.B.N.,&Edwards,D.E.(2017).Usingmarketstolever-age investment in forest and landscape restoration in the tropics.Forest Policy and Economics,85,103–113.https://doi.org/10.1016/j.forpol.2017.08.009
Brancalion,P.H.S.,Niamir,A.,Broadbent,E.,Crouzeilles,R.,Barros,F.S.M.,Zambrano,A.M.A.,…Chazdon,R.L.(2019).Globalrestorationopportunitiesintropicalrainforestlandscapes.Science Advances,5,eaav3223.https://doi.org/10.1126/sciadv.aav3223
Budiharta,S.,Meijaard,E.,Gaveau,D.L.A.,Struebig,M.J.,Wilting,A.,Kramer-Schadt,S.,…Wilson,K.A.(2018).Restorationtooffsettheimpactsofdevelopmentsatalandscapescalerevealsopportunities,challengesandtoughchoices.Global Environmental Change,52,152–161.https://doi.org/10.1016/j.gloenvcha.2018.07.008
Burnham,P.B.,&Anderson,D.R.(2002).Model Selection and Multimodel Inference: A Practical Information‐Theoretic Approach.NewYork,NY:Springer.
Chazdon,R.L.(2003).Tropicalforestrecovery:Legaciesofhumanimpactandnaturaldisturbances.Perspectives in Plant Ecology, Evolution and Systematics,6,51–71.https://doi.org/10.1078/1433-8319-00042
Chazdon,R.L.(2014).Second growth: The promise of tropical forest regen‐eration in an age of deforestation.Chicago, IL:UniversityofChicagoPress.
Chazdon,R.L.,Brancalion,P.H.S.,Lamb,D.,Laestadius,L.,Calmon,M.,&Kumar,C.A.(2017).Apolicy-drivenknowledgeagendaforglobalforestandlandscaperestoration.Conservation Letters,10,125–132.https://doi.org/10.1111/conl.12220
Chazdon,R.L.,&Guariguata,M.R.(2016).Naturalregenerationasatoolforlarge-scaleforestrestorationinthetropics:Prospectsandchal-lenges.Biotropica,48,716–730.https://doi.org/10.1111/btp.12381
Clarke,F.M.,Rostant,V.,&Racey,P.A.(2005).Lifeafterlogging:Post-log-gingrecoveryofaneotropicalbatcommunity.Journal of Applied Ecology,42,409–420.https://doi.org/10.1111/j.1365-2664.2005.01024.x
CrawfordCountyConservationDistricts.(2007).Plantingcostforhard-wood/conifer plantations. Retrieved from http://www.crawfordconservation.com/assets/pdf/TreePlantingCosts.pdf
Crouzeilles,R.,Barros,F.S.,Molin,P.G.,Ferreira,M.S., Junqueira,A.B.,Chazdon,R.L.,…Brancalion,P.H.S. (2019).Data from:Anewapproachtomaplandscapevariationinforestrestorationsuccessin
tropicalandtemperateforestbiomes.Dryad Digital Repository,https://doi.org/10.5061/dryad.7cr627n
Crouzeilles,R.,&Curran,M.(2016).Whichlandscapesizebestpredictstheinfluenceofforestcoveronrestorationsuccess?Aglobalmeta-analysisonthescaleofeffect.Journal of Applied Ecology,53,440–448.https://doi.org/10.1111/1365-2664.12590
Crouzeilles,R.,Curran,M.,Ferreira,M.S.,Lindenmayer,D.B.,Grelle,C.E.V.J.,&ReyBenayas,M.(2016).Aglobalmeta-analysisontheeco-logicaldriversofforestrestorationsuccess.Nature Communications,7,11666.https://doi.org/10.1038/ncomms11666
Crouzeilles, R., Ferreira, M. S., Chazdon, R. L., Lindenmayer, D. B.,Sansevero, J. B. B., Monteiro, L., … Strassburg, B. B. N. (2017).Ecological restoration success is higher for natural regenerationthan for active restoration in tropical forests.Science Advances,3,e1701345.
Crouzeilles,R.,Ferreira,M.S.,&Curran,M.(2016).Forestrestoration:Aglobaldatasetforbiodiversityandvegetationstructure.Ecology,97,2167.https://doi.org/10.1002/ecy.1474
Dinerstein, E., Olson, D., Joshi, A., Vynne, C., Burgess, N. D.,Wikramanayake, E., …Saleem, M. (2017). An ecoregion-basedapproach to protecting half the terrestrial realm. BioScience, 67,534–545.
Ding,H.,Altamirano,J.C.,Anchondo,A.,Faruqi,S.,Verdone,M.,Wu,A.,…Vergara,W.(2017).Roots of prosperity: The economics and finance of restoring land.Washington,DC:WorldResourcesInstitute.
ESAClimateChangeInitiative.(2017).Landcover.Retrievedfromhttp://maps.elie.ucl.ac.be/CCI/viewer/
Fluet-Chouinard,E.,Lehner,B.,Rebelo,L.M.,Papa,F.,&Hamiton,S.K.(2015).Developmentofaglobalinundationmapathighspatialres-olutionfromtopographicdownscalingofcoarse-scaleremotesens-ingdata.Remote Sensing of Environment,158,348–361.https://doi.org/10.1016/j.rse.2014.10.015
GlobalForestWatch.(2016).Globalforestchange.Retrievedfromhttps://earthenginepartners.appspot.com/science-2013-global-forest
Hansen,M.C.,Potapov,P.V.,Moore,R.,Hancher,M.,Turubanova,S.A.,Tyukavina,A.,…Townshend,J.R.G.(2013).High-resolutionglobalmapsof21st-centuryforestcoverchange.Science,342,850–853.
Hedges,L.V.,Gurevitch,J.,&Curtis,P.S. (1999).Themeta-analysisofresponseratiosinexperimentalecology.Ecology,80,1150–1156.
Helmer,E.H.,Brandeis,T.J.,Lugo,A.E.,&Kennaway,T.(2008).Factorsinfluencing spatial pattern in tropical forest clearance and standage:Implicationsforcarbonstorageandspeciesdiversity.Journal of Geophysical Research, 113, G02S04. https://doi.org/10.1029/2007JG000568
Holl,K.D.,&Aide,T.M.(2011).Whenandwheretoactivelyrestoreeco-systems?Forest Ecology and Management,261,1558–1563.
Jackson,H.B.,&Fahrig,L.(2015).Areecologistsconductingresearchattheoptimalscale?Global Ecology and Biogeography,24,52–63.https://doi.org/10.1111/geb.12233
Kaiser-Bunbury,C.N.,Mougal,J.,Whittington,A.E.,Valentin,T.,Gabriel,R., Olesen, J. M., & Blüthgen, N. (2017). Ecosystem restorationstrengthenspollinationnetworkresilienceandfunction.Nature,542,223–227.https://doi.org/10.1038/nature21071
Klanderud, K., Mbolatiana, H. Z. H., Vololomboahangy, M. N.,Radimbison,M.A.,Roger,E.,Totland,Ø.,&Rajeriarison,C. (2010).Recoveryofplantspeciesrichnessandcompositionafterslash-and-burnagriculture in a tropical rainforest inMadagascar.Biodiversity and Conservation,19,187–204.
Leite, M. D. S., Tambosi, L. R., Romitelli, I., & Metzger, J. P. (2013).Landscape ecology perspective in restoration projects for bio-diversity conservation: A review. Nature Conservation, 11, 108–118.
Lewis, S. L., Edwards, D. P., & Galbraith, D. (2015). Increasing humandominance of tropical forests. Science, 349, 827–832. https://doi.org/10.1126/science.aaa9932

12 | Journal of Applied Ecology CROUZEILLES Et aL.
Maron, M., Hobbs, R. J., Moilanen, A., Matthews, J. W., Christie,K., Gardner, T. A., … McAlpine, C. A. (2012). Faustian bargains?Restoration realities in the context of biodiversity offset policies.Biological Conservation, 155, 1413–2148. https://doi.org/10.1016/j.biocon.2012.06.003
Meli, P., Holl, K. D., Benayas, J. M. R., Jones, H. P., Jones, P. C.,Montoya,D.,&Mateos,D.M.(2017).Aglobalreviewofpastlanduse, climate, and active vs. passive restoration effects on forestrecovery. PLoS ONE,12,e0171368.https://doi.org/10.1371/journal.pone.0171368
MinistryofWaterandEnvironment.(2016).Forest landscape restoration opportunity assessment report for Uganda (42 pp). Uganda: IUCN.Retrieved from https://portals.iucn.org/library/sites/library/files/documents/2016-076.pdf
Moilanen,A.,Teeffelen,A.J.,vanBen-Haim,Y.,&Ferrier,S.(2009).Howmuchcompensation isenough?Aframeworkfor incorporatingun-certaintyandtimediscountingwhencalculatingoffsetratiosforim-pactedhabitat.Restoration Ecology,17,470–478.
Molin,P.G.,Chazdon,R.,Ferraz,S.F.B.,&Brancalion,P.H.S. (2018).A landscape approach for cost-effective large-scale forest res-toration. Journal of Applied Ecology, 55, 2767–2778. https://doi.org/10.1111/1365-2664.13263
Naidoo,R.,&Iwamura,T.(2007).Global-scalemappingofeconomicben-efitsfromagriculturallands:Implicationsforconservationpriorities.Biological Conservation,140,40–49.
Omeja, P. A., Chapman, C. A., Obua, J., Lwanga, J. S., Jacob, A. L.,Wanyama,F.,&Mugenyi,R.(2011).Intensivetreeplantingfacilitatestropicalforestbiodiversityandbiomassaccumulation.Forest Ecology and Management,261,703–709.
Omeja,P.A.,Obua,J.,Rwetsiba,A.,&Chapman,C.A.(2012).Biomassaccumulation in tropical lands with different disturbance histo-ries: Contrasts within one landscape and across regions. Forest Ecology and Management,269, 293–300. https://doi.org/10.1016/j.foreco.2011.12.044
Pardini,R.,deArrudaBueno,A.,Gardner,T.A.,Prado,P.I.,&Metzger,J.P.(2010).Beyondthefragmentationthresholdhypothesis:Regimeshifts in biodiversity across fragmented landscapes. PLoS ONE, 5,e13666.https://doi.org/10.1371/journal.pone.0013666
Prigent,C.,Papa,F.,Rossow,W.B.,&Matthews,E. (2017).Global in-undation dynamics inferred from multiple satellite observations.Journal of Geophysical Research,112,1.
Reid, J.L.,Fagan,M.E.,&Zahawi,R.A. (2018).Positivesiteselectionbiasinmeta-analysescomparingnaturalregenerationtoactivefor-estrestoration.Science Advances,4,eaas9143.
Reid,J.L.,Wilson,S.J.,Bloomfield,G.S.,Cattau,M.E.,Fagan,M.E.,Holl,K.D.,&Zahawi,R.A.(2017).Howlongdorestoredecosystemsper-sist?Annals of the Missouri Botanical Garden,102,258–265.
Serviço Florestal Brasileiro. (2017). PLANAVEG – Plano Nacional de Recuperação da Vegetação Nativa.Brasília,DF:MMA.Retrievedfromhttp://snif.florestal.gov.br/images/pdf/publicacoes/planaveg_publicacao.pdf
Spake, R., & Doncaster, C. P. (2017). Use of meta-analysis in forestbiodiversity research: Key challenges and considerations. Forest Ecology and Management,400, 429–437. https://doi.org/10.1016/j.foreco.2017.05.059
Strassburg,B.N.N.,Beyer,H.,Crouzeilles,R., Iribarrem,A.,Barros,F.,Siqueira,M.F.,…Uriarte,M.(2019).Strategicapproachestorestor-ingecosystemscantripleconservationgainsandhalvecosts.Nature Ecology and Evolution,3,62–70.
Stringer, J. (2009). Southern pine reforestation. In P. Hardin (Eds.),Woodlands management course: A guide to improving our forests (pp.61–76).Atlanta,GA:TheForest LandownerFoundation.Retrievedfrom http://www.aces.edu/natural-resources/forestry/tornado-damage/documents/SouthernPineRegeneration.pdf
Tuanmu,M.-N.,&Jetz,W. (2014).Aglobal1-kmconsensus land-coverproductforbiodiversityandecosystemmodeling.Global Ecology and Biogeography,23,1031–1045.
Verdone, M., & Seidl, A. (2017). Time, space, place, and the BonnChallenge global forest restoration target. Restoration Ecology, 25,903–911.https://doi.org/10.1111/rec.12512
VirginiaDepartmentofForestry. (2018).Reforestationof timberlands.Retrievedfromhttp://www.dof.virginia.gov/costshare/rt.htm
SUPPORTING INFORMATION
Additional supporting information may be found online in theSupportingInformationsectionattheendofthearticle.
How to cite this article:CrouzeillesR,BarrosFS,MolinPG,etal.Anewapproachtomaplandscapevariationinforestrestorationsuccessintropicalandtemperateforestbiomes.J Appl Ecol. 2019;00:1–12. https://doi.org/10.1111/1365-2664.13501