a neural-network-based methodology for the evaluation of
TRANSCRIPT

Article
A Neural-Network-Based Methodology for the Evaluation ofthe Center of Gravity of a Motorcycle Rider
Francesco Carputo 1, Danilo D’Andrea 2 , Giacomo Risitano 2 , Aleksandr Sakhnevych 1 , Dario Santonocito 2
and Flavio Farroni 1,*
�����������������
Citation: Carputo, F.; D’Andrea, D.;
Risitano, G.; Sakhnevych, A.;
Santonocito, D.; Farroni, F. A
Neural-Network-Based Methodology
for the Evaluation of the Center of
Gravity of a Motorcycle Rider.
Vehicles 2021, 3, 377–389. https://
doi.org/10.3390/vehicles3030023
Academic Editor: Chen Lv
Received: 1 June 2021
Accepted: 9 July 2021
Published: 15 July 2021
Publisher’s Note: MDPI stays neutral
with regard to jurisdictional claims in
published maps and institutional affil-
iations.
Copyright: © 2021 by the authors.
Licensee MDPI, Basel, Switzerland.
This article is an open access article
distributed under the terms and
conditions of the Creative Commons
Attribution (CC BY) license (https://
creativecommons.org/licenses/by/
4.0/).
1 Department of Industrial Engineering, University of Naples Federico II, 80125 Naples, Italy;[email protected] (F.C.); [email protected] (A.S.)
2 Department of Engineering, University of Messina, Contrada di Dio (S. Agata), 98166 Messina, Italy;[email protected] (D.D.); [email protected] (G.R.); [email protected] (D.S.)
* Correspondence: [email protected]
Abstract: A correct reproduction of a motorcycle rider’s movements during driving is a crucial andthe most influential aspect of the entire motorcycle–rider system. The rider performs significantvariations in terms of body configuration on the vehicle in order to optimize the management of themotorcycle in all the possible dynamic conditions, comprising cornering and braking phases. Theaim of the work is to focus on the development of a technique to estimate the body configurationsof a high-performance driver in completely different situations, starting from the publicly availablevideos, collecting them by means of image acquisition methods, and employing machine learningand deep learning techniques. The technique allows us to determine the calculation of the centerof gravity (CoG) of the driver’s body in the video acquired and therefore the CoG of the entiredriver–vehicle system, correlating it to commonly available vehicle dynamics data, so that the forcedistribution can be properly determined. As an additional feature, a specific function correlatingthe relative displacement of the driver’s CoG towards the vehicle body and the vehicle roll anglehas been determined starting from the data acquired and processed with the machine and the deeplearning techniques.
Keywords: motorcycle driver; multibody co-simulation; machine learning; deep learning
1. Introduction
Human body movement is an object of a crucial interest, especially in the biomedicalfield [1,2]. Technological evolution has allowed considerable progress, especially in motorrehabilitation techniques in sports, in the study of motor problems related to behavioralpathologies and in the analysis of dynamic systems in which a person interacts with thesurrounding environment both it real or virtual situations.
The fields of application of such a discipline can be various and most of the relatedissues concern the study of the balance characteristics of a human body and the determina-tion of its center of gravity during motion, which is fundamental for a proper calculationof the inertial components and to evaluate the load distribution in motion phases [3,4]. Inparticular, the vehicular simulation field nowadays is lacking robust and usable methodolo-gies to account for the driver/rider position in the vehicle, and for the two-wheel domainthe problem is even deeper, due to the significant influence that the rider’s mass has on theoverall rider + vehicle system [5].
Due to the difficulty in sensing the rider with specific sensors aimed to measurethe CoG position, the optimal method to acquire data on his position is based on image-processing. For this reason, an analysis aimed to obtain a preliminary comprehension ofthe state of the art in such a field has been carried out.
In recent years, motion analysis has evolved substantially, alongside major technologi-cal advances, and there is growing demand for faster and more sophisticated techniques
Vehicles 2021, 3, 377–389. https://doi.org/10.3390/vehicles3030023 https://www.mdpi.com/journal/vehicles
Vehicles 2021, 3 378
for capturing motion in a wide range of contexts, ranging from clinical gait assessment [6]to videogame animation.
Biomechanical tools have greatly developed, from manual image annotation to marker-based optical trackers, inertial sensor-based systems, and marker-free systems using sophis-ticated human body models, by double energy X-ray absorptiometry (DXA) [7], machinevision, and machine learning algorithms. With such scope, the use of sophisticated sen-sors based on the presence of physical markers applied to humans’ bodies allows one tomeasure the physical quantities (force, speed, acceleration and displacement) linked to thedifferent movements made by the body which, for example, in the sports field, allows oneto carry out studies aiming at the improvement of the athlete’s performance [8,9].
An alternative method, markerless motion capture, based on the use of video acquisi-tions processed by machine learning techniques, aims to identify the positions of variouskey points belonging to the human body starting from a singular video frame or images,with no need of uncomfortable and impractical physical markers [10,11].
The major difficulty of this technique is that some body parts cover some othersduring the movement or in some given postures. As a result, automatic and marker-less identification of body segments faces many difficulties that turn it into a complexproblem [12].
In recent years, thanks to the evolution of image-processing tools, the interest inmarker-free motion capture systems has significantly increased and different softwaremethods allowing one to automatically identify the anatomical landmarks have beendeveloped, among them the OpenPose software [13]. The OpenPose package is capableof performing real-time skeleton tracking on a large number of subjects analyzing 2Dimages [14].
Starting from the research output of the collaboration between the University ofMessina and the University of Naples Federico II [15], based on the employment of theOpenPose software aiming to predict the center of gravity (CoG) of a human subject posingin a specific set of 2D images, the present work focuses on a motorcycle rider adopting theimages acquired from a motorcycle simulation game, MotoGP19.
The work aims to develop of a technique employing the neural network technologyfor correlation with vehicle data, applied in a deep learning environment, which, startingfrom a partial capture of the driver position acquired in each video frame, allows one todetermine the key points not visible from the camera and corresponding to the entirety ofthe driver’s body. Starting from the information collected, the calculation of the CoG ofthe driver’s body is evaluated by adopting deep learning technology. The neural networktechnique is then employed to determine the correlation between the relative displacementof the driver’s center of gravity and the motorcycle’s body roll angle. The continuousavailability of information on the position of the driver/rider’s CoG is fundamental in themotorcycle industry, both for racing and safety applications, due to the need to considerthe influence of the human body on the rider + vehicle system in design and simulationsactivities [16,17].
2. Materials and Methods
The presented work aims to illustrate a methodologic approach, developed by usingdata acquired from a reference scenario, that will eventually be substituted by real videodata. Each rider moves in a different way, as the driving style of racing riders demonstrates,and once the methodology is validated, the developed algorithms can be trained foreach different rider, reproducing their typical motion and style, with the final aim ofdetermining the continuous position of the center of gravity, which is fundamental forsimulation activities and usually hard to determine for motorcycles. Such considerationhas been better expressed in the text. In order to obtain a reliable dataset with repeatableand robust data, an approach based on the use of the MotoGP19 simulation videogame hasbeen chosen in the acquisition phase, in which several runs have been captured. The videoframes acquired in the various dynamic conditions of the motorcycle and the body driver

Vehicles 2021, 3 379
configuration constitute a suitable and repeatable dataset on which the OpenPose softwareprocessing has been employed to calculate all the necessary body markers’ positionsand, therefore, the center of gravity of the driver’s body. The particular choice to startwith the videogame is motivated by the fact that modern simulation and sports gamesare generally very faithful to the real movements of the athletes and drivers, since theirmodelling is based on the extrapolation of Active Marker Mocap real data [18–20]. As aresult, the simulation output reproduces all the athlete’s movements in a realistic way, andin the particular case under analysis, it allows one to have a great coherence with the realmovements assumed by motorcycle riders during the operation of the motorcycle even inextreme dynamic conditions. Eventual distortions and inaccuracies of the virtual cameradid not represent a particular issue, due to the methodologic spirit of the study, whose datacan be progressively improved in terms of quality in the following activities, keeping thevalue of the demonstrated feasibility.
Modern gyroscopic cameras, represented in Figure 1a, installed on racing motorcyclesprovide only a partial shape of the driver’s body, being limited to acquiring the movementinformation regarding only of the upper part of the rider’s body (as shown in Figure 1b).The missing part, mainly comprising legs and the bottom part of the torso, becomesnecessary to correctly evaluate the CoG of the rider’s body [21–24].
Vehicles 2021, 3, FOR PEER REVIEW 3
with repeatable and robust data, an approach based on the use of the MotoGP19 simulation videogame has been chosen in the acquisition phase, in which several runs have been captured. The video frames acquired in the various dynamic conditions of the motorcycle and the body driver configuration constitute a suitable and repeatable dataset on which the OpenPose software processing has been employed to calculate all the necessary body markers’ positions and, therefore, the center of gravity of the driver’s body. The particular choice to start with the videogame is motivated by the fact that modern simulation and sports games are generally very faithful to the real movements of the athletes and drivers, since their modelling is based on the extrapolation of Active Marker Mocap real data [18–20]. As a result, the simulation output reproduces all the athlete’s movements in a realistic way, and in the particular case under analysis, it allows one to have a great coherence with the real movements assumed by motorcycle riders during the operation of the motorcycle even in extreme dynamic conditions. Eventual distortions and inaccuracies of the virtual camera did not represent a particular issue, due to the methodologic spirit of the study, whose data can be progressively improved in terms of quality in the following activities, keeping the value of the demonstrated feasibility.
Modern gyroscopic cameras, represented in Figure 1a, installed on racing motorcycles provide only a partial shape of the driver’s body, being limited to acquiring the movement information regarding only of the upper part of the rider’s body (as shown in Figure 1b). The missing part, mainly comprising legs and the bottom part of the torso, becomes necessary to correctly evaluate the CoG of the rider’s body [21–24].
Figure 1. (a) Gyroscopic camera; (b) rear shot with gyroscopic camera.
2.1. Acquisition of the Video Frames A series of simulations were carried out via MotoGP19 on different tracks in order to
explore as many dynamic conditions as possible concerning the motorcycle behavior and the driver’s body configurations.
For each track under analysis, the best track lap was selected as a reference and was recorded in two different video acquisitions using the two different points of view available in the simulator game: • Rear view camera 1 (Figure 2a); • Rear view camera 2 (Figure 2b).
Figure 2. (a) Rear view camera 1; (b) rear view camera 2.
Figure 1. (a) Gyroscopic camera; (b) rear shot with gyroscopic camera.
2.1. Acquisition of the Video Frames
A series of simulations were carried out via MotoGP19 on different tracks in order toexplore as many dynamic conditions as possible concerning the motorcycle behavior andthe driver’s body configurations.
For each track under analysis, the best track lap was selected as a reference and wasrecorded in two different video acquisitions using the two different points of view availablein the simulator game:
• Rear view camera 1 (Figure 2a);• Rear view camera 2 (Figure 2b).
Vehicles 2021, 3, FOR PEER REVIEW 3
with repeatable and robust data, an approach based on the use of the MotoGP19 simulation videogame has been chosen in the acquisition phase, in which several runs have been captured. The video frames acquired in the various dynamic conditions of the motorcycle and the body driver configuration constitute a suitable and repeatable dataset on which the OpenPose software processing has been employed to calculate all the necessary body markers’ positions and, therefore, the center of gravity of the driver’s body. The particular choice to start with the videogame is motivated by the fact that modern simulation and sports games are generally very faithful to the real movements of the athletes and drivers, since their modelling is based on the extrapolation of Active Marker Mocap real data [18–20]. As a result, the simulation output reproduces all the athlete’s movements in a realistic way, and in the particular case under analysis, it allows one to have a great coherence with the real movements assumed by motorcycle riders during the operation of the motorcycle even in extreme dynamic conditions. Eventual distortions and inaccuracies of the virtual camera did not represent a particular issue, due to the methodologic spirit of the study, whose data can be progressively improved in terms of quality in the following activities, keeping the value of the demonstrated feasibility.
Modern gyroscopic cameras, represented in Figure 1a, installed on racing motorcycles provide only a partial shape of the driver’s body, being limited to acquiring the movement information regarding only of the upper part of the rider’s body (as shown in Figure 1b). The missing part, mainly comprising legs and the bottom part of the torso, becomes necessary to correctly evaluate the CoG of the rider’s body [21–24].
Figure 1. (a) Gyroscopic camera; (b) rear shot with gyroscopic camera.
2.1. Acquisition of the Video Frames A series of simulations were carried out via MotoGP19 on different tracks in order to
explore as many dynamic conditions as possible concerning the motorcycle behavior and the driver’s body configurations.
For each track under analysis, the best track lap was selected as a reference and was recorded in two different video acquisitions using the two different points of view available in the simulator game: • Rear view camera 1 (Figure 2a); • Rear view camera 2 (Figure 2b).
Figure 2. (a) Rear view camera 1; (b) rear view camera 2. Figure 2. (a) Rear view camera 1; (b) rear view camera 2.
The video was subsequently processed via the OpenPose package as described later.

Vehicles 2021, 3 380
2.2. OpenPose Processing
OpenPose is an open source software package for the detection of multiperson keypoints in real time starting from video frame acquisitions. It is able to jointly detect the keypoints of the human body, namely the hands, face and feet on individual images, up to atotal of 135 key points [25].
It is capable of processing, in real time, single frames or direct videos in the input,providing, in output, the same images and videos with a further level of physics representedby the key points detected and added to the input frames.
For the recognition of key points, OpenPose uses a preadded neural convolution net-work (CNN) called Vggnet [26,27]. The network accepts a color image as input (Figure 3a),returning 2D positions of the key points for each person in the frame (Figure 3b). Theadditional processing layer, representing the extracted points, is represented in Figure 3c.
Vehicles 2021, 3, FOR PEER REVIEW 4
The video was subsequently processed via the OpenPose package as described later.
2.2. OpenPose Processing OpenPose is an open source software package for the detection of multiperson key
points in real time starting from video frame acquisitions. It is able to jointly detect the key points of the human body, namely the hands, face and feet on individual images, up to a total of 135 key points [25].
It is capable of processing, in real time, single frames or direct videos in the input, providing, in output, the same images and videos with a further level of physics represented by the key points detected and added to the input frames.
For the recognition of key points, OpenPose uses a preadded neural convolution network (CNN) called Vggnet [26,27]. The network accepts a color image as input (Figure 3a), returning 2D positions of the key points for each person in the frame (Figure 3b). The additional processing layer, representing the extracted points, is represented in Figure 3c.
Figure 3. (a) Original frame; (b) postprocessed frame by OpenPose; (c) plot of the key points.
3. Training Dataset The output data obtained by means of the OpenPose package were divided into two
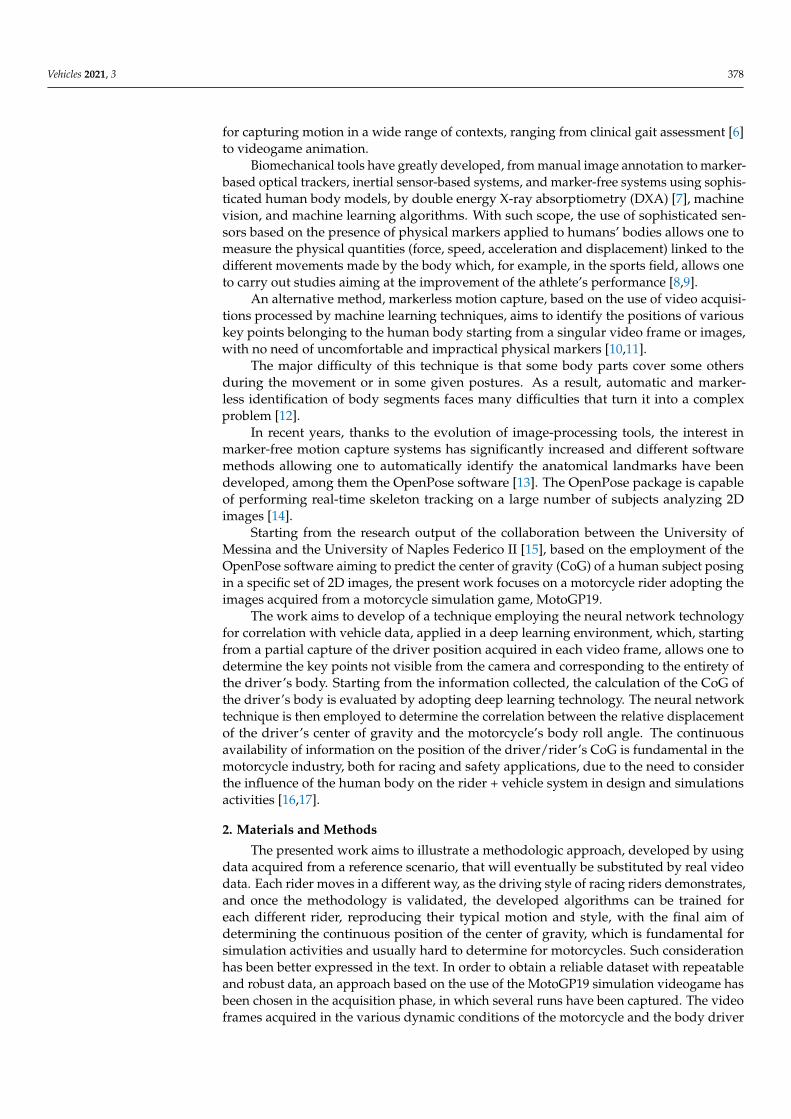
key points sets depending on their positions towards the human body to constitute suitable datasets of input and target indispensable for the machine learning training. In particular, the processed key points have been split as follows: • Input: 10 points for the upper body part (Figure 4a); • Target: 10 points for the lower body part (Figure 4b).
The neural network is set to evaluate 10 points relative to the lower part of the body, starting from the 10 key points of the upper part acquired through camera 2 (Figure 2b).
Due to the different framings between the two chosen cameras, it was necessary to scale the shapes obtained from the two different sets of key points to the same proportions.
Furthermore, the data were divided into x and z coordinates because it is necessary to train two distinct neural networks for the x and z coordinates, respectively, to optimize
Figure 3. (a) Original frame; (b) postprocessed frame by OpenPose; (c) plot of the key points.
3. Training Dataset
The output data obtained by means of the OpenPose package were divided into twokey points sets depending on their positions towards the human body to constitute suitabledatasets of input and target indispensable for the machine learning training. In particular,the processed key points have been split as follows:
• Input: 10 points for the upper body part (Figure 4a);• Target: 10 points for the lower body part (Figure 4b).
The neural network is set to evaluate 10 points relative to the lower part of the body,starting from the 10 key points of the upper part acquired through camera 2 (Figure 2b).
Due to the different framings between the two chosen cameras, it was necessary toscale the shapes obtained from the two different sets of key points to the same proportions.
Vehicles 2021, 3 381
Vehicles 2021, 3, FOR PEER REVIEW 5
the calibration algorithms response. In the y-direction, the hypothesis of the fixed CoG coordinate has been introduced, due to the lower variability of the rider’s motion in said direction. Four distinct matrices of points have thus been prepared for the training procedure: • x coordinates of the upper points; • z coordinates of the upper points; • x coordinates of the lower points; • z coordinates of the lower points.
Figure 4. (a) The top 10 points as network input; (b) the bottom 10 points as a network target.
3.1. Assessment of the Centre of Gravity of the Driver’s Body Assuming that the body density is constant and all the body parts can be described
by simple geometrical features, the calculation of the center of gravity can be easily achieved geometrically [28].
However, it has to be taken into account that the human body is characterized by a nonuniform distribution of density between each couple of defined markers. With such reference, specific methodologies and more accurate methods for calculating the center of gravity could be employed [29].
Schematizing the human body as a series of discrete mass parts, the center of gravity can be assessed as follows: 𝑥 ∑ 𝑚 𝑥𝑖 𝑀
𝑧 ∑ 𝑚 𝑦𝑖 𝑀
(1)
where: • mi is the mass of i-th element; • M is the mass of body (including clothing).
In order to employ the described equivalent system method, it is necessary to individuate the position of the CoG of each individual part of the human body, as described in Table 1, obtained by processing data available from the literature. It was designed to describe body segment mass as a proportion of total body mass and the location k of each segment’s center of mass as a proportion of segment length, in the three transverse, sagittal and longitudinal planes. Among the papers that provide such data,
Figure 4. (a) The top 10 points as network input; (b) the bottom 10 points as a network target.
Furthermore, the data were divided into x and z coordinates because it is necessary totrain two distinct neural networks for the x and z coordinates, respectively, to optimize thecalibration algorithms response. In the y-direction, the hypothesis of the fixed CoG coordi-nate has been introduced, due to the lower variability of the rider’s motion in said direction.Four distinct matrices of points have thus been prepared for the training procedure:
• x coordinates of the upper points;• z coordinates of the upper points;• x coordinates of the lower points;• z coordinates of the lower points.
3.1. Assessment of the Centre of Gravity of the Driver’s Body
Assuming that the body density is constant and all the body parts can be described bysimple geometrical features, the calculation of the center of gravity can be easily achievedgeometrically [28].
However, it has to be taken into account that the human body is characterized by anonuniform distribution of density between each couple of defined markers. With suchreference, specific methodologies and more accurate methods for calculating the center ofgravity could be employed [29].
Schematizing the human body as a series of discrete mass parts, the center of gravitycan be assessed as follows:
xG = ∑ mixiM
zG = ∑ miyiM
(1)
where:
• mi is the mass of i-th element;• M is the mass of body (including clothing).
In order to employ the described equivalent system method, it is necessary to indi-viduate the position of the CoG of each individual part of the human body, as describedin Table 1, obtained by processing data available from the literature. It was designed todescribe body segment mass as a proportion of total body mass and the location k of eachsegment’s center of mass as a proportion of segment length, in the three transverse, sagittaland longitudinal planes. Among the papers that provide such data, obtainable throughexperimental tests, this works adopts the approach described by Zatsiorsky et al. in [30],modified by de Leva in [31,32].

Vehicles 2021, 3 382
Table 1. Percentage values of mass and position of the center of gravity in adult men and women [30,31] (copyright hasbeen permitted).
SegmentMass
(% Mass)CM
(% Length)Sagittal k
(% Length)Transverse k(% Length)
Longitudinal k(% Length)
Female Male Female Male Female Male Female Male Female Male
Head 6.68 6.94 58.94 59.76 30.1 33.2 32.7 34.5 28.8 28.6Trunk 42.57 43.46 41.51 44.86 34.6 36 33.2 33.3 16.2 18.1
Upper Trunk 15.45 15.96 20.77 29.99 60 60.57 41.1 38.7 58.6 55.9Mid Trunk 14.65 16.33 45.12 45.02 43.3 48.2 35.4 38.3 41.5 46.8
Lower Trunk 12.47 11.17 49.2 61.15 43.3 61.5 40.2 55.1 44.4 58.7Upper Arm 2.55 2.71 57.54 57.72 27.8 28.5 26 26.9 14.8 15.8
Forearm 1.38 1.62 45.59 45.74 26.2 27.7 25.8 26.6 9.45 12.15Hand 0.56 0.61 74.74 79 35.4 45.2 32.7 36.9 23.4 29Thigh 14.78 14.16 36.12 40.95 36.9 32.9 36.4 32.9 16.2 14.9Shank 4.81 4.33 44.16 44.59 27.1 25.4 26.8 24.2 9.3 10.3Foot 1.29 1.37 40.14 44.15 29.9 25.7 27.9 24.5 13.9 12.4
In particular, two procedures to evaluate the CoG are compared: the geometric methodand the kinematic method [13].
The overall procedure consists, therefore, of the following steps:
1. Capture of video frames from the MotoGP19 simulator (rear camera 2);2. Data processing with OpenPose software to evaluate the center of gravity of the
individual body elements;3. Evaluation of the center of gravity of the whole body using the data in Table 1.
3.2. Application on the Acquired Data
The recorded video was processed with the OpenPose software for both rear cameras,available in the MotoGP19 simulator, as illustrated in Figure 5 (rear camera 1, including dataregarding the bottom part of the rider’s body) and in Figure 6 (rear camera 2, simulatingthe capabilities of a common onboard camera):
Vehicles 2021, 3, FOR PEER REVIEW 6
obtainable through experimental tests, this works adopts the approach described by Zatsiorsky et al. in [30], modified by de Leva in [31,32].
In particular, two procedures to evaluate the CoG are compared: the geometric method and the kinematic method [13].
Table 1. Percentage values of mass and position of the center of gravity in adult men and women [30,31] (copyright has been permitted).
Segment Mass
(% Mass) CM
(% Length) Sagittal k
(% Length) Transverse k (% Length)
Longitudinal k (% Length)
Female Male Female Male Female Male Female Male Female Male Head 6.68 6.94 58.94 59.76 30.1 33.2 32.7 34.5 28.8 28.6 Trunk 42.57 43.46 41.51 44.86 34.6 36 33.2 33.3 16.2 18.1
Upper Trunk 15.45 15.96 20.77 29.99 60 60.57 41.1 38.7 58.6 55.9 Mid Trunk 14.65 16.33 45.12 45.02 43.3 48.2 35.4 38.3 41.5 46.8
Lower Trunk 12.47 11.17 49.2 61.15 43.3 61.5 40.2 55.1 44.4 58.7 Upper Arm 2.55 2.71 57.54 57.72 27.8 28.5 26 26.9 14.8 15.8
Forearm 1.38 1.62 45.59 45.74 26.2 27.7 25.8 26.6 9.45 12.15 Hand 0.56 0.61 74.74 79 35.4 45.2 32.7 36.9 23.4 29 Thigh 14.78 14.16 36.12 40.95 36.9 32.9 36.4 32.9 16.2 14.9 Shank 4.81 4.33 44.16 44.59 27.1 25.4 26.8 24.2 9.3 10.3 Foot 1.29 1.37 40.14 44.15 29.9 25.7 27.9 24.5 13.9 12.4
The overall procedure consists, therefore, of the following steps: 1. Capture of video frames from the MotoGP19 simulator (rear camera 2); 2. Data processing with OpenPose software to evaluate the center of gravity of the
individual body elements; 3. Evaluation of the center of gravity of the whole body using the data in Table 1.
3.2. Application on the Acquired Data The recorded video was processed with the OpenPose software for both rear
cameras, available in the MotoGP19 simulator, as illustrated in Figure 5 (rear camera 1, including data regarding the bottom part of the rider’s body) and in Figure 6 (rear camera 2, simulating the capabilities of a common onboard camera):
Figure 5. OpenPose postprocessing of MotoGP19 rear camera 1. Figure 5. OpenPose postprocessing of MotoGP19 rear camera 1.
Vehicles 2021, 3, FOR PEER REVIEW 7
Figure 6. OpenPose postprocessing of MotoGP19 rear camera 2.
The processing of the acquisitions performed with camera 1 has a good quality with little presence of corrupt frames and undetected key points. On the contrary, the processing of the acquisition with camera 2 presents several corrupt frames, in which the algorithm is not able to recognize parts of the body shape, as illustrated in Figure 7.
Figure 7. Errors in the OpenPose processing of the MotoGP19 frame regarding rear camera 2.
3.3. Machine Learning Technique The data used to train the neural network consist of point arrays from OpenPose
processing. Machine learning algorithms employing the MATLAB neural fitting tool [33] have been used to train the neural network. In particular, 20 different runs, each one comprising about 10 laps, for a global acquired time of 20,000 s, with an acquisition frequency of 20 Hz, have been used to build the global dataset. The data have been organized into 10 input points of the upper body and 10 target points of the lower body, while the hidden and the output layers of the neural network have the dimensions of 6 and 10 neurons, respectively [33,34], as reported in Figure 8.
Figure 8. Neural network layout.
The designed neural network is a two-layered feed-forward network with six hidden neurons based on the sigmoid (activation function of the nonlinear “neuron”) and with 10 linear output neurons (linear regression output function).
Figure 6. OpenPose postprocessing of MotoGP19 rear camera 2.

Vehicles 2021, 3 383
The processing of the acquisitions performed with camera 1 has a good quality withlittle presence of corrupt frames and undetected key points. On the contrary, the processingof the acquisition with camera 2 presents several corrupt frames, in which the algorithm isnot able to recognize parts of the body shape, as illustrated in Figure 7.
Vehicles 2021, 3, FOR PEER REVIEW 7
Figure 6. OpenPose postprocessing of MotoGP19 rear camera 2.
The processing of the acquisitions performed with camera 1 has a good quality with little presence of corrupt frames and undetected key points. On the contrary, the processing of the acquisition with camera 2 presents several corrupt frames, in which the algorithm is not able to recognize parts of the body shape, as illustrated in Figure 7.
Figure 7. Errors in the OpenPose processing of the MotoGP19 frame regarding rear camera 2.
3.3. Machine Learning Technique The data used to train the neural network consist of point arrays from OpenPose
processing. Machine learning algorithms employing the MATLAB neural fitting tool [33] have been used to train the neural network. In particular, 20 different runs, each one comprising about 10 laps, for a global acquired time of 20,000 s, with an acquisition frequency of 20 Hz, have been used to build the global dataset. The data have been organized into 10 input points of the upper body and 10 target points of the lower body, while the hidden and the output layers of the neural network have the dimensions of 6 and 10 neurons, respectively [33,34], as reported in Figure 8.
Figure 8. Neural network layout.
The designed neural network is a two-layered feed-forward network with six hidden neurons based on the sigmoid (activation function of the nonlinear “neuron”) and with 10 linear output neurons (linear regression output function).
Figure 7. Errors in the OpenPose processing of the MotoGP19 frame regarding rear camera 2.
3.3. Machine Learning Technique
The data used to train the neural network consist of point arrays from OpenPoseprocessing. Machine learning algorithms employing the MATLAB neural fitting tool [33]have been used to train the neural network. In particular, 20 different runs, each onecomprising about 10 laps, for a global acquired time of 20,000 s, with an acquisitionfrequency of 20 Hz, have been used to build the global dataset. The data have beenorganized into 10 input points of the upper body and 10 target points of the lower body,while the hidden and the output layers of the neural network have the dimensions of 6and 10 neurons, respectively [33,34], as reported in Figure 8.
Vehicles 2021, 3, FOR PEER REVIEW 7
Figure 6. OpenPose postprocessing of MotoGP19 rear camera 2.
The processing of the acquisitions performed with camera 1 has a good quality with little presence of corrupt frames and undetected key points. On the contrary, the processing of the acquisition with camera 2 presents several corrupt frames, in which the algorithm is not able to recognize parts of the body shape, as illustrated in Figure 7.
Figure 7. Errors in the OpenPose processing of the MotoGP19 frame regarding rear camera 2.
3.3. Machine Learning Technique The data used to train the neural network consist of point arrays from OpenPose
processing. Machine learning algorithms employing the MATLAB neural fitting tool [33] have been used to train the neural network. In particular, 20 different runs, each one comprising about 10 laps, for a global acquired time of 20,000 s, with an acquisition frequency of 20 Hz, have been used to build the global dataset. The data have been organized into 10 input points of the upper body and 10 target points of the lower body, while the hidden and the output layers of the neural network have the dimensions of 6 and 10 neurons, respectively [33,34], as reported in Figure 8.
Figure 8. Neural network layout.
The designed neural network is a two-layered feed-forward network with six hidden neurons based on the sigmoid (activation function of the nonlinear “neuron”) and with 10 linear output neurons (linear regression output function).
Figure 8. Neural network layout.
The designed neural network is a two-layered feed-forward network with six hiddenneurons based on the sigmoid (activation function of the nonlinear “neuron”) and with10 linear output neurons (linear regression output function).
The training process of the neural networks is substantially based on a trial-and-errorapproach. Therefore, it is usually necessary to train the network several times varying itsparameters until converging to the desired results. The dataset was divided into training,validation, and testing sets, assigning 60%, 35% and 5% of data to the three subsets,respectively, obtaining the datasets showed in Figure 9. Such figure shows the results ofthe training process, highlighting the convergence obtained for both x and z coordinates ofthe target points belonging to the lower part of the driver’s body.
The neural network outputs in terms of the entire body representation are illustratedin Figure 10, focusing in particular on the validation of the lower points calculated bymeans of the described technique, which are in a good agreement with the ones acquiredin the same frames from a different point of view. The plot reports the best performanceobtained, defined as the lowest validation error.

Vehicles 2021, 3 384
Vehicles 2021, 3, FOR PEER REVIEW 8
The training process of the neural networks is substantially based on a trial-and-error approach. Therefore, it is usually necessary to train the network several times varying its parameters until converging to the desired results. The dataset was divided into training, validation, and testing sets, assigning 60%, 35% and 5% of data to the three subsets, respectively, obtaining the datasets showed in Figure 9. Such figure shows the results of the training process, highlighting the convergence obtained for both x and z coordinates of the target points belonging to the lower part of the driver’s body.
Figure 9. Best training performance (a) x coordinates; (b) z coordinates.
The neural network outputs in terms of the entire body representation are illustrated in Figure 10, focusing in particular on the validation of the lower points calculated by means of the described technique, which are in a good agreement with the ones acquired in the same frames from a different point of view. The plot reports the best performance obtained, defined as the lowest validation error.
Two distinct acquisitions were made, relating to the same lap, through the use of the two cameras: • Acquisition 1 with camera 1: number of frames acquired 3596 (Figure 5); • Acquisition 2 with camera 2: number of frames acquired 3583 (Figure 6).
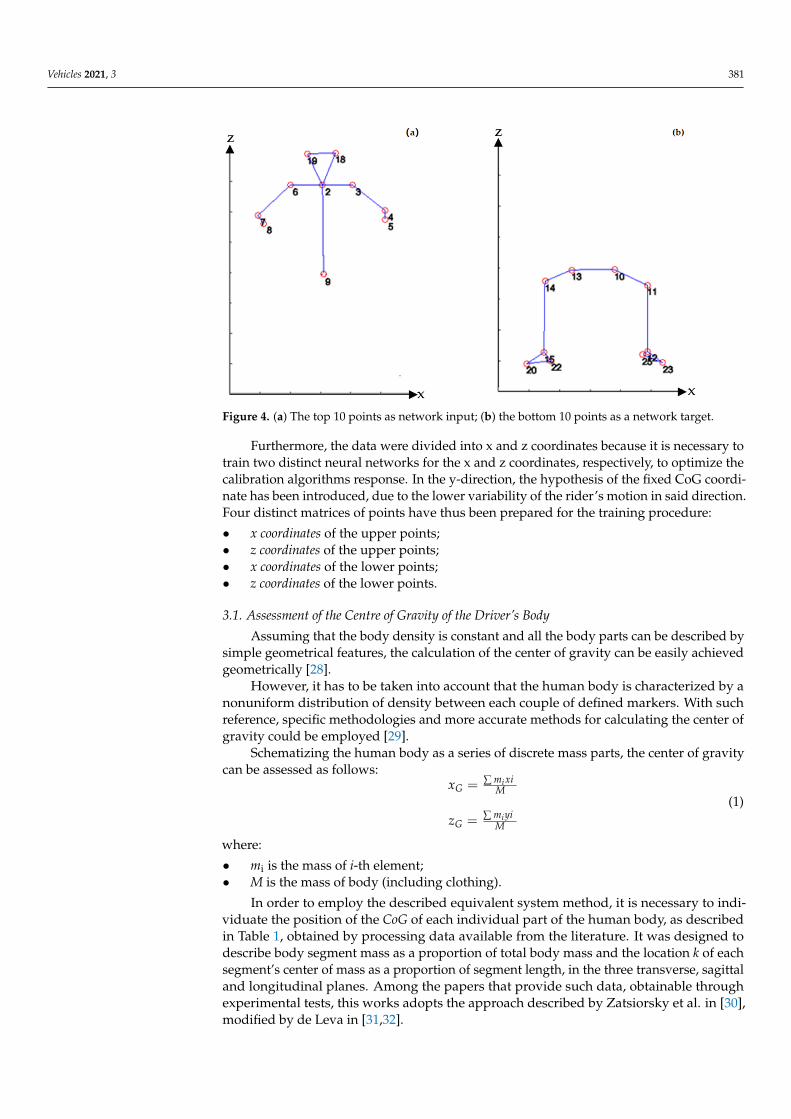
Using the formulations described in Equation (1), an example of the points position, in terms of the center of gravity, obtained thanks to the OpenPose processing and thanks to the machine learning techniques (starting from the OpenPose estimated data) are represented in Figures 11 and 12.
In such figures, the confidence ellipse (or sway area) is depicted. It represents the surface that contains (with 86% probability) the positions of the calculated centers of gravity [35].
Table 2 evidences the further similarity, in terms of standard deviation, relating to the x and z coordinates, between the OpenPose calculations and the results of the machine learning techniques, starting from the same OpenPose raw dataset.
Table 2. Standard deviation value comparison highlighting consistency between the points acquired and processed by means of OpenPose and estimated by means of neural network.
Standard Deviation [cm] X Z
OpenPose 5.43 8.19 Neural Network 5.01 9.1
Figure 9. Best training performance (a) x coordinates; (b) z coordinates.
Vehicles 2021, 3, FOR PEER REVIEW 9
Figure 10. Comparison between estimated and acquired key points in different body configurations.
Figure 11. Dispersion of points obtained thanks to OpenPose software compared with the neural network results (for acquisition 1).
KCO
Mz [c
m]
Figure 10. Comparison between estimated and acquired key points in different body configurations.
Two distinct acquisitions were made, relating to the same lap, through the use of thetwo cameras:
• Acquisition 1 with camera 1: number of frames acquired 3596 (Figure 5);• Acquisition 2 with camera 2: number of frames acquired 3583 (Figure 6).
Using the formulations described in Equation (1), an example of the points position, interms of the center of gravity, obtained thanks to the OpenPose processing and thanks to themachine learning techniques (starting from the OpenPose estimated data) are representedin Figures 11 and 12.
In such figures, the confidence ellipse (or sway area) is depicted. It represents thesurface that contains (with 86% probability) the positions of the calculated centers ofgravity [35].
Table 2 evidences the further similarity, in terms of standard deviation, relating tothe x and z coordinates, between the OpenPose calculations and the results of the machinelearning techniques, starting from the same OpenPose raw dataset.
Vehicles 2021, 3 385
Vehicles 2021, 3, FOR PEER REVIEW 9
Figure 10. Comparison between estimated and acquired key points in different body configurations.
Figure 11. Dispersion of points obtained thanks to OpenPose software compared with the neural
network results (for acquisition 1).
Figure 11. Dispersion of points obtained thanks to OpenPose software compared with the neuralnetwork results (for acquisition 1).
Vehicles 2021, 3, FOR PEER REVIEW 10
Figure 12. Dispersion of points obtained thanks to OpenPose software compared with the neural
network results (for acquisition 2).
3.4. Correlation with Roll Angle
The capacity to predict the motorcycle rider’s behavior becomes crucial when it
comes to correctly define and design the dynamic characteristics of the entire motorcycle
rider system [36,37]. The center of gravity of a motorcycle body can be determined
through geometric and dynamic parameters, usually already available during the design
phase and partly extrapolated through data acquisition systems [38,39].
Regarding the driver inertia system, it varies instant by instant depending on the
driving style and the specific dynamic maneuver [40]. For this reason, one of the aims of
this work is to understand if there is any correlation between the driver’s configuration
and the main telemetry channels, the rolling angle being among them. The study has re-
garded the relative movement between the motorcycle and rider systems, calculated as
the minimum distance “d” between the driver’s center of gravity and the vehicle rolling
axle, the straight line belonging to the symmetric geometrical plane ISO-xz of the moving
frame of the vehicle, as illustrated in Figure 13.
Figure 13. Distance d between the driver’s center of gravity and the vehicle’s rolling axle.
The explicit equation of the distance “d” is defined in Equation (2).
The value of d was calculated as the minimum distance between a point and a
straight line using the equation in explicit form (Equation (2)) per each video frame:
𝑑(𝑃, 𝑟) = |𝑧𝑃−(𝑚𝑥𝑃+𝑞)|
√1+𝑚2 (2)
where:
Figure 12. Dispersion of points obtained thanks to OpenPose software compared with the neuralnetwork results (for acquisition 2).
Table 2. Standard deviation value comparison highlighting consistency between the points acquiredand processed by means of OpenPose and estimated by means of neural network.
Standard Deviation [cm]
X Z
OpenPose 5.43 8.19Neural Network 5.01 9.1
3.4. Correlation with Roll Angle
The capacity to predict the motorcycle rider’s behavior becomes crucial when it comesto correctly define and design the dynamic characteristics of the entire motorcycle ridersystem [36,37]. The center of gravity of a motorcycle body can be determined throughgeometric and dynamic parameters, usually already available during the design phase andpartly extrapolated through data acquisition systems [38,39].

Vehicles 2021, 3 386
Regarding the driver inertia system, it varies instant by instant depending on thedriving style and the specific dynamic maneuver [40]. For this reason, one of the aims ofthis work is to understand if there is any correlation between the driver’s configurationand the main telemetry channels, the rolling angle being among them. The study hasregarded the relative movement between the motorcycle and rider systems, calculated asthe minimum distance “d” between the driver’s center of gravity and the vehicle rollingaxle, the straight line belonging to the symmetric geometrical plane ISO-xz of the movingframe of the vehicle, as illustrated in Figure 13.
Vehicles 2021, 3, FOR PEER REVIEW 10
Figure 12. Dispersion of points obtained thanks to OpenPose software compared with the neural network results (for acquisition 2).
3.4. Correlation with Roll Angle The capacity to predict the motorcycle rider’s behavior becomes crucial when it
comes to correctly define and design the dynamic characteristics of the entire motorcycle rider system [36,37]. The center of gravity of a motorcycle body can be determined through geometric and dynamic parameters, usually already available during the design phase and partly extrapolated through data acquisition systems [38,39].
Regarding the driver inertia system, it varies instant by instant depending on the driving style and the specific dynamic maneuver [40]. For this reason, one of the aims of this work is to understand if there is any correlation between the driver’s configuration and the main telemetry channels, the rolling angle being among them. The study has regarded the relative movement between the motorcycle and rider systems, calculated as the minimum distance “d” between the driver’s center of gravity and the vehicle rolling axle, the straight line belonging to the symmetric geometrical plane ISO-xz of the moving frame of the vehicle, as illustrated in Figure 13.
Figure 13. Distance d between the driver’s center of gravity and the vehicle’s rolling axle.
The explicit equation of the distance “d” is defined in Equation (2). The value of d was calculated as the minimum distance between a point and a
straight line using the equation in explicit form (Equation (2)) per each video frame: 𝑑 𝑃, 𝑟 | | (2)
where:
KCO
Mz [c
m]
Figure 13. Distance d between the driver’s center of gravity and the vehicle’s rolling axle.
The explicit equation of the distance “d” is defined in Equation (2).The value of d was calculated as the minimum distance between a point and a straight
line using the equation in explicit form (Equation (2)) per each video frame:
d(P, r) =|zP − (mxP + q)|√
1 + m2(2)
where:
• xp,yp represent the coordinates of point P;• m is the angular coefficient of the straight line r;• q is the intercept on the ordinate.
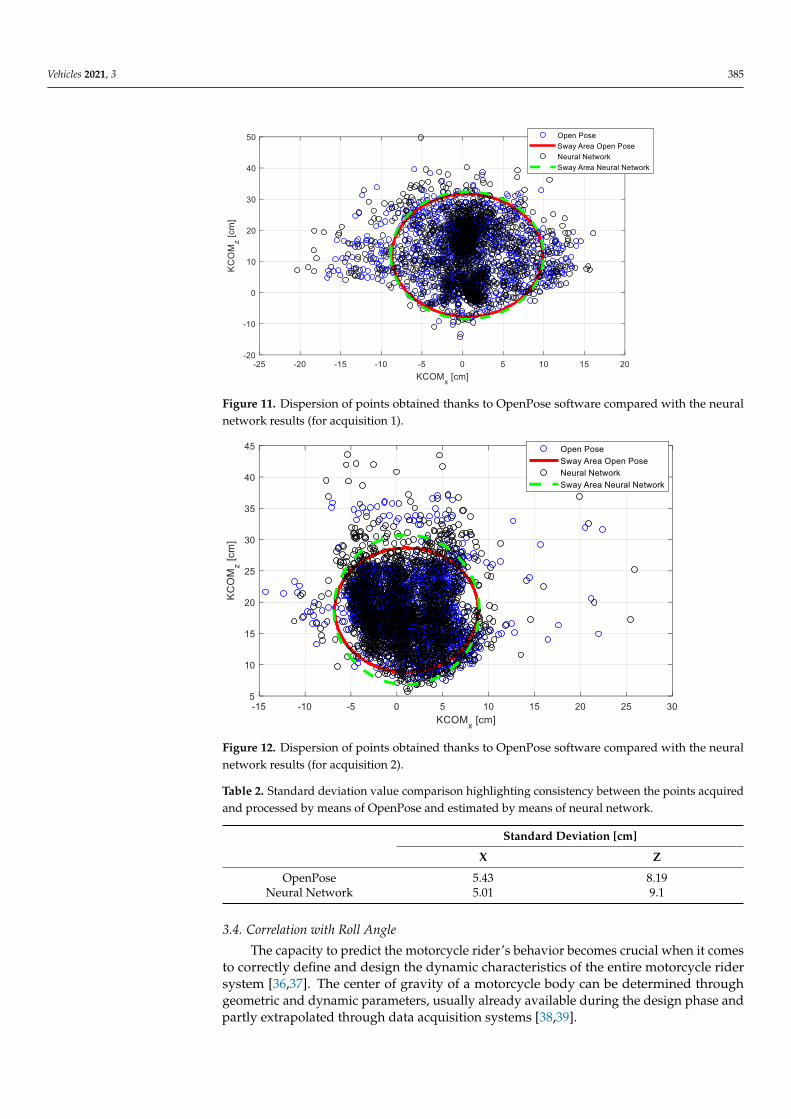
Figure 14a shows the trend of the quantity “d” as a function of the roll angle relative tothe points acquired and processed by OpenPose. Figure 14b, in analogy, shows the trend ofthe quantity “d” as a function of the roll angle relative to the points estimated by means ofthe machine learning technique. In both cases, steady state conditions have been selectedand reproduced with a third order polynomial to fit the main trends, highlighting similarshapes. The low availability of acquired vehicle channels did not allow us to producea clear fitting and to provide further correlations, but the qualitative results encouragepersisting with following studies, able to involve also other variables and a wider dataset.
The negative and positive values of the roll angle represent the vehicle cornering onthe left and on the right, respectively.
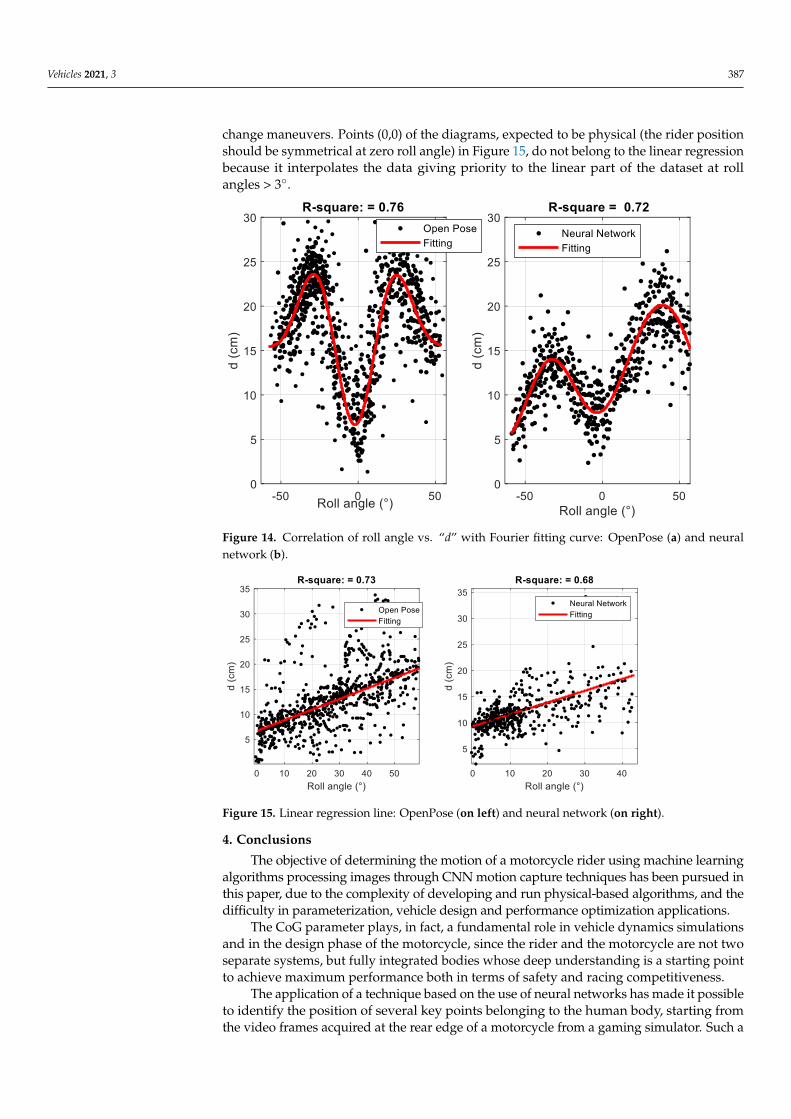
Performing a specific data processing technique, consisting in removing the nonphys-ical outliers and transient stages with tresholds on “d” at 50 cm and on the roll anglederivative, filtering the data with a 1Hz low-pass filter, reporting the rolling angle valuesin the positive quadrant, and performing a linear regression, a preliminary trend of thedistance d with the roll angle could be pointed out, as highlighted in Figure 15.
It can be clearly seen how, in order to better tackle the corners, the riders movetheir bodies internally in order to achieve a lower centre of gravity of the entire driver–motorcycle inertial system, therefore allowing the vehicle to achieve a greater forwardspeed during cornering for the level of the roll angle. All this is strictly related to the travelspeed and relative forces, longitudinal and lateral, exchanged between the tire and theasphalt, designed to ensure the balance of the motorcycle when cornering.
Finally, the points where the roll angle values are high and the “d” values are verysmall are due to the intrinsic characteristics of the rider’s movements during the direction
Vehicles 2021, 3 387
change maneuvers. Points (0,0) of the diagrams, expected to be physical (the rider positionshould be symmetrical at zero roll angle) in Figure 15, do not belong to the linear regressionbecause it interpolates the data giving priority to the linear part of the dataset at rollangles > 3◦.
Vehicles 2021, 3, FOR PEER REVIEW 11
xp,yp represent the coordinates of point 𝑃;
m is the angular coefficient of the straight line 𝑟;
q is the intercept on the ordinate.
Figure 14a shows the trend of the quantity “d” as a function of the roll angle relative
to the points acquired and processed by OpenPose. Figure 14b, in analogy, shows the
trend of the quantity “d” as a function of the roll angle relative to the points estimated by
means of the machine learning technique. In both cases, steady state conditions have been
selected and reproduced with a third order polynomial to fit the main trends, highlighting
similar shapes. The low availability of acquired vehicle channels did not allow us to pro-
duce a clear fitting and to provide further correlations, but the qualitative results encour-
age persisting with following studies, able to involve also other variables and a wider
dataset.
Figure 14. Correlation of roll angle vs. “d” with Fourier fitting curve: OpenPose (on left) and neural
network (on right).
The negative and positive values of the roll angle represent the vehicle cornering on
the left and on the right, respectively.
Performing a specific data processing technique, consisting in removing the non-
physical outliers and transient stages with tresholds on “d” at 50 cm and on the roll angle
derivative, filtering the data with a 1Hz low-pass filter, reporting the rolling angle values
in the positive quadrant, and performing a linear regression, a preliminary trend of the
distance d with the roll angle could be pointed out, as highlighted in Figure 15.
It can be clearly seen how, in order to better tackle the corners, the riders move their
bodies internally in order to achieve a lower centre of gravity of the entire driver–motor-
cycle inertial system, therefore allowing the vehicle to achieve a greater forward speed
during cornering for the level of the roll angle. All this is strictly related to the travel speed
and relative forces, longitudinal and lateral, exchanged between the tire and the asphalt,
designed to ensure the balance of the motorcycle when cornering.
Finally, the points where the roll angle values are high and the “d” values are very
small are due to the intrinsic characteristics of the rider’s movements during the direction
change maneuvers. Points (0,0) of the diagrams, expected to be physical (the rider position
should be symmetrical at zero roll angle) in Figure 15, do not belong to the linear regres-
sion because it interpolates the data giving priority to the linear part of the dataset at roll
angles >3°.
Figure 14. Correlation of roll angle vs. “d” with Fourier fitting curve: OpenPose (a) and neuralnetwork (b).
Vehicles 2021, 3, FOR PEER REVIEW 12
Figure 15. Linear regression line: OpenPose (on left) and neural network (on right).
4. Conclusions
The objective of determining the motion of a motorcycle rider using machine learning
algorithms processing images through CNN motion capture techniques has been pursued
in this paper, due to the complexity of developing and run physical-based algorithms, and
the difficulty in parameterization, vehicle design and performance optimization applica-
tions.
The CoG parameter plays, in fact, a fundamental role in vehicle dynamics simula-
tions and in the design phase of the motorcycle, since the rider and the motorcycle are not
two separate systems, but fully integrated bodies whose deep understanding is a starting
point to achieve maximum performance both in terms of safety and racing competitive-
ness.
The application of a technique based on the use of neural networks has made it pos-
sible to identify the position of several key points belonging to the human body, starting
from the video frames acquired at the rear edge of a motorcycle from a gaming simulator.
Such a choice was made because the reliability of the video data is not a main focus of the
work, which aims to set a methodology that will be then replicated with real vehicle video
data.
The quality of the results obtained is closely linked with the OpenPose software po-
tential, which, as illustrated, could have significant limits in the recognition of key points
in particular positions. Despite such an aspect, the presented activity presents a method-
ologic approach which could be further improved in terms of data quality, thanks to the
availability of a more reliable acquisition system, retaining its feasibility.
The training of a neural network, even applied to frames reproducing partial visibil-
ity of the driver, allowed us to determine the key points not visible to the camera, thus
also guaranteeing the calculation of the center of gravity in conditions in which such a
task could hardly be achievable.
Finally, a preliminary function, linking the relative displacement of the driver’s cen-
ter of gravity towards the vehicle rolling axis as a function of the roll angle, has been pro-
posed.
The determination of the driver’s center of gravity plays a fundamental role in the
overall dynamics of the system. Video analysis techniques represent a novel and under
development discipline, through which it will be increasingly possible to better under-
stand the motorcycle–rider relationship.
The practical implications of the presented study will involve the use of the devel-
oped algorithms in activities regarding vehicle design and motorsport analysis, for which
the continuous and correct information on the rider’s CoG is an element of crucial interest
as concerns the effect of the body motion on vehicle dynamics and the ride/handling atti-
tude of the vehicle to be virtually prototyped.
Figure 15. Linear regression line: OpenPose (on left) and neural network (on right).
4. Conclusions
The objective of determining the motion of a motorcycle rider using machine learningalgorithms processing images through CNN motion capture techniques has been pursued inthis paper, due to the complexity of developing and run physical-based algorithms, and thedifficulty in parameterization, vehicle design and performance optimization applications.
The CoG parameter plays, in fact, a fundamental role in vehicle dynamics simulationsand in the design phase of the motorcycle, since the rider and the motorcycle are not twoseparate systems, but fully integrated bodies whose deep understanding is a starting pointto achieve maximum performance both in terms of safety and racing competitiveness.
The application of a technique based on the use of neural networks has made it possibleto identify the position of several key points belonging to the human body, starting fromthe video frames acquired at the rear edge of a motorcycle from a gaming simulator. Such a
Vehicles 2021, 3 388
choice was made because the reliability of the video data is not a main focus of the work,which aims to set a methodology that will be then replicated with real vehicle video data.
The quality of the results obtained is closely linked with the OpenPose softwarepotential, which, as illustrated, could have significant limits in the recognition of keypoints in particular positions. Despite such an aspect, the presented activity presents amethodologic approach which could be further improved in terms of data quality, thanksto the availability of a more reliable acquisition system, retaining its feasibility.
The training of a neural network, even applied to frames reproducing partial visibilityof the driver, allowed us to determine the key points not visible to the camera, thus alsoguaranteeing the calculation of the center of gravity in conditions in which such a taskcould hardly be achievable.
Finally, a preliminary function, linking the relative displacement of the driver’s centerof gravity towards the vehicle rolling axis as a function of the roll angle, has been proposed.
The determination of the driver’s center of gravity plays a fundamental role in theoverall dynamics of the system. Video analysis techniques represent a novel and underdevelopment discipline, through which it will be increasingly possible to better understandthe motorcycle–rider relationship.
The practical implications of the presented study will involve the use of the developedalgorithms in activities regarding vehicle design and motorsport analysis, for which thecontinuous and correct information on the rider’s CoG is an element of crucial interest asconcerns the effect of the body motion on vehicle dynamics and the ride/handling attitudeof the vehicle to be virtually prototyped.
Author Contributions: Data curation, F.C.; Funding acquisition, G.R.; Methodology, D.S.; Software,D.D.; Supervision, F.F.; Validation, A.S. All authors have read and agreed to the published version ofthe manuscript.
Funding: This research received no external funding.
Institutional Review Board Statement: Not applicable.
Informed Consent Statement: Not applicable.
Data Availability Statement: Not applicable.
Conflicts of Interest: The authors declare no conflict of interest.
References1. Kourtzi, Z.; Shiffrar, M. Dynamic representations of human body movement. Perception 1999, 28, 49–62. [CrossRef] [PubMed]2. Kanda, T.; Ishiguro, H.; Imai, M.; Ono, T. Body movement analysis of human-robot interaction. IJCAI 2003, 3, 177–182.3. Panjan, A.; Sarabon, N. Review of Methods for the Evaluation of Human Body Balance. Sport Sci. Rev. 2012, 19, 131. [CrossRef]4. Catena, R.D.; Chen, S.H.; Chou, L.S. Does the anthropometric model influence whole-body center of mass calculations in gait? J.
Biomech. 2017, 59, 23–28. [CrossRef] [PubMed]5. Cheli, F.; Mazzoleni, P.; Pezzola, M.; Ruspini, E.; Zappa, E. Vision-based measuring system for rider’s pose estimation during
motorcycle riding. Mech. Syst. Signal Process. 2013, 38, 399–410. [CrossRef]6. Cimolin, V.; Galli, M. Summary measures for clinical gait analysis: A literature review. Gait Posture 2014, 39, 1005–1010. [CrossRef]7. Durkin, J.L.; Dowling, J.J.; Andrews, D.M. The measurement of body segment inertial parameters using dual energy X-ray
absorptiometry. J. Biomech. 2002, 35, 1575–1580. [CrossRef]8. Munoz, F.; Rougier, P.R. Estimation of centre of gravity movements in sitting posture: Application to trunk backward tilt. J.
Biomech. 2011, 44, 1771–1775. [CrossRef]9. Jaffrey, M.A. Estimating Centre of Mass Trajectory and Subject-Specific Body Segment Parameters Using Optimisation Approaches; Victoria
University: Melbourne, Australia, 2008; pp. 1–389.10. Mündermann, L.; Corazza, S.; Andriacchi, T.P. The evolution of methods for the capture of human movement leading to
markerless motion capture for biomechanical applications. J. Neuro Eng. Rehabil. 2006, 3, 1–11. [CrossRef]11. Hasler, N.; Rosenhahn, B.; Thormählen, T.; Wand, M.; Gall, J.; Seidel, H.P. Markerless motion capture with unsynchronized
moving cameras. IEEE Conf. Comput. Vis. Pattern Recognit. 2009, 224–231. [CrossRef]12. Bakhtiari, A.; Bahrami, F.; Araabi, B.N. Real Time Estimation and Tracking of Human Body Center of Mass Using 2D Video
Imaging. In Proceedings of the 1st Middle East Conference on Biomedical Engineering 2011, Sharjah, United Arab Emirates,21–24 February 2011. [CrossRef]
Vehicles 2021, 3 389
13. Cronin, N.J.; Rantalainen, T.; Ahtiainen, J.P.; Hynynen, E.; Waller, B. Markerless 2D kinematic analysis of underwater running:A deep learning approach. J. Biomech. 2019, 87, 75–82. [CrossRef]
14. Cao, Z.; Simon, T.; Wei, S.E.; Sheikh, Y. Realtime Multi-Person 2D Pose Estimation Using Part Affinity Fields. In Proceedings ofthe IEEE Conference on Computer Vision and Pattern Recognition, Honolulu, 21–26 July 2017; pp. 1302–1310. [CrossRef]
15. D’Andrea, D.; Cucinotta, F.; Farroni, F.; Risitano, G.; Santonocito, D.; Scappaticci, L. Development of Machine Learning Algorithmsfor the Determination of the Centre of Mass. Symmetry 2021, 13, 401. [CrossRef]
16. Rice, R.S. Rider skill influences on motorcycle maneuvering. SAE Trans. 1978. [CrossRef]17. Liu, T.S.; Wu, J.C. A Model for a Rider-Motorcycle System Using Fuzzy Control. IEEE Trans. Syst. Man Cybern. 1993, 23, 267–276.
[CrossRef]18. Wang, Q.; Kurillo, G.; Ofli, F.; Bajcsy, R. Evaluation of Pose Tracking Accuracy in the First and Second Generations of Microsoft
Kinect. In Proceedings of the 2015 International Conference on Healthcare Informatics, Dallas, TX, USA, 21–23 October 2015.[CrossRef]
19. Kirk, A.G.; O’Brien, J.F.; Forsyth, D.A. Skeletal Parameter Estimation from Optical Motion Capture Data. In Proceedings of theIEEE Computer Society Conference on Computer Vision and Pattern Recognition (CVPR’05), San Diego, CA, USA, 20–25 June2005. [CrossRef]
20. Zordan, V.B.; van der Horst, N.C. Mapping Optical Motion Capture Data to Skeletal Motion Using a Physical Model. In Proceedingsof the 2003 ACM SIGGRAPH/Eurographics Symposium on Computer Animation, San Diego, CA, USA, 26–27 July 2003.
21. Cossalter, V.; Lot, R.; Massaro, M. Motorcycle Dynamics. In Modelling, Simulation and Control of Two-Wheeled Vehicles; Wiley &Sons: London, UK, 2014.
22. Boniolo, I.; Savaresi, S.M.; Tanelli, M. Roll angle estimation in two-wheeled vehicles. IET Control Theory Appl. 2009, 3, 20–32.[CrossRef]
23. Schlipsing, M.; Schepanek, J.; Salmen, J. Video-Based Roll Angle Estimation for Two-Wheeled Vehicles. In Proceedings of the 2011IEEE Intelligent Vehicles Symposium (IV), Baden-Baden, Germany, 5–9 June 2011. [CrossRef]
24. Farroni, F.; Mancinelli, N.; Timpone, F. A real-time thermal model for the analysis of tire/road interaction in motorcycleapplications. Appl. Sci. 2020, 10, 1604. [CrossRef]
25. Czart, W.R.; Robaszkiewicz, S. Openpose. Acta Phys. Pol. A 2004. [CrossRef]26. Martinez, G.H. Single-Network Whole-Body Pose Estimation. In Proceedings of the IEEE/CVF International Conference on
Computer Vision, Seoul, Korea, 28 October 2019. [CrossRef]27. Osokin, D. Real-time 2D multi-person pose estimation on CPU: Lightweight OpenPose. arXiv 2018, arXiv:1811. [CrossRef]28. Frosali, G.; Minguzzi, E. Meccanica Razionale per l’Ingegneria; Esculapio: Lucca, Italy, 2015.29. Yoganandan, N.; Pintar, F.A.; Zhang, J.; Baisden, J.L. Physical properties of the human head: Mass, center of gravity and moment
of inertia. J. Biomech. 2009, 42, 1177–1192. [CrossRef]30. Zatsiorsky, V.M.; King, D.L. An algorithm for determining gravity line location from posturographic recordings. J. Biomech. 1997,
31, 161–164. [CrossRef]31. de Leva, P. Adjustments to zatsiorsky-seluyanov’s segment inertia parameters. J. Biomech. 1996, 29, 1223–1230. [CrossRef]32. Bova, M.; Massaro, M.; Petrone, N. A three-dimensional parametric biomechanical rider model for multibody applications. Appl.
Sci. 2020, 10, 4509. [CrossRef]33. Demuth, H.; Beale, M. Neural Network Toolbox—For Use with MATLAB. MathWorks 2002. [CrossRef]34. Pan, J.; Sayrol, E.; Giro, I.; Nieto, X.; McGuinness, K.; O’connor, N.E. Shallow and Deep Convolutional Networks for Saliency
Prediction. In Proceedings of the IEEE Conference on Computer Vision and Pattern Recognition, Las Vegas, NV, USA, 30 June 2016.[CrossRef]
35. Schubert, P.; Kirchner, M. Ellipse area calculations and their applicability in posturography. Gait Posture 2014, 39, 518–522.[CrossRef]
36. Sforza, A.; Lenzo, B.; Timpone, F. A state-of-the-art review on torque distribution strategies aimed at enhancing energy efficiencyfor fully electric vehicles with independently actuated drivetrains. Int. J. Mech. Control 2019, 20, 3–15.
37. Sharifzadeh, M.; Farnam, A.; Timpone, F.; Senatore, A. Stabilizing a Vehicle Platoon with the Unidirectional Distributed AdaptiveSliding Mode Control. Int. Conf. Mechatron. Technol. ICMT 2019. [CrossRef]
38. Pleß, R.; Will, S.; Guth, S.; Hofmann, M.; Winner, H. Approach to a Holistic Rider Input Determination for a Dynamic MotorcycleRiding Simulator. In Proceedings of the Bicycle and Motorcycle Dynamics Conference, Milwaukee, WI, USA, 21–23 September 2016.
39. Cossalter, V.; Doria, A.; Fabris, D.; Maso, M. Measurement and identification of the vibration characteristics of motorcycle riders.In Proceedings of the Noise and Vibration Engineering: Proceedings of ISMA 2006, Leuven, Belgium, 18–20 September 2006.
40. Nagasaka, K.; Ichikawa, K.; Yamasaki, A.; Ishii, H. Development of a Riding Simulator for Motorcycles; SAE Technical Paper; SAEInternational: Warrendale, PA, USA, 2018. [CrossRef]