evaluation of response surface methodology, …
TRANSCRIPT
FUW Trends in Science & Technology Journal, www.ftstjournal.com
e-ISSN: 24085162; p-ISSN: 20485170; April, 2020: Vol. 5 No. 1 pp. 255 – 263
255
EVALUATION OF RESPONSE SURFACE METHODOLOGY,
ARTIFICIAL NEURAL NETWORK AND ADAPTIVE NEURONS FUZZY
INFERENCE SYSTEM FOR MODELLING AND OPTIMIZING OXALIC
ACID PRODUCTION FROM PINEAPPLE WASTE
N. A. Amenaghawon* and J. O. Kazeem Department of Chemical Engineering, University of Benin, PMB 1154, Edo State, Nigeria
*Corresponding author: [email protected]
Received: December 16, 2019 Accepted: March 12, 2020
Abstract: Oxalic acid is one of the important organic acids produced by fermentation and its production is affected by several
factors. This study investigated the effect of three independent variables namely; potassium dihydrogen phosphate
(KH2PO4), magnesium sulphate (MgSO4) and sodium nitrate (NaNO3) and their mutual interactions on oxalic acid
production from pineapple waste using Box Behnken Design (BBD). Modelling was carried out using Response
Surface methodology (RSM), Artificial Neural Network (ANN) and Adaptive Neuro Fuzzy Inference System
(ANFIS). A quadratic model was obtained to predict the concentration of oxalic acid as a function of the three
independent variables. For ANN, Incremental Back Propagation (IBP) with hyperbolic tangent function (Tanh)
was the best model for predicting oxalic acid production. For ANFIS, the Sugenoinference system combined with
hybrid learning algorithm, Gaussian membership function was found suitable for the prediction of oxalic acid
production. The developed RSM, ANN and ANFIS models described the fermentation with high accuracy as
indicated by their high R2 values (0.957, 0.9894 and 0.9893), low RMSE (1.0923, 0.5417 and 0.5422) and low
AAD (7.8692, 1.1887 and 1.3130), respectively. RSM, ANN and ANFIS coupled with genetic algorithm were
applied to optimize the process for best operating condition and ANN gave the maximum value of oxalic acid
(20.73 g/L) with the best combination of the input variables (0.77 g/L of KH2PO4, 0.09 g/L of MgSO4 and 1.78 g/L
of NaNO3). Based on the statistical indices used for evaluation, ANN performed slightly better than ANFIS-GA
and both were better than RSM. RSM performed the least.
Keywords: Pineapple waste, oxalic acid, ANOVA, ANN, regression analysis
Introduction
Oxalic acid (OA), also referred to as ethanedioic acid is an
organic acid with the molecular formula C2H2O4. It is the
simplest aliphatic dicarboxylic acid naturally present in leafy
vegetables and vegetable products (Walaszczyk et al., 2017).
It can sometimes be found in the uncombined state, although
it is more commonly found a calcium salt. It can also combine
with metals such as sodium, potassium, magnesium or iron to
form less soluble salt (Emeko et al., 2015).
Oxalic acid has wide applications in pharmaceuticals,
wastewater treatment, food industry, hydrometallurgy,
printing, tanning, oil refining, dyes, explosives, metal and
cloth cleaning etc (Adesina et al., 2014). Due to its high
reducing nature, it can be used in the extraction of iron present
in kaolin as impurity. This use in particular has become an
area of interest in the field of hydrometallurgy where iron and
other heavy metals are being extracted from their respective
ores.
Presently, the majority of oxalic acid is produced via chemical
methods. These methods include oxidation of olefins or
alkenes and glycols, decomposition of formates followed by
sulphuric acid (H2SO4) treatment, oxidation of carbohydrates
with nitric acid (HNO3), fusion of sawdust with caustic soda
and radiation processing of carbonate solutions and molasses
(Mandal and Banerjee, 2005). These chemical methods are
known to have negative impacts on the environment and even
may not be cost effective thus motivating the need for the
biological production of this acid (Betiku et al., 2016;
Walaszczyk et al., 2017).
Pineapple (Ananascomosus) is a tropical fruit and it is the
leading edible member of the family Bromeliaceae. Pineapple
accounts for over 20% of the world production of tropical
fruits and as a crop is second only to bananas as the most
relevant harvested fruit (Hossain, 2016). Pineapple is mainly
processed commercially as canned fruits, juices, concentrates
and jams (Upadhyay et al., 2013). The processing of
pineapple into its various value added products results in
massive waste generation especially the peels which account
for about 10% w/w of the weight of the original fruit
(Amenaghawon et al., 2014). These wastes are often
improperly disposed, especially in a developing country like
Nigeria, thereby causing environmental pollution
(Amenaghawon et al., 2015).Due to the fact that these wastes
are sources of carbohydrates, they could serve as important
substrate in the production of useful products such as organic
acids, ethanol etc. via biochemical means (Kareem et al.,
2010). Oxalic acid is one of the organic acids that could be
produced using pineapple waste as a substrate for
fermentation.
Some of the microorganisms considered for oxalic acid
production include Burkhulderiaglumae, Paxillusinvolutus,
Aspergillus niger, Penicillumoxalicum, etc. (Emeko et al.,
2015). Nevertheless, filamentous fungus, Aspergillus niger
remains the microorganism of choice for oxalic acid
production due to its easy handling, ability to ferment a
variety of cheap raw materials, and high yields (Betiku et al.,
2016).
In order to develop an economically viable fermentation
process for industrial production of oxalic acid, it is pertinent
to use cheap substrates, select the right fermentation technique
and carry out optimization of the fermentation variables that
are involved in the process (Santoro et al., 1999). Process
parameters affecting oxalic acid yield such as pH, time,
substrate concentration, medium composition (nitrogen,
phosphorus etc.) are therefore optimized in order to maximize
oxalic acid yield. In the optimization of these parameters, the
one factor at a time approach has been used (Bohlmann et al.,
1998; Mandal and Banerjee, 2005; André et al., 2010). This
method is time consuming and it has been replaced with
necessitating the need for more efficient methods. Response
surface methodology (RSM), artificial neural network (ANN)
and adaptive neuro fuzzy inference system (ANFIS) have
been proposed as viable alternatives to the one factor at a time
method. Both response surface methodology and artificial
neural network have been employed in modelling and
optimization of biochemical processes (Desai et al., 2008;
Supported by

Effect of KH2PO4, MgSO4 & NaNO3 on Oxalic Acid Production from Pineapple Waste
FUW Trends in Science & Technology Journal, www.ftstjournal.com
e-ISSN: 24085162; p-ISSN: 20485170; April, 2020: Vol. 5 No. 1 pp. 255 – 263
256
Youssefi et al., 2009; Elfghi, 2016; Amenaghawon and
Amagbewan, 2017). Although adaptive neuro fuzzy inference
system (ANFIS) has been applied in modeling of different
processes, its application in the fermentation processes is
relatively new.
A variety of substrates have been investigated for oxalic acid
fermentation using A. niger, which include lactose permeate,
milk whey, molasses, post-refining fatty acids, lipids, glucose,
biodiesel-derived waste glycerol and sweet potato starch
hydrolysate (Adesina et al., 2014; Emeko et al., 2015; Betiku
et al., 2016). There is, however, a dearth of information on the
use of pineapple wastes for oxalic acid production
(Amenaghawon et al., 2014).
Thus, the aim of this study is to evaluate the comparative
performance of RSM, ANN and ANFIS as tools for
optimising oxalic acid production from pineapple waste.
Materials and Methods
Pineapple juice extraction The pineapple wastes used for this work were procured from a
local market in Benin City, Edo State, Nigeria. The peels were
washed with clean water to remove any adhering dirt after
which they were blended to obtain a slurry. The juice used for
fermentation was obtained by pressing the slurry through a
filter cloth and this was autoclaved at 121○C for 20 min and
then stored at −20°C before use (Emeko et al., 2015).
Microorganism and inoculum preparation
Aspergillus niger, obtained from Microbiology Department of
the University of Benin, Benin City, Edo State, Nigeria was
used throughout the study as the fermenting organism.
Aspergillusniger spore were obtained from cultures grown on
Sabouraud dextrose agar (SDA) for 5 to 7 days at 30oC. This
fungus was maintained on SDA plates at 4oC and sub cultured
regularly (Emeko et al., 2015).
Medium composition for oxalic acid production
The fermentation medium described by Betiku et al. (2016)
was modified and used in this study. It was composed of
pineapple juice as carbon source, 1.6 g/l of yeast extract,
0.025 g/l of KCl, 1.50 g/l NaNO3, 0.50 g/l of KH2PO4, 0.025
g/l of MgSO4.7H2O. Twenty millilitres of universal pH
indicator solution was then added per litre of medium to
observe the culture pH which was maintained at 6.0 ± 0.5 with
4M NaOH solution during fermentation. All media were
sterilized using an autoclave at 121oC before use ( Emeko et
al., 2015).
Production of oxalic acid
For the inoculum, spores were transferred from the SDA
plates aseptically into a 250 mL flask containing 100 mL of
sterile distilled water. The inoculated flask was incubated on a
controlled–environment incubator shaker at 30oC for 1 h
before it was used for fermentation. For the main experiment,
100 ml of the substrate were measured into a 250 mL pyrex
flask and the nutrients were added. To this was added 5%
(v/v) of the inoculum size aseptically and the flasks were then
placed on a clean table for surface fermentation for 9 days
(Emeko et al., 2015).
Analytical methods
The concentration of oxalic acid was determined using the
catalytic spectrophotometric method (Zhi-Liang et al.,1996).
This technique is based on the acid catalytic effect of the
redox reaction between rhodamine B and dichromate at the
maximum absorption wavelength of 555 nm in sulphuric acid.
For the assay, 10 mL of the sample was withdrawn from the
fermentation medium and filtered with Whatman No. 4 filter
paper. Subsequently, to 1 mL from the filtrate was added 0.5
mL of 0.06 mol/L potassium dichromate (K2Cr2O7), 0.20 mL
of 0.25 mol/L sulphuric acids (H2SO4) and 0.1 mL of 3.28 ×
10-4 mol/L rhodamine B in a 10 mL test tube and then diluted
to the mark with water and mixed thoroughly. The mixture
was placed in a water bath at 90oC. After 8 min, the reaction
was quenched by cooling with tap water and the absorbance
of the mixture read at 555 nm against the blank solution. The
quantity of oxalic acid produced was determined using a
standard calibration curve prepared using oxalic acid (Betiku
et al., 2014).
Design of experiment
A three-level, three-factor Box-Behnken design was employed
for the experimental design in this work. The independent
variables considered for this design include KH2PO4 (0.5-1.0
g/l), NaNO3 (1-2 g/l), and MgSO4 (0-0.5 g/l). The coded and
actual levels of the independent variables are shown in Table
1.The independent variables used were coded according to
Equation 1 as follows
i oi
i
X Xx
X (1)
Where xi and Xi are the coded and actual values of the
independent variable, respectively. Xo is the actual value of
the independent variable at the centre point and ΔXi is the step
change in the actual value of the independent variable. Design
Expert® 7.0.0 (Stat-ease, Inc. Minneapolis, USA), a statistical
software used to develop the experimental design.
Table 1: Coded and actual values of factors
Variables Units Symbols Coded and actual levels
-1 0 +1
KH2PO4 g/l X1 0.50 0.75 1.00
MgSO4 g/l X2 0.00 0.25 0.50
NaNO3 g/l X3 1.00 1.50 2.00
To correlate the response variable to the independent
variables, multiple regression was used to fit the polynomial
model to the experimental data. The fitted quadratic response
model used to estimate the response of the dependent variable
(oxalic acid concentration) is given in Equation 2.
2i o i i ij i j ii i iY b b X b X X b X e (2)
Where Yi is the predicted response or dependent variable, Xi
and Xj are the independent variables, bo is the offset term, bi
and bij are the single and interaction effect coefficients and ei
is the experimental error term (Amenaghawon et al., 2014).
The second order regression model is very flexible and it is
rather easy to estimate the model parameters using the least
squares method (i.e. minimizing the sum of squares of the
errors). Moreover, a lot of practical experiences indicate that
these types of models are suitable for representing most real-
life response surface problems.
ANN model development
Commercial ANN Software, Neural Power, version 2.5
(C.P.C-X Software USA) was used to model and optimize
oxalic acid production via fermentation. Oxalic acid yield was
predicted using the multilayer full feed forward (MFFF) and
the multilayer normal feed forward (MNFF) neural networks.
These networks were trained using different learning
algorithms including incremental back propagation (IBP),
batch back propagation (BBP), quick propagation (QP),
generic algorithm (GA), and Levenberg-Marquadt algorithm
(LM). The ANN architecture was made up of an input layer
with three neurons, a hidden layer and an output layer with
one neuron. The optimal network topology was determined
using only one hidden layer while the number of neurons in
this layer and the transfer function of the input and output
layer were determined iteratively by developing several neural
networks with different transfer functions (Sigmoid,
Hyperbolic-tangent, Gaussian, Linear, Threshold, Linear and
Bipolar Linear). Each of the network was trained using a
stopping criteria of 100,000 iterations (Ajala and Betiku,
2015). The learning algorithms employed 70% of the

Effect of KH2PO4, MgSO4 & NaNO3 on Oxalic Acid Production from Pineapple Waste
FUW Trends in Science & Technology Journal, www.ftstjournal.com
e-ISSN: 24085162; p-ISSN: 20485170; April, 2020: Vol. 5 No. 1 pp. 255 – 263
257
experimental data as training set, 15% as validating set and
the remaining 15% as testing set. This was to evaluate the
predictive ability of the model with respect to the hidden data
which were not used for training and to appraise the
generalization capacity of the ANN.
In designing the network topology i.e. number of hidden
layers and number of neurons, it is also not possible to know
the number of neurons apriori. Too many neurons lead to
over-fitting problem which implies that a trained ANN has
weak generalization capability. However, if the number of
neurons is not sufficient, it leads to under-fitting problems
which means that the trained ANN is too simple to have the
capability of representing the relationship between the input
and output variables. For this work, the chosen network
topology contained a single hidden layer.
ANFIS model development
ANFIS, which has a feed forward neural network structure,
was used to develop a fuzzy model for the estimation of oxalic
acid concentration in a fermentation process with three input
variables (KH2PO4, NaNO3 and MgSO4) and one output
variable (oxalic acid concentration). The proposed ANFIS
model included five distinct layers which are fuzzification,
product, normalization, defuzzification and overall summation
layers (Jang, 1993). The first order Sugeno model with three
input variables was used for this work. With the assumption
of two input (x,y) and one output (z), the main fuzzy rule set
with two IF-THEN rules can be described as follows: Rule 1: if x is 𝐴1 and y is 𝐵1 then 𝑧1 = 𝑝1 ∗ 𝑥 + 𝑞1 ∗ 𝑦 + 𝑟1 (3)
Rule 2: if x is 𝐴2 and y is 𝐵2 then 𝑧2 = 𝑝2 ∗ 𝑥 + 𝑞2 ∗ 𝑦 + 𝑟2 (4)
Where 𝑝𝑖,𝑞𝑖 and 𝑟𝑖 (i=1 or 2) are called linear parameters or
consequent parameters of the first order Sugeno model. 𝐴1,𝐴2,
𝐵1 and 𝐵2 are the fuzzy sets.
Layer 1: This layer consist of three variables and all the nodes
in this layer are adaptive. Each node i in this layer is defined
by a node function:
𝑂1,𝑖 = 𝜇𝐴𝑖(𝑥) (5)
Where x is the input variable to node i and 𝑂1,𝑖 is the
membership grade of a fuzzy set 𝐴𝑖 and it specifies the level
to which the input variable, x satisfies A. 𝜇𝐴𝑖depicts the
membership fuction.
A Gaussian membership function (MF) was chosen for this
work. Every node in this layer denotes a membership value to
a linguistic term as a generalized MF, which has a mean as
depicted in Equation (6).
𝜇𝐴𝑖(𝑥) = 𝑎𝑖𝑒𝑥𝑝 [− (
𝑥−𝑎𝑖
𝑎𝑖)
2] (6)
Where: 𝑎𝑖 and 𝑐𝑖 are the premise parameters of the Gaussian
membership function. The value of the Gaussian MF ranges
between 0 and 1.
Layer 2: This layer is the product of all inward- bound signals
and it used to check the weight of each membership function.
The firing strength of the weight is shown by the output of
each node. The function is given by:
𝑤𝑖 = 𝜇𝐴𝑖(𝑥) × 𝜇𝐵𝑖
(𝑦) (7)
Where: 𝑤𝑖 is the weight or firing strength of the rule
Layer 3: This layer calculates the relative weight which is the
ratio of the ith rule firing strength to the sum of all rule’s
firing strength.
�̅�𝑖 =𝑤𝑖
𝑤1+𝑤2 (8)
The output of this layer can be called normalized firing
strength. Each node implements the required matching of the
fuzzy rules by calculating the activation level of every rule.
Layer 4: Also known as the rules layer and it is obtained by
the multiplication of the normalised firing strength by first
order of Sugeno fuzzy rule. This layer (defuzzification)
defuzzifies the MFs to get the output.
𝑂4,𝑖 = �̅�𝑖 ∙ 𝑧𝑖 = �̅�𝑖(𝑝1 ∗ 𝑥 + 𝑞1 ∗ 𝑦 + 𝑟1) (9)
Where �̅�𝑖 is the output from layer 3 and (𝑝𝑖,𝑞𝑖, 𝑟𝑖) are
consequent parameters.
Layer 5: The single node computes the overall output through
summation of all incoming signals.
𝑂5,𝑖 = ∑ �̅�𝑖𝑖 𝑧𝑖 =∑ 𝑤𝑖𝑧𝑖𝑖
∑ 𝑤𝑖𝑖 (10)
In this work, the model uses a hybrid-learning algorithm, that
combines the gradient method and the least squares estimate
to learn parameters. Fuzzy logic toolbox of MATLAB R2015a
(Mathworks Inc., USA) was used forthe implementation of
the ANFIS modeling. Optimization studies of the fermentation process
To optimize the objective function (oxalic acid concentration),
RSM and GA optimization techniques were used to find the
best combination of the process variables examined. For RSM
optimization, the oxalic acid concentration was set at
maximum while the process variables were set in the ranges
investigated. ANN optimization was carried out using the
genetic algorithm embedded in the software. For ANFIS
optimization, the developed ANFIS model was integrated
with the algorithm, which was then used as the fitness
functions (Pathak et al., 2015). The GA sought stochastically,
the optimum condition that gave the maximum oxalic acid
concentration. The characteristics of the GA used are shown
in Table 2.
Table 2: Genetic algorithm optimization parameters
Property Value/Comment
Population size 5-20
Crossover 1/Scattered
Mutation rate 0.01/Uniform
Generation 15-50
Selection Stochastic uniform
Creation function Constrain dependent
Comparison of RSM, ANN and ANFIS models
The efficiency of the developed mathematical models namely
RSM, ANN and ANFIS in their prediction capabilities of the
response were evaluated extensively for the fermentation
process. Statistical indicators which include correlation
coefficient (R), coefficient of determination (R2), adjusted R2,
mean square error (MSE), root mean square error (RMSE),
standard error of prediction (SEP), mean absolute error
(MAE) and average absolute deviation (AAD) were employed
for this purpose. Equations 11-18 were used to compute these
statistical indices and the results obtained were then compared
to determine the best optimization tool.
𝑅 =∑ (𝑥𝑝,𝑖−𝑥𝑝,𝑎𝑣𝑒).(𝑥𝑎,𝑖−𝑥𝑎,𝑎𝑣𝑒)𝑛
𝑖=1
√[∑ (𝑥𝑝,𝑖−𝑥𝑝,𝑎𝑣𝑒)𝑛𝑖=1
2][∑ (𝑥𝑎,𝑖−𝑥𝑎,𝑎𝑣𝑒)𝑛
𝑖=12
]
(11)
𝑅2 = 1 −∑ (𝑥𝑎,𝑖−𝑥𝑝,𝑖)𝑛
𝑖=12
∑ (𝑥𝑝,𝑖−𝑥𝑎,𝑎𝑣𝑒)𝑛𝑖=1
2 (12)
𝐴𝑑𝑗𝑢𝑠𝑡𝑒𝑑 𝑅2 = 1 − [(1 − 𝑅2) ×𝑛−1
𝑛−𝑘−1] (13)
𝑀𝑆𝐸 =1
𝑛∑ (𝑥𝑝,𝑖 − 𝑥𝑎,𝑖)𝑛
𝑖=1
2 (14)
𝑅𝑀𝑆𝐸 = √1
𝑛∑ (𝑥𝑝,𝑖 − 𝑥𝑎,𝑖)𝑛
𝑖=1
2 (15)
𝑆𝐸𝑃 =𝑅𝑀𝑆𝐸
𝑥𝑎,𝑎𝑣𝑒× 100 (16)
𝑀𝐴𝐸 =1
𝑛∑ |(𝑥𝑎,𝑖 − 𝑥𝑝,𝑖)|𝑛
𝑖=1 (17)
𝐴𝐴𝐷 =1
𝑛(∑ (
|(𝑥𝑎,𝑖−𝑥𝑝,𝑖)|
𝑥𝑎,𝑖)𝑛
𝑖=1 ) × 100 (18)
Where: n is the number of experimental data,𝑥𝑝,𝑖 is the
estimated values, 𝑥𝑎,𝑖 is the experimental values, 𝑥𝑎,𝑎𝑣𝑒 is the
average experimental values, 𝑥𝑝,𝑎𝑣𝑒 is the average estimated

Effect of KH2PO4, MgSO4 & NaNO3 on Oxalic Acid Production from Pineapple Waste
FUW Trends in Science & Technology Journal, www.ftstjournal.com
e-ISSN: 24085162; p-ISSN: 20485170; April, 2020: Vol. 5 No. 1 pp. 255 – 263
258
values and k is the number of input variables (Ogaga et al.,
2017; Betiku et al., 2018).
The coefficient of determination (R2) gives an indication of
consistency between the experimental values and predicted
value. The closer the R2 value is to 1, the better the model fits
the actual data. The value of R2 should be at least 0.8 for a
good fit of a model (Guan and Yao, 2008). R2 is a measure of
the amount of the reduction in the variability of the response
by using the repressor variables in the model while RMSE and
AAD are direct methods for describing deviations. The
RMSE, AAD and MAE between predicted and experimental
values must be as small as possible (Amenaghawon and
Amagbewan, 2017).
Results and Discussion
Analysis of the RSM model
The results of the fermentation process are presented in Table
3 which include the experimental and predicted values.
Regression analysis was performed to fit the response. The
model developed represents oxalic acid concentration (Y) as a
function of KH2PO4 (X1), MgSO4 (X2) and NaNO3 (X3). The
model is given by Equation 19 in terms of the actual factors.
𝑌 = −99.40042 + 164.97610𝑋1 + 60.93220𝑋2
+ 57.22605𝑋3 + 10.00000𝑋1𝑋2
− 2.37800𝑋1𝑋3 − 27.84000𝑋2𝑋3
− 104.06440𝑋12 − 54.92440𝑋2
2
− 14.35410𝑋32 (19)
The results of test of significance for every regression
coefficient and ANOVA as shown in Table 4. The results
showed that the model was significant because of the low p-
value (< 0.05). Apart from indicating whether a model is
significant or not, the p-value tells whether a term in a model
is significant or not and the Fisher test (F value) shows the
level of significance for the model terms but do not
differentiate between the positive and negative effect of the
model terms (Betiku et al., 2014). It was observed that model
terms X1, X3, X2X3, X12 , X2
2 and X32were significant because
of low pvalues (p<0.05) while the termsX2, X1X2 and
X1X3were not significant. The lack of fit of the model was
0.1036, which is insignificant. It is desirable because we want
the model to fit.
Table 3: Comparison of experimental data and RSM
predictions
Run No
Coded value
of factors Actual value of factors Responses (g/l)
X1 X2 X3 X1 X2 X3 Actual
value
RSM
predicted
1 0 0 0 0.75 0.25 1.5 19.57 19.90
2 -1 0 -1 0.50 0.25 1.0 6.50 4.85
3 0 0 0 0.75 0.25 1.5 21.57 19.90 4 -1 1 0 0.50 0.50 1.5 6.73 7.19
5 1 -1 0 1.00 0.00 1.5 11.95 11.49
6 0 0 0 0.75 0.25 1.5 19.57 19.90 7 1 0 1 1.00 0.25 2.0 12.51 14.17
8 0 -1 1 0.75 0.00 2.0 20.46 19.26
9 -1 0 1 0.50 0.25 2.0 11.38 10.99 10 0 0 0 0.75 0.25 1.5 18.54 19.90
11 0 1 -1 0.75 0.50 1.0 12.25 13.45
12 1 1 0 1.00 0.50 1.5 14.06 12.34
13 1 0 -1 1.00 0.25 1.0 8.82 9.35
14 0 -1 -1 0.75 0.00 1.0 6.95 6.88
15 -1 -1 0 0.5 0.00 1.5 7.11 8.83 16 0 0 0 0.75 0.25 1.5 20.25 19.90
17 0 1 1 0.75 0.5 2.0 11.85 11.91
Table 4: Analysis of variance for response surface
quadratic model
Source Sum of
squares df
Mean
square F-value p-value
Model 450.84 9 50.09 17.29 0.0005 X1-KH2PO4 30.52 1 30.52 10.53 0.0141
X2-MgSO4 0.31 1 0.31 0.11 0.7524
X3-NaNO3 58.76 1 58.76 20.28 0.0028
X1X2 1.56 1 1.56 0.54 0.4866
X1X3 0.35 1 0.35 0.12 0.7372
X2X3 48.44 1 48.44 16.72 0.0046
X12 178.12 1 178.12 61.47 0.0001
X22 49.62 1 49.62 17.12 0.0044
X32 54.22 1 54.22 18.71 0.0035
Residual 20.28 7 2.90
Lack of Fit 15.29 3 5.10 4.09 0.1036
Pure Error 4.99 4 1.25
Cor Total 471.13 16
The RSM model was validated by comparing the RSM
predicted results with those obtained from the actual
experiments and the results are shown in Tables 3. The values
predicted by the RSM model were very similar to those of the
experiments indicating validity and reliability of the RSM
model.
The computed R, R2, and adjusted R2 for the quadratic
regression model were 0.97824, 0.957 and 0.902, respectively
(Table 5). These set of high values suggest a good correlation
of the experimental and predicted values, and goodness of fit
of the model. Adequate precision measures the signal to noise
ratio, the value of 11.53 shows an adequate signal for the
model. This model can be used to navigate the design space.
The coefficient of variance (CV) was 12.58% for the model.
The low value of CV observed is indicative of a good model
fit.
Table 5: Goodness of fit statistics for RSM model
Parameter Value
R 0.978
R2
0.957
Adjusted
R2 0.902
Standard
deviation 1.700
Mean 13.530
C.V. % 12.580
PRESS 252.500
Adeq
precision 11.530
Table 6: R2 and RMSE values of MNFF and MFFF using
different training algorithms
Network
architecture Learning algorithm RMSE R2
MNFF
IBP 0.7653 0.9801
BBP 0.6181 0.9870
QP 2.8434 0.7254
GA 1.0945 0.9593
LM 10.1490 -3.0703
MFFF
IBP 0.5584* 0.9894*
BBP 0.5990 0.9878
QP 1.6397 0.9087
GA 2.2085 0.8344
LM 10.1490 -2.4983

Effect of KH2PO4, MgSO4 & NaNO3 on Oxalic Acid Production from Pineapple Waste
FUW Trends in Science & Technology Journal, www.ftstjournal.com
e-ISSN: 24085162; p-ISSN: 20485170; April, 2020: Vol. 5 No. 1 pp. 255 – 263
259
Analysis of the ANN model
Two neural network architectures (multilayer normal feed
forward and multilayer full feed forward) and topology of the
ANN (number of neurons in the hidden layer, transfer
functions for both the hidden and output layers) were selected,
tested and used for the prediction of oxalic acid concentration.
Five training algorithms, incremental back propagation, quick
propagation, genetic algorithm, batch back propagation and
Levenberg-Marquadt algorithm were all used to train the
experimental data. The R2 and RMSE values obtained from
these trainings are shown in Table 6.
From Table 6, it is observed that the IBP was the best training
algorithm to predict the oxalic acid concentration. The
network was chosen because it gave the least RMSE value
(0.5584) and the highest R2 value (0.9894). The best ANN
model obtained in this present study is thus the MFFF
incremental back propagation network with Hyperbolic-
Tangent as the transfer function for both the hidden and
output layers.
Different neural networks with different number of neurons
were investigated and the results are shown in Fig. 1. As can
be seen from the results obtained, the R2 value increased as
the number of neurons was increased from 1 to 3. This is an
indication that the predictive capability of the network was
increasing. However, increasing the number of neurons
beyond 3 did not result in any change in the R2 value showing
that the predictive capability of the network was not enhanced
beyond 3 neurons. Thus, the optimum number of neurons for
the network was chosen as 3. Hence, for a neural network
with three input factors, four neurons in the hidden layer and 1
factor in the output layer, the corresponding optimum neural
networks will be 3-3-1 (Fig. 2). This network topology was
used for further studies to predict the concentration of oxalic
acid produced. For the data set, the value of R, R2 and AAD
were 0.99469, 0.98941 and 1.1887 (Table 7). The value of R
and R2 shows that there was a good agreement between the
experimental and predicted values.
Fig. 1: Determination of optimum number of neurons
Fig. 2: Architecture of final ANN model
Table 7: Goodness of fit statistics for ANN model
Parameter Value
R 0.9947
R2
0.9894
Adjusted
R2 0.9868
MSE 0.2934
RMSE 0.5417
SEP 4.0028
MAE 0.2379
AAD 1.1887
Table 8: Comparison of experimental data and ANN predictions
Run
No
Coded value
of factors
Actual value
of factors Responses (g/l)
X1 X2 X3 X1 X2 X3 Actual
value
ANN
predicted
1 0 0 0 0.75 0.25 1.5 19.57 19.90
2 -1 0 -1 0.50 0.25 1.0 6.50 6.50
3 0 0 0 0.75 0.25 1.5 21.57 19.90
4 -1 1 0 0.50 0.50 1.5 6.73 6.73
5 1 -1 0 1.00 0.00 1.5 11.95 11.95
6 0 0 0 0.75 0.25 1.5 19.57 19.90
7 1 0 1 1.00 0.25 2.0 12.51 12.51
8 0 -1 1 0.75 0.00 2.0 20.46 20.46
9 -1 0 1 0.50 0.25 2.0 11.38 11.38
10 0 0 0 0.75 0.25 1.5 18.54 19.90
11 0 1 -1 0.75 0.50 1.0 12.25 12.25
12 1 1 0 1.00 0.50 1.5 14.06 14.06
13 1 0 -1 1.00 0.25 1.0 8.82 8.82
14 0 -1 -1 0.75 0.00 1.0 6.95 6.95
15 -1 -1 0 0.5 0.00 1.5 7.11 7.11
16 0 0 0 0.75 0.25 1.5 20.25 19.90
17 0 1 1 0.75 0.5 2.0 11.85 11.85
The ANN model was validated by comparing the ANN
predicted results with those obtained from the actual
experiments and the results are shown in Tables 8. The values
predicted by the ANN model were also very similar to those
of the experiments indicating validity and reliability of the
ANN model.
Analysis of the ANFIS model
The developed ANFIS model was subjected to neuro fuzzy
algorithm which was used to train the appropriate set of
training data. For this study, the data was trained to identify
the parameters of the Sugeno-type fuzzy inference system
(FIS) based on the hybrid learning algorithm which combines
gradient descent method and least squares estimate to learn
parameters. The best number of membership function for each
input was determined as 3 and Gaussian membership function
was chosen for the membership grades, while the output of
each rule was obtained using a constant defuzzifier formula.
The characteristics of the ANFIS model are shown in Table 9
while the architecture of the ANFIS model is shown in Fig. 3.
The calculated values of R, R2 and adjusted R2 were 0.9947,
0.9893 and 0.9868, respectively (Table 10). Also, the value of
R2 shows that 99.47% of the variation between the
experimental and predicted values can be described by the
model, indicating that only 0.53% could not be explained by
the model. The value of R, which is ~1 indicates good
correlation between the experimental and predicted values.
Additionally, R2 and adjusted R2> 0.8 are indicative of the
goodness of fit of the model (Joglekar and May, 1987).

Effect of KH2PO4, MgSO4 & NaNO3 on Oxalic Acid Production from Pineapple Waste
FUW Trends in Science & Technology Journal, www.ftstjournal.com
e-ISSN: 24085162; p-ISSN: 20485170; April, 2020: Vol. 5 No. 1 pp. 255 – 263
260
Fig. 3: Architecture of final ANFIS model
Table 9: ANFIS characteristics
Characteristic Value
Epoch 10
Training error 0.5427
Testing error 0.5427
Number of nodes 78
Number of linear parameters
Number of nonlinear
parameters
27
27
Number of fuzzy rules 27
Table 10: Goodness of fit statistics for ANN model
Parameter Value
R 0.9947
R2
0.9894
Adjusted
R2 0.9868
MSE 0.2940
RMSE 0.5422
SEP 4.0065
MAE 0.2534
AAD 1.3130
The ANFIS model was validated by comparing the ANFIS
predicted results with those obtained from the actual
experiments and the results are shown in Tables 11. The
values predicted by the ANFIS model were also very similar
to those of the experiments indicating validity and reliability
of the ANFIS model.
Table 11: Comparison of experimental data and ANFIS
predictions
Run No
Coded value
of factors
Actual value
of factors
Responses
(g/l)
X1 X2 X3 X1 X2 X3 Actual
value
ANFIS
predicted
1 0 0 0 0.75 0.25 1.5 19.57 19.90
2 -1 0 -1 0.50 0.25 1.0 6.50 6.50
3 0 0 0 0.75 0.25 1.5 21.57 19.90
4 -1 1 0 0.50 0.50 1.5 6.73 6.72
5 1 -1 0 1.00 0.00 1.5 11.95 11.90
6 0 0 0 0.75 0.25 1.5 19.57 19.90
7 1 0 1 1.00 0.25 2.0 12.51 12.50
8 0 -1 1 0.75 0.00 2.0 20.46 20.50
9 -1 0 1 0.50 0.25 2.0 11.38 11.40
10 0 0 0 0.75 0.25 1.5 18.54 19.90
11 0 1 -1 0.75 0.50 1.0 12.25 12.20
12 1 1 0 1.00 0.50 1.5 14.06 14.10
13 1 0 -1 1.00 0.25 1.0 8.82 8.82
14 0 -1 -1 0.75 0.00 1.0 6.95 6.95
15 -1 -1 0 0.5 0.00 1.5 7.11 7.11
16 0 0 0 0.75 0.25 1.5 20.25 19.90
17 0 1 1 0.75 0.5 2.0 11.85 11.80
Table 12: Performance evaluation of RSM, ANN and
ANFIS models
Parameter RSM ANN ANFIS
R 0.9782 0.9947 0.9947
R2 0.9570 0.9894 0.9893
Adjusted R2 0.902 0.9868 0.9868
MSE 1.1931 0.2934 0.2940
RMSE 1.0923 0.5417 0.5422
SEP (%) 8.0714 4.0028 4.0065
MAE 0.8999 0.2379 0.2534
AAD (%) 7.8692 1.1887 1.3130

Effect of KH2PO4, MgSO4 & NaNO3 on Oxalic Acid Production from Pineapple Waste
FUW Trends in Science & Technology Journal, www.ftstjournal.com
e-ISSN: 24085162; p-ISSN: 20485170; April, 2020: Vol. 5 No. 1 pp. 255 – 263
261
Performance evaluation of RSM, ANN and ANFIS models
The efficiency of the developed RSM, ANN and ANFIS
models to predict the oxalic acid concentration for the
fermentation process was statistically assessed by evaluating
their R, R2, adjusted R2, mean square error (MSE), root mean
square error (RMSE), standard error of prediction (SEP),
mean absolute error (MAE) and average absolute deviation
(AAD) as shown in Table 12.
The value of R should be close to 1 for good correlation
between experimental and predicted values. Also, the three
models had high values of R2 indicating good fit of the
models. For good correlation between experimented and
predicted values, the value of R should be at least 0.8 (Guan
and Yao, 2008). The adjusted R2 was employed in checking
overestimation of R2, and they were also high for the three
models, demonstrating model significance (Betiku et al.,
2018). MSE, a measure of closeness of a fitted line to data
points, was determined for the three models. The RMSE,
which is the square root of the MSE, was also calculated for
the models. The values obtained for both MSE and RMSE
were all low, supporting good fit of the models. SEP, MAE
and AAD measure the accuracy and precision of a model. The
lower the values of these statistical indices, the better the
performance of the model (Sarve et al., 2015). These were all
determined and their associated values are presented in Table
12. From the result of the statistical indicators, ANN and
ANFIS were both superior to RSM, although comparing the
result of ANN and ANFIS, it was seen that ANN was slightly
better than ANFIS in predictive capability. This is seen from
the high values of R, R2 and adjusted R2 for both ANN and
ANFIS compared to that of RSM and their (ANN and ANFIS)
very low values of MSE, RMSE, SEP, MAE and AAD.
The superiority of ANN to RSM has been reported in many
reports (Betiku et al., 2014; Ajala and Betiku, 2015; Sarve,
Sarve et al., 2015) while the reports for the performance
comparison between ANN and ANFIS have been mixed. In
some literature, ANN in terms of its predictive capability is
superior to ANFIS (Kiran and Rajput, 2011; Betiku et al.,
2016) while ANFIS outperformed ANN in other reports
(Sedighi et al., 2011; Rahmanian et al., 2012; Ramzi et al.,
2015). In this work, while the results obtained from ANN and
ANFIS were close, ANN was slightly better than ANFIS.
Effect of factors on oxalic acid production
Three-dimensional response surface plots were used to
investigate the influence of the factor interactions on oxalic
acid concentration (Figs. 4 to 6). The resulting response
surface shows the effect of KH2PO4, NaNO3 and MgSO4 on
oxalic acid produced. The contour plot may be rising ridges,
saddle point, elliptical or circular plot. The shape of the 3D
plots shows there are significant interactions among factors
considered in this work. The dome shape of the plots (Figs. 4
and 5) indicate that there are shared interactions among
factors. Other shapes of the plot indicated a striking
significant interactions among factors considered (Betiku et
al., 2016).
Fig. 4: Response surface showing the effect of MgSO4 and
KH2PO4 on oxalic acid concentration
Fig. 5: Response surface showing the effect of NaNO3 and
KH2PO4 on oxalic acid concentration
Fig. 6: Response surface showing the effect of NaNO3 and
MgSO4 on oxalic acid concentration
Design-Expert® Software
oxalic acid yield21.568
6.504
X1 = A: KH2PO4X2 = B: MgSO4
Actual FactorC: NaNO3 = 1.50
0.50
0.63
0.75
0.88
1.00
0.00
0.13
0.25
0.38
0.50
6
10
14
18
22
oxalic a
cid
conc(g
/L)
KH2PO4(g/L) MgSO4(g/L)
Design-Expert® Software
oxalic acid yield21.568
6.504
X1 = A: KH2PO4X2 = C: NaNO3
Actual FactorB: MgSO4 = 0.25
0.50
0.63
0.75
0.88
1.00
1.00
1.25
1.50
1.75
2.00
4
8.5
13
17.5
22
oxalic a
cid
conc(g
/L)
KH2PO4(g/L) NaNO3(g/L)
Design-Expert® Software
oxalic acid yield21.568
6.504
X1 = B: MgSO4X2 = C: NaNO3
Actual FactorA: KH2PO4 = 0.75
0.00
0.13
0.25
0.38
0.50
1.00
1.25
1.50
1.75
2.00
6
10
14
18
22
oxalic a
cid
conc(g
/L)
MgSO4(g/L) NaNO3(g/L)
Effect of KH2PO4, MgSO4 & NaNO3 on Oxalic Acid Production from Pineapple Waste
FUW Trends in Science & Technology Journal, www.ftstjournal.com
e-ISSN: 24085162; p-ISSN: 20485170; April, 2020: Vol. 5 No. 1 pp. 255 – 263
262
From Fig. 4, it can be seen that intermediate values of MgSO4
and KH2PO4 gave optimum value of oxalic acid concentration
as a result of the parabolic shape of the 3D plot. Generally, the
presence of these salts in the fermentation medium enhanced
oxalic acid production. For instance, the increase in oxalic
acid yield due to the addition of magnesium sulphate could be
attributed to the fact that magnesium is essential for the
growth and metabolic activity of Aspergillus niger in addition
to its role in various enzymatic reactions within the microbial
cell (Shankaranand and Lonsane, 1994). Previous reports have
also indicated the positive influence of phosphorus (KH2PO4)
during fermentation (Amenaghawon et al., 2015). An increase
in NaNO3 also increased oxalic acid production (Fig. 6) and
similar observations have also been reported (Emeko et al.,
2015).
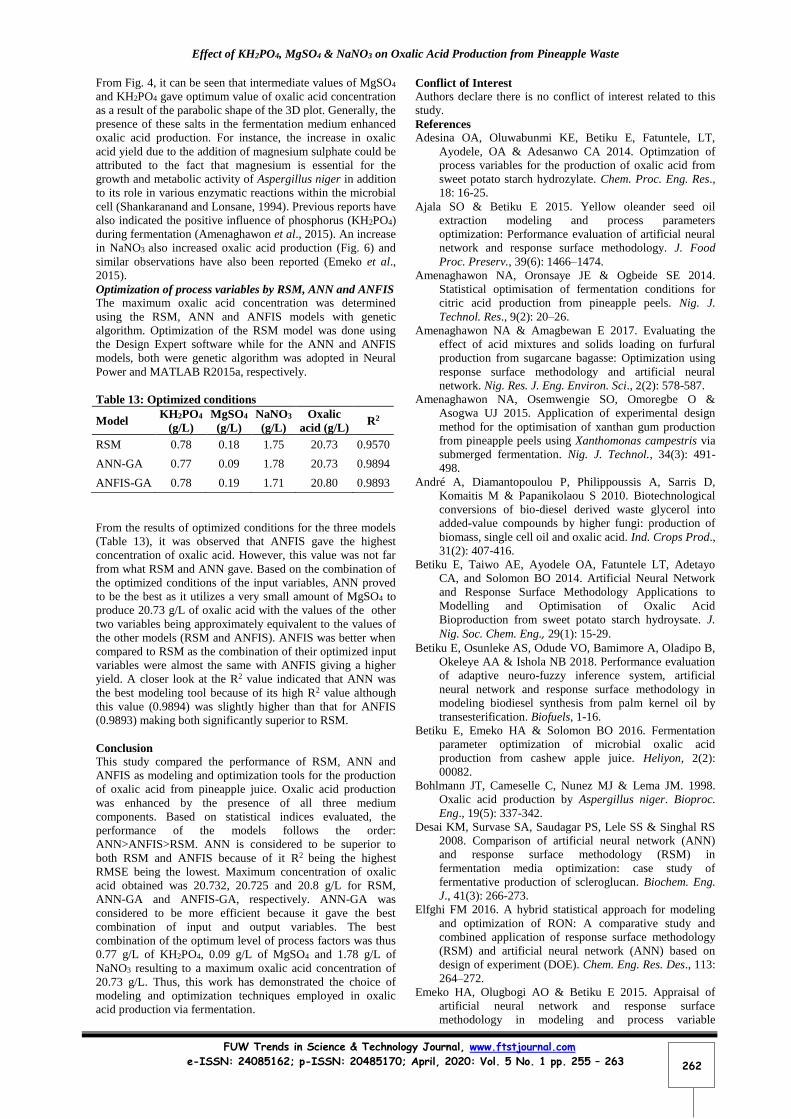
Optimization of process variables by RSM, ANN and ANFIS
The maximum oxalic acid concentration was determined
using the RSM, ANN and ANFIS models with genetic
algorithm. Optimization of the RSM model was done using
the Design Expert software while for the ANN and ANFIS
models, both were genetic algorithm was adopted in Neural
Power and MATLAB R2015a, respectively.
Table 13: Optimized conditions
Model KH2PO4
(g/L)
MgSO4
(g/L)
NaNO3
(g/L)
Oxalic
acid (g/L) R2
RSM 0.78 0.18 1.75 20.73 0.9570
ANN-GA 0.77 0.09 1.78 20.73 0.9894
ANFIS-GA 0.78 0.19 1.71 20.80 0.9893
From the results of optimized conditions for the three models
(Table 13), it was observed that ANFIS gave the highest
concentration of oxalic acid. However, this value was not far
from what RSM and ANN gave. Based on the combination of
the optimized conditions of the input variables, ANN proved
to be the best as it utilizes a very small amount of MgSO4 to
produce 20.73 g/L of oxalic acid with the values of the other
two variables being approximately equivalent to the values of
the other models (RSM and ANFIS). ANFIS was better when
compared to RSM as the combination of their optimized input
variables were almost the same with ANFIS giving a higher
yield. A closer look at the R2 value indicated that ANN was
the best modeling tool because of its high R2 value although
this value (0.9894) was slightly higher than that for ANFIS
(0.9893) making both significantly superior to RSM.
Conclusion
This study compared the performance of RSM, ANN and
ANFIS as modeling and optimization tools for the production
of oxalic acid from pineapple juice. Oxalic acid production
was enhanced by the presence of all three medium
components. Based on statistical indices evaluated, the
performance of the models follows the order:
ANN>ANFIS>RSM. ANN is considered to be superior to
both RSM and ANFIS because of it R2 being the highest
RMSE being the lowest. Maximum concentration of oxalic
acid obtained was 20.732, 20.725 and 20.8 g/L for RSM,
ANN-GA and ANFIS-GA, respectively. ANN-GA was
considered to be more efficient because it gave the best
combination of input and output variables. The best
combination of the optimum level of process factors was thus
0.77 g/L of KH2PO4, 0.09 g/L of MgSO4 and 1.78 g/L of
NaNO3 resulting to a maximum oxalic acid concentration of
20.73 g/L. Thus, this work has demonstrated the choice of
modeling and optimization techniques employed in oxalic
acid production via fermentation.
Conflict of Interest
Authors declare there is no conflict of interest related to this
study.
References
Adesina OA, Oluwabunmi KE, Betiku E, Fatuntele, LT,
Ayodele, OA & Adesanwo CA 2014. Optimzation of
process variables for the production of oxalic acid from
sweet potato starch hydrozylate. Chem. Proc. Eng. Res.,
18: 16-25.
Ajala SO & Betiku E 2015. Yellow oleander seed oil
extraction modeling and process parameters
optimization: Performance evaluation of artificial neural
network and response surface methodology. J. Food
Proc. Preserv., 39(6): 1466–1474.
Amenaghawon NA, Oronsaye JE & Ogbeide SE 2014.
Statistical optimisation of fermentation conditions for
citric acid production from pineapple peels. Nig. J.
Technol. Res., 9(2): 20–26.
Amenaghawon NA & Amagbewan E 2017. Evaluating the
effect of acid mixtures and solids loading on furfural
production from sugarcane bagasse: Optimization using
response surface methodology and artificial neural
network. Nig. Res. J. Eng. Environ. Sci., 2(2): 578-587.
Amenaghawon NA, Osemwengie SO, Omoregbe O &
Asogwa UJ 2015. Application of experimental design
method for the optimisation of xanthan gum production
from pineapple peels using Xanthomonas campestris via
submerged fermentation. Nig. J. Technol., 34(3): 491-
498.
André A, Diamantopoulou P, Philippoussis A, Sarris D,
Komaitis M & Papanikolaou S 2010. Biotechnological
conversions of bio-diesel derived waste glycerol into
added-value compounds by higher fungi: production of
biomass, single cell oil and oxalic acid. Ind. Crops Prod.,
31(2): 407-416.
Betiku E, Taiwo AE, Ayodele OA, Fatuntele LT, Adetayo
CA, and Solomon BO 2014. Artificial Neural Network
and Response Surface Methodology Applications to
Modelling and Optimisation of Oxalic Acid
Bioproduction from sweet potato starch hydroysate. J.
Nig. Soc. Chem. Eng., 29(1): 15-29.
Betiku E, Osunleke AS, Odude VO, Bamimore A, Oladipo B,
Okeleye AA & Ishola NB 2018. Performance evaluation
of adaptive neuro-fuzzy inference system, artificial
neural network and response surface methodology in
modeling biodiesel synthesis from palm kernel oil by
transesterification. Biofuels, 1-16.
Betiku E, Emeko HA & Solomon BO 2016. Fermentation
parameter optimization of microbial oxalic acid
production from cashew apple juice. Heliyon, 2(2):
00082.
Bohlmann JT, Cameselle C, Nunez MJ & Lema JM. 1998.
Oxalic acid production by Aspergillus niger. Bioproc.
Eng., 19(5): 337-342.
Desai KM, Survase SA, Saudagar PS, Lele SS & Singhal RS
2008. Comparison of artificial neural network (ANN)
and response surface methodology (RSM) in
fermentation media optimization: case study of
fermentative production of scleroglucan. Biochem. Eng.
J., 41(3): 266-273.
Elfghi FM 2016. A hybrid statistical approach for modeling
and optimization of RON: A comparative study and
combined application of response surface methodology
(RSM) and artificial neural network (ANN) based on
design of experiment (DOE). Chem. Eng. Res. Des., 113:
264–272.
Emeko HA, Olugbogi AO & Betiku E 2015. Appraisal of
artificial neural network and response surface
methodology in modeling and process variable

Effect of KH2PO4, MgSO4 & NaNO3 on Oxalic Acid Production from Pineapple Waste
FUW Trends in Science & Technology Journal, www.ftstjournal.com
e-ISSN: 24085162; p-ISSN: 20485170; April, 2020: Vol. 5 No. 1 pp. 255 – 263
263
optimization of oxalic acid production from cashew
apple juice: A case of surface fermentation. Bio.
Resource, 10(2): 2067–2082.
Guan X & Yao H 2008. Optimization of Viscozyme L-
assisted extraction of oat bran protein using response
surface methodology. Food Chem., 106: 345–351.
Hossain MF 2016. World pineapple production: An overview.
Afr. J. Food, Agr. Nutr. Dev., 16(4): 11443–11456.
Jang JS 1993. ANFIS: Adaptive-network-based fuzzy
inference system. IEEE Trans. Sys. Man Cyber., 23(3):
665–685.
Joglekar A & May A 1987. Product excellence through design
of experiments. Cereal Foods World, 32: 857–368.
Kareem SO, Akpan I & Alebiowu OO 2010. Production of
citric acid by Aspergillus niger using pineapple waste.
Malay. J. Microbiol., 6(2): 161–165.
Kiran TR & Rajput SPS 2011. An effectiveness model for an
indirect evaporative cooling (IEC) system: Comparison
of artificial neural networks (ANN), adaptive neuro-
fuzzy inference system (ANFIS) and fuzzy inference
system (FIS) approach. Appl. Soft Comput., 11(4): 3525–
3533.
Mandal SK & Banerjee PC 2005. Submerged production of
oxalic acid from glucose by immobilized Aspergillus
niger. Proc. Biochem., 40(5): 1605-1610.
Ighose BO, Adeleke IA, Damos M, Junaid HA, Okpalaeke KE
& Betiku E 2017. Optimization of biodiesel production
from Thevetia peruviana seed oil by adaptive neuro-
fuzzy inference system coupled with genetic algorithm
and response surface methodology. Energy Conv.
Manag., 132: 231-40.
Pathak L, Singh V, Niwas R, Osama K, Khan S, Haque S,
Tripathi CK & Mishra BN 2015. Artificial intelligence
versus statistical modeling and optimization of
cholesterol oxidase production by using Streptomyces sp.
PloS One, 10(9): 0137268.
Rahmanian B, Pakizeh M, Mansoori SA, Esfandyari M, Jafari
D, Maddah H & Maskooki A 2012. Prediction of MEUF
process performance using artificial neural networks and
ANFIS approaches. J. Taiwan Inst. Chem. Engr., 43(4):
558-565.
Ramzi M, Kashaninejad M, Salehi F, Mahoonak AR &
Razavi SM 2015. Modeling of rheological behavior of
honey using genetic algorithm–artificial neural network
and adaptive neuro-fuzzy inference system. Food Biosci.,
9: 60-67.
Santoro R, Cameselle C, Rodriguez-Couto S & Sanroman A
1999. Influence of milk whey, nitrogen and phosphorus
concentration on oxalic acid production by Aspergillus
niger. Bioproc. Engr., 20(1): 1-5.
Sarve A, Sonawane SS & Varma MN 2015. Ultrasound
assisted biodiesel production from sesame (Sesamum
indicum L.) oil using barium hydroxide as a
heterogeneous catalyst: comparative assessment of
prediction abilities between response surface
methodology (RSM) and artificial neural network
(ANN). Ultrason. Sonochem., 26: 218–228.
Sedighi M, Keyvanloo K & Towfighi J 2011. Modeling of
thermal cracking of heavy liquid hydrocarbon:
application of kinetic modeling, artificial neural network,
and neuro-fuzzy models. Ind. Eng. Chem. Res., 50(3):
1536–1547.
Shankaranand VS & Lonsane BK 1994. Ability of Aspergillus
niger to tolerate metal ions and minerals in a solid-state
fermentation system for the production of citric acid.
Proc. Biochem, 29(1): 29–37.
Upadhyay A, Lama JP & Tawata S 2013. Utilization of
Pineapple Waste: A Review. J. Food Sci. Technol.
Nepal, 6: 10–18.
Walaszczyk E, Gąsiorek E & Podgórski W 2017. Effect of
sucrose concentration on oxalic acid biosynthesis by
Aspergillus niger. Zeszyty Problemowe Postępów Nauk
Rolniczych, 588(129): 138.
Youssefi S, Emam-Djomeh Z & Mousavi SM 2009.
Comparison of artificial neural network (ANN) and
response surface methodology (RSM) in the prediction
of quality parameters of spray-dried pomegranate juice.
Dry. Technol., 27(7-8): 910-917.
Zhi-Liang J, Mei-Xiu Z & Lin-Xiu L 1996 Catalytic
spectrophotometric methods for the determination of
oxalic acid.Analytica Chimica Acta, 320(1): 139–143.