a natural capital assessment and post-consumer …
TRANSCRIPT

A NATURAL CAPITAL ASSESSMENT AND POST-CONSUMER WASTE ANALYSIS FOR AMCOR
by
Malcolm Albin, Alexis Apostol, Helen Lee, Carl Spevacek, Nikole Vargas, Julio Villasenor
A project submitted in partial fulfillment of the requirements
for the degree of Master of Science
(Natural Resources & Environment) at the University of Michigan
April 2017
Faculty Advisor: Associate Professor Ming Xu


ii
Abstract Plastic packaging is at the center of our lives as it is found in numerous products used
every day. Increasing the sustainability of plastic packaging will have a major impact on the
world. As one of the largest and most innovative global packaging companies, Amcor leads
the industry, having integrated sustainability into and across its core values.
To understand the best opportunities for improvement, this project analyzed Amcor’s
full supply chain through a natural capital valuation. The natural capital valuation puts a
dollar value on the ecosystems services and externalities associated with Amcor’s business.
Our preliminary findings led us to conclude that, accounting for GHG emissions, water use
and waste generated can make post-consumer resin comparable to virgin resin from a cost
perspective. We also found that Amcor is relatively efficient in its own operations when
compared to the rest of the supply chain, and should therefore focus on its downstream
impacts where it can create the most impact in terms of post-consumer waste.
In focusing on these downstream impacts, we learned quickly that there is minimal
data, globally, on plastic packaging waste, its collection, country infrastructure, and
perception and education around plastic recovery. A model was created to predict plastic
packaging recovery rates for countries where this data does not exist, and also get a better
understanding of which factors most influence the plastic packaging recovery rates. We
found that total household municipal waste, percent of waste to landfill, and the Gini index
have a statistically significant impact on plastic packaging recovery rates. Amcor has an
opportunity to focus on these variables when attempting to improve their downstream
footprint.

iii
Acknowledgements We would like to thank our faculty advisor Ming Xu and the entire Amcor Sustainability
Team, especially Leonore Adams, David Clark, Sarah King, Fabio Peyer, and Gerald
Rebitzer for their guidance on the project.
We would also like to acknowledge the Erb Institute and our families and friends for their
eternal support.

iv
TableofContents
Abstract............................................................................................................................ii
Acknowledgements..........................................................................................................iii
Introduction......................................................................................................................1
Chapter1:NaturalCapitalValuation.................................................................................2Introduction...................................................................................................................2Methodology.................................................................................................................4Measure:Quantities.........................................................................................................6Value:Price.......................................................................................................................9
DetailedMethodologybyImpactCategory..................................................................10CO2E................................................................................................................................10
Quantity:Upstream................................................................................................................................11Quantity:Amcor......................................................................................................................................11Quantity:Downstream............................................................................................................................11Pricing......................................................................................................................................................12PricingBasedonTaxesandTradingSchemes.........................................................................................13SocialCostofCarbon(SCC).....................................................................................................................17
WaterConsumed............................................................................................................18Quantity:Upstream................................................................................................................................19Quantity:AmcorOperations...................................................................................................................22Quantity:Downstream............................................................................................................................22Pricing......................................................................................................................................................23
Waste..............................................................................................................................26Quantity:Upstream................................................................................................................................26Quantity:AmcorOperations...................................................................................................................27Quantity:Downstream............................................................................................................................27Pricing......................................................................................................................................................28
ResultsandImplications..............................................................................................29RecommendationsandConclusions.............................................................................38
Chapter2:Post-ConsumerWaste....................................................................................41Introduction.................................................................................................................41LiteratureReview........................................................................................................42EnvironmentalTradeoffsofFlexiblePlasticPackaging...................................................42FlexiblePlasticPackagingPost-ConsumerWasteChallenges.........................................43
Methodology...............................................................................................................44PhaseI:ResearchintoFlexiblePlasticPackaging............................................................45PhaseII:RegressionModeltoDeterminePlasticRecoveryRates..................................47
CountrySelection....................................................................................................................................48VariableSelection...................................................................................................................................48NoteonDataQuality..............................................................................................................................50
ModelSelection..............................................................................................................52RegressionModelVariations..................................................................................................................52FinalModel.............................................................................................................................................52
ResultsandImplications..............................................................................................55

v
RecommendationsandConclusions.............................................................................56
Appendices.....................................................................................................................58Appendix1:NaturalCapitalValuationCalculationTablesandAdditionalGraphs.........58Appendix2:RegressionModelVariableSources..........................................................68

1
Introduction Plastic packaging is at the center of our lives. From the shampoo bottle to the milk
carton to the chip bag or granola bar packaging, we interact with plastic packaging dozens of
times each day. Because of its ubiquitous influence on our lives, increasing the sustainability
of plastic packaging will have a major impact on the world. As one of the largest and most
innovative global packaging companies, Amcor leads the industry in sustainability, having
integrated sustainability into and across its five core values of Safety, Integrity, Teamwork,
Social Responsibility, and Innovation.
Amcor provides responsible rigid and flexible packaging solutions to the food,
beverage, healthcare, home and personal care, and tobacco packaging industries. The
company is based in Switzerland, with the head office in Australia and the head office for its
rigid products business in Ann Arbor, Michigan. The $10 billion-dollar company operates in
more than 40 countries employing more than 30,000 people. Amcor’s leadership understands
the value in understanding its supply chain, from indirect suppliers to the routes for post-
consumer waste. For this reason, the company tapped graduate students to complete a
research project with two objectives: to provide a natural capital valuation framework and to
assess the impacts of its post-consumer waste.
Amcor leadership foresees the risk of its products both in the natural capital used to
produce products as well as the waste stream created after consumers are finished with the
products. Before investing in new strategies, research into best practices and different options
are needed to determine the best option for Amcor and the industry.

2
Chapter 1: Natural Capital Valuation
Introduction Several companies have implemented natural capital valuation to better understand
the risks faced from environmental impacts. Through natural capital assessments companies
can identify missing markets, imperfect markets, and market failures. By combining natural
capital valuations and risk assessments, companies better understand and appreciate
alternatives and alternative uses, address uncertainty involving supply and demand of natural
resources (especially in the future), and respond to government required use of valuations
against the restricted, administered, or operating market prices for designing
biodiversity/ecosystem conservation programs. Finally, natural resource accounting (for
methods such as Net Present Value) requires natural capital valuation.1
More business leaders are utilizing natural capital valuations because the tactic allows
them to fully comprehend the true value and risks associated with their operations and supply
chains. As a strategic risk management tool, natural capital valuation can identify
sustainability initiatives to target (e.g. resource extraction, suppliers, other parties that utilize
supply chain, waste creation, pollution, etc.), shed light on new unforeseen risks, and protect
shareholder value. Furthermore, through monetization to create a unified metric, natural
capital valuations allow for the translation of environmental impacts into a business metric to
compare different environmental impacts (e.g. land use, emissions, water consumption,
etc.).2 Natural capital valuation reveals a company’s true cost of doing business, in terms of
what a company could be paying for the services provided by natural processes, such as fresh
water, clean air, healthy biodiversity, and productive land. These are costs that are not
currently accounted for by companies.3 Accounting for these costs contributes to a
company’s competitive environmental strategy, which is why Amcor wanted to complete this
analysis for its business.
The Natural Capital Protocol outlines operational, legal and regulatory, financing,
reputational and marketing, and societal risks associated with natural capital impacts.4 Table
1 outlines those risks, and provides examples specific to Amcor operations.
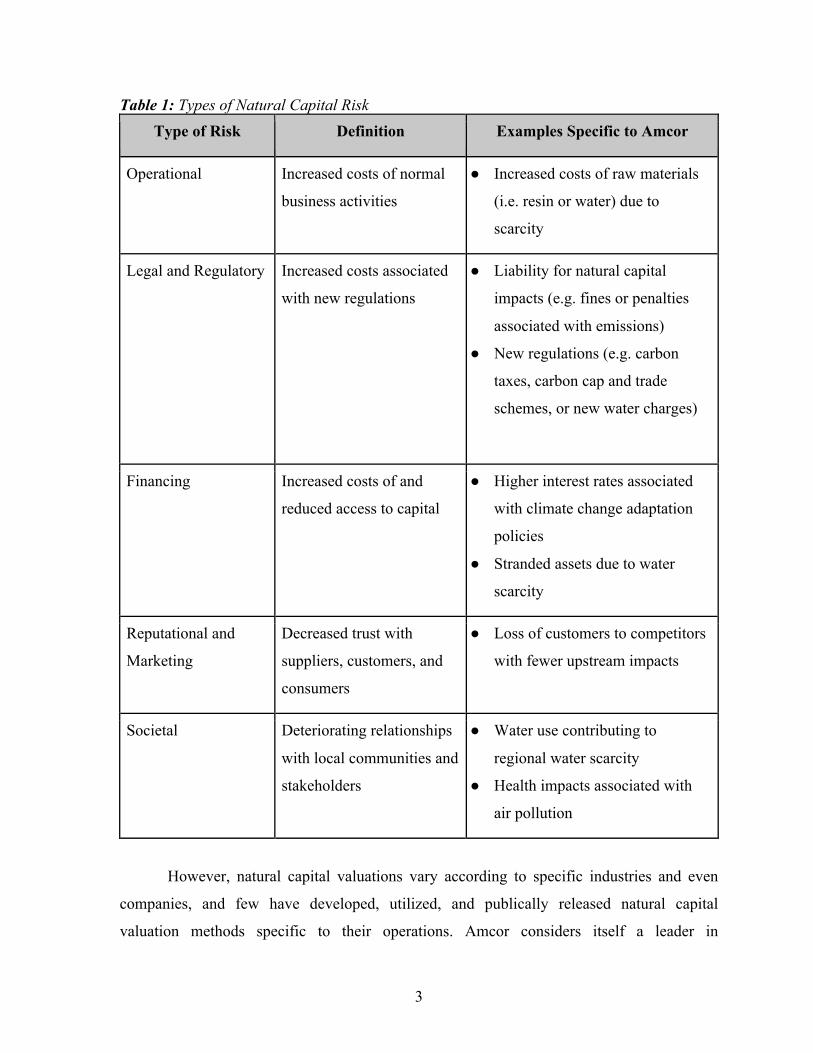
3
Table 1: Types of Natural Capital Risk Type of Risk Definition Examples Specific to Amcor
Operational Increased costs of normal
business activities
● Increased costs of raw materials
(i.e. resin or water) due to
scarcity
Legal and Regulatory Increased costs associated
with new regulations
● Liability for natural capital
impacts (e.g. fines or penalties
associated with emissions)
● New regulations (e.g. carbon
taxes, carbon cap and trade
schemes, or new water charges)
Financing Increased costs of and
reduced access to capital
● Higher interest rates associated
with climate change adaptation
policies
● Stranded assets due to water
scarcity
Reputational and
Marketing
Decreased trust with
suppliers, customers, and
consumers
● Loss of customers to competitors
with fewer upstream impacts
Societal Deteriorating relationships
with local communities and
stakeholders
● Water use contributing to
regional water scarcity
● Health impacts associated with
air pollution
However, natural capital valuations vary according to specific industries and even
companies, and few have developed, utilized, and publically released natural capital
valuation methods specific to their operations. Amcor considers itself a leader in
4
sustainability, and could be the first plastic manufacturer to perform and publish a natural
capital assessment. This achievement would not only distinguish Amcor as an industry leader
in sustainable practices, but would also give the company a competitive advantage, as it
would be in a position to provide this information if necessary for future regulations or
certification processes. In addition, Amcor would be in a position to lead the entire plastic
and broader manufacturing markets in the use of natural capital assessments.
Methodology Given the nascent nature of natural capital valuations in the corporate sector,
consensus regarding an established and accepted protocol does not exist. The Natural Capital
Coalition has outlined a general methodology.5 Companies that have explored natural capital
valuations, including Novo Nordisk6, Puma7, and Puma’s parent company Kering,8 have
published their natural capital valuation methodologies and findings. Consulting firms such
as PwC9 and Trucost10 have published more specific documentation relating to quantifying
and valuing corporate environmental impacts. Trucost has applied its methodology in several
publications, including Natural Capital at Risk: The Top 100 Externalities of Business,11
Plastics and Sustainability: A Valuation of Environmental Benefits, Costs, and Opportunities
for Continuous Improvement,12 and Valuing Plastic: The Business Case for Measuring,
Managing, and Disclosing Plastic Use in the Consumer Goods Industry.13
Following a review of these and other sources, we developed the following
framework and methodology specific to Amcor:
1. Frame: framing involves making the internal case for conducting a natural capital
valuation. We sought to address several objectives for Amcor by conducting a natural
capital valuation, including:
• Provide a baseline from which to compare future valuations;
• Help Amcor explore new ways of measuring risk;
• Develop new sustainability metrics;
• Communicate sustainability metrics, environmental impacts, and
sustainability initiatives in a new way to other corporate decision makers and
departments;
• Compare different environmental impacts using a single metric;
5
• Compare different environmental impacts across the supply chain and the
regions in which Amcor operates; and,
• Help meet client sustainability requirements to provide sales advantages
2. Scope: scoping consists of establishing boundaries and defining what to measure in
the valuation. This can include conducting a valuation at a material, product, site,
business group or unit, or enterprise level. Which components of the value chain to
asses should also be defined, including how far upstream and downstream in the
supply chain to extend the analysis. A temporal boundary can also be applied. Finally,
which environmental key performance indicators (EKPIs) to measure and value
should be defined.
We conducted this natural capital valuation at a high level. Enterprise level
metrics were used, and broken down to the regional or country level where
applicable. The EKPIs were measured at all upstream tiers and Amcor operations, and
from post-consumer waste. The temporal boundary consists of Amcor’s 2015 fiscal
year (July 2015 through June 2016). The EKPIs considered included greenhouse
gases (GHGs), non-GHG air pollutants, land and water pollutants, land use and
biodiversity, waste, and, water consumption.
The chosen EKPIs were GHGs, water quantity, and waste. We chose these
EKPIs based on discussion with Amcor personnel and the fact that Amcor currently
tracks these metrics. Furthermore, these EKPIs have been shown to constitute the
majority (~70%) of plastic product impacts. Current research indicates that land and
water pollution, primarily from upstream raw material extraction and processing,
constitute between 20 and 30% of global plastic product natural capital impacts.14,15
However, much of these impacts are associated with the actual good or product that
contains plastic, rather than plastic packaging itself. Land and water pollution from
plastic packaging in some sectors, such as food, medical and pharmaceutical product,
personal products, restaurants, retail, and soft drinks have been shown to be greater
than impacts from the product itself. Like land and water pollution impacts in all
sectors, the majority of the impacts are associated with upstream material extraction
and processing. Based on this information land and water pollution is not likely to
constitute a significant percentage of Amcor’s direct natural capital impacts.

6
However, significant land and water pollution impacts could be present in the
upstream portions of Amcor’s supply chain.
3. Measure and Value: the measure and value stage consists of quantifying the change in
the impact driver (e.g. GHG, water use, and/or waste) from corporate operations (i.e.
the Quantity (Q)), and determining a valuation coefficient (i.e. the Price (P)), to
convert the quantity to a dollar value.
Measure: Quantities The scope of this analysis included greenhouse gas emissions (GHG), water
use, and waste. To understand the impacts across Amcor’s supply chain, the
emissions were divided into upstream (impacts from direct and indirect Amcor
suppliers), Amcor (impacts from Amcor’s operations), and downstream (impacts
from waste from Amcor operations as well as impacts from post-consumer waste).
Figure 1: Sources of EKPI Quantities
EKPIs were quantified using the following sources:
• GHG: Quantities of greenhouse gas emissions (CO2E) were obtained from
Amcor’s internal corporate greenhouse accounting metrics, which follow the
World Resources Institute (WRI) and World Business Council for Sustainable
Development (WBCSD) Greenhouse Gas (GHG) Protocol for corporate
accounting and reporting.16 These calculations were extracted from Amcor’s
internal environmental tracking system (Envirochart) and further broken down
into Upstream, Amcor Operations, and Downstream emissions as follows:

7
i. Upstream: Upstream emissions were defined as all Scope 2 emissions
and all Scope 3 emissions, excluding Scope 3 emissions from waste.
ii. Amcor Operations: Plant emissions consist of all Scope 1 emissions.
iii. Downstream: Downstream emissions were defined as Scope 3
emissions from waste. These downstream quantities represent only
emissions associated with waste produced at Amcor’s plants, and does
not account for CO2 emissions associated with post-consumer waste.
We estimated emissions associated with post-consumer waste by
calculating the percentage of Amcor’s products that end up being
treated via landfilling, incineration, and recycling. These percentages
are based on country specific waste treatment from various sources
(see the Post-Consumer Waste Assessment Chapter, Methodology
Section) and World Bank data.17 We then applied unit process LCA
metrics obtained from the Ecoinvent database18 as conversion factors
to determine emissions associated with the different disposal routes of
post-consumer waste. We also quantified post-consumer waste that
ends up as land and ocean litter using estimates from literature
values.19
• Water: The amount of water extracted across Amcor’s supply chain were
obtained as follows:
i. Upstream: Upstream water use quantities were calculated using
Environmentally Extended Input-Output models.
ii. Amcor Operations: Plant water use quantities were extracted from
Envirochart.
iii. Downstream: Downstream water use quantities were calculated using
the quantity of waste produced at Amcor’s plants. Waste quantity was
converted to a quantity of water use metric using unit process LCA
metrics that define the amount of water used to treat a quantity of
waste based on the treatment route (i.e. landfilling, incineration, and
recycling).20 These downstream quantities represent only water use
8
associated with waste produced at Amcor’s plants, and does not
account for water use associated with post-consumer waste.
We estimated water use associated with post-consumer waste by
calculating the percentage of Amcor’s products that end up being
treated via landfilling, incineration, and recycling. These percentages
are based on country specific waste treatment from various sources
(see Post-Consumer Waste Assessment Chapter, Methodology
Section) and World Bank data.21 We then applied conversion factors
obtained from the Ecoinvent database22 to determine water use
associated with post-consumer waste.
• Waste: Treated waste is not an EKPI that can be valued itself. It must be
broken out into relative quantities that go through each treatment route (e.g.
landfill, incineration, or recycling). The CO2E emissions and water quantity
usage associated with different treatments routes are available from LCA
database and were included in the categories outlined above.23 Land litter and
ocean waste have no CO2E emissions or water use impacts, so different
impacts, such as disamenity and economic impacts, must be used to avoid a
value of zero for the mismanagement of waste. Waste generated across
Amcor’s supply chain were obtained as follows.
i. Upstream: Waste produced upstream of Amcor’s plants were not
accounted for in this study.
ii. Amcor Operations: Waste quantities produced at Amcor’s plants were
extracted from Envirochart. These quantities were treated as
downstream impacts, and were quantified by determining the
associated amounts of CO2E emissions and water use, as discussed
above.
iii. Downstream: We estimated quantities of post-consumer waste treated
via different treatment routes by calculating the percentage of Amcor’s
products that end up being treated via landfilling, incineration, and
recycling. These percentages are based on country specific waste

9
treatment from various sources (see appendix) and World Bank data.24
We also quantified post-consumer waste that ends up as land ocean
litter using waste mismanagement estimates from literature values.25
Value: Price Several sources outline comprehensive methodologies for pricing
environmental impacts associated with corporate activities. These sources include
PWC’s Valuing Corporate Environmental Impacts26 and Trucost’s Valuation
Methodology.27 Generally, the following methodologies have been deemed
acceptable economic techniques for converting impacts to monetary terms:
• Abatement cost: the cost to remediate or offset an impact;
• Replacement cost, avoided cost, or substitute cost: the cost to replace services
or provide substitute services;
• Contingent valuation: an individual’s stated willingness to pay for a good,
service, or other feature;
• Market pricing: the price of a good or service obtained from a market for
which that good or service exists;
• Hedonic pricing: estimates the value of a good or service based on its effect
on the market price of another good or service (e.g. water or air quality effects
on real estate prices);
• Production function: used to estimate the value of a good or service that
contributes to the production of some other commercially marketed good or
service;
• Travel cost method: an individual’s revealed willingness to pay for a good or
service estimated by measuring the cost incurred to visit a site.
This research did not include any primary valuation studies. We conducted literature
reviews to identify existing valuation coefficients, methodologies, and/or tools that
used these methodologies in order to identify monetary impacts associated with the
chosen EKPIs. Valuation coefficients were derived from the following sources:
• CO2: We used a variety of sources to identify a range of costs for CO2E
emissions including the social cost of carbon and market values for CO2E.
10
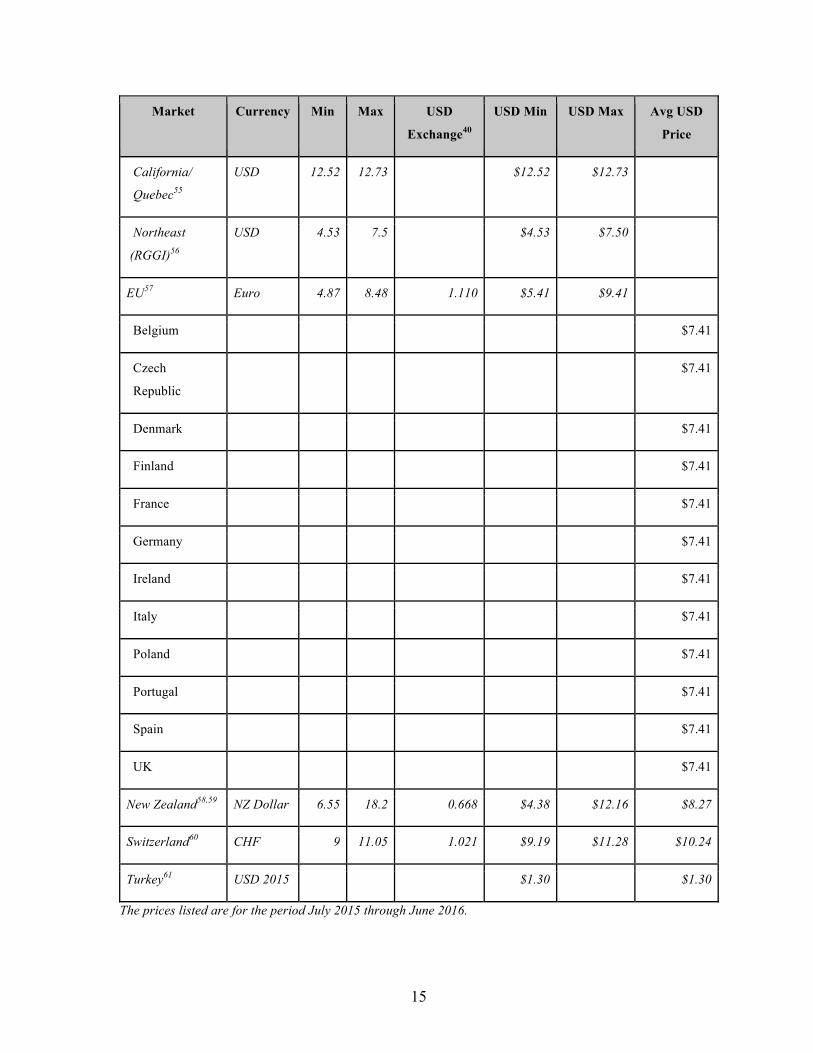
The market values for each country that Amcor has operations in were
identified by researching the price paid on carbon via taxes and/or emission
trading. These values were applied to the quantities derived above to present a
realistic cost of Amcor’s GHG emissions based on actual market conditions
that were present at the time of those emissions. Tables of market based prices
are presented below (Tables 3 & 4). A Social Cost of Carbon (SCC) was used
to present an upper value that represents a holistic, long-term environmental
and social cost of GHG emissions.
• Water: Water use was valued according to previously used methodologies
identified from literature reviews.28,29,30 These methodologies link changes in
water availability to human health and ecosystem health impacts. Water
consumption leads to a decrease in water availability for irrigation and crop
production, which leads to malnutrition.31 The ecosystem health impacts are
obtained by modeling the impact of water consumption on Net Primary
Productivity (NPP), and changes in NPP to ecosystem service value changes.
• Waste: Waste was valued using the CO2 and water values discussed above, as
well as from literature values for values associated with other impacts from
post-consumer waste.
4. Apply: the apply stage consists of validating the results, interpreting the findings, and
determining what actions can be taken. The results and conclusions of our valuation
are presented in subsequent sections.
Detailed Methodology by Impact Category
CO2E CO2E was chosen to include in the scope of this study for a variety of reasons.
Amcor tracks CO2E emissions across its supply chain using the GHG Protocol. Therefore,
we were able to determine emissions upstream of Amcor facilities, at Amcor sites, and
downstream of Amcor facilities using simple methods. Additionally, CO2E is the easiest
natural capital impact to price. Many governments have chosen to tax carbon emissions at
some level, and some have established trading schemes designed to reduce CO2E emissions.

11
Furthermore, although there is no global consensus on a Social Cost of Carbon, there are
estimates that can be used for natural capital valuations.
Quantity: Upstream
Upstream CO2E emissions were considered to be emissions that occur because of
Amcor’s operations, but that occur outside of Amcor’s plants, specifically, those that occur
because of goods and services delivered to Amcor that allow it to operate. These include
Scope 2 emissions, which are associated with emissions that occur to provide energy to
Amcor’s facilities, and the majority of Scope 3 emissions, which are all other emissions
associated with Amcor’s operations, but that occur outside of Amcor plants. However, we
subtracted Scope 3 emissions associated with waste produced at Amcor’s plants from all
other Scope 3 emissions. Scope 3 emissions associated with Amcor’s waste are considered in
downstream impacts.
Quantity: Amcor
Emissions that occur at Amcor’s facilities are calculated and reported as Scope 1
emissions.
Quantity: Downstream
Downstream CO2E emissions were considered to be emissions that occur once
materials leave Amcor’s facilities. These include Scope 3 emissions associated with Amcor’s
waste, which the company currently tracks, and emissions that occur due to the disposal of
Amcor’s products after consumer use. In this methodology, we consider GHG impacts from
waste treated via landfill and incineration. We quantified GHG emissions associated with
waste sent directly from Amcor’s plants to landfill and incineration facilities directly from
Envirochart.
Downstream impacts associated with post-consumer waste treatment can be
calculated by quantifying the amount of waste treated via treatment route and apportioning
associated impacts. The methodology for quantifying the amount of post-consumer waste via
treatment route is discussed in the Waste section below.
Once this quantity of waste was calculated, we applied plastic disposal unit process
LCA metrics from the Ecoinvent database32 as GHG emission conversion factors to calculate

12
the amount of GHG emissions to treat the quantities of waste. Only GHGs included in the
World Resources Institute (WRI) and World Business Council for Sustainable Development
(WBCSD) Greenhouse Gas (GHG) Protocol for corporate accounting and reporting33 were
quantified. We chose the plastic mixture metrics available in the database, because these are
the most representative for estimating the treatment of a broad range of plastic materials. The
emissions of these GHGs were converted to kg of CO2 equivalents using GHG Protocol
conversion factors obtained from SimaPro.34 Once converted to CO2 equivalents, the
resulting factors were summed together to estimate the kg of GHGs emitted to treat a certain
quantity of plastic depending on the waste treatment route (Table 2).
Table 2: GHG Emission Factors GHG Emission Factors
Incineration (kgCO2E/kg waste) = (Tonne
CO2E / Tonne Waste)
Landfill (kgCO2E/kg waste) = (Tonne
CO2E / Tonne Waste)
2.34151967756065 0.0896550366091554
These factors are the result of applying the unit process LCA metrics to waste quantities to determine the quantity of GHGs emitted from treated waste, and then converting the GHG emissions to CO2 equivalents.
Pricing
Though science demonstrates that the impacts of emitting GHGs are global, no matter
where the GHGs are emitted, there are differences in how countries value the impacts.35 For
example, paying a $5USD/tonne of GHG seems like a low price in the U.S. but may be too
much in developing countries like China or Mexico. At this time, there is not a single
international market for GHG emissions trading. The current climate change protocol in
place, COP 21, leaves abatement strategies to each individual country to decide what is best
for its economy. Many countries have developed their own trading scheme or imposed a tax
to encourage companies operating within their borders to limit GHG emissions.
This paper focuses on the 36 countries in which Amcor operates. Although it is likely
that pieces of Amcor’s supply chain are outside of these 36 countries, the model created
assumes that all upstream and downstream impacts happen in the same country as
production. This assumption was made to simplify the calculations for upstream and
downstream impacts.

13
Pricing Based on Taxes and Trading Schemes
The most popular way to encourage abatement is a market-based solution. At COP
21, many large companies pushed for the agreement to include a market-based solution.36 Of
the countries where Amcor produces plastics, more than half of the countries have instituted
some sort of emissions trading scheme (ETS). Some countries, like China, have test markets
that exist in select cities, while others, like those in the European Union, have more rigorous
markets that have been trading for years.
A variety of sectors are required to participate in ETS, though the specifics vary with
each country. For example, the EU’s ETS covers CO2E from power and heat generation,
energy-intensive industry sectors (e.g. oil refineries, steel production, cement, bulk organic
chemicals), and commercial aviation; nitrous oxide from the production of nitric, adipic and
glyoxylic acids and glyoxal; and perfluorocarbons from aluminium production.37 In
comparison, the California Cap-and-Trade Program which is linked to the Québec Cap-and-
Trade System covers more than 30 different sectors including food manufacturing,
transportation, gas extraction, and mining.38
The common system for ETS is cap-and-trade. The regulator of the ETS sets a cap on
the amount of emissions and issues allowances. Companies turn in an allowance for each
tonne emitted, extra allowances can be traded to other companies that exceed the cap.39 Each
year the cap decreases to provide incentives for companies to continue to improve operations.
To determine the price to use for Amcor, we selected the latest fiscal year (July 2015
- June 2016) and found the minimum and maximum price traded over that time period for
each ETS market. For the ETS markets that trade in a currency other than the U.S. dollar, the
prices were converted to U.S. dollars. Then we organized the data by country and found the
average price for each country (see Table 3).
Table 3: Emission Trading Schemes for the Countries in Which Amcor Operates Market Currency Min Max USD
Exchange40
USD Min USD Max Avg USD
Price
China $4.28
Beijing41 Yuan 32.4 60 0.155 $5.03 $9.32

14
Market Currency Min Max USD
Exchange40
USD Min USD Max Avg USD
Price
Shanghai
(V2013)42
Yuan 23.3 32 0.155 $3.62 $4.97
Shanghai
(V2014) 43
Yuan 5.1 16 0.155 $0.79 $2.49
Shanghai
(V2015) 44
Yuan 4.21 22.5 0.155 $0.65 $3.49
Guangdonng45 Yuan 8.1 19.63 0.155 $1.26 $3.05
Shenzhen
(V2013)46
Yuan 26.59 49.01 0.155 $4.13 $7.61
Shenzhen
(V2014) 47
Yuan 21.47 54.45 0.155 $3.33 $8.46
Shenzhen
(V2015) 48
Yuan 25 50 0.155 $3.88 $7.77
Shenzhen
(V2016) 49
Yuan 44.2 48.4 0.155 $6.87 $7.52
Tianjin50 Yuan 11.2 24.1 0.155 $1.74 $3.74
Hubei51 Yuan No
data
No
data
Chongqing52 Yuan 10 18 0.155 $1.55 $2.80
Canada $11.97
Alberta53 CAD 15 0.755 $11.32
California/
Quebec54
USD 12.52 12.73 $12.52 $12.73
USA $9.32
15
Market Currency Min Max USD
Exchange40
USD Min USD Max Avg USD
Price
California/ Quebec55
USD 12.52 12.73 $12.52 $12.73
Northeast
(RGGI)56
USD 4.53 7.5 $4.53 $7.50
EU57 Euro 4.87 8.48 1.110 $5.41 $9.41
Belgium $7.41
Czech
Republic
$7.41
Denmark $7.41
Finland $7.41
France $7.41
Germany $7.41
Ireland $7.41
Italy $7.41
Poland $7.41
Portugal $7.41
Spain $7.41
UK $7.41
New Zealand58,59 NZ Dollar 6.55 18.2 0.668 $4.38 $12.16 $8.27
Switzerland60 CHF 9 11.05 1.021 $9.19 $11.28 $10.24
Turkey61 USD 2015 $1.30 $1.30
The prices listed are for the period July 2015 through June 2016.

16
Some countries also include a tax on carbon, often on power generation to create
incentives for power companies to use the cleanest energy sources possible. Chile and
Mexico both added carbon taxes in the last year, both on the power generation industry.62
Similar to ETS trading, we researched which countries had a carbon tax in effect for the time
period of July 2015 - June 2016. If the tax listed was in a currency other than U.S. dollars,
the tax was translated to U.S. dollars (Table 4).
Table 4: Carbon Taxes for the Countries in Which Amcor Operates Market Currency Tax Price USD Exchange63 Tax Price in USD
Finland64 Euros 50 1.110029 $55.50
Switzerland* USD 34.20 $34.20
Ireland* USD 26.17 $26.17
Denmark65 DKK 100 0.1489 $14.89
Portugal* USD 8 $8.00
Chile66 USD 5 $5.00
Mexico67 USD 3.50 $3.50
Poland* USD 1 $1.00
The prices listed are for the period July 2015 through June 2016. *Various sources were reviewed to determine if the countries had an actual carbon tax or an effective carbon tax that is levied through other mechanism. Values were pulled based on estimates from these sources.68,69,70
Of the countries in which Amcor operates, only eight have instituted a carbon tax. Of
those eight, six have both a carbon tax and an ETS. In those countries, the carbon tax may act
as a floor to the ETS, ensuring the price of carbon never dips below a certain threshold.
The final analysis revolved around the 16 countries that had no ETS or carbon tax.
For these countries, we applied a price of zero. Some countries, like Venezuela and Ecuador,

17
do not believe in the idea of a price on carbon.71 Other countries, like Colombia, are using
alternatives to a carbon tax or ETS to cut emissions.72 And still other countries, like El
Salvador, do not have the infrastructure to track carbon emissions. Since countries like this
are not able to measure the quantity of GHGs emitted at a country level, it would be
impossible to create a carbon tax or ETS.73
Social Cost of Carbon (SCC)
Previous natural capital valuations, such as those conducted by Puma, Kering, and
Novo Nordisk, have all used a social cost of carbon (SCC) to value corporate environmental
damages resulting from CO2E emissions. The SCC is a global marginal damage cost of
CO2E emissions that is based on the present value of damages caused by a metric ton of
carbon during its entire lifetime. Thus, the SCC attempts to identify a comprehensive metric
for the damages of GHG emissions. However, the actual number is dependent on a several
factors, such as emission scenarios, discount rate, and equity weighting.74 Studies that
estimate the SCC use a multi-model approach starting with different emissions scenarios,
such as those provided by the Intergovernmental Panel on Climate Change (IPCC), as inputs
into climate models that predict future changes in climate. The outputs of the climate models
are then used as inputs into impact assessment models that predict impacts on society under
different future climate change conditions. Societal impacts are then translated to economic
costs using economic models. Future costs are discounted back to net present value using a
chosen discount rate.75
More than 300 studies have attempted to identify the SCC.76 Two such studies that
attempt to value carbon are the UK Stern Review77 and the 2016 EPA Interagency Working
Group on Social Cost of Carbon.78 These working groups were officially designated by
European and the United States governments, respectively. Therefore, they serve as official
governmental guidance documents. Climate change models included in these reports include
the Policy Analysis of the Greenhouse Gas Effect (PAGE), Dynamic Integrated Climate
Economy (DICE), and the Climate Framework for Uncertainty, Negotiation, and Distribution
(FUND) models. The PAGE model uses increases in global mean temperature to project a
cost value that combines economic and non-economic costs of climate change damages,
costs of large-scale discontinuities (i.e. extreme weather events), and costs of mitigation
(costs minus the benefits of mitigation).79 The DICE model links increases in global mean
18
surface temperatures to reduced country and region economic outputs through reductions in
physical capital and labor. The model accounts for consumption, investment in physical
capital stock, and expenditures on emissions reductions, and then solves for the optimal path
of savings and emissions reductions over a certain time horizon. The goal of the model is to
maximize the discounted sum of all future utilities from consumption.80 The FUND model
combines population, technology, economic, emission, atmospheric chemistry, climate, sea
level, and impact models to represent plausible future scenarios. The model can then be used
to perform cost-benefit and cost-effectiveness analyses of GHG reduction policies.81
The end result of a SCC calculation is a complete measure of GHG emission damages
in financial terms. However, because of the methodology, wide ranges of estimates exist.
Trucost identified more than 300 studies that attempt to identify the SCC, with estimates
ranging from zero to thousands of dollars per metric ton.82 For the purposes of this report, a
SCC of $128/per tonne in 2015 dollars was applied. This represents damages resulting from
the worse than business as usual scenario in the 2016 USA Interagency Working Group on
Social Cost of Carbon.83 Thus, this value represents a conservative upper-limit estimate of
GHG emission damages.
Water Consumed Natural capital impacts associated with water include both water consumption and
water pollution. Amcor tracks water used at its plants, upstream use quantities can be
estimated using environmentally extended input output models, and downstream use
quantities can be estimated using waste quantities and water use factors to calculate the
amount of water used to treat waste. However, to quantify water pollution would require
profiling water discharges from Amcor’s plants and other pollution that might occur at
Amcor’s plants and become deposited in water (such as air pollution). Upstream impacts
could be estimated using input output models. Downstream impacts would require modelling
water pollution from waste treatment processes. As previously discussed, water pollution is
not likely to cause large natural capital impacts from Amcor’s direct operations. Based on
these considerations, we decided not to include water pollution within the scope of this
project.

19
Quantity: Upstream
As Amcor only tracks water used at its plants, it was necessary to use another method
to estimate the upstream impacts. The environmentally extended input output (EEIO) model
provides a formula to estimate these impacts. The EEIO model calculates the environmental
impacts of both direct and indirect suppliers throughout Amcor’s supply chain. For example,
this method includes the amount of water used to produce resin (the main input for Amcor
products - a direct supplier) as well as the amount of water used to produce oil which is used
to produce resin (an indirect supplier). The EEIO is based on input output economics, a
technique created by Wassily Leontief, which shows that one company’s output is another
company’s input (resin is an output for resin manufacturers and an input for plastic
manufacturers).84 Using matrix algebra and input output tables representing national
economies, it is possible to determine how much of one industry is used to produce a certain
amount of another country.
The Eora multi-region input output table (MRIO) database was used as the source of
data, as it provides tables for every country Amcor operates in and provides comprehensive
environmental satellite accounts for each of the economies in its database.85,86 The databases
for the 36 countries Amcor operates in were downloaded from the Eora website. For each
country, the following variables were defined:
● Z: Includes all of the rows and columns corresponding to the country’s industries and
commodities, but does not include imports, exports, final demand, or primary inputs
● X (Total Output): The sum of each row (including exports and final demand)
● W: Represents Amcor production as a column of all 0’s except $1 for the commodity
that includes plastic packaging
● P: Environmental satellite account - Total Water Used (measured in m3)
● I: Identity matrix with the same dimensions as Z (created in MatLab using I=eye(n)
with n=the rows & columns of Z)
After defining the variables in the table, the data was inputted into MatLab to calculate the
environmental footprint. The following calculations were applied to the defined variables for
each country:
1. A=Z*inv(diag(X));
2. Q=(I-A)^-1*W;

20
3. E=P*(diag(X)^-1);
4. F=E*Q;
F defined the amount of water used to produce $1 of plastic. Finally, to find the total impact
of Amcor’s operations, the F for each country was multiplied by the total Amcor revenue for
2015-16 (Table 5).
Table 5: Input-Output Modelling Results Country Water (m3) for $1
plastic
Total Amcor Revenue
(USD)87
Total Water used (m3)
Argentina 0.0160807 $167,568,242.31 2,694,610.41
Australia 0.0180966 $337,192,200.58 6,102,016.74
Belgium 0.0054569 $130,936,130.83 714,506.65
Brazil 0.0468981 $202,198,672.93 9,482,736.94
Canada 0.0113605 $96,582,257.20 1,097,226.11
Chile 0.0059531 $20,918,237.20 124,528.90
China 0.0209351 $365,579,405.25 7,653,449.66
Colombia 0.0563485 $44,384,979.45 2,501,024.97
Czech Republic 0.0073187 $41,231,998.40 301,765.39
Denmark 0.0007812 $94,436,906.20 73,773.85
Dominican
Republic
0.0142594 $9,664,097.48 137,804.50
Ecuador 0.0611166 $24,029,798.60 1,468,619.23
El Salvador 0.0264957 $36,658,116.55 971,281.84
Finland 0.0029168 $53,342,976.49 155,589.99
France 0.0063253 $581,605,836.27 3,678,837.12
Germany 0.0013874 $399,885,552.03 554,797.07

21
Country Water (m3) for $1
plastic
Total Amcor Revenue
(USD)87
Total Water used (m3)
India 0.1098633 $80,906,000.80 8,888,599.31
Indonesia 0.0057367 $62,287,938.99 357,328.45
Ireland 0.0061008 $20,123,095.08 122,766.19
Italy 0.0064883 $235,580,305.44 1,528,521.89
Mexico 0.0142581 $28,049,878.56 399,938.27
Morocco 0.0301199 $16,742,016.12 504,267.98
New Zealand 0.0085296 $122,772,439.31 1,047,202.74
Peru 0.0130902 $49,669,532.30 650,181.73
Poland 0.0078906 $143,333,689.64 1,130,984.52
Portugal 0.0534098 $90,617,411.57 4,839,859.74
Russia 0.0079798 $61,655,473.35 491,996.75
Singapore 0.0000198 $20,134,050.11 398.32
Spain 0.0028392 $162,407,796.74 461,108.91
Switzerland 0.0005342 $361,222,121.78 192,974.01
Thailand 0.0220902 $133,173,078.51 2,941,815.03
Trinidad &
Tobago
0.0101843 $12,048,987.38 122,710.29
Turkey 0.0091675 $57,261,780.19 524,949.64
USA 0.0454736 $2,645,583,212.00 120,304,104.33
UK 0.0012268 $349,386,434.87 428,616.05
Venezuela 0.0073952 $464,661,366.84 3,436,273.01
22
The variable F represents Water (m3) for $1 plastic produced and was imported from the MatLab calculations. It was then multiplied by the total Amcor Revenue for the corresponding country to determine the total water used (m3) throughout Amcor’s supply chain.
Quantity: Amcor Operations
Amcor tracks the amount of water used at each of its production plants through its
Envirochart software. To find the amount of water used by country, the data for each plant
were downloaded from Envirochart and then the plants were aggregated by country.
Quantity: Downstream
Amcor tracks the amount of waste it produces at its operations in Envirochart, so this
portion of the downstream impacts can be calculated by quantifying the amount of waste
treated via treatment route and apportioning associated impacts. In this methodology, we
considered water use impacts from waste treated via landfill and incineration. We quantified
the waste sent directly from Amcor’s plants to landfill and incineration facilities directly
from Envirochart.
We then used plastic disposal unit process LCA metrics from the Ecoinvent
database88 as water use conversion factors to calculate the amount of water used to treat the
quantities of waste. These factors represent the volume of water used to treat a certain
quantity of plastic depending on the waste treatment route (Table 6). We chose the plastic
mixture metric available in the database, because these are the most representative for
estimating the treatment of a broad range of plastic materials.
23
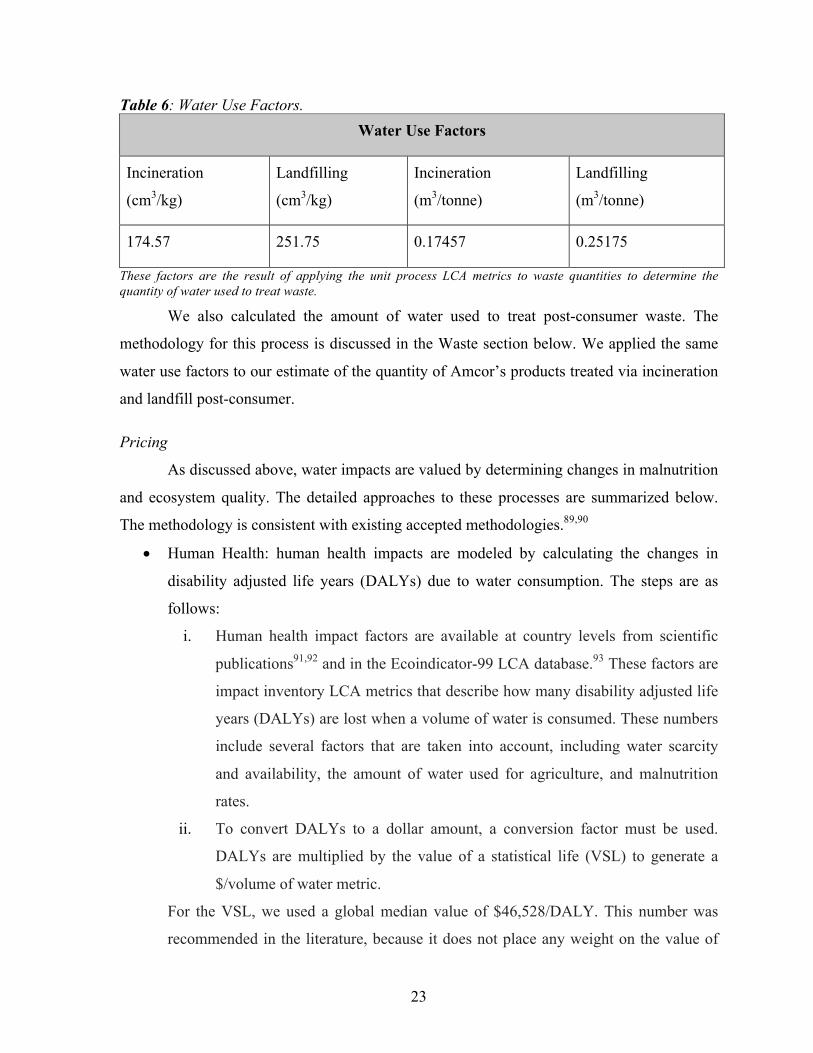
Table 6: Water Use Factors. Water Use Factors
Incineration
(cm3/kg)
Landfilling
(cm3/kg)
Incineration
(m3/tonne)
Landfilling
(m3/tonne)
174.57 251.75 0.17457 0.25175
These factors are the result of applying the unit process LCA metrics to waste quantities to determine the quantity of water used to treat waste.
We also calculated the amount of water used to treat post-consumer waste. The
methodology for this process is discussed in the Waste section below. We applied the same
water use factors to our estimate of the quantity of Amcor’s products treated via incineration
and landfill post-consumer.
Pricing
As discussed above, water impacts are valued by determining changes in malnutrition
and ecosystem quality. The detailed approaches to these processes are summarized below.
The methodology is consistent with existing accepted methodologies.89,90
• Human Health: human health impacts are modeled by calculating the changes in
disability adjusted life years (DALYs) due to water consumption. The steps are as
follows:
i. Human health impact factors are available at country levels from scientific
publications91,92 and in the Ecoindicator-99 LCA database.93 These factors are
impact inventory LCA metrics that describe how many disability adjusted life
years (DALYs) are lost when a volume of water is consumed. These numbers
include several factors that are taken into account, including water scarcity
and availability, the amount of water used for agriculture, and malnutrition
rates.
ii. To convert DALYs to a dollar amount, a conversion factor must be used.
DALYs are multiplied by the value of a statistical life (VSL) to generate a
$/volume of water metric.
For the VSL, we used a global median value of $46,528/DALY. This number was
recommended in the literature, because it does not place any weight on the value of
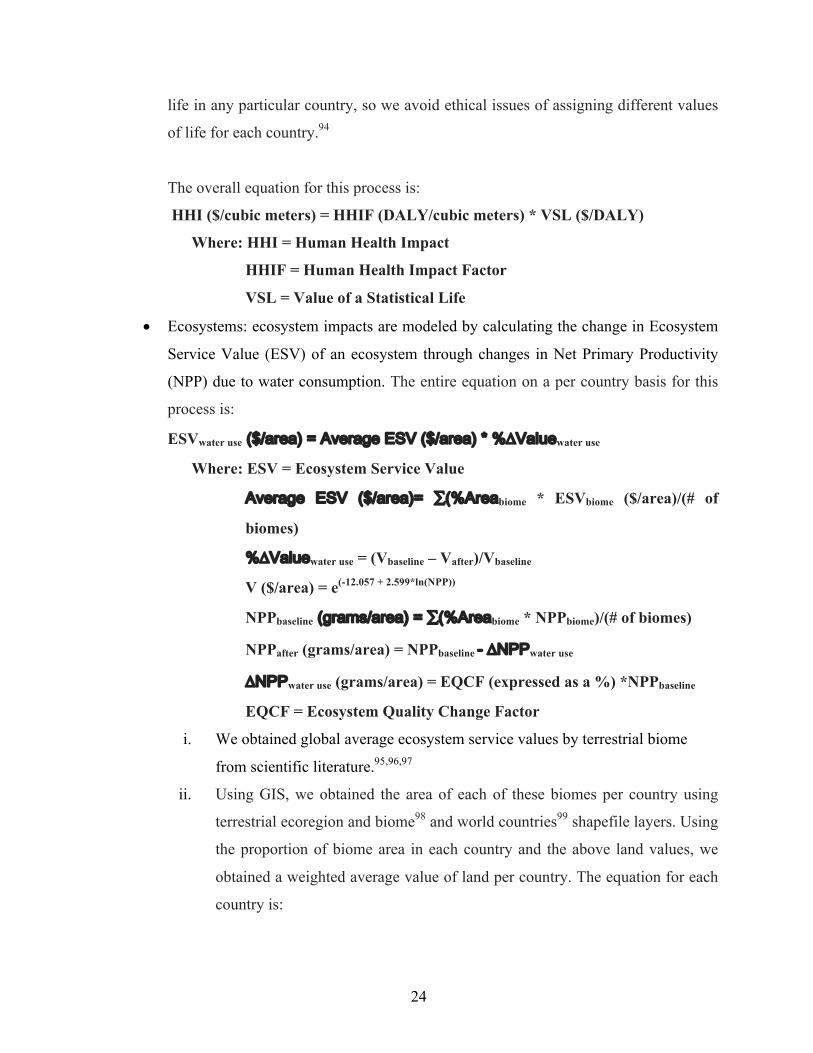
24
life in any particular country, so we avoid ethical issues of assigning different values
of life for each country.94
The overall equation for this process is:
HHI ($/cubic meters) = HHIF (DALY/cubic meters) * VSL ($/DALY)
Where: HHI = Human Health Impact
HHIF = Human Health Impact Factor
VSL = Value of a Statistical Life
• Ecosystems: ecosystem impacts are modeled by calculating the change in Ecosystem
Service Value (ESV) of an ecosystem through changes in Net Primary Productivity
(NPP) due to water consumption. The entire equation on a per country basis for this
process is:
ESVwater use ($/area) = Average ESV ($/area) * %∆Valuewater use
Where: ESV = Ecosystem Service Value
Average ESV ($/area)= ∑(%Areabiome * ESVbiome ($/area)/(# of
biomes)
%∆Valuewater use = (Vbaseline – Vafter)/Vbaseline
V ($/area) = e(-12.057 + 2.599*ln(NPP))
NPPbaseline (grams/area) = ∑(%Areabiome * NPPbiome)/(# of biomes)
NPPafter (grams/area) = NPPbaseline - ∆NPPwater use
∆NPPwater use (grams/area) = EQCF (expressed as a %) *NPPbaseline
EQCF = Ecosystem Quality Change Factor
i. We obtained global average ecosystem service values by terrestrial biome
from scientific literature.95,96,97
ii. Using GIS, we obtained the area of each of these biomes per country using
terrestrial ecoregion and biome98 and world countries99 shapefile layers. Using
the proportion of biome area in each country and the above land values, we
obtained a weighted average value of land per country. The equation for each
country is:

25
Average ESV per Country = ∑(%area of each biome * ESV of each
biome)/(number of biomes in that country)
iii. This weighted average ecosystem service value per country accounts for all
ecosystem services of the land in that country. Thus, the percentage of that
value associated with water needs to be determined. To do this, water use is
linked to net primary productivity (NPP) change, and NPP change is linked to
value change.100 This allows us to calculate a percentage value change due to
water, which we then multiply the original weighted average value of land per
country.
i. First we calculated a baseline NPP number per country using the %
area of each biome per country and average NPP per biome from
literature values.101,102 The equation is:
Average Baseline NPP per country = ∑(%area of each biome *
NPP of each biome)/(number of biomes in that country)
ii. To calculate the baseline ecosystem service value associated with
NPP, we used a relationship from scientific literature that relates NPP
to ecosystem service value.103,104 The equation is:
ln(V) = -12.057 + 2.599*ln(NPP), where V = Value in $/m2, NPP =
Net Primary Productivity in g/m2
This equation can also be written as V = e(-12.057 + 2.599*ln(NPP))
iii. Using this equation, we calculated Vbaseline per country based on the
average NPP per country from above.
iv. To calculate the % NPP lost due to water use, the Ecosystem Quality
impact inventory LCA metric from the Eco-Invent database105 is used.
These numbers represent the proportion of one m2 that is degraded per
volume of water used on a per country basis. However, because it is
derived by estimating the number of plant species lost in a given area,
it can also be treated as a percentage decrease in NPP due to water use.
26
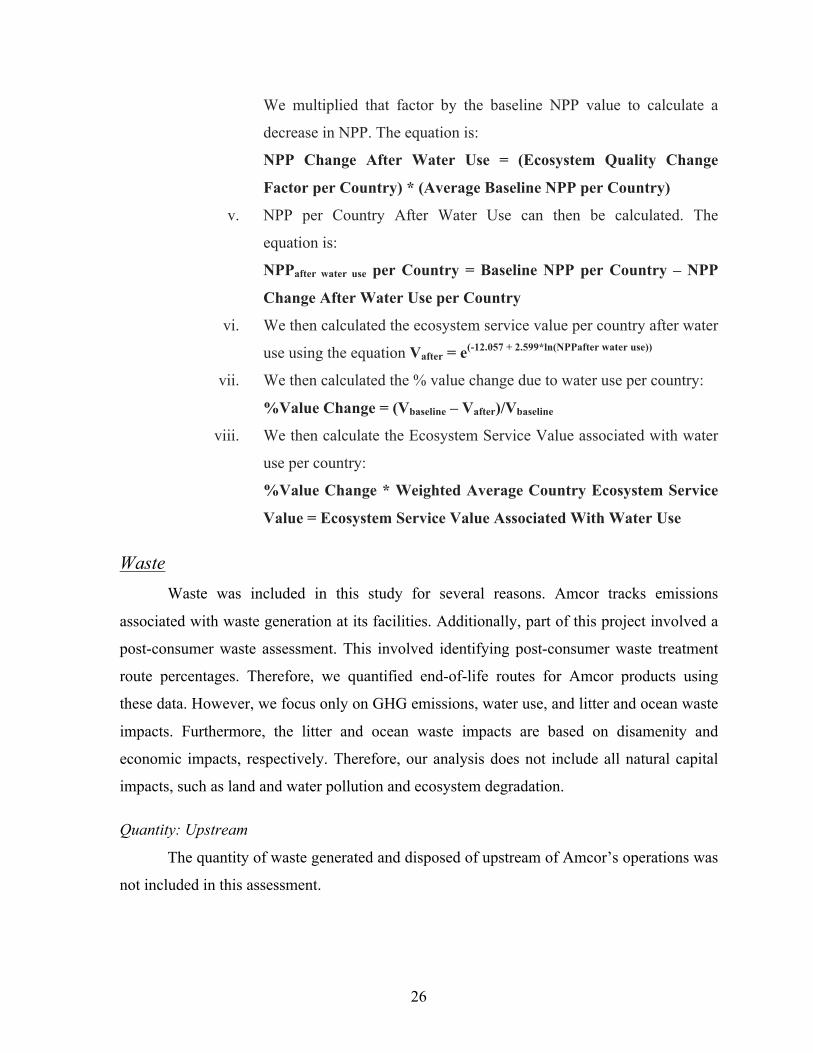
We multiplied that factor by the baseline NPP value to calculate a
decrease in NPP. The equation is:
NPP Change After Water Use = (Ecosystem Quality Change
Factor per Country) * (Average Baseline NPP per Country)
v. NPP per Country After Water Use can then be calculated. The
equation is:
NPPafter water use per Country = Baseline NPP per Country – NPP
Change After Water Use per Country
vi. We then calculated the ecosystem service value per country after water
use using the equation Vafter = e(-12.057 + 2.599*ln(NPPafter water use))
vii. We then calculated the % value change due to water use per country:
%Value Change = (Vbaseline – Vafter)/Vbaseline
viii. We then calculate the Ecosystem Service Value associated with water
use per country:
%Value Change * Weighted Average Country Ecosystem Service
Value = Ecosystem Service Value Associated With Water Use
Waste Waste was included in this study for several reasons. Amcor tracks emissions
associated with waste generation at its facilities. Additionally, part of this project involved a
post-consumer waste assessment. This involved identifying post-consumer waste treatment
route percentages. Therefore, we quantified end-of-life routes for Amcor products using
these data. However, we focus only on GHG emissions, water use, and litter and ocean waste
impacts. Furthermore, the litter and ocean waste impacts are based on disamenity and
economic impacts, respectively. Therefore, our analysis does not include all natural capital
impacts, such as land and water pollution and ecosystem degradation.
Quantity: Upstream
The quantity of waste generated and disposed of upstream of Amcor’s operations was
not included in this assessment.
27
Quantity: Amcor Operations
Amcor tracks its waste generated at its facilities and disposed of via several treatment
routes. We considered the quantity of waste generated at Amcor’s plants and treated via
landfilling and incineration in this assessment.
Quantity: Downstream
Post-consumer waste impacts depend on the treatment route of plastic after its use.106
Mismanaged waste results in different impacts than managed waste.107 We considered
landfilling, incineration, recycling, land litter, and ocean litter waste end-of-life routes in our
assessment. We estimated regional end-of-life treatment route percentages using post-
consumer waste treatment percentages by country (sources included in appendices), World
Bank data,108 and data from academic studies on plastic waste.109
Municipal solid waste per country per year was estimated based on waste generation
per capita. The quantity of plastic waste produced per country per year was then estimated
based on percent plastic in waste stream data per country. We then calculated the amount of
mismanaged and littered plastic waste using inadequately managed waste and littered waste
percentages by country from scientific literature.110 These numbers represent the total
quantity of waste littered or that results in unintentional litter. Estimates of the quantity of
waste entering the ocean per country was obtained from literature values.111 Final littered
plastic waste on land was quantified by subtracting the amount of waste entering the ocean
from the total quantity of inadequately managed waste. The remaining quantity of plastic
waste that is actually treated was calculated by subtracting ocean and land litter quantities
from the overall plastic waste production estimate. Municipal solid waste treatment
percentages by country were then applied to the actual quantity of plastic waste treated
estimate to determine the estimated quantity of plastic waste via treatment route. These
quantities were then divided by the original estimate of total amount of plastic waste
produced per country to determine the percentage of waste treated by each end-of-life
treatment route per country. Using these country percentages, the average percent of plastic
waste treated via incineration, landfilling, and recycling, and the percentage of plastic waste
that results as land and ocean litter were derived at country, regional and global levels.
Amcor’s total production quantity by country was calculated using internal Amcor
data. Regional waste treatment percentages by treatment route were then applied to Amcor’s
28
total production by country, depending on what global region that country is in (i.e. North
America, Latin America, Europe, Asia, Oceania, and Africa). This conversion derives an
estimate of the amount of Amcor’s product by treatment route post-consumer. We chose to
use regional average waste treatment percentages as opposed to country specific or global
averages, because we were able to account for a high percentage (~90%) of total waste
treatment, while maintaining some level of specificity by assuming that Amcor’s products
are consumed and treated in the same region in which they are produced. In contrast, country
specific waste treatment percentages were only able to account for the treatment of 80% of
Amcor’s waste. The quantities we estimated via treatment route are likely not 100% accurate.
However, the methodology does provide accurate insight into the scale of downstream
impacts.
The next step consists of quantifying the emissions, water use, and/or other impacts
associated with waste treatment. We used plastic disposal unit process LCA metrics from the
Ecoinvent database112 as conversion factors to calculate the amount of GHG emissions and
water used when treating a plastic waste mixture via landfilling and incineration. Therefore,
the amount of emissions and water used for the treatment of those waste quantities were
calculated using those conversion factors. These conversion factors are presented in the
CO2E and Water sections discussed above. Emissions and water use for recycled waste were
both assumed to be zero. Thus, recycled waste is not considered to have a natural capital
impact in this assessment. Land and ocean litter are not processed; the cost of land and ocean
litter can be estimated directly, so a conversion to GHG emissions and water use are not
necessary. The dollar value impact associated with litter and ocean waste are further
discussed below.
Pricing
The pricing methodologies discussed above for GHG and water use were also applied
to GHG emissions and water use for post-consumer waste.
The cost of litter and ocean waste impacts were estimated using literature values.
Impacts of litter are based on average disamenity costs from studies.113,114,115,116,117,118 Ocean
waste impacts are based on estimates of economic impacts of waste in the ocean, specifically
on fisheries, tourism, and cleanup costs.119 The final values used were $10.66/tonne for litter
and $252.85/tonne for ocean waste.
29
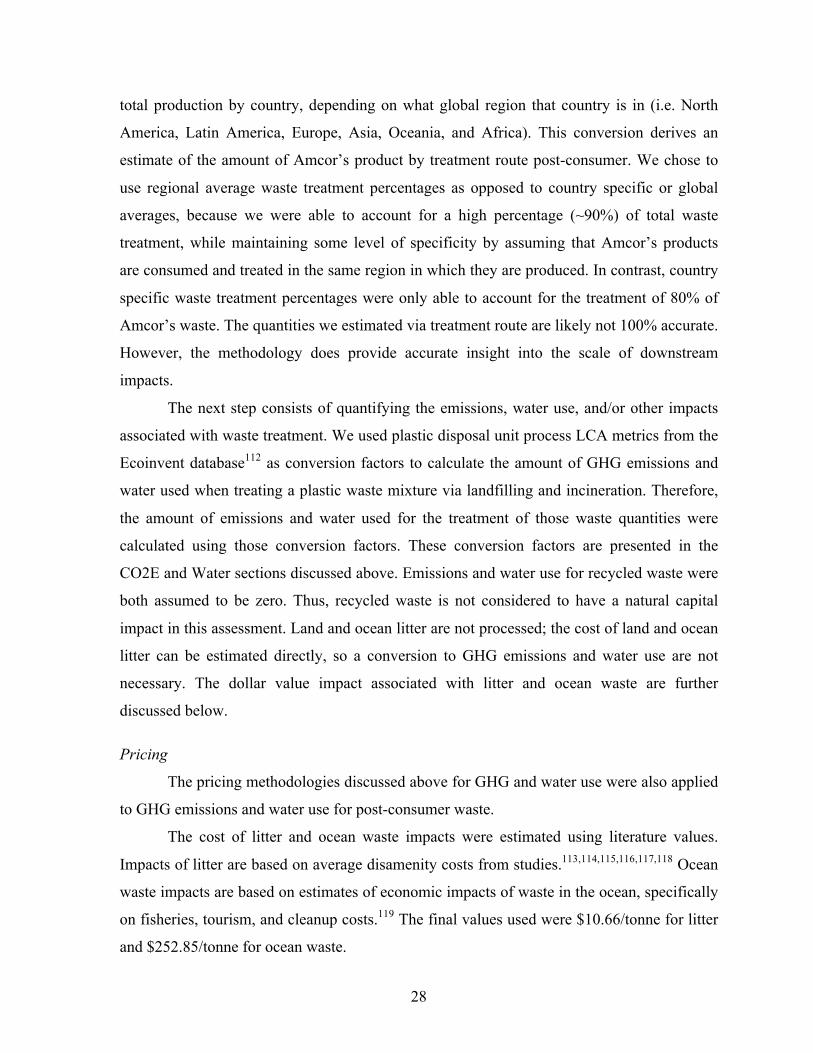
Results and Implications Amcor’s total natural capital valuation is $63,898,196, which is the sum of each
impact category for each portion of the supply chain (Table 7). The majority of Amcor’s
natural capital impacts occur outside of its facilities. Upstream GHG emissions constitute the
largest impact, and downstream mismanaged waste constitute the second largest impact.
Water impacts are minimal when compared to the other EKPIs.
Table 7: Total Amcor Natural Capital Valuation EKPI Upstream Amcor Downstream
GHG $45,289,044.41 $1,555,185.81 $3,219,445.71
H20 $2,852,828.12 $41,350.10 $3,292.96
Waste $- $- $10,936,412.02
Figure 2: Total Costs Across Supply Chain by Segment
The total natural capital valuation and breakdown by supply chain segment show that
upstream impacts are much larger than either Amcor operations or downstream impacts.
$-
$5,000,000.00
$10,000,000.00
$15,000,000.00
$20,000,000.00
$25,000,000.00
$30,000,000.00
$35,000,000.00
$40,000,000.00
$45,000,000.00
$50,000,000.00
Upstream Amcor Downstream
TotalCostsAcrossSupplyChainbySegment
GHG H20 Waste

30
Figure 3: Percent Impact Across Supply Chain by Segment
GHG emissions make up the majority of the impacts for both upstream and Amcor
operations. Mismanaged waste, specifically ocean litter, makes up the biggest percent impact
for downstream.
Figure 4: CO2E Cost Across Supply Chain by Segment and Region
One important detail to note on Figure 4 is that the y-axis is a logarithmic scale, so
each line represents an order of magnitude, or 10 times, increase. Generally, upstream CO2E
0%
10%
20%
30%
40%
50%
60%
70%
80%
90%
100%
Upstream Amcor Downstream
PercentImpactAcrossSupplyChainBySegment
GHG H20 Waste
$1.00
$10.00
$100.00
$1,000.00
$10,000.00
$100,000.00
$1,000,000.00
$10,000,000.00
AFRICA ASIA EUROPE LATINAMERICA NORTHAMERICA
OCEANIA
CO2ECostAcrossSupplyChainbySegmentandRegion
Upstream Amcor Downstream

31
impacts are significantly larger than Amcor and downstream impacts, with costs in the tens
of thousands to tens of millions as opposed to thousands to hundreds of thousands.
Figure 5: Total Aggregate CO2E Costs Across Supply Chain by Region
Figures 4 and 5 show that costs are not distributed equally by region. The values are a
function of how countries price CO2E emissions. Some countries, like Morocco and some
countries in Latin America have no pricing mechanism, so costs are not accounted for.
Figure 6: Water Cost Across Supply Chain by Segment and Region
AFRICA
0%ASIA
5%
EUROPE
36%
LATINAMERICA
1%
NORTHAMERICA
57%
OCEANIA
1%
TotalAggregateCO2ECostsAcrossSupplyChainbyRegion
$1.00
$10.00
$100.00
$1,000.00
$10,000.00
$100,000.00
$1,000,000.00
$10,000,000.00
AFRICA ASIA EUROPE LATINAMERICA NORTHAMERICA
OCEANIA
WaterCostAcrossSupplyChainbySegmentandRegion
Upstream Amcor Downstream

32
Water costs show a consistent trend across regions, with upstream impacts
comprising the largest impacts, Amcor water use the second largest impacts, and downstream
impacts the third largest. Similar to the CO2E graph, the y-axis scale is also logarithmic.
Downstream water use impacts are in the region of tens to hundreds of dollars, Amcor water
use impacts are in the thousands to tens of thousands of dollars, and upstream impacts are in
the hundreds to millions of dollars.

33
Figure 7: Total Water Costs and Quantities by Country At Amcor Plants
0
200000
400000
600000
800000
1000000
1200000
1400000
1600000
1800000
$0
$2,000
$4,000
$6,000
$8,000
$10,000
$12,000Argentina
Australia
Belgium
Brazil
Canada
Chile
China
Colombia
CzechRe
public
Denm
ark
DominicanRep
ublic
Ecuado
rElSa
lvador
Finland
France
Germ
any
India
Indo
nesia
Ireland
Italy
Mexico
Morocco
New
Zealand
Peru
Poland
Portugal
PuertoRico
Russia
Singapore
Spain
Switzerland
Thailand
Trinidadan
dTo
bago
Turkey UK USA
Vene
zuela
WaterQuantity
Used(m
3)
WaterNaturalCapita
lCosts($
)
TotalWaterCostsandQuantitiesByCountryatAmcorPlants TotalAmcorImpact
PlantWaterUse
34
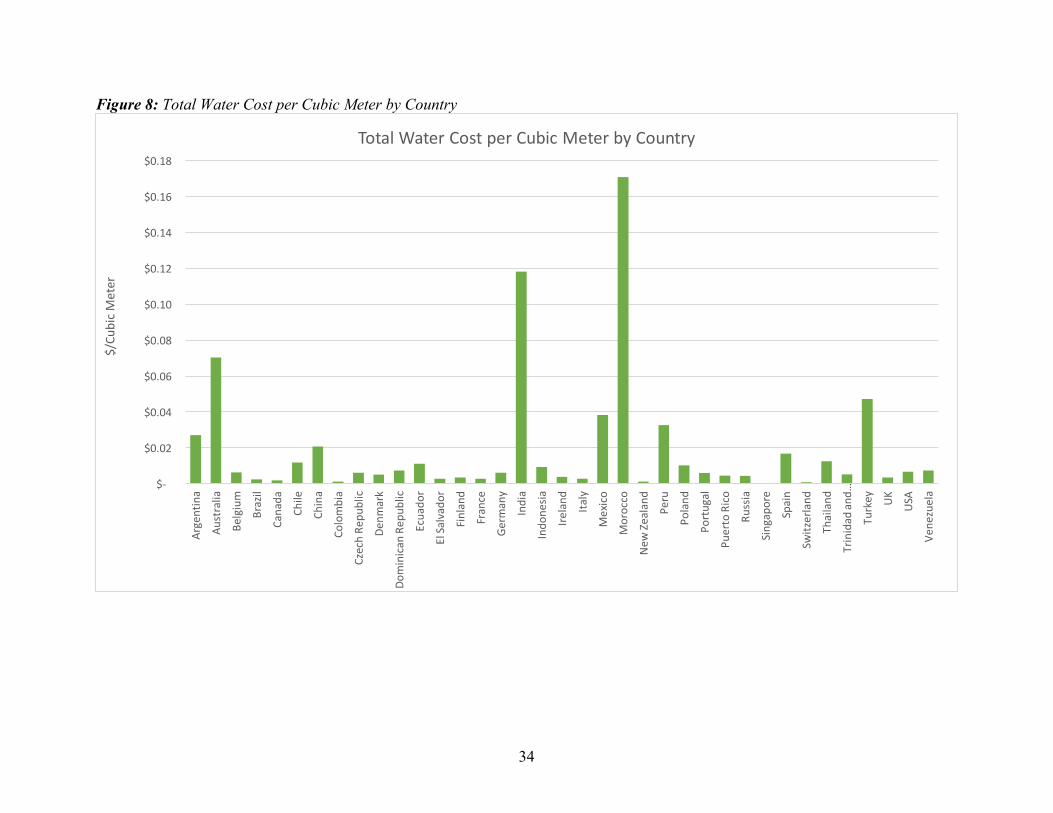
Figure 8: Total Water Cost per Cubic Meter by Country
$-
$0.02
$0.04
$0.06
$0.08
$0.10
$0.12
$0.14
$0.16
$0.18
Argentina
Australia
Belgium
Brazil
Canada
Chile
China
Colombia
CzechRe
public
Denm
ark
DominicanRep
ublic
Ecuado
r
ElSa
lvador
Finland
France
Germ
any
India
Indo
nesia
Ireland
Italy
Mexico
Morocco
New
Zealand
Peru
Poland
Portugal
PuertoRico
Russia
Singapore
Spain
Switzerland
Thailand
Trinidadan
d…
Turkey UK USA
Vene
zuela
$/Cu
bicMeter
TotalWaterCostperCubicMeterbyCountry

35
Water quantity use does not necessarily correlate with the natural capital cost of water
use. The natural capital cost of water use is a function of water scarcity, so plants that are
located in countries that have larger areas of greater water scarcity, such as Australia, China,
India, Morocco, Peru, and Turkey, have high natural capital costs due to water use relative to
the absolute quantity of water used. The USA has both the highest quantity of water use and
natural capital costs, but the costs in the USA are a function of the amount of water used.
Figure 9: Waste Costs by Region
Figure 10: Post-Consumer Waste Costs by Region
$-$500,000.00
$1,000,000.00$1,500,000.00$2,000,000.00$2,500,000.00$3,000,000.00$3,500,000.00$4,000,000.00$4,500,000.00
AFRICA ASIA EUROPE LATINAMERICA NORTHAMERICA
OCEANIA
WasteCostsbyRegion
Ocean Litter GHGs WaterUse
$-$500,000.00
$1,000,000.00$1,500,000.00$2,000,000.00$2,500,000.00$3,000,000.00$3,500,000.00$4,000,000.00$4,500,000.00
AFRICA ASIA EUROPE LATINAMERICA NORTHAMERICA
OCEANIA
Post-ConsumerWasteCostsbyRegion
Ocean Litter GHGsfromPCW WaterUsefromPCW

36
Figure 11: Post-Consumer Waste Costs by Region
AFRICA1%
ASIA34%
EUROPE9%
LATINAMERICA32%
NORTHAMERICA9%
OCEANIA15%
Post-ConsumerWasteCostsbyRegion
AFRICA ASIA EUROPE LATINAMERICA NORTHAMERICA OCEANIA

37
Figure 12: Post-Consumer Waste Costs by Country
$-
$500,000.00
$1,000,000.00
$1,500,000.00
$2,000,000.00
$2,500,000.00
$3,000,000.00
Argentina
Australia
Belgium
Brazil
Canada
Chile
China
Colombia
CzechRe
public
Denm
ark
DominicanRep
ublic
Ecuado
rElSa
lvador
Finland
France
Germ
any
India
Indo
nesia
Ireland
Italy
Mexico
Morocco
New
Zealand
Peru
Poland
Portugal
PuertoRico
Russia
Singapore
Spain
Switzerland
Thailand
Trinidadan
dTo
bago
Turkey UK USA
Vene
zuela
Post-ConsumerWasteCostsbyCountry
OceanCost LitterCost GHGCost WaterCost
38
Downstream impacts from waste, specifically mismanaged waste, constitute the
second largest impact associated with Amcor’s business operations. These costs are not
distributed evenly across business groups or global regions. North America generates
significantly more GHG emissions from waste treatment than any other region. This is due to
the fact that this region has the highest quantity of post-consumer waste treated via
landfilling and incineration. Asia and Latin America have higher ocean waste and litter costs
than the other business groups, driven by mismanaged waste. Most of the waste impacts in
Oceania occur from mismanaged waste, while about half of the impacts from waste
generated in Europe stem from mismanaged waste, and the other half from GHG emissions.
However, the USA still has large post-consumer waste costs, particularly because of GHG
emissions due to the volume of waste produced in the USA.
Generally, trends in costs across EKPIs vary by region; different regions incur natural
capital costs in different areas. For example, Asia, Latin America, and Oceania have the
highest waste costs, while Europe and North America have higher CO2E costs. This trend is
because Asia, Latin America, and Oceania tend to not price CO2E emissions and mismanage
waste, while North America and Europe have better waste management and have more
CO2E pricing mechanisms.
Recommendations and Conclusions Our results validate Amcor’s current practices of targeting upstream and downstream
portions of its supply chain for sustainability initiatives. Therefore, pursuing both sustainable
material sourcing and waste recovery are logical initiatives to continue pursuing. The natural
capital valuation can offer several additional opportunities and next steps.
The natural capital costs we present are undervalued overall for several reasons. For
example, we did not consider additional impacts that could have been valued, such as land
use and biodiversity loss, or water, land, and air pollution. However, based on other natural
capital valuations prepared for the plastics product industry, the majority of these impacts are
believed be insignificant. Based on those reports, the EKPIs that we valued constitute ~70%
of natural capital impacts associated with the plastic industry as a whole.120,121
Natural capital costs create a proxy for risk of operating at a country and regional
level. Because the value represents profit at risk, the costs can be factored into strategic
39
planning decisions, like where and how to expand operations. Many countries have already
integrated GHG taxes and/or emissions trading schemes, and many more are planning to
implement GHG pricing mechanisms in the future. Therefore, some of these costs will likely
be inevitable in the long term. Increased water scarcity may lead to increased operating costs
and stranded assets, making investments in water scarce regions more risky.
The values presented in this report serve as baseline metrics to track circular economy
initiatives. If natural capital costs are taken into account, post-consumer resin can be viewed
equally if not more economically viable than virgin resin. With circular economy practices
that increase the use of post-consumer resin and decrease the use of virgin resin production,
we would expect to see both downstream waste and upstream GHG and water costs decrease.
We also recommend that Amcor evaluate whether internal carbon pricing initiatives
make sense for its business. Carbon prices can be used to drive emission reduction goals by
first setting those goals, and then back-calculating a carbon price that ensures that goal is met
by the target date. Other companies use existing policies in place in the countries in which
they operate to better understand how emissions reductions translate directly to reduced
operating costs. Other companies, like Microsoft, charge its business units a standard flat fee
on emissions, and use the resulting fund to subsidize energy efficiency or carbon offset
projects.122
Natural capital impacts can also be incorporated into existing LCA methodology,
which can translate into simplified comparison and communication of the benefits of
choosing one product over another. This practice has potential to lead to sales advantages if
customers can better understand what differentiates one product over another.
Downstream impacts are undervalued because we were not able to quantify
ecosystem impacts associated with marine debris. The current data on these impacts is
limited, and additional research is needed to quantify ecosystem service values that would
allow linking plastic impacts, such as animal entanglement, plastic digestion, or the leaching
of chemical additives, to a dollar value impact.123 Therefore, additional next steps can include
following trends in this research.
Even though the results are undervalued, the post-consumer waste impacts constitute
the second highest cost in our impact categories. It is therefore important to understand how
Amcor can mitigate this. The Post-Consumer Waste Chapter of this paper outlines actions

40
that can be taken in this area. Additionally, since estimates of post-consumer waste impacts
rely on the weight of waste disposed of by country/region and treatment route, Amcor may
want to begin tracking the weight of all products sold by division in order to more accurately
understand where products are used and ultimately disposed.
41
Chapter 2: Post-Consumer Waste
Introduction As established in the previous chapter, post-consumer waste makes up a significant
component of Amcor’s natural capital costs. As Amcor strives to be a responsible producer
of plastic packaging, it is important to understand the state of plastic packaging recovery in
order to understand the impact of Amcor’s footprint. This chapter focuses on our evaluation
of end-of-life options in the regions in which Amcor operates, as well as uncover which
variables have the most significant impact on plastic recovery.
This part of the project initially aimed to focus on end-of-life options for flexible
plastic packaging. While glass, aluminum, and rigid plastics have traditionally dominated
packaging in the consumer products space, flexible plastic packaging is growing in use,
particularly over the last decade.124 However, there are post-consumer waste concerns as
there are currently very few options other than landfilling or incineration for consumers to
dispose of this type of packaging after use. With increasing interest in product circularity and
alarming reports on the amount of plastic in our oceans,125 there is pressure to find a more
sustainable solution for post-consumer flexible plastic packaging waste.
After researching into this topic, the team found that information on recycling efforts
for flexible plastic packaging is extremely limited, since recovery considerations are still
nascent. This report includes research findings on the difficulties in recycling flexible plastic
packaging, as well as an analysis on general plastic recovery rates. With varying rates of
plastic recovery across countries, along with varying levels of reported recovery information,
the team focused on understanding the state of plastic recovery rates in the areas in which
Amcor operates. The team created a model to evaluate the key factors that impact recovery
rates in a country, with the intention that the research would be relevant for flexible plastic
packaging as the recovery movement for that material grows.
42
Literature Review
Environmental Tradeoffs of Flexible Plastic Packaging
Flexible plastic packaging is made up of multiple layers of mixed-material plastic
films, such as polyethylene (PE), polypropylene (PP), nylon, aluminum, and film laminates,
and often takes the form of pouches or sachets. Everyday items such as nuts, sugars, tuna
fish, frozen meat or vegetables, and pet food that used to be sold in jars or cans can now be
found in flexible packages. As of 2015, flexible packaging had become the second largest
packaging segment in the US, representing 19% of the $164 billion US packaging market.126
Demand for this type of packaging is projected to increase 3.3% annually through 2019.127
Flexible plastic packaging is appealing because it is durable, can be put into different
innovative forms, can be transparent so consumers can see the products, and is often re-
sealable so product freshness is maintained.128 Another often touted benefit of flexible plastic
packaging is that it has a lower environmental impact compared to other types of packaging
in several areas such as requiring less material to create and fewer greenhouse gas emissions
to transport.
Compared to traditional packaging such as glass, aluminum or rigid plastic, flexible
plastic packaging is more lightweight, uses less material, and emits fewer greenhouse
gases.129 Because of this, flexible plastic packaging often comes out ahead compared to other
types of traditional packaging in lifecycle assessments.130 For example, the Flexible
Packaging Association cites a study that found that, for equal amounts of pasta sauce, 26
truckloads of unfilled glass jars would be needed versus just one truckload of unfilled
flexible pouches.131
Despite the benefits of flexible plastic packaging, a significant tradeoff occurs at the
end-of-use phase. There currently are very few options to recycle flexible plastic packaging,
which the large majority of this waste flowing into landfills or litter. The reason for this are
manifold: flexible plastic packaging is extremely difficult to recycle due to their multi-layer
structure; the incentive to create infrastructure to handle this material is weak because of the
complexity of the material, lack of market demand, and low volume; and lack of consumer
access.132

43
Flexible Plastic Packaging Post-Consumer Waste Challenges
While recycling rates for rigid plastics, namely PET bottles, have been maintained at
relatively high levels, flexible plastic products continue to present a variety of issues for
material recovery facilities (MRF) and the recycling ecosystem as a whole. One of the
primary issues are MRFs’ inability to effectively sort flexible plastic into a reusable product.
This process is usually time-, energy-, and money-intensive as flexible products contain
multiple layers of different forms of plastic that need to be separated during the recycling
process. Even if these layers are separated, flexible plastic often ends up sorted with paper
products due to its weight (and the fact that flexible packaging often contains paper
components). One study conducted by the Materials Recovery for the Future initiative found
that 88% of all flexible packaging tested sorted with paper.133
Flexible plastic products also frequently fall victim to contamination during the
recycling process. Many of these products are used for food packaging and are not properly
cleaned by consumers before entering the recycling stream. This contamination makes it
more difficult to sell recycled flexible plastic in end markets. As a result, the current state of
MRF infrastructure does not have the capabilities to process flexible plastic in a high-
volume, cost-effective manner.
In the event that MRFs were able to process flexible plastic (through technological
advancements and capital investment), there would still be issues related to volume.
Recycled products need sufficient end-markets in order to justify the cost of collection and
processing them in the first place. As a result, high volumes of these products are often
needed to achieve economies of scale and profitable margins. Flexible plastic has a very low
weight-to-volume ratio than products that are traditionally recycled (e.g. rigid plastic, paper,
glass, aluminum). For example, flexible plastic packaging accounted for only 1.6% of the
total municipal waste stream as of 2012.134 This makes it less economically viable to invest
in collection and sorting infrastructure needed to efficiently recycle flexible packaging.135
Another aspect of infrastructure that poses problems for flexible plastic is consumer
access. The majority of communities in the United States do not allow for the recycling of
flexible plastic. This, in part, is due to the fact that MRF infrastructure is currently unable to
process these materials. Furthermore, those that do allow the recycling of flexibles often lack
44
sufficient education and resources to enable the average consumer to recycle flexibles
properly (e.g. reducing the potential for contamination).
Attention towards the issue of flexible plastic packaging is likely to increase, as
policies and consumer awareness of the issue grow. One policy that has enjoyed some
success, both with flexibles as well as other materials, has been Extended Producer
Responsibility (EPR). EPR encourages, and in some cases requires, producers to integrate
environmental costs of their goods throughout their life cycles, and more specifically
emphasizes the need to design-for-recycling. Countries and regions that have implemented
EPR policies have generally resulted in higher collection and recycling rates, reduced public
expenditures on waste management, and reduction in overall waste management costs.136
Policies such as these may provide motivation for companies and interest groups to find a
more sustainable solution for flexible plastic packaging end-of-life.
Consumer sentiment is also a driver to find a solution for flexible waste end-of-life,
as consumers may be demand solutions or alternatives so their packaging can be recovered
and used for other purposes, rather than languish in landfills or pollute the environment.
According to Rokka, J. and Uusitalo, L., there are four distinct preference clusters for
packaging: green consumers, price sensitive, brand loyal, convenience seeking.137 With
green-packaging consumers consisting of 33 percent of the market, it is worthwhile for
marketers to craft their products to appeal to this environmentally sensitive consumer base.138
Companies have been feeling some of this pressure from consumers and are responding. For
example, Procter and Gamble is pledging to make 90 percent of its packaging recyclable by
2020.139 For packaging producers, while consumer preference to increase their plastic
packaging recycling may be increasing, without improved formal collection and
infrastructure globally (i.e. recovered plastic packaging supply) and large scale organizations
buying this recovered plastic packaging (i.e. recovered plastic packaging demand), this
consumer interest and increased willingness to pay140 will not bear much weight in improved
sustainability of plastic packaging materials, designs, and uses.
Methodology To investigate the flexible plastic packaging recovery rate, the team underwent two
phases of analysis as outlined below.

45
Phase I: Research into Flexible Plastic Packaging
The team originally sought to collect the flexible plastic packaging recycling rates in
the countries in which Amcor operates. Research was conducted online and through the
University of Michigan library system. However, we soon found that this data was extremely
difficult to collect and seemed nonexistent. The team assumed that the difficulty was related
to the issues that we outlined above. With flexible plastic packaging recovery still very
nascent, metrics are severely limited.
An additional part of this phase was to conduct primary interviews with industry
experts at the following companies which, like Amcor, are also engaged in plastic recovery:
AluFoil, American Chemistry Council, Dow, Ellen MacArthur Foundation, Ocean
Conservancy, and Procter & Gamble. Key insights from experts contacted are included
below, as they helped shape the next phase of our methodology:
• Because flexible packaging is such a new and fast-growing packaging segment,
there is significantly less data publically available. This can be seen in how, for
example, the US Environmental Protection Agency does not track this kind of
packaging yet in their sustainable materials packaging report.141 The American
Chemistry Council tracks on annual basis the reclamation of polyethylene film
and bags in the United States and Canada.
• The lack of a demand for flexible plastic packaging also impacts the creation of
a solution to this post-consumer waste issue. There are currently no large-scale
companies with contracts to purchase this recovered and reclaimed flexible
packaging, so governments and organizations are doing little to invest the time
and money to sort this material.142 A Trucost report,143 sponsored by Dow
Chemical and the American Chemistry Council, analyzed the environmental
cost of plastic packaging use and the risk of switching to alternatives. The
report, though, was not able to collect or predict data at a country or city level,
instead using regional or global data. While a good tool to understand why our
project and Amcor’s involvement in pushing the boundaries of sustainability is
so important, it was not able to provide us with the data points we needed.144
46
• One of the reasons for the lack of data on flexible plastic packaging recovery is
that the amount of manual work required for organizations to ascertain this rate
has been a large deterrent to date.145 Gathering material recovery data for
countries around the world is a difficult process. The Ellen MacArthur
Foundation admits that data on the plastic packaging category in general has
been difficult for them to find, even though they have spent an extensive amount
of timing researching plastic packaging and its role in the environmental and
economic ecosystem.146 Beyond the United States, it has been incredibly
difficult for them to collect recovery, infrastructure, or collection rate data
globally.147 For non-US locations, the Foundation has made very rough
estimates on recovery metrics after looking at general waste treatment, including
how much of waste is landfilled, incineration rates, overall municipal waste
recycling efforts, and share of general waste that is plastics.
• The extent to which recycling and recovery data differs significantly by country
and needs to be considered in the analysis. Some countries have very little
infrastructure in place for collection; other countries have as many as seven bins
for consumers to choose from when making item discard decisions.148 Many
countries simply do not have the formal infrastructure to collect anything
beyond PET bottles.149
• A reason why reliable recovery data can be difficult to come across is that many
developing countries have federal or private infrastructure that is lacking, but
have an informal sector that represents a large portion of waste collection
activities. Informal workers, also called waste pickers, often times provide the
sole source of waste collection, and collect recyclable items for direct reuse or
providing them as inputs to be transformed in exchange for money. Waste
pickers are an important and often unrealized element of measuring post-
consumer waste in developing countries. Given the presence of this informal
sector in many countries, and its centralization in urban areas, the Ocean
Conservancy recommended inclusion of urban demographic, behavior,

47
collection, and recycling data in a post-consumer waste recovery rate model, as
key predictors.150
• While information on flexible plastic packaging is hard to come by, a helpful
tool that can be provided for a large global plastic packaging manufacturer such
as Amcor is an overview of the state of waste and plastic packaging affairs in
each country that they operate in. Tracking the source of this information will
allow Amcor to continually update their understanding of the flexible packaging
landscape, how recovery efforts are improving, and where to involve themselves
to make the most impactful change.151
After conversations with the industry experts and Amcor, the team decided to focus
on overall plastic recovery rates, which are assumed to be comprised mostly of rigid plastic.
With a longer time in the market, awareness and recovery infrastructure of traditional plastic
are higher, resulting in greater availability and accuracy of data. The intention was then to
understand which variables have the most impact in plastic recycling rates, and use that
information to predict advancements in flexible plastic packaging recycling rates.
Phase II: Regression Model to Determine Plastic Recovery Rates
The team sought to find the plastic recovery rate for the countries in which Amcor
operates, with the intention to extrapolate findings to flexible plastic packaging recovery
rates. While recovery data for some countries was relatively easy to find due to a
governmental database (i.e., Eurostat), this information was more difficult to come by for
many countries in South America and Asia. In order for Amcor to estimate the plastic
recovery rates for the countries in which data was not available, the team decided to create a
regression model that could predict the range of plastic recovery rates for a specific country
after inputting key independent variables. The model would identify the most important
factors in determining plastic recovery rates by country, which Amcor could then input and
then see the calculated recovery rate. Additionally, the variables that turn out to be most
impactful on recovery rates could be used to inform the areas to focus on for flexible plastic
packaging recovery efforts.

48
Country Selection
The team focused on collecting information on the 30 countries below. These
countries were chosen because they are either countries in which Amcor operates and there
was plastic recovery or recycling data available, or they are countries with available data in
the same region as ones in which Amcor operates in and have this type of information
available even though they are not countries in which Amcor operates in.
Table 8: Countries in Regression Model
Americas Asia Europe
Argentina
Brazil
Canada
Chile
Colombia
Costa Rica*
Mexico
United States
China
Japan*
Indonesia
India
South Korea*
Thailand
Belgium
Czech Republic
Denmark
Finland
France
Germany
Ireland
Italy
Netherlands
Poland
Portugal
Russia
Spain
Switzerland
Turkey
United Kingdom
* denotes country in which Amcor does not have manufacturing operations
Variable Selection
From our literature review and primary interviews, the team identified 17 variables
that influence plastic recovery efforts. The independent variables are displayed below, under
four main categories:

49
Table 9: Independent Variables in Regression Model Municipal Solid
Waste Waste
Infrastructure Demographics Human
Development
● Total municipal solid waste (tonnes)
● Overall recycling rate (%)
● Percent of waste to landfill (%)
● Percent of waste incinerated (%)
● Plastic waste as a percent of total municipal solid waste (%)
● Number of waste pickers
● Presence of waste pickers (yes/no binary)
● Policy (presence of extended producer responsibility requirements)
● Total population ● Urban population ● Population
density (persons/sqkm)
● Land area (sqkm)
● Human Development Index
● Education Index
● Life Expectancy
● Gross domestic product (GDP) per capita
● GINI Index
Municipal Solid Waste: The variables selected under this category capture the
recovery (recycling and incineration) of a country. The metrics include the total amount of
municipal solid waste that is produced and the percent of the total waste that is comprised of
plastic waste. In addition, the team examined the overall recycling rate, the percent of waste
of landfill, and the percent of waste that is being incinerated.
Waste Infrastructure: Countries vary in their degree of sophistication in their waste
infrastructure and waste recovery policy. To capture this variance, the team used metrics
around waste pickers, both the estimated number of waste pickers (based on guidance from
the Ocean Conservancy that in developing nations, about 1% of a country’s urban population
are waste pickers.) and the presence of waste pickers. The presence of extended producer
responsibility requirements was used to represent waste recovery policy.
Demographics: Overall population and land area metrics were examined to see how
population size, density, and land area size impact plastic recovery rates. These metrics
include a country’s total population, its urban population, population density, and land area.
Human Development: The team also wanted to assess the level of a country’s human
development and its potential impact on plastic recovery. The team used the Human
Development Index, which is published by the United Nations Development Programme.
This index calculates human development per country by taking into account life expectancy
at birth, education through both expected and average years of schooling, and the standard of
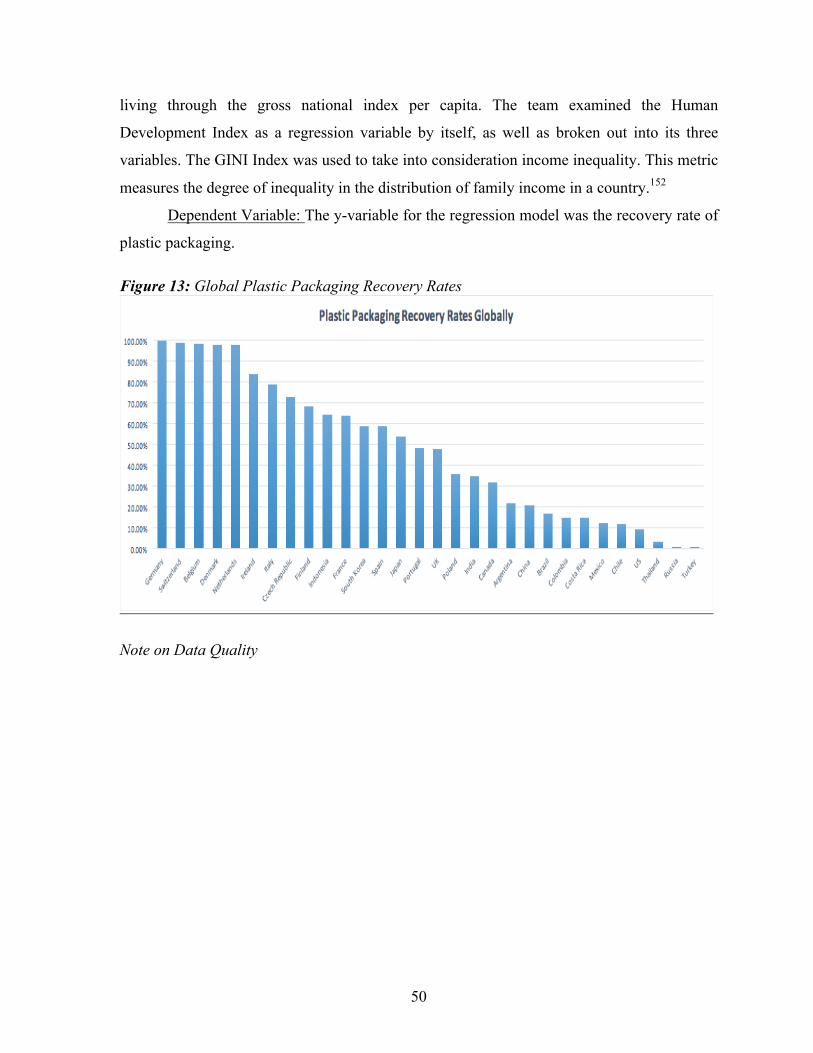
50
living through the gross national index per capita. The team examined the Human
Development Index as a regression variable by itself, as well as broken out into its three
variables. The GINI Index was used to take into consideration income inequality. This metric
measures the degree of inequality in the distribution of family income in a country.152
Dependent Variable: The y-variable for the regression model was the recovery rate of
plastic packaging.
Figure 13: Global Plastic Packaging Recovery Rates
Note on Data Quality
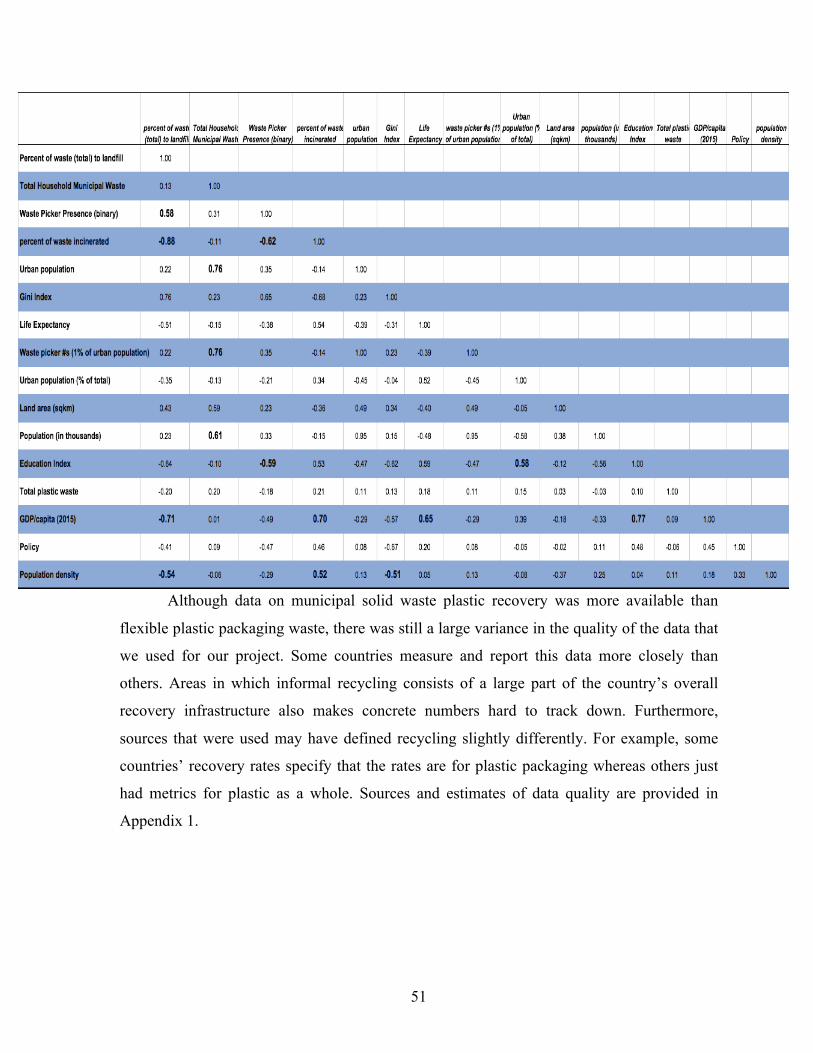
51
Although data on municipal solid waste plastic recovery was more available than
flexible plastic packaging waste, there was still a large variance in the quality of the data that
we used for our project. Some countries measure and report this data more closely than
others. Areas in which informal recycling consists of a large part of the country’s overall
recovery infrastructure also makes concrete numbers hard to track down. Furthermore,
sources that were used may have defined recycling slightly differently. For example, some
countries’ recovery rates specify that the rates are for plastic packaging whereas others just
had metrics for plastic as a whole. Sources and estimates of data quality are provided in
Appendix 1.

52
Model Selection
Regression Model Variations
Multiple models were tested to discover which variables were most significant. First a
correlation test was conducted between all independent variables, to get a better
understanding of how each variable relates, and how to interpret various model results.
Figure 14: Variable Correlations
Through this we were able to see that percent of waste to landfill and percent of waste
incinerated have a strong negative correlation, due to their mutual exclusivity. Additionally,
though, percent of waste to landfill is also negatively correlated to GDP per capita and
population density. These correlations provide interesting insight into the relationship
between the density of populations an improvement in infrastructure and formal and informal
collection are necessary to maintain living standards. Total household municipal waste is
strongly and positively correlated with percent of waste incinerated, which highlights the
struggle of space limitations and an effort to capture energy as waste continues to increase.
The presence of waste pickers is negatively correlated with Education Index, demonstrating
that waste pickers tend to have a larger presence in countries with a lower Human
Development Index. The GINI Index is negatively correlated with population density, which
indicates that as population density and urbanization increases, inequality decreases. The
GINI Index is an interesting variable to interpret, however. While most developed European
nations tend to have GINI coefficients between 0.24 and 0.36, developing countries have
GINI coefficients over a large range of 0.25 to 0.71.153154
Final Model
Figure 15: Final Model Summary
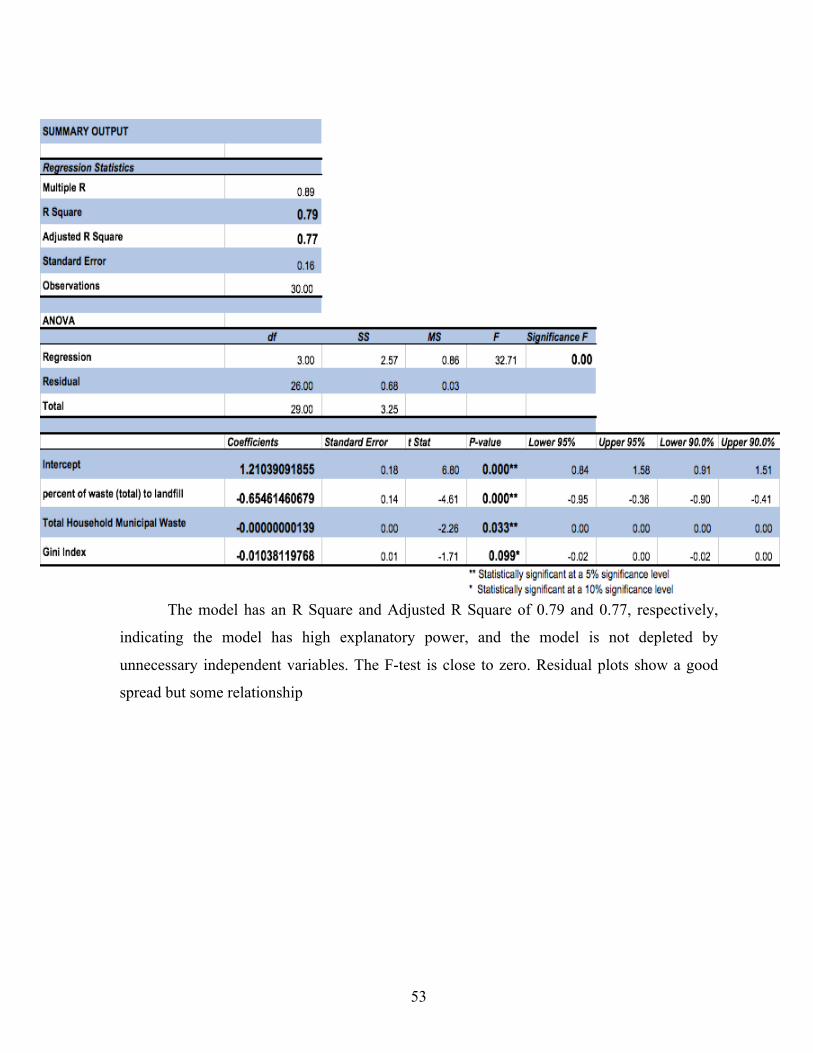
53
The model has an R Square and Adjusted R Square of 0.79 and 0.77, respectively,
indicating the model has high explanatory power, and the model is not depleted by
unnecessary independent variables. The F-test is close to zero. Residual plots show a good
spread but some relationship

54
Figure 16: GINI Index Residual Plot
Figure 17: Total Household Municipal Waste Residual Plot
-0.4
-0.3
-0.2
-0.1
0
0.1
0.2
0.3
0.4
0 5 10 15 20 25 30 35Resid
uals
GiniIndex
GiniIndexResidualPlot
-0.4-0.3-0.2-0.1
00.10.20.30.4
0 100,000,000 200,000,000 300,000,000Resid
uals
TotalHouseholdMunicipalWaste
TotalHouseholdMunicipalWasteResidualPlot
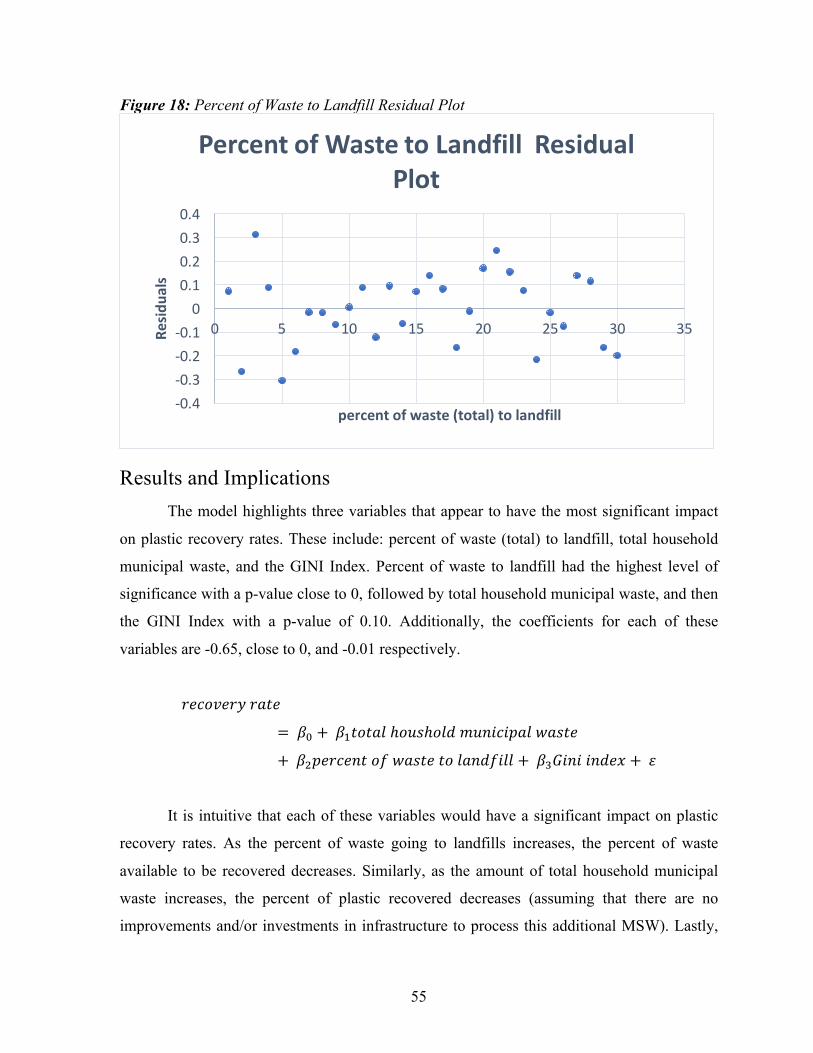
55
Figure 18: Percent of Waste to Landfill Residual Plot
Results and Implications The model highlights three variables that appear to have the most significant impact
on plastic recovery rates. These include: percent of waste (total) to landfill, total household
municipal waste, and the GINI Index. Percent of waste to landfill had the highest level of
significance with a p-value close to 0, followed by total household municipal waste, and then
the GINI Index with a p-value of 0.10. Additionally, the coefficients for each of these
variables are -0.65, close to 0, and -0.01 respectively.
!"#$%"!&!()"= +, ++.)$)(/ℎ$12ℎ$/34156#67(/8(2)"++97"!#"5)$:8(2)")$/(53:6// ++;<656653"= + >
It is intuitive that each of these variables would have a significant impact on plastic
recovery rates. As the percent of waste going to landfills increases, the percent of waste
available to be recovered decreases. Similarly, as the amount of total household municipal
waste increases, the percent of plastic recovered decreases (assuming that there are no
improvements and/or investments in infrastructure to process this additional MSW). Lastly,
-0.4-0.3-0.2-0.1
00.10.20.30.4
0 5 10 15 20 25 30 35Resid
uals
percentofwaste(total)tolandfill
PercentofWastetoLandfillResidualPlot
56
as wealth becomes more evenly distributed, as indicated by a higher GINI Index score, the
plastic recovery rate decreases.
There are multiple implications that can be drawn from this model that are relevant
for Amcor and other corporations attempting to influence the plastic recovery rate. It will be
useful for Amcor to keep these three variables in mind when developing projects and
partnerships in the future, as they are some of the most important levers for improving plastic
recovery rates. The model indicates that projects aimed at diverting more waste from landfills
as well as decreasing the total amount of municipal solid waste generated will have the most
significant impact on improving recovery rates. For example, partnering with local
municipalities to raise consumer awareness around recycling best practices could potentially
improve landfill diversion rates and in turn increase the plastic recovery rate.
Another important implication of this model is its replicability for flexible plastics.
As previously mentioned, data collection on flexible plastic recovery is in its nascent stage
and will likely take at least 2-3 years before sufficient data is available for analysis. Once
data becomes available, a similar methodology could be used to identify the most significant
variables affecting flexible recovery rates. Lastly, the model could be used to predict a range
of plastic recovery rates for countries where such data is not available. For example, the
model could predict a country’s plastic recovery rate if the percent of waste to landfill, total
household municipal waste, and GINI Index data were available. While this number would
not be 100% accurate, it would provide a benchmark estimate when no such plastic data is
available.
Recommendations and Conclusions In addition to Amcor, there are several other organizations actively involved in
finding solutions to the post-consumer flexible plastic packaging waste conundrum. Dow
Chemical is intensely involved in pushing the plastic packaging recovery envelope and
improving the supply of recovered products through investing in efforts to shift consumer
behavior towards recycling and improve the fundamental components that have restricted
plastic packaging recovery so far. The company has invested in new labels to grasp consumer
attention and make recycling rules more accessible, as well as conducted extensive resin

57
R&D to alter the very multilayer component that makes plastic packaging so technically
challenging to transform.155
In addition to the public policy, groups of private companies and nonprofits have also
developed EPR consortiums aimed at improving end-of-life management for specific
products. These groups generally command a large portion of the market share for each
product, and as a result have the influence necessary to shift the industry towards improved
recycling practices. One of the most successful examples of private sector-initiated EPR is
the Carton Council, which is a consortium of carton producers including Elopak, Evergreen
Packaging, SIG, and Tetrapak. Through efforts devoted to building infrastructure, improving
collection, and raising awareness, the group has been able to raise carton recycling rates from
approximately 18% in 2009 to over 60% in 2017.156 Similar groups have been formed for
other products that currently have low recycling rates. The Flexible Film Recycling Group
(FFRG), for example, is working to improve the collection and recycling of flexible films
through similar methods as the Carton Council. The FFRG has made advancements in terms
of both tracking and increasing the recovery of plastic bags and film. More specifically, the
volume of plastic bags and film recovered has increased 79% since 2005 to approximately
1.17 billion pounds.157 However, plastic bags and film make up a small percentage of the
total flexible packaging market and are not included in Amcor’s portfolio of products.
This project also highlighted the sheer difficulty in finding data on plastic recovery
rates. In order to make a meaningful impact on the packaging sustainability space, Amcor
should invest in a global, environmental ministry interview process to more accurately
understand flexible packaging recovery rates with both formal and informal collection. PET
is the only plastic that is followed through its entire lifecycle. Data collection mechanisms for
value added multi-layer products must be undertaken, globally, at the country and city level,
to truly understand the footprint. Also, investments must be made into global databases for
plastic packaging, with a particular focus on Asia and Latin America. Without accurate
reporting, improvement efforts cannot be measured and tracked.
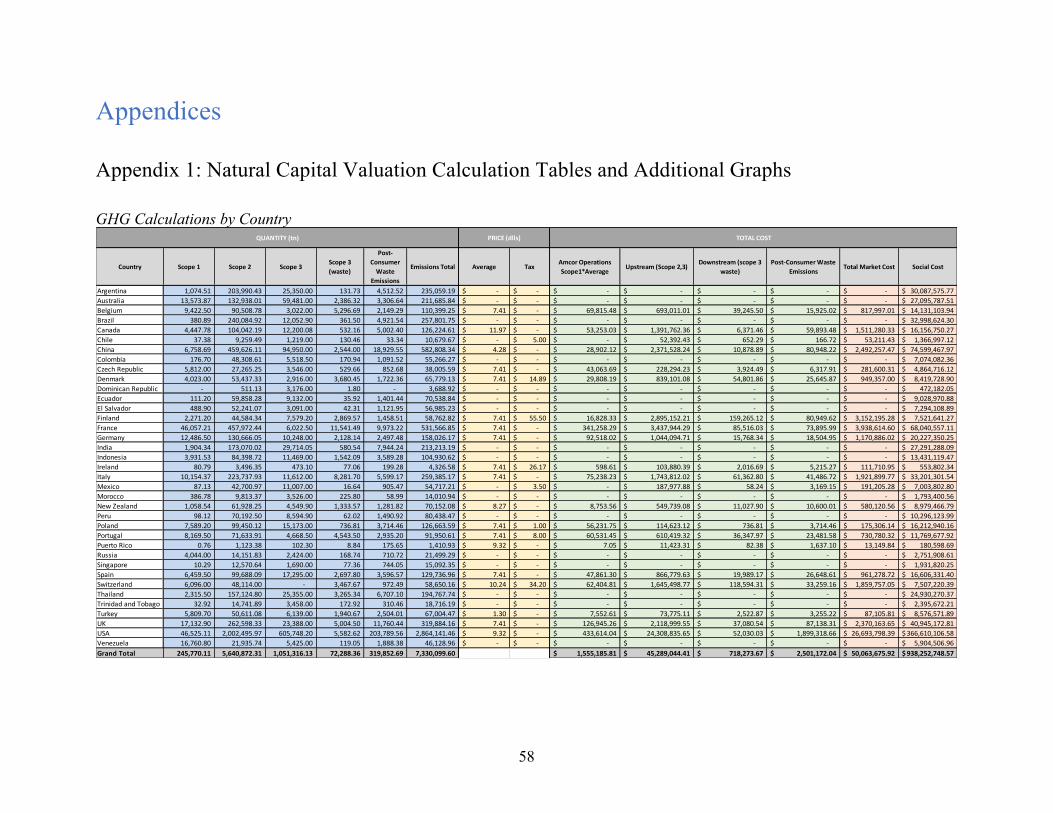
58
Appendices
Appendix 1: Natural Capital Valuation Calculation Tables and Additional Graphs
GHG Calculations by Country
Country Scope1 Scope2 Scope3Scope3(waste)
Post-ConsumerWaste
Emissions
EmissionsTotal Average TaxAmcorOperationsScope1*Average
Upstream(Scope2,3)Downstream(scope3
waste)Post-ConsumerWaste
EmissionsTotalMarketCost SocialCost
Argentina 1,074.51 203,990.43 25,350.00 131.73 4,512.52 235,059.19 -$ -$ -$ -$ -$ -$ -$ 30,087,575.77$Australia 13,573.87 132,938.01 59,481.00 2,386.32 3,306.64 211,685.84 -$ -$ -$ -$ -$ -$ -$ 27,095,787.51$Belgium 9,422.50 90,508.78 3,022.00 5,296.69 2,149.29 110,399.25 7.41$ -$ 69,815.48$ 693,011.01$ 39,245.50$ 15,925.02$ 817,997.01$ 14,131,103.94$Brazil 380.89 240,084.92 12,052.90 361.50 4,921.54 257,801.75 -$ -$ -$ -$ -$ -$ -$ 32,998,624.30$Canada 4,447.78 104,042.19 12,200.08 532.16 5,002.40 126,224.61 11.97$ -$ 53,253.03$ 1,391,762.36$ 6,371.46$ 59,893.48$ 1,511,280.33$ 16,156,750.27$Chile 37.38 9,259.49 1,219.00 130.46 33.34 10,679.67 -$ 5.00$ -$ 52,392.43$ 652.29$ 166.72$ 53,211.43$ 1,366,997.12$China 6,758.69 459,626.11 94,950.00 2,544.00 18,929.55 582,808.34 4.28$ -$ 28,902.12$ 2,371,528.24$ 10,878.89$ 80,948.22$ 2,492,257.47$ 74,599,467.97$Colombia 176.70 48,308.61 5,518.50 170.94 1,091.52 55,266.27 -$ -$ -$ -$ -$ -$ -$ 7,074,082.36$CzechRepublic 5,812.00 27,265.25 3,546.00 529.66 852.68 38,005.59 7.41$ -$ 43,063.69$ 228,294.23$ 3,924.49$ 6,317.91$ 281,600.31$ 4,864,716.12$Denmark 4,023.00 53,437.33 2,916.00 3,680.45 1,722.36 65,779.13 7.41$ 14.89$ 29,808.19$ 839,101.08$ 54,801.86$ 25,645.87$ 949,357.00$ 8,419,728.90$DominicanRepublic - 511.13 3,176.00 1.80 - 3,688.92 -$ -$ -$ -$ -$ -$ -$ 472,182.05$Ecuador 111.20 59,858.28 9,132.00 35.92 1,401.44 70,538.84 -$ -$ -$ -$ -$ -$ -$ 9,028,970.88$ElSalvador 488.90 52,241.07 3,091.00 42.31 1,121.95 56,985.23 -$ -$ -$ -$ -$ -$ -$ 7,294,108.89$Finland 2,271.20 44,584.34 7,579.20 2,869.57 1,458.51 58,762.82 7.41$ 55.50$ 16,828.33$ 2,895,152.21$ 159,265.12$ 80,949.62$ 3,152,195.28$ 7,521,641.27$France 46,057.21 457,972.44 6,022.50 11,541.49 9,973.22 531,566.85 7.41$ -$ 341,258.29$ 3,437,944.29$ 85,516.03$ 73,895.99$ 3,938,614.60$ 68,040,557.11$Germany 12,486.50 130,666.05 10,248.00 2,128.14 2,497.48 158,026.17 7.41$ -$ 92,518.02$ 1,044,094.71$ 15,768.34$ 18,504.95$ 1,170,886.02$ 20,227,350.25$India 1,904.34 173,070.02 29,714.05 580.54 7,944.24 213,213.19 -$ -$ -$ -$ -$ -$ -$ 27,291,288.09$Indonesia 3,931.53 84,398.72 11,469.00 1,542.09 3,589.28 104,930.62 -$ -$ -$ -$ -$ -$ -$ 13,431,119.47$Ireland 80.79 3,496.35 473.10 77.06 199.28 4,326.58 7.41$ 26.17$ 598.61$ 103,880.39$ 2,016.69$ 5,215.27$ 111,710.95$ 553,802.34$Italy 10,154.37 223,737.93 11,612.00 8,281.70 5,599.17 259,385.17 7.41$ -$ 75,238.23$ 1,743,812.02$ 61,362.80$ 41,486.72$ 1,921,899.77$ 33,201,301.54$Mexico 87.13 42,700.97 11,007.00 16.64 905.47 54,717.21 -$ 3.50$ -$ 187,977.88$ 58.24$ 3,169.15$ 191,205.28$ 7,003,802.80$Morocco 386.78 9,813.37 3,526.00 225.80 58.99 14,010.94 -$ -$ -$ -$ -$ -$ -$ 1,793,400.56$NewZealand 1,058.54 61,928.25 4,549.90 1,333.57 1,281.82 70,152.08 8.27$ -$ 8,753.56$ 549,739.08$ 11,027.90$ 10,600.01$ 580,120.56$ 8,979,466.79$Peru 98.12 70,192.50 8,594.90 62.02 1,490.92 80,438.47 -$ -$ -$ -$ -$ -$ -$ 10,296,123.99$Poland 7,589.20 99,450.12 15,173.00 736.81 3,714.46 126,663.59 7.41$ 1.00$ 56,231.75$ 114,623.12$ 736.81$ 3,714.46$ 175,306.14$ 16,212,940.16$Portugal 8,169.50 71,633.91 4,668.50 4,543.50 2,935.20 91,950.61 7.41$ 8.00$ 60,531.45$ 610,419.32$ 36,347.97$ 23,481.58$ 730,780.32$ 11,769,677.92$PuertoRico 0.76 1,123.38 102.30 8.84 175.65 1,410.93 9.32$ -$ 7.05$ 11,423.31$ 82.38$ 1,637.10$ 13,149.84$ 180,598.69$Russia 4,044.00 14,151.83 2,424.00 168.74 710.72 21,499.29 -$ -$ -$ -$ -$ -$ -$ 2,751,908.61$Singapore 10.29 12,570.64 1,690.00 77.36 744.05 15,092.35 -$ -$ -$ -$ -$ -$ -$ 1,931,820.25$Spain 6,459.50 99,688.09 17,295.00 2,697.80 3,596.57 129,736.96 7.41$ -$ 47,861.30$ 866,779.63$ 19,989.17$ 26,648.61$ 961,278.72$ 16,606,331.40$Switzerland 6,096.00 48,114.00 - 3,467.67 972.49 58,650.16 10.24$ 34.20$ 62,404.81$ 1,645,498.77$ 118,594.31$ 33,259.16$ 1,859,757.05$ 7,507,220.39$Thailand 2,315.50 157,124.80 25,355.00 3,265.34 6,707.10 194,767.74 -$ -$ -$ -$ -$ -$ -$ 24,930,270.37$TrinidadandTobago 32.92 14,741.89 3,458.00 172.92 310.46 18,716.19 -$ -$ -$ -$ -$ -$ -$ 2,395,672.21$Turkey 5,809.70 50,611.08 6,139.00 1,940.67 2,504.01 67,004.47 1.30$ -$ 7,552.61$ 73,775.11$ 2,522.87$ 3,255.22$ 87,105.81$ 8,576,571.89$UK 17,132.90 262,598.33 23,388.00 5,004.50 11,760.44 319,884.16 7.41$ -$ 126,945.26$ 2,118,999.55$ 37,080.54$ 87,138.31$ 2,370,163.65$ 40,945,172.81$USA 46,525.11 2,002,495.97 605,748.20 5,582.62 203,789.56 2,864,141.46 9.32$ -$ 433,614.04$ 24,308,835.65$ 52,030.03$ 1,899,318.66$ 26,693,798.39$ 366,610,106.58$Venezuela 16,760.80 21,935.74 5,425.00 119.05 1,888.38 46,128.96 -$ -$ -$ -$ -$ -$ -$ 5,904,506.96$GrandTotal 245,770.11 5,640,872.31 1,051,316.13 72,288.36 319,852.69 7,330,099.60 1,555,185.81$ 45,289,044.41$ 718,273.67$ 2,501,172.04$ 50,063,675.92$ 938,252,748.57$
QUANTITY(tn) PRICE(dlls) TOTALCOST

59
GHG Calculations by Geographic Region
RowLabels SumofScope1 SumofScope2 SumofScope3SumofScope3
(waste)
SumofPost-ConsumerWaste
Emissions
SumofEmissionsTotal
SumofAmcorOperations
Scope1*Average
SumofUpstream(Scope2,3)
SumofDownstream
(scope3waste)
SumofPost-ConsumerWaste
Emissions2
SumofTotalMarketCost
SumofSocialCost
AFRICA 386.78 9,813.37 3,526.00 225.80 58.99 14,010.94 -$ -$ -$ -$ -$ 1,793,400.56$ASIA 20,730.05 937,401.37 169,317.05 9,950.00 40,418.23 1,177,816.70 36,454.73$ 2,445,303.35$ 13,401.76$ 84,203.44$ 2,579,363.28$ 150,760,538.06$EUROPE 139,798.67 1,627,304.75 108,367.30 51,023.76 48,141.87 1,974,636.35 1,023,103.40$ 16,341,610.34$ 634,649.61$ 442,183.48$ 18,441,546.83$ 252,753,452.76$LATINAMERICA 19,249.31 764,948.39 88,126.60 1,254.13 17,853.18 891,431.61 7.05$ 251,793.62$ 792.91$ 4,972.96$ 257,566.55$ 114,103,246.03$NORTHAMERICA 50,972.89 2,106,538.16 617,948.28 6,114.78 208,791.96 2,990,366.07 486,867.07$ 25,700,598.01$ 58,401.49$ 1,959,212.14$ 28,205,078.72$ 382,766,856.85$OCEANIA 14,632.41 194,866.26 64,030.90 3,719.89 4,588.46 281,837.92 8,753.56$ 549,739.08$ 11,027.90$ 10,600.01$ 580,120.56$ 36,075,254.30$GrandTotal 245,770.11 5,640,872.31 1,051,316.13 72,288.36 319,852.69 7,330,099.60 1,555,185.81$ 45,289,044.41$ 718,273.67$ 2,501,172.04$ 50,063,675.92$ 938,252,748.57$
TOTALCOSTQUANTITY(tn)
$-
$5,000,000.00
$10,000,000.00
$15,000,000.00
$20,000,000.00
$25,000,000.00
AFRICA ASIA EUROPE LATINAMERICA NORTHAMERICA OCEANIA
CO2ECostAccrossSupplyChainbySegmentandRegion
Upstream Amcor Downstream

60
GHG Calculations by Division
RowLabels SumofScope1 SumofScope2 SumofScope3SumofScope3
(waste)
SumofAmcor
Operations
Scope1*Average
SumofPost-
ConsumerWaste
Emissions
SumofEmissions
Total
SumofUpstream
(Scope2,3)
SumofDownstream
(scope3waste)
SumofPost-
ConsumerWaste
Emissions2
SumofTotalMarket
CostSumofSocialCost
AFA 29,474.15 310,362.51 47,374.90 5,999.81 262,367.24 14,217.94 407,429.31$ 3,036,285.08$ 53,722.13$ 127,457.44$ 3,479,831.89$ 52,150,952.05$AFAPAUChina 20,332.56 592,564.12 154,431.00 4,930.32 28,902.12 22,236.18 794,494.18$ 2,371,528.24$ 10,878.89$ 80,948.22$ 2,492,257.47$ 101,695,255.48$AFAPINNZS.E.Asia 9,220.20 489,092.43 72,777.95 6,798.90 8,753.56 20,266.50 598,155.98$ 549,739.08$ 11,027.90$ 10,600.01$ 580,120.56$ 76,563,964.99$ARPBericap 379.98 139,245.16 18,615.00 527.88 4,381.90 8,825.41 167,593.43$ 1,617,130.98$ 5,934.79$ 91,073.32$ 1,718,521.00$ 21,451,959.27$ARPLATAM 19,211.17 736,208.53 86,605.90 1,000.99 - 17,441.52 860,468.11$ 187,977.88$ 58.24$ 3,169.15$ 191,205.28$ 110,139,918.43$ARPNA 23,412.24 1,721,269.68 560,149.60 931.87 219,691.41 189,134.78 2,494,898.18$ 21,301,235.29$ 8,745.24$ 1,765,286.35$ 23,294,958.29$ 319,346,967.21$EMEAF&B 74,234.67 910,978.34 80,413.90 37,037.75 501,816.61 31,537.64 1,134,202.30$ 10,533,014.73$ 518,661.38$ 304,886.76$ 11,858,379.49$ 145,177,894.39$EMEAFD&C 69,505.13 741,151.54 30,947.88 15,060.83 529,272.96 16,192.72 872,858.10$ 5,692,133.11$ 109,245.11$ 117,750.77$ 6,448,401.95$ 111,725,836.75$GrandTotal 245,770.11 5,640,872.31 1,051,316.13 72,288.36 1,555,185.81 319,852.69 7,330,099.60$ 45,289,044.41$ 718,273.67$ 2,501,172.04$ 50,063,675.92$ 938,252,748.57$
QUANTITY(tn) TOTALCOST
-$4,000,000.00
$1,000,000.00
$6,000,000.00
$11,000,000.00
$16,000,000.00
$21,000,000.00
AFA AFAPAUChina
AFAPINNZS.E.Asia
ARPBericap ARPLATAM ARPNA EMEAF&B EMEAFD&C
TotalGHGCostAcrossSupplyChainbySegmentandDivision
Upstream Amcor Downstream

61
AFA7%
AFAPAUChina5% AFAPINNZS.E.
Asia1%
ARPBericap4%
ARPLATAM0%
ARPNA47%
EMEAF&B23%
EMEAFD&C13%
TotatalGHGCostAcrossSupplyChainbySegmentandDivision

62
Water Calculations by Country
Country UpstreamWaterUse
PlantWaterUse
DownstreamWaterUseforTreatmentofAmcorWaste
DownstreamWaterUseforTreatmentofPost-Consumer
Waste
TotalWaterUsed
EcosystemQualityChange(ha/m^3)
EcosystemImpactPrice($/ha)
HumanHealth
ImpactPrice($/m3)
UpstreamWaterUseEcosystem
Impact
UpstreamWaterUseHumanHealthImpact
TotalUpstreamImpact
AmcorWaterUse
EcosystemImpact
AmcorWaterUseHuman
HealthImpact
TotalAmcorImpact
WaterUseFromPlantWasteTreatmentEcosystemImpact
WaterUseFromPlantWasteTreatment
HumanHealthImpact
TotalPlantWasteImpact
PCWTreatmentEcosystemImpact
PCWTreatmentHumanHealthImpact
TotalPCWTreatment
TotalCountryCosts
Argentina 2,694,610.41 10,452.00 11.67 12,671.08 2,717,745.16 4.75E-05 535.02 1.68E-03 68,478.91$ 4,538.57$ 73,017.48$ 265.62$ 17.60$ 283.22$ 0.30$ 0.02$ 0.32$ 322.01$ 21.34$ 343.36$ 73,644.38$Australia 6,102,016.74 19,987.00 701.76 9,284.98 6,131,990.48 1.45E-04 484.67 0.00E+00 428,834.11$ -$ 428,834.11$ 1,404.64$ -$ 1,404.64$ 49.32$ -$ 49.32$ 652.52$ -$ 652.52$ 430,940.59$Belgium 714,506.65 10,385.00 398.84 1,361.44 726,651.93 1.57E-05 403.98 0.00E+00 4,531.76$ -$ 4,531.76$ 65.87$ -$ 65.87$ 2.53$ -$ 2.53$ 8.63$ -$ 8.63$ 4,608.79$Brazil 9,482,736.94 215,717.00 96.71 13,819.62 9,712,370.27 8.90E-06 179.67 9.07E-04 15,163.64$ 8,603.65$ 23,767.29$ 344.95$ 195.72$ 540.67$ 0.15$ 0.09$ 0.24$ 22.10$ 12.54$ 34.64$ 24,342.84$Canada 1,097,226.11 64,174.00 40.57 3,312.76 1,164,753.44 1.29E-05 143.60 0.00E+00 2,032.53$ -$ 2,032.53$ 118.88$ -$ 118.88$ 0.08$ -$ 0.08$ 6.14$ -$ 6.14$ 2,157.61$Chile 124,528.90 4,217.00 14.08 93.63 128,853.61 2.66E-05 176.52 7.17E-03 584.71$ 892.29$ 1,476.99$ 19.80$ 30.22$ 50.02$ 0.07$ 0.10$ 0.17$ 0.44$ 0.67$ 1.11$ 1,528.29$China 7,653,449.66 394,164.60 163.68 8,972.72 8,056,750.67 2.30E-05 265.11 1.46E-02 46,667.44$ 111,459.21$ 158,126.65$ 2,403.45$ 5,740.32$ 8,143.77$ 1.00$ 2.38$ 3.38$ 54.71$ 130.67$ 185.38$ 166,459.18$Colombia 2,501,024.97 40,695.00 4.39 3,064.96 2,544,789.33 4.66E-06 96.18 6.79E-04 1,120.92$ 1,698.97$ 2,819.89$ 18.24$ 27.64$ 45.88$ 0.00$ 0.00$ 0.00$ 1.37$ 2.08$ 3.46$ 2,869.23$CzechRepublic 301,765.39 2,505.00 15.36 540.12 304,825.87 1.54E-05 397.27 5.91E-05 1,846.21$ 17.83$ 1,864.04$ 15.33$ 0.15$ 15.47$ 0.09$ 0.00$ 0.09$ 3.30$ 0.03$ 3.34$ 1,882.95$Denmark 73,773.85 8,100.00 258.71 1,091.00 83,223.57 1.40E-05 365.47 0.00E+00 377.47$ -$ 377.47$ 41.44$ -$ 41.44$ 1.32$ -$ 1.32$ 5.58$ -$ 5.58$ 425.82$DominicanRepublic137,804.50 2,420.00 0.12 - 140,224.62 9.06E-06 184.02 5.72E-03 229.75$ 788.65$ 1,018.40$ 4.03$ 13.85$ 17.88$ 0.00$ 0.00$ 0.00$ -$ -$ -$ 1,036.29$Ecuador 1,468,619.23 46,753.00 6.37 3,935.21 1,519,313.81 9.65E-06 197.05 9.21E-03 2,792.61$ 13,529.72$ 16,322.33$ 88.90$ 430.71$ 519.62$ 0.01$ 0.06$ 0.07$ 7.48$ 36.25$ 43.74$ 16,885.75$ElSalvador 971,281.84 30,579.00 1.81 3,150.41 1,005,013.06 7.50E-06 227.71 1.10E-03 1,658.80$ 1,071.05$ 2,729.84$ 52.22$ 33.72$ 85.94$ 0.00$ 0.00$ 0.01$ 5.38$ 3.47$ 8.85$ 2,824.65$Finland 155,589.99 8,438.00 210.37 923.88 165,162.24 1.62E-05 212.53 2.05E-06 535.68$ 0.32$ 536.00$ 29.05$ 0.02$ 29.07$ 0.72$ 0.00$ 0.72$ 3.18$ 0.00$ 3.18$ 568.98$France 3,678,837.12 66,747.60 775.15 6,317.40 3,752,677.27 1.46E-05 196.85 0.00E+00 10,573.02$ -$ 10,573.02$ 191.83$ -$ 191.83$ 2.23$ -$ 2.23$ 18.16$ -$ 18.16$ 10,785.24$Germany 554,797.07 270,895.00 98.25 1,582.00 827,372.31 1.55E-05 399.51 2.32E-05 3,435.56$ 12.88$ 3,448.45$ 1,677.51$ 6.29$ 1,683.80$ 0.61$ 0.00$ 0.61$ 9.80$ 0.04$ 9.83$ 5,142.69$India 8,888,599.31 68,204.00 79.08 3,765.62 8,960,648.01 3.97E-05 352.91 1.04E-01 124,532.30$ 926,394.00$ 1,050,926.29$ 955.56$ 7,108.41$ 8,063.97$ 1.11$ 8.24$ 9.35$ 52.76$ 392.46$ 445.22$ 1,059,444.83$Indonesia 357,328.45 34,055.00 - 1,701.34 393,084.79 3.53E-06 76.55 9.17E-03 96.56$ 3,275.28$ 3,371.84$ 9.20$ 312.15$ 321.35$ -$ -$ -$ 0.46$ 15.59$ 16.05$ 3,709.25$Ireland 122,766.19 237.00 1.35 126.23 123,130.77 1.22E-05 323.35 0.00E+00 484.30$ -$ 484.30$ 0.93$ -$ 0.93$ 0.01$ -$ 0.01$ 0.50$ -$ 0.50$ 485.74$Italy 1,528,521.89 100,850.00 556.24 3,546.72 1,633,474.84 1.34E-05 212.71 0.00E+00 4,356.85$ -$ 4,356.85$ 287.46$ -$ 287.46$ 1.59$ -$ 1.59$ 10.11$ -$ 10.11$ 4,656.01$Mexico 399,938.27 7,123.00 2.60 2,542.55 409,606.42 6.35E-05 481.62 7.82E-03 12,231.32$ 3,126.20$ 15,357.52$ 217.84$ 55.68$ 273.52$ 0.08$ 0.02$ 0.10$ 77.76$ 19.87$ 97.63$ 15,728.77$Morocco 504,267.98 8,764.00 - 165.65 513,197.63 1.13E-04 700.27 9.17E-02 39,903.17$ 46,221.28$ 86,124.45$ 693.50$ 803.31$ 1,496.81$ -$ -$ -$ 13.11$ 15.18$ 28.29$ 87,649.55$NewZealand 1,047,202.74 20,037.00 161.02 3,599.34 1,071,000.10 9.05E-06 126.14 0.00E+00 1,195.49$ -$ 1,195.49$ 22.87$ -$ 22.87$ 0.18$ -$ 0.18$ 4.11$ -$ 4.11$ 1,222.66$Peru 650,181.73 41,286.00 1.62 4,186.48 695,655.84 1.27E-05 183.04 3.04E-02 1,511.45$ 19,754.33$ 21,265.78$ 95.98$ 1,254.38$ 1,350.36$ 0.00$ 0.05$ 0.05$ 9.73$ 127.20$ 136.93$ 22,753.12$Poland 1,130,984.52 7,014.00 1.27 2,352.87 1,140,352.66 2.02E-05 500.06 9.12E-05 11,424.20$ 103.14$ 11,527.34$ 70.85$ 0.64$ 71.49$ 0.01$ 0.00$ 0.01$ 23.77$ 0.21$ 23.98$ 11,622.82$Portugal 4,839,859.74 19,798.00 237.29 1,859.26 4,861,754.29 1.92E-05 309.01 0.00E+00 28,714.63$ -$ 28,714.63$ 117.46$ -$ 117.46$ 1.41$ -$ 1.41$ 11.03$ -$ 11.03$ 28,844.53$PuertoRico 455,861.32 382.00 20.44 493.24 456,757.00 1.25E-05 369.19 0.00E+00 2,103.72$ -$ 2,103.72$ 1.76$ -$ 1.76$ 0.09$ -$ 0.09$ 2.28$ -$ 2.28$ 2,107.85$Russia 491,996.75 3,110.00 117.14 450.19 495,674.08 1.16E-05 162.84 2.50E-03 929.34$ 1,229.28$ 2,158.62$ 5.87$ 7.77$ 13.65$ 0.22$ 0.29$ 0.51$ 0.85$ 1.12$ 1.98$ 2,174.75$Singapore 398.32 775.90 4.41 352.69 1,531.31 3.73E-06 79.85 1.96E-04 0.12$ 0.08$ 0.20$ 0.23$ 0.15$ 0.38$ 0.00$ 0.00$ 0.00$ 0.11$ 0.07$ 0.17$ 0.76$Spain 461,108.91 11,395.00 182.81 2,278.20 474,964.92 3.45E-05 486.56 0.00E+00 7,740.38$ -$ 7,740.38$ 191.28$ -$ 191.28$ 3.07$ -$ 3.07$ 38.24$ -$ 38.24$ 7,972.97$Switzerland 192,974.01 305,822.00 238.99 616.01 499,651.01 5.60E-06 156.77 4.35E-06 169.41$ 0.84$ 170.25$ 268.48$ 1.33$ 269.81$ 0.21$ 0.00$ 0.21$ 0.54$ 0.00$ 0.54$ 440.81$Thailand 2,941,815.03 88,420.00 35.80 3,179.21 3,033,450.03 1.32E-05 391.03 7.40E-03 15,184.59$ 21,763.41$ 36,948.00$ 456.39$ 654.13$ 1,110.52$ 0.18$ 0.26$ 0.45$ 16.41$ 23.52$ 39.93$ 38,098.90$TrinidadandTobago122,710.29 5,159.00 8.69 871.76 128,749.73 4.54E-06 149.87 4.59E-03 83.50$ 563.52$ 647.02$ 3.51$ 23.69$ 27.20$ 0.01$ 0.04$ 0.05$ 0.59$ 4.00$ 4.60$ 678.86$Turkey 524,949.64 54,363.00 105.49 1,186.92 580,605.05 5.26E-05 419.67 2.51E-02 11,588.11$ 13,165.00$ 24,753.10$ 1,200.05$ 1,363.35$ 2,563.39$ 2.33$ 2.65$ 4.97$ 26.20$ 29.77$ 55.97$ 27,377.44$UK 428,616.05 37,957.80 194.11 7,449.49 474,217.45 1.14E-05 304.18 0.00E+00 1,486.30$ -$ 1,486.30$ 131.62$ -$ 131.62$ 0.67$ -$ 0.67$ 25.83$ -$ 25.83$ 1,644.43$USA 120,304,104.30 1,708,985.60 724.57 134,956.39 122,148,770.85 3.10E-05 210.35 9.91E-05 784,483.73$ 11,922.69$ 796,406.42$ 11,144.02$ 169.37$ 11,313.39$ 4.72$ 0.07$ 4.80$ 880.03$ 13.37$ 893.40$ 808,618.01$Venezuela 3,436,273.01 64,780.00 13.41 5,302.54 3,506,368.96 1.01E-05 208.23 5.35E-03 7,226.84$ 18,386.53$ 25,613.37$ 136.24$ 346.62$ 482.86$ 0.03$ 0.07$ 0.10$ 11.15$ 28.37$ 39.52$ 26,135.86$GrandTotal186,543,027.82 3,784,747.50 5,484.17 251,103.90 190,584,363.39 1,644,309.41$ 1,208,518.71$ 2,852,828.12$ 22,752.89$ 18,597.22$ 41,350.10$ 74.36$ 14.36$ 88.72$ 2,326.38$ 877.86$ 3,204.24$ 2,897,471.19$
TOTALCOSTQUANTITY(m3) PRICE(dlls)
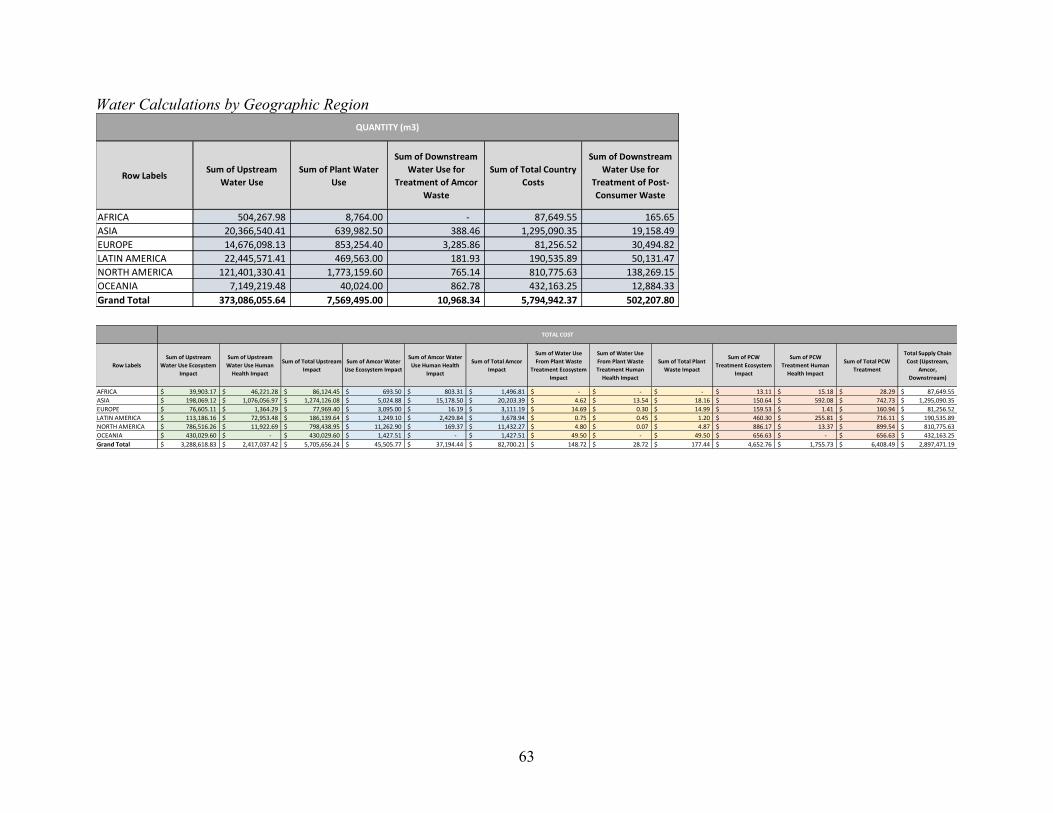
63
Water Calculations by Geographic Region
RowLabels SumofUpstreamWaterUse
SumofPlantWaterUse
SumofDownstreamWaterUsefor
TreatmentofAmcorWaste
SumofTotalCountryCosts
SumofDownstreamWaterUsefor
TreatmentofPost-ConsumerWaste
AFRICA 504,267.98 8,764.00 - 87,649.55 165.65ASIA 20,366,540.41 639,982.50 388.46 1,295,090.35 19,158.49EUROPE 14,676,098.13 853,254.40 3,285.86 81,256.52 30,494.82LATINAMERICA 22,445,571.41 469,563.00 181.93 190,535.89 50,131.47NORTHAMERICA 121,401,330.41 1,773,159.60 765.14 810,775.63 138,269.15OCEANIA 7,149,219.48 40,024.00 862.78 432,163.25 12,884.33GrandTotal 373,086,055.64 7,569,495.00 10,968.34 5,794,942.37 502,207.80
QUANTITY(m3)
RowLabelsSumofUpstream
WaterUseEcosystemImpact
SumofUpstreamWaterUseHumanHealthImpact
SumofTotalUpstreamImpact
SumofAmcorWaterUseEcosystemImpact
SumofAmcorWaterUseHumanHealth
Impact
SumofTotalAmcorImpact
SumofWaterUseFromPlantWaste
TreatmentEcosystemImpact
SumofWaterUseFromPlantWasteTreatmentHumanHealthImpact
SumofTotalPlantWasteImpact
SumofPCWTreatmentEcosystem
Impact
SumofPCWTreatmentHumanHealthImpact
SumofTotalPCWTreatment
TotalSupplyChainCost(Upstream,
Amcor,Downstrream)
AFRICA 39,903.17$ 46,221.28$ 86,124.45$ 693.50$ 803.31$ 1,496.81$ -$ -$ -$ 13.11$ 15.18$ 28.29$ 87,649.55$ASIA 198,069.12$ 1,076,056.97$ 1,274,126.08$ 5,024.88$ 15,178.50$ 20,203.39$ 4.62$ 13.54$ 18.16$ 150.64$ 592.08$ 742.73$ 1,295,090.35$EUROPE 76,605.11$ 1,364.29$ 77,969.40$ 3,095.00$ 16.19$ 3,111.19$ 14.69$ 0.30$ 14.99$ 159.53$ 1.41$ 160.94$ 81,256.52$LATINAMERICA 113,186.16$ 72,953.48$ 186,139.64$ 1,249.10$ 2,429.84$ 3,678.94$ 0.75$ 0.45$ 1.20$ 460.30$ 255.81$ 716.11$ 190,535.89$NORTHAMERICA 786,516.26$ 11,922.69$ 798,438.95$ 11,262.90$ 169.37$ 11,432.27$ 4.80$ 0.07$ 4.87$ 886.17$ 13.37$ 899.54$ 810,775.63$OCEANIA 430,029.60$ -$ 430,029.60$ 1,427.51$ -$ 1,427.51$ 49.50$ -$ 49.50$ 656.63$ -$ 656.63$ 432,163.25$GrandTotal 3,288,618.83$ 2,417,037.42$ 5,705,656.24$ 45,505.77$ 37,194.44$ 82,700.21$ 148.72$ 28.72$ 177.44$ 4,652.76$ 1,755.73$ 6,408.49$ 2,897,471.19$
TOTALCOST
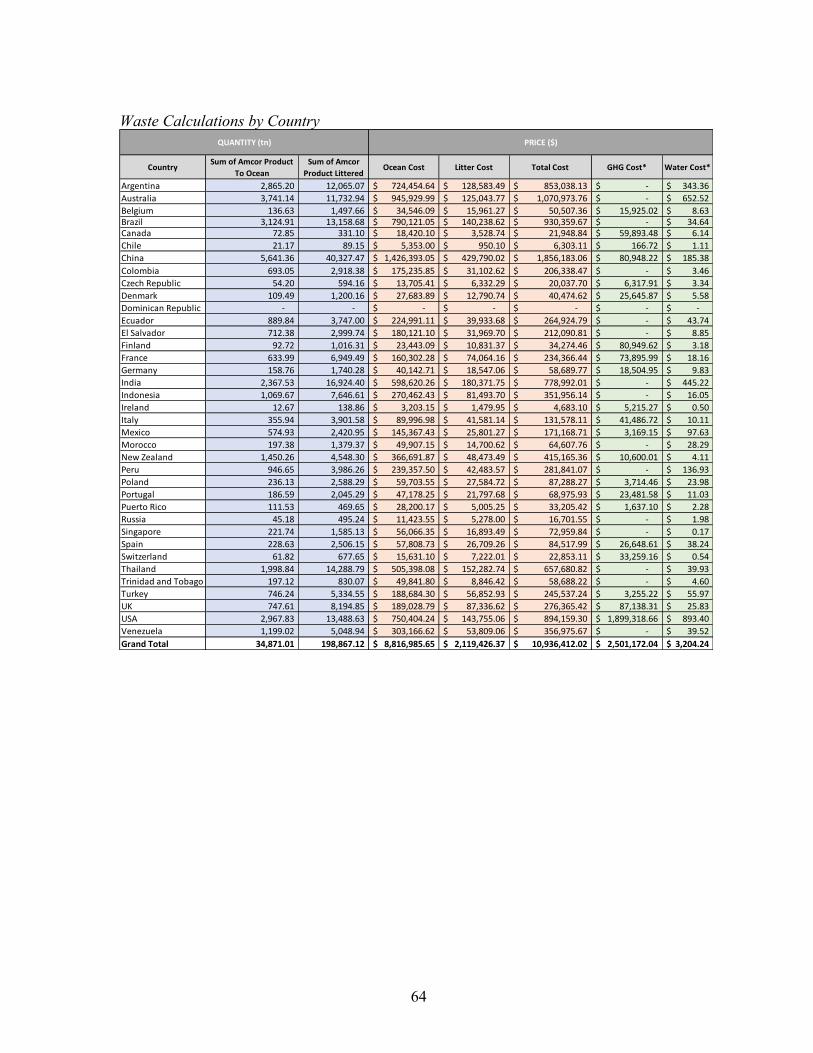
64
Waste Calculations by Country
Country SumofAmcorProductToOcean
SumofAmcorProductLittered
OceanCost LitterCost TotalCost GHGCost* WaterCost*
Argentina 2,865.20 12,065.07 724,454.64$ 128,583.49$ 853,038.13$ -$ 343.36$Australia 3,741.14 11,732.94 945,929.99$ 125,043.77$ 1,070,973.76$ -$ 652.52$Belgium 136.63 1,497.66 34,546.09$ 15,961.27$ 50,507.36$ 15,925.02$ 8.63$Brazil 3,124.91 13,158.68 790,121.05$ 140,238.62$ 930,359.67$ -$ 34.64$Canada 72.85 331.10 18,420.10$ 3,528.74$ 21,948.84$ 59,893.48$ 6.14$Chile 21.17 89.15 5,353.00$ 950.10$ 6,303.11$ 166.72$ 1.11$China 5,641.36 40,327.47 1,426,393.05$ 429,790.02$ 1,856,183.06$ 80,948.22$ 185.38$Colombia 693.05 2,918.38 175,235.85$ 31,102.62$ 206,338.47$ -$ 3.46$CzechRepublic 54.20 594.16 13,705.41$ 6,332.29$ 20,037.70$ 6,317.91$ 3.34$Denmark 109.49 1,200.16 27,683.89$ 12,790.74$ 40,474.62$ 25,645.87$ 5.58$DominicanRepublic - - -$ -$ -$ -$ -$Ecuador 889.84 3,747.00 224,991.11$ 39,933.68$ 264,924.79$ -$ 43.74$ElSalvador 712.38 2,999.74 180,121.10$ 31,969.70$ 212,090.81$ -$ 8.85$Finland 92.72 1,016.31 23,443.09$ 10,831.37$ 34,274.46$ 80,949.62$ 3.18$France 633.99 6,949.49 160,302.28$ 74,064.16$ 234,366.44$ 73,895.99$ 18.16$Germany 158.76 1,740.28 40,142.71$ 18,547.06$ 58,689.77$ 18,504.95$ 9.83$India 2,367.53 16,924.40 598,620.26$ 180,371.75$ 778,992.01$ -$ 445.22$Indonesia 1,069.67 7,646.61 270,462.43$ 81,493.70$ 351,956.14$ -$ 16.05$Ireland 12.67 138.86 3,203.15$ 1,479.95$ 4,683.10$ 5,215.27$ 0.50$Italy 355.94 3,901.58 89,996.98$ 41,581.14$ 131,578.11$ 41,486.72$ 10.11$Mexico 574.93 2,420.95 145,367.43$ 25,801.27$ 171,168.71$ 3,169.15$ 97.63$Morocco 197.38 1,379.37 49,907.15$ 14,700.62$ 64,607.76$ -$ 28.29$NewZealand 1,450.26 4,548.30 366,691.87$ 48,473.49$ 415,165.36$ 10,600.01$ 4.11$Peru 946.65 3,986.26 239,357.50$ 42,483.57$ 281,841.07$ -$ 136.93$Poland 236.13 2,588.29 59,703.55$ 27,584.72$ 87,288.27$ 3,714.46$ 23.98$Portugal 186.59 2,045.29 47,178.25$ 21,797.68$ 68,975.93$ 23,481.58$ 11.03$PuertoRico 111.53 469.65 28,200.17$ 5,005.25$ 33,205.42$ 1,637.10$ 2.28$Russia 45.18 495.24 11,423.55$ 5,278.00$ 16,701.55$ -$ 1.98$Singapore 221.74 1,585.13 56,066.35$ 16,893.49$ 72,959.84$ -$ 0.17$Spain 228.63 2,506.15 57,808.73$ 26,709.26$ 84,517.99$ 26,648.61$ 38.24$Switzerland 61.82 677.65 15,631.10$ 7,222.01$ 22,853.11$ 33,259.16$ 0.54$Thailand 1,998.84 14,288.79 505,398.08$ 152,282.74$ 657,680.82$ -$ 39.93$TrinidadandTobago 197.12 830.07 49,841.80$ 8,846.42$ 58,688.22$ -$ 4.60$Turkey 746.24 5,334.55 188,684.30$ 56,852.93$ 245,537.24$ 3,255.22$ 55.97$UK 747.61 8,194.85 189,028.79$ 87,336.62$ 276,365.42$ 87,138.31$ 25.83$USA 2,967.83 13,488.63 750,404.24$ 143,755.06$ 894,159.30$ 1,899,318.66$ 893.40$Venezuela 1,199.02 5,048.94 303,166.62$ 53,809.06$ 356,975.67$ -$ 39.52$GrandTotal 34,871.01 198,867.12 8,816,985.65$ 2,119,426.37$ 10,936,412.02$ 2,501,172.04$ 3,204.24$
QUANTITY(tn) PRICE($)

65
$-
$500,000.00
$1,000,000.00
$1,500,000.00
$2,000,000.00
$2,500,000.00
$3,000,000.00
Argentina
Australia
Belgium
Brazil
Canada
Chile
China
Colombia
CzechRe
public
Denm
ark
DominicanRep
ublic
Ecuado
r
ElSa
lvador
Finland
France
Germ
any
India
Indo
nesia
Ireland
Italy
Mexico
Morocco
New
Zealand
Peru
Poland
Portugal
PuertoRico
Russia
Singapore
Spain
Switzerland
Thailand
Trinidadan
dTo
bago
Turkey UK USA
Vene
zuela
Post-ConsumerWasteCostsbyCountry
OceanCost LitterCost GHGCost WaterCost

66
Waste Calculations by Geographic Region
Waste Calculations by Division
RowLabels SumofAmcorProductToOcean
SumofAmcorProductLittered
OceanCost LitterCost TotalCost
AFRICA 197.38 1,379.37 49,907.15$ 14,700.62$ 64,607.76$ASIA 12,045.39 86,106.93 3,045,624.47$ 917,684.64$ 3,963,309.11$EUROPE 3,060.35 33,545.98 773,797.57$ 357,516.26$ 1,131,313.83$LATINAMERICA 11,335.81 47,733.88 2,866,210.26$ 508,723.80$ 3,374,934.06$NORTHAMERICA 3,040.69 13,819.73 768,824.34$ 147,283.80$ 916,108.13$OCEANIA 5,191.39 16,281.24 1,312,621.86$ 173,517.26$ 1,486,139.12$GrandTotal 34,871.01 198,867.12 8,816,985.65$ 2,119,426.37$ 10,936,412.02$
QUANTITY(tn) PRICE($)
Division OceanCost LitterCost GHGCost WaterCostAFA 158,839.70$ 46,112.82$ 127,457.44$ 56.70$AFAPAUChina 2,372,323.04$ 554,833.78$ 80,948.22$ 837.91$AFAPINNZS.E.Asia 1,797,238.98$ 479,515.18$ 10,600.01$ 505.49$ARPBericap 32,497.37$ 6,225.53$ 91,073.32$ 28.19$ARPLATAM 2,800,121.11$ 496,993.63$ 3,169.15$ 711.30$ARPNA 696,441.69$ 133,417.44$ 1,765,286.35$ 826.12$EMEAF&B 655,349.80$ 272,465.53$ 304,886.76$ 154.81$EMEAFD&C 304,173.95$ 129,862.46$ 117,750.77$ 83.72$Total 8,816,985.65$ 2,119,426.37$ 2,501,172.04$ 3,204.24$
$-
$500,000.00
$1,000,000.00
$1,500,000.00
$2,000,000.00
$2,500,000.00
$3,000,000.00
$3,500,000.00
AFA AFAPAUChina
AFAPINNZS.E.Asia
ARPBericapARPLATAM ARPNA EMEAF&B EMEAFD&C
Post-ConsumerWasteCostsbyDivision
OceanCost LitterCost GHGCost WaterCost
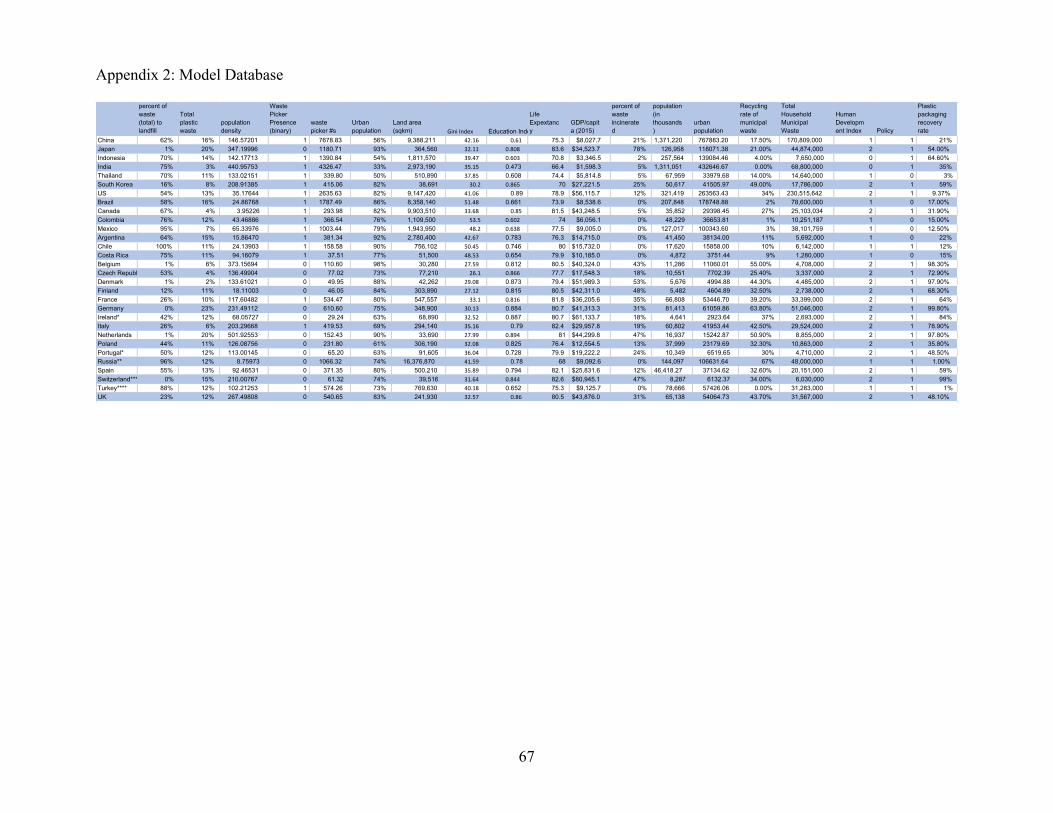
67
Appendix 2: Model Database
percent of waste (total) to landfill
Total plastic waste
population density
Waste Picker Presence (binary)
waste picker #s
Urban population
Land area (sqkm) GiniIndex Education Index
Life Expextancy
GDP/capita (2015)
percent of waste incinerated
population (in thousands)
urban population
Recycling rate of municipal waste
Total Household Municipal Waste
Human Development Index Policy
Plastic packaging recovery rate
China 62% 16% 146.57201 1 7678.83 56% 9,388,211 42.16 0.61 75.3 $8,027.7 21% 1,371,220 767883.20 17.50% 170,809,000 1 1 21%Japan 1% 20% 347.19996 0 1180.71 93% 364,560 32.11 0.808 83.6 $34,523.7 78% 126,958 118071.38 21.00% 44,874,000 2 1 54.00%Indonesia 70% 14% 142.17713 1 1390.84 54% 1,811,570 39.47 0.603 70.8 $3,346.5 2% 257,564 139084.46 4.00% 7,650,000 0 1 64.60%India 75% 3% 440.95753 1 4326.47 33% 2,973,190 35.15 0.473 66.4 $1,598.3 5% 1,311,051 432646.67 0.00% 68,800,000 0 1 35%Thailand 70% 11% 133.02151 1 339.80 50% 510,890 37.85 0.608 74.4 $5,814.8 5% 67,959 33979.68 14.00% 14,640,000 1 0 3%South Korea 16% 8% 208.91385 1 415.06 82% 38,691 30.2 0.865 70 $27,221.5 25% 50,617 41505.97 49.00% 17,786,000 2 1 59%US 54% 13% 35.17644 1 2635.63 82% 9,147,420 41.06 0.89 78.9 $56,115.7 12% 321,419 263563.43 34% 230,515,642 2 1 9.37%Brazil 58% 16% 24.86768 1 1787.49 86% 8,358,140 51.48 0.661 73.9 $8,538.6 0% 207,848 178748.88 2% 78,600,000 1 0 17.00%Canada 67% 4% 3.95226 1 293.98 82% 9,903,510 33.68 0.85 81.5 $43,248.5 5% 35,852 29398.45 27% 25,103,034 2 1 31.90%Colombia 76% 12% 43.46886 1 366.54 76% 1,109,500 53.5 0.602 74 $6,056.1 0% 48,229 36653.81 1% 10,251,187 1 0 15.00%Mexico 95% 7% 65.33976 1 1003.44 79% 1,943,950 48.2 0.638 77.5 $9,005.0 0% 127,017 100343.60 3% 38,101,759 1 0 12.50%Argentina 64% 15% 15.86470 1 381.34 92% 2,780,400 42.67 0.783 76.3 $14,715.0 0% 41,450 38134.00 11% 5,692,000 1 0 22%Chile 100% 11% 24.13903 1 158.58 90% 756,102 50.45 0.746 80 $15,732.0 0% 17,620 15858.00 10% 6,142,000 1 1 12%Costa Rica 75% 11% 94.16079 1 37.51 77% 51,500 48.53 0.654 79.9 $10,185.0 0% 4,872 3751.44 9% 1,280,000 1 0 15%Belgium 1% 6% 373.15694 0 110.60 98% 30,280 27.59 0.812 80.5 $40,324.0 43% 11,286 11060.01 55.00% 4,708,000 2 1 98.30%Czech Republic 53% 4% 136.49904 0 77.02 73% 77,210 26.1 0.866 77.7 $17,548.3 18% 10,551 7702.39 25.40% 3,337,000 2 1 72.90%Denmark 1% 2% 133.61021 0 49.95 88% 42,262 29.08 0.873 79.4 $51,989.3 53% 5,676 4994.88 44.30% 4,485,000 2 1 97.90%Finland 12% 11% 18.11003 0 46.05 84% 303,890 27.12 0.815 80.5 $42,311.0 48% 5,482 4604.89 32.50% 2,738,000 2 1 68.30%France 26% 10% 117.60482 1 534.47 80% 547,557 33.1 0.816 81.8 $36,205.6 35% 66,808 53446.70 39.20% 33,399,000 2 1 64%Germany 0% 23% 231.49112 0 610.60 75% 348,900 30.13 0.884 80.7 $41,313.3 31% 81,413 61059.86 63.80% 51,046,000 2 1 99.80%Ireland* 42% 12% 68.05727 0 29.24 63% 68,890 32.52 0.887 80.7 $61,133.7 18% 4,641 2923.64 37% 2,693,000 2 1 84%Italy 26% 6% 203.29668 1 419.53 69% 294,140 35.16 0.79 82.4 $29,957.8 19% 60,802 41953.44 42.50% 29,524,000 2 1 78.90%Netherlands 1% 20% 501.92553 0 152.43 90% 33,690 27.99 0.894 81 $44,299.8 47% 16,937 15242.87 50.90% 8,855,000 2 1 97.80%Poland 44% 11% 126.08756 0 231.80 61% 306,190 32.08 0.825 76.4 $12,554.5 13% 37,999 23179.69 32.30% 10,863,000 2 1 35.80%Portugal* 50% 12% 113.00145 0 65.20 63% 91,605 36.04 0.728 79.9 $19,222.2 24% 10,349 6519.65 30% 4,710,000 2 1 48.50%Russia** 96% 12% 8.75973 0 1066.32 74% 16,376,870 41.59 0.78 68 $9,092.6 0% 144,097 106631.64 67% 48,000,000 1 1 1.00%Spain 55% 13% 92.46531 0 371.35 80% 500,210 35.89 0.794 82.1 $25,831.6 12% 46,418.27 37134.62 32.60% 20,151,000 2 1 59%Switzerland*** 0% 15% 210.00767 0 61.32 74% 39,516 31.64 0.844 82.6 $80,945.1 47% 8,287 6132.37 34.00% 6,030,000 2 1 99%Turkey**** 88% 12% 102.21253 1 574.26 73% 769,630 40.18 0.652 75.3 $9,125.7 0% 78,666 57426.06 0.00% 31,283,000 1 1 1%UK 23% 12% 267.49808 0 540.65 83% 241,930 32.57 0.86 80.5 $43,876.0 31% 65,138 54064.73 43.70% 31,567,000 2 1 48.10%

68
Appendix 3: Regression Model Variable Sources
Variable Source(s) Year(s) Data Quality
Plastic Packaging Recovery Rate
Plastic Packaging Recovery Rate
Eurostat158 2015 High
OECD159 2015 High
Asian Institute of Technology160 2015 Medium
Plastic Waste Management Institute161
2015 Medium
International Multidisciplinary Research Journal162
2012 Medium
World Academy of Science, Engineering and Technology163
2012 Medium
EPA164 2016 Medium
Injection Molding Network165 2014 Low
Multi-Material Stewardship Manitoba166
2013 Low
Plastics Europe167 2015 Medium
Environmental Protection Agency: Advancing Sustainable Materials Facts and Figures168
2013 High
Statcan: Waste Disposal by Source169
2015 High

69
Variable Source(s) Year(s) Data Quality
Export.gov: Mexico – Plastic Materials//Resins170
2016 Low
Municipal Solid Waste
Total municipal solid waste (tons)
Eurostat171 2012 High
International Finance Corporation: Municipal Solid Waste Management: Opportunities for Russia (2012)172
2012 Medium
Environmental Protection Agency: Advancing Sustainable Materials Facts and Figures173
2013 High
Statcan: Waste Disposal by Source 2015 High
Eurostat174 2015 High
International Solid Waste Association175
2014 Medium
Asian Institute of Technology176 2015 Low
AIT/UNEP Regional Resource Center for Asia and the Pacific177
2015 Medium
Overall recycling rate (%)
Statista178 multiple High
World Bank 2015 High
United Nations Statistics Division179
2014 High
Journal of Material Cycles and 2014 Medium

70
Waste Management180
Environmental Protection Agency: Advancing Sustainable Materials Facts and Figures
2013 High
Statcan: Waste Disposal by Source 2015 High
AIT/UNEP Regional Resource Center for Asia and the Pacific
2015 Medium
Organisation for Economic Co-operation and Development (OECD), “Municipal Waste”, OECD Environmental Statistics (database)181
2015 High
International Finance Corporation: Municipal Solid Waste Management: Opportunities for Russia (2012)
2010 Medium
International Finance Corporation: Municipal Solid Waste Management: Opportunities for Russia (2012)
2010 Medium
Percent of waste to landfill (%)
Eurostat 2015 High
Organisation for Economic Co-operation and Development (OECD), “Municipal Waste”, OECD Environmental Statistics (database)
2015 High
International Finance Corporation: Municipal Solid Waste Management: Opportunities for Russia (2012)
2010 Medium
Department of Energy: Waste to Energy Information Administration182
2016 High
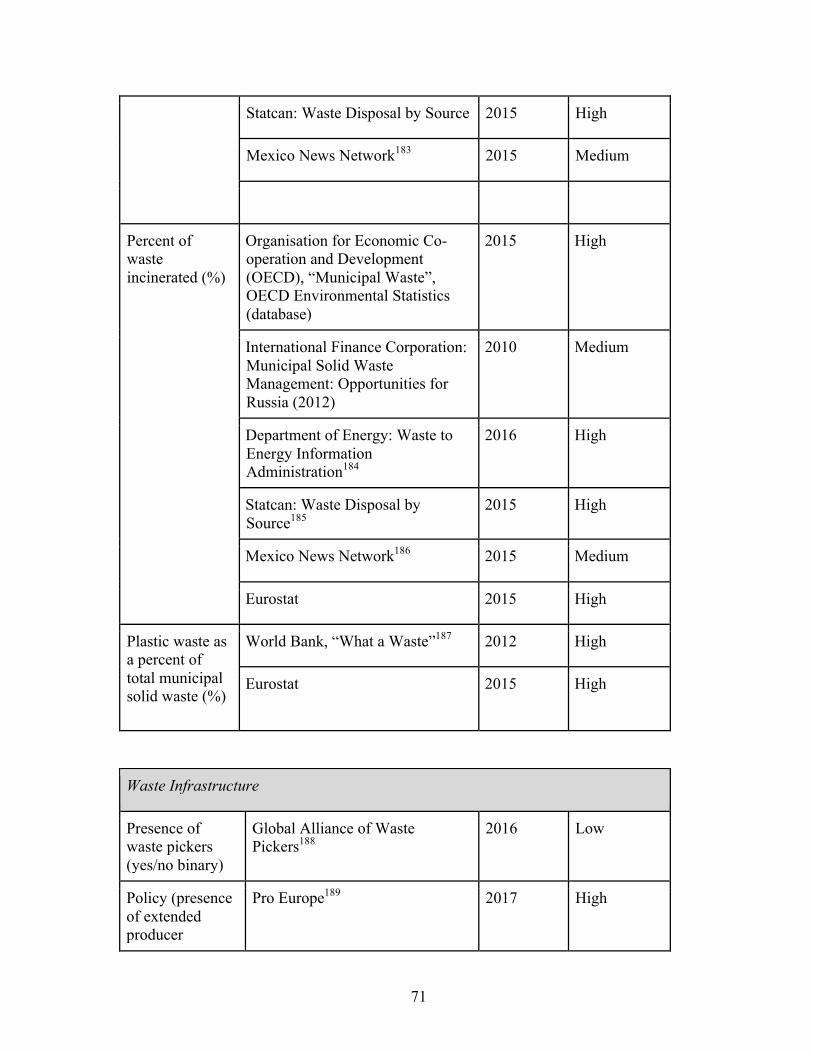
71
Statcan: Waste Disposal by Source 2015 High
Mexico News Network183 2015 Medium
Percent of waste incinerated (%)
Organisation for Economic Co-operation and Development (OECD), “Municipal Waste”, OECD Environmental Statistics (database)
2015 High
International Finance Corporation: Municipal Solid Waste Management: Opportunities for Russia (2012)
2010 Medium
Department of Energy: Waste to Energy Information Administration184
2016 High
Statcan: Waste Disposal by Source185
2015 High
Mexico News Network186 2015 Medium
Eurostat 2015 High
Plastic waste as a percent of total municipal solid waste (%)
World Bank, “What a Waste”187 2012 High
Eurostat 2015 High
Waste Infrastructure
Presence of waste pickers (yes/no binary)
Global Alliance of Waste Pickers188
2016 Low
Policy (presence of extended producer
Pro Europe189 2017 High

72
responsibility requirements)
Demographics
Total population World Bank190 2015 High
Urban population World Bank191 2015 High
Population density (persons/sqkm)
World Bank192 2015 High
Land area (sqkm)
World Bank193 2015 High
Human Development
Human Development Index
United Nations Development Programme194
2014 High
Education Index United Nations Development Programme
2014 High
Life Expectancy United Nations Development Programme
2014 High
GINI Index CIA World Factbook195 Various High
Gross domestic product (GDP) per capita
World Bank196 2015 High
Additional Sources that Informed the Waste Model: 197 198 1 Pascual et al. (2010) The Economics of Ecosystems and Biodiversity – Chapter 5: The economics of valuing. Available online at http://doc.teebweb.org/wp-content/uploads/2013/04/D0-Chapter-5-The-economics-of-valuing-ecosystem-services-and-biodiversity.pdf. Accessed 2 Jan. 2017. 2 Hartmann, T (2014). Global Nature Fund. How Business Values Natural Capital. Available online at http://www.business-biodiversity.eu/global/download/%7BSYYFGQIDSY-6242014124559-MRIRELADKC%7D.pdf. Accessed 2 Jan. 2017.
73
3 Puma (2011). PUMA's Environmental Profit and Loss Account for the year ended 31 December 2010. Available online at http://glasaaward.org/wp-content/uploads/2014/01/EPL080212final.pdf. Accessed 2 Jan. 2017. 4 Natural Capital Coalition. Protocol. Available online at http://naturalcapitalcoalition.org/protocol/. Accessed 2 Jan. 2017. 5 Natural Capital Coalition. Protocol. Available online at http://naturalcapitalcoalition.org/protocol/. Accessed 2 Jan. 2017. 6 Novo Nordisk (2014). Novo Nordisk's environmental profit and loss account. Available online at http://www2.mst.dk/udgiv/publications/2014/02/978-87-93178-02-1.pdf. Accessed 3 Jan. 2017. 7 Puma (2011). PUMA's Environmental Profit and Loss Account for the year ended 31 December 2010. Available online at http://glasaaward.org/wp-content/uploads/2014/01/EPL080212final.pdf. Accessed 3 Jan. 2017. 8 Kering (2014). Kering Environmental Profit and Loss Account (E P&L). Available online at http://www.kering.com/en/sustainability/results. Accessed 3 Jan. 2017. 9 PwC (2015). Natural Capital - risks and opportunities. Available online at http://www.pwc.co.uk/services/sustainability-climate-change/total-impact/natural-capital-exploring-the-risks.html. Accessed 3 Jan. 2017. 10 Trucost (2015). TRUCOST'S VALUATION METHODOLOGY. Available online at http://www.gabi-software.com/fileadmin/GaBi_Databases/Thinkstep_Trucost_NCA_factors_methodology_report.pdf. Accessed 3 Jan. 2017. 11 Trucost (2013). Natural Capital at Risk: The Top 100 Externalities of Business. Available online at https://www.trucost.com/publication/natural-capital-risk-top-100-externalities-business/. Accessed 3 Jan. 2017. 12 Trucost (2016). Plastics and Sustainability: A Valuation of Environmental Benefits, Costs, and Opportunities for Continuous Improvement. Available online at https://plastics.americanchemistry.com/Plastics-and-Sustainability.pdf. Accessed 3 Jan. 2017. 13 UNEP (2014). VALUING Plastic: The Business Case for Measuring, Managing, and Disclosing Plastic Use in the Consumer Goods Industry. Available online at http://www.unep.org/pdf/ValuingPlastic/. Accessed 3 Jan. 2017. 14 Trucost (2016). Plastics and Sustainability: A Valuation of Environmental Benefits, Costs, and Opportunities for Continuous Improvement. Available online at https://plastics.americanchemistry.com/Plastics-and-Sustainability.pdf. Accessed 14 Mar. 2017. 15 " UNEP (2014). VALUING Plastic: The Business Case for Measuring, Managing, and Disclosing Plastic Use in the Consumer Goods Industry. Available online at http://www.unep.org/pdf/ValuingPlastic/. Accessed 3 Nov. 2016. 16 World Resources Institute and World Business Council for Sustainable Development. Corporate Standard: Greenhouse Gas Protocol. Available online at http://www.ghgprotocol.org/standards/corporate-standard. Accessed 5 Mar. 2017. 17 World Bank (2012). What a Waste: A Global Review of Solid Waste Management. Available online at http://siteresources.worldbank.org/INTURBANDEVELOPMENT/Resources/336387-1334852610766/What_a_Waste2012_Final.pdf. Accessed 13 Mar. 2017. 18 Ecoinvent Database (2014). Disposal, plastics mixture to sanitary landfill and plastics mixture to municipal incineration. Available at: http://www.ecoinvent.ch/ [Accessed: November 3, 2016]. 19 "Plastic waste inputs from land into the ocean | Science." http://science.sciencemag.org/content/347/6223/768. Accessed 13 Mar. 2017. 20 Ecoinvent Database (2014). Disposal, plastics mixture to sanitary landfill and plastics mixture to municipal incineration. Available at: http://www.ecoinvent.ch/ [Accessed: November 3, 2016]. 21 World Bank (2012). What a Waste: A Global Review of Solid Waste Management. Available online at http://siteresources.worldbank.org/INTURBANDEVELOPMENT/Resources/336387-1334852610766/What_a_Waste2012_Final.pdf. Accessed 13 Mar. 2017. 22 Ecoinvent (2014). Home. Available online at http://www.ecoinvent.ch/ [Accessed: November 3, 2016]. 23 Ecoinvent (2014). Home. Available online at http://www.ecoinvent.ch/ [Accessed: November 3, 2016].
74
24 World Bank (2012). What a Waste: A Global Review of Solid Waste Management. Available online at http://siteresources.worldbank.org/INTURBANDEVELOPMENT/Resources/336387-1334852610766/What_a_Waste2012_Final.pdf. Accessed 13 Mar. 2017. 25 "Plastic waste inputs from land into the ocean | Science." http://science.sciencemag.org/content/347/6223/768. Accessed 13 Mar. 2017. 26 PwC (2015). Natural Capital - risks and opportunities. Available online at http://www.pwc.co.uk/services/sustainability-climate-change/total-impact/natural-capital-exploring-the-risks.html. Accessed 2 Jan. 2017. 27 Trucost (2015). TRUCOST'S VALUATION METHODOLOGY. Available online at http://www.gabi-software.com/fileadmin/GaBi_Databases/Thinkstep_Trucost_NCA_factors_methodology_report.pdf. Accessed 2 Jan. 2017. 28 Food and Agriculture Organization of the United Nations (2015). Natural Capital Impacts in Agriculture. Available online at http://www.fao.org/fileadmin/templates/nr/sustainability_pathways/docs/Natural_Capital_Impacts_in_Agriculture_final.pdf. Accessed 14 Mar. 2017. 29 Trucost (2015). TRUCOST'S VALUATION METHODOLOGY. Available online at http://www.gabi-software.com/fileadmin/GaBi_Databases/Thinkstep_Trucost_NCA_factors_methodology_report.pdf. Accessed 5 Mar. 2017. 30 Trucost (2016). Plastics and Sustainability: A Valuation of Environmental Benefits, Costs, and Opportunities for Continuous Improvement. Available online at https://plastics.americanchemistry.com/Plastics-and-Sustainability.pdf. Accessed 14 Mar. 2017. 31 Rosegrant, Mark W. and Ringler, Claudia and Zhu, Tingju, Water for Agriculture: Maintaining Food Security Under Growing Scarcity (November 2009). Annual Review of Environment and Resources, Vol. 34, pp. 205-222, 2009. Available at SSRN: https://ssrn.com/abstract=1599085 or http://dx.doi.org/10.1146/annurev.environ.030308.090351 32 Ecoinvent Database (2014). Disposal, plastics mixture to sanitary landfill and plastics mixture to municipal incineration. Available at: http://www.ecoinvent.ch/ [Accessed: November 3, 2016]. 33 World Resources Institute and World Business Council for Sustainable Development. Corporate Standard: Greenhouse Gas Protocol. Available online at http://www.ghgprotocol.org/standards/corporate-standard. Accessed 5 Mar. 2017. 34 MJ Goedkoop, PRé Consultants (2010). Greenhouse Gas Protocol V1.01. Obtained from SimaPro 8.1.1.16. [Accessed: March 27, 2016]. 35 "Stern Review: The Economics of Climate Change." 2009. 3 Oct. 2016 <http://mudancasclimaticas.cptec.inpe.br/~rmclima/pdfs/destaques/sternreview_report_complete.pdf> 36 “COP21: Business seeks global carbon pricing at climate summit.” 2015. December 6. Financial Times. https://www.ft.com/content/e11d8346-98f8-11e5-95c7-d47aa298f769 Accessed 26 March 2017. 37 “The EU Emissions Trading System.” <https://ec.europa.eu/clima/policies/ets_en> Accessed 26 March 2017. 38 “Summary of California’s Cap-and-Trade Program.” <https://www.c2es.org/us-states-regions/action/california/cap-trade-regulation#sub5> Accessed 26 March 2017. 39 “What is the emissions trading scheme and does it work?” The Guardian. 2011. 7 June. < https://www.theguardian.com/environment/2011/jun/07/ets-emissions-trading> 40 "Historical Exchange Rates Tool & Forex History Data | OFX." <https://www.ofx.com/en-us/forex-news/historical-exchange-rates/> Accessed 5 Oct. 2016. 41 "Beijing Carbon Market | ChinaCarbon.net.cn." http://chinacarbon.net.cn/beijing-carbon-market/. Accessed 5 Apr. 2017. 42 "Shanghai Carbon Market | ChinaCarbon.net.cn." http://chinacarbon.net.cn/shanghai-carbon-market/. Accessed 5 Apr. 2017. 43 "Shanghai Carbon Market | ChinaCarbon.net.cn." http://chinacarbon.net.cn/shanghai-carbon-market/. Accessed 5 Apr. 2017. 44 "Shanghai Carbon Market | ChinaCarbon.net.cn." http://chinacarbon.net.cn/shanghai-carbon-market/. Accessed 5 Apr. 2017. 45 "Guangdong Carbon Market | ChinaCarbon.net.cn." http://chinacarbon.net.cn/guangdong-carbon-market/. Accessed 5 Apr. 2017.

75
46 "Shenzhen Carbon Market | ChinaCarbon.net.cn." http://chinacarbon.net.cn/shenzhen-carbon-market/. Accessed 5 Apr. 2017. 47 "Shenzhen Carbon Market | ChinaCarbon.net.cn." http://chinacarbon.net.cn/shenzhen-carbon-market/. Accessed 5 Apr. 2017. 48 "Shenzhen Carbon Market | ChinaCarbon.net.cn." http://chinacarbon.net.cn/shenzhen-carbon-market/. Accessed 5 Apr. 2017. 49 "Shenzhen Carbon Market | ChinaCarbon.net.cn." http://chinacarbon.net.cn/shenzhen-carbon-market/. Accessed 5 Apr. 2017. 50 "Tianjin Carbon Market | ChinaCarbon.net.cn." http://chinacarbon.net.cn/tianjin-carbon-market/. Accessed 5 Apr. 2017. 51 "Hubei Carbon Market | ChinaCarbon.net.cn." http://chinacarbon.net.cn/hubei-carbon-market/. Accessed 5 Apr. 2017. 52 "Chongqing Carbon Market | ChinaCarbon.net.cn." http://chinacarbon.net.cn/chongqing-carbon-market/. Accessed 5 Apr. 2017. 53 IETA (2015). ALBERTA: AN EMISSIONS TRADING CASE STUDY. Available online at https://ieta.wildapricot.org/resources/Resources/Case_Studies_Worlds_Carbon_Markets/alberta_case_study-may2015.pdf. Accessed 5 Apr. 2017. 54 "California Cap-and-Trade Program Summary of Auction Settlement ...." https://www.arb.ca.gov/cc/capandtrade/auction/results_summary.pdf. Accessed 5 Apr. 2017. 55 "California Cap-and-Trade Program Summary of Auction Settlement ...." https://www.arb.ca.gov/cc/capandtrade/auction/results_summary.pdf. Accessed 5 Apr. 2017. 56 "Auction Results - Regional Greenhouse Gas Initiative." https://www.rggi.org/market/co2_auctions/results. Accessed 5 Apr. 2017. 57 "auctions by the transitional common auction platform - European ...." 30 Jun. 2016, https://ec.europa.eu/clima/sites/clima/files/ets/auctioning/docs/cap_report_201606_en.pdf. Accessed 5 Apr. 2017. 58 "NZU:ERU Chart - Carbon Forest Services." http://www.carbonforestservices.co.nz/nzueru-chart.html. Accessed 5 Apr. 2017. 59 "CommTrade Carbon." https://www.commtrade.co.nz/. Accessed 5 Apr. 2017. 60 Switzerland Auctions. <https://www.emissionsregistry.admin.ch/crweb/public/auction/list.do;jsessionid=23ACC59C096434D27DF0564185DFEE92?org.apache.struts.taglib.html.TOKEN=e2bbc722ac5b9be090f9fb3520cea7c2> Accessed 15 Oct. 2016. 61 "State of the Voluntary Carbon Markets 2016 - Forest Trends." 22 May. 2016, http://www.forest-trends.org/documents/files/doc_5242.pdf. Accessed 5 Apr. 2017. 62 “Chile becomes the first South American country to tax carbon.” Reuters. 2014 27 September. <http://uk.reuters.com/article/carbon-chile-tax-idUKL6N0RR4V720140927> 63 "Historical Exchange Rates Tool & Forex History Data | OFX." https://www.ofx.com/en-us/forex-news/historical-exchange-rates/. Accessed 5 Apr. 2017. 64 "FINLAND: INVENTORY OF ESTIMATED BUDGETARY ... - OECD." http://www.oecd.org/site/tadffss/FIN.pdf. Accessed 5 Apr. 2017. 65 "Environmental Taxes in Denmark | CFE portal." http://www.cfe-eutax.org/taxation/environmental-taxes/denmark. Accessed 5 Apr. 2017. 66 "Chile becomes the first South American country to tax carbon | Reuters." 27 Sep. 2014, http://uk.reuters.com/article/carbon-chile-tax-idUKL6N0RR4V720140927. Accessed 5 Apr. 2017. 67 "Carbon Tax in Mexico." https://www.thepmr.org/system/files/documents/Carbon%20Tax%20in%20Mexico.pdf. Accessed 5 Apr. 2017. 68 "All the World's Carbon Pricing Systems in One Animated Map ...." 17 Nov. 2014, http://www.sightline.org/2014/11/17/all-the-worlds-carbon-pricing-systems-in-one-animated-map/. Accessed 5 Apr. 2017. 69 "carbon pricing watch 2016 - Open Knowledge Repository - World Bank." 25 Sep. 2015, https://openknowledge.worldbank.org/bitstream/handle/10986/24288/CarbonPricingWatch2016.pdf. Accessed 5 Apr. 2017.

76
70 "Options and Considerations for a Federal Carbon Tax | Center for ...." https://www.c2es.org/publications/options-considerations-federal-carbon-tax. Accessed 5 Apr. 2017. 71 “U.S. said to engage in talks on carbon market rules.” 2015 19 October. <https://www.bloomberg.com/news/articles/2015-10-19/u-s-said-to-propose-fallback-global-emissions-trading-markets> 72 “Colombia to launch voluntary carbon credit trading.” 2014 31 October. <http://in.reuters.com/article/colombia-carbontrading-idINL1N0SP2QT20141030> 73 “Promoting sustainable energy integration in Central America.” 2010 September. <http://pdf.usaid.gov/pdf_docs/Pnady222.pdf> 74 UNEP (2014). VALUING Plastic: The Business Case for Measuring, Managing, and Disclosing Plastic Use in the Consumer Goods Industry. Available online at http://www.unep.org/pdf/ValuingPlastic/. Accessed 3 Nov. 2016. 75 PwC (2015). Valuing corporate environmental. Available online at http://www.pwc.co.uk/services/sustainability-climate-change/total-impact/natural-capital-exploring-the-risks.html. Accessed 3 Oct. 2016. 76 PwC (2015). Natural Capital - risks and opportunities. Available online at http://www.pwc.co.uk/services/sustainability-climate-change/total-impact/natural-capital-exploring-the-risks.html. Accessed 3 Jan. 2017. 77 "Stern Review: The Economics of Climate Change." 2009. 3 Oct. 2016 <http://mudancasclimaticas.cptec.inpe.br/~rmclima/pdfs/destaques/sternreview_report_complete.pdf> 78 "Technical Support Document - The White House." 2016. 3 Oct. 2016 <https://www.whitehouse.gov/sites/default/files/omb/inforeg/scc_tsd_final_clean_8_26_16.pdf> 79 "PAGE model - Climate CoLab." 2016. 3 Oct. 2016 <http://climatecolab.org/wiki/-/wiki/page/PAGE> 80 "Report Attachment - Epa." 2016. 3 Nov. 2016 <https://yosemite.epa.gov/ee/epa/eerm.nsf/vwan/ee-0564-114.pdf> 81 "FUND - Climate Framework for Uncertainty, Negotiation and Distribution." 2007. 3 Nov. 2016 <http://www.fund-model.org/> 82 UNEP (2014). VALUING Plastic: The Business Case for Measuring, Managing, and Disclosing Plastic Use in the Consumer Goods Industry. Available online at http://www.unep.org/pdf/ValuingPlastic/. Accessed 3 Nov. 2016. 83 "Technical Support Document - The White House." 2016. Available online at https://www.whitehouse.gov/sites/default/files/omb/inforeg/scc_tsd_final_clean_8_26_16.pdf. Accessed 3 Oct. 2016. 84 Murray, J. and M. Lenzen. 2010. Introduction to input-output analysis. In J. Murray and R. Wood (Eds). The Sustainability Practitioner’s Guide to Input-Output Analysis. Common Ground Publishing. 85 Manfred Lenzen, Keiichiro Kanemoto, Daniel Moran, Arne Geschke. "Mapping the Structure of the World Economy" Environmental Science & Technology, 46(15), pp.8374-8381, 2012. 86 Manfred Lenzen, Daniel Moran, Keiichiro Kanemoto, Arne Geschke. "Building Eora: a Global Multi-Region Input-Output Database at High Country and Sector Resolution" Economic Systems Research, 25(1), pp.20-49, 2013. 87 Amcor Data on Sales Revenue for FY2016 by country 88 Ecoinvent Database. 2014. Disposal, plastics mixture to sanitary landfill and plastics mixture to municipal incineration. Available at: http://www.ecoinvent.ch/ [Accessed: November 3, 2016]. 89 Trucost (2015). TRUCOST'S VALUATION METHODOLOGY. Available online at http://www.gabi-software.com/fileadmin/GaBi_Databases/Thinkstep_Trucost_NCA_factors_methodology_report.pdf. Accessed 5 Mar. 2017. 90 Food and Agriculture Organization of the United Nations (2015). Natural Capital Impacts in Agriculture. Available online at http://www.fao.org/fileadmin/templates/nr/sustainability_pathways/docs/Natural_Capital_Impacts_in_Agriculture_final.pdf. Accessed 5 Mar. 2017. 91 Pfister, S., Koehler, A., and Hellweg, S. (2009). Assessing the Environmental Impacts of Freshwater Consumption in LCA. Environmental Science & Technology 43 (11), 4098-4104 DOI: 10.1021/es802423e.

77
92 Pfister,S.(2011).Environmentalevaluationoffreshwaterconsumptionwithintheframeworkoflifecycleassessment.DISS.ETHNO.19490.ETHZURICH. 93 Pfister, et. al. (Eco-Indicator 99) (2009). Human health and ecosystem quality impact data. Accessed January 26, 2017. 94 Trucost (2015). TRUCOST'S VALUATION METHODOLOGY. Available online at http://www.gabi-software.com/fileadmin/GaBi_Databases/Thinkstep_Trucost_NCA_factors_methodology_report.pdf. Accessed 5 Mar. 2017. 95 Costanza et al. (1998). The value of ecosystem services: putting the issues in perspective. Ecological Economics 25, 67-72. 96 De Groot et al. (2012). Global estimates of the value of ecosystems and their services in monetary units. Ecosystem Services 1(1), 50-61. 97 Costanza et al. (2014). Changes in the global value of ecosystem services. Global Environmental Change 26, 152-158. 98 Olson, D.M., E. Dinerstein, E.D. Wikramanayake, N.D. Burgess, G.V.N. Powell, E.C. Underwood, J.A. D'Amico, H.E. Strand, J.C. Morrison, C.J. Loucks, T.F. Allnutt, J.F. Lamoreux, T.H. Ricketts, I. Itoua, W.W. Wettengel, Y. Kura, P. Hedao, and K. Kassem. 2001. Terrestrial ecoregions of the world: A new map of life on Earth. BioScience 51(11):933-938. 99 ArcGIS. World Countries Shapefile. Available online at https://www.arcgis.com/home/item.html?id=3864c63872d84aec91933618e3815dd2. Accessed 28 Mar. 2017. 100 Trucost (2015). TRUCOST'S VALUATION METHODOLOGY. Available online at http://www.gabi-software.com/fileadmin/GaBi_Databases/Thinkstep_Trucost_NCA_factors_methodology_report.pdf. Accessed 5 Mar. 2017. 101 Chapin et al. (2011). Principles of Terrestrial Ecosystem Ecology Available online at http://www.springer.com/us/book/9781441995032. Accessed 13 Mar. 2017. 102 Bolin, B., Degens, E.T., Kempe, S., Ketner, P. (1977). The global carbon cycle. SCOPE 13. John Wiley, New York. 103 Costanza et al. (1998). The value of ecosystem services: putting the issues in perspective. Ecological Economics 25, 67-72. 104 Costanza et al. (2007). Biodiversity and ecosystem services: A multi-scale empirical study of the relationship between species richness and net primary productivity. Ecological Economics 61(2-3), 478-491. 105 Pfister, et. al. (Eco-Indicator 99). 2009. Human health and ecosystem quality impact data. Accessed January 26, 2017. 106 UNEP (2014) Valuing Plastics: The Business Case for Measuring, Managing and Disclosing Plastic Use in the Consumer Goods Industry. 107 Trucost (2016). Plastics and Sustainability: A Valuation of Environmental Benefits, Costs, and Opportunities for Continuous Improvement. Available online at https://plastics.americanchemistry.com/Plastics-and-Sustainability.pdf. Accessed 14 Mar. 2017. 108 World Bank (2012). What a Waste: A Global Review of Solid Waste Management. Available online at http://siteresources.worldbank.org/INTURBANDEVELOPMENT/Resources/336387-1334852610766/What_a_Waste2012_Final.pdf. Accessed 13 Mar. 2017. 109 Jambeck et al. (2015). "Plastic waste inputs from land into the ocean. Science 347 (6223), 768-771 DOI: 10.1126/science.1260352. 110 Jambeck et al. (2015). "Plastic waste inputs from land into the ocean. Science 347 (6223), 768-771 DOI: 10.1126/science.1260352. 111 Jambeck et al. (2015). "Plastic waste inputs from land into the ocean. Science 347 (6223), 768-771 DOI: 10.1126/science.1260352. 112 Ecoinvent Database. 2014. Disposal, plastics mixture to sanitary landfill and plastics mixture to municipal incineration. Available at: http://www.ecoinvent.ch/ [Accessed: November 3, 2016]. 113 Nahman,A.2014.Pricinglandfillexternalities:emissionsanddisamenitycostsinCapeTown,SouthAfrica.WasteManagement,31(9-10),pp.2046-56.doi:10.1016/j.wasman.2011.05.015 114 Trucost (2016). Plastics and Sustainability: A Valuation of Environmental Benefits, Costs, and Opportunities for Continuous Improvement. Available online at https://plastics.americanchemistry.com/Plastics-and-Sustainability.pdf. Accessed 25 Mar. 2017.
78
115 Eshet,T.,Baron,M.andShechter,M.2007.ExploringBenefitTransfer:DisamenitiesofWasteTransferStations.Environ-mentalandResourceEconomics,37(3),pp.521-547.Availablefrom:doi:10.1007/s10640-006-9047-6. 116 PwC (2015). Natural Capital - risks and opportunities. Available online at http://www.pwc.co.uk/services/sustainability-climate-change/total-impact/natural-capital-exploring-the-risks.html. Accessed 3 Jan. 2017. 117 Cambridge Econometrics, EFTEC & WRc (2003). A study to estimate the disamenity costs of landfill in Great Britain, Defra 118 ExternE (2004). New results of ExternE, after the NewExt and ExtenE-Pol projects. http://www.externe.info 119 Trucost (2016). Plastics and Sustainability: A Valuation of Environmental Benefits, Costs, and Opportunities for Continuous Improvement. Available online at https://plastics.americanchemistry.com/Plastics-and-Sustainability.pdf. Accessed 14 Mar. 2017. 120 Trucost (2016). Plastics and Sustainability: A Valuation of Environmental Benefits, Costs, and Opportunities for Continuous Improvement. Available online at https://plastics.americanchemistry.com/Plastics-and-Sustainability.pdf. Accessed 14 Mar. 2017. 121 UNEP (2014) Valuing Plastics: The Business Case for Measuring, Managing and Disclosing Plastic Use in the Consumer Goods Industry. Available online at http://www.unep.org/pdf/ValuingPlastic/. Accessed 3 Nov. 2016. 122 Camuzeaux, J. (2016). How Companies Set Internal Prices on Carbon. http://blogs.edf.org/markets/2016/12/08/how-companies-set-internal-prices-on-carbon/. Accessed April 5, 2017. 123 UNEP (2014) Valuing Plastics: The Business Case for Measuring, Managing and Disclosing Plastic Use in the Consumer Goods Industry. Available online at http://www.unep.org/pdf/ValuingPlastic/. Accessed 3 Nov. 2016. 124 Mohan, Anne Marie. “Can we solve the flexible film recovery puzzle?” Packaging World, 17 Jan 2016. http://www.packworld.com/sustainability/recycling/canwesolveflexiblefilmrecoverypuzzle. 125 World Economic Forum and Ellen MacArthur Foundation, The New Plastics Economy – Catalysing action (2017, http://www.ellenmacarthurfoundation.org/publications). 126 Mohan, Anne Marie. “Can we solve the flexible film recovery puzzle?” Packaging World, 17 Jan 2016. http://www.packworld.com/sustainability/recycling/canwesolveflexiblefilmrecoverypuzzle. 127 “Converted Flexible Packaging.” Freedonia, Oct 2015, http://www.freedoniagroup.com/industry-study/converted-flexible-packaging-3333.htm. 128 “Can We Recycle Flexible Plastic Packaging?” Plastics Make It Possible, 14 Dec 2016, https://www.plasticsmakeitpossible.com/plastics-recycling/can-recycle-flexible-plastic-packaging/. 129 Mohan, Anne Marie. “Can we solve the flexible film recovery puzzle?” Packaging World, 17 Jan 2016. http://www.packworld.com/sustainability/recycling/canwesolveflexiblefilmrecoverypuzzle. 130 Johnson, Jim. “Speakers: Pouch Makers Must Be Proactive on End-of-Life Issues.” Plastics News, 18 June 2015, www.plasticsnews.com/article/20150618/NEWS/150619901. 131 “Sustainable Packaging.” Flexible Packaging Association, https://www.flexpack.org/sustainable-packaging/. 132 Johnson, Jim. “Speakers: Pouch Makers Must Be Proactive on End-of-Life Issues.” Plastics News, 18 June 2015, www.plasticsnews.com/article/20150618/NEWS/150619901. 133 Johnson, Jim. “Early research into recycling flexible packaging shows promise.” Plastics News, 12 April 2016, http://www.plasticsnews.com/article/20160412/NEWS/160419974/early-research-into-recycling-flexible-packaging-shows-promise. 134 Homepage, Flexible Packaging Association, https://www.flexpack.org/. 135 Hopewell, Jefferson, Robert Dvorak, and Edward Kosior. “Plastics Recycling: Challenges and Opportunities.” Philosophical Transactions of the Royal Society B: Biological Sciences 364.1526 (2009): 2115–2126, https://www.ncbi.nlm.nih.gov/pmc/articles/PMC2873020/ 136 “The State of Play on Extended Producer Responsibility (EPR): Opportunities and Challenges.” OECD, 10 June 2014, https://www.oecd.org/environment/waste/Global%20Forum%20Tokyo%20Issues%20Paper%2030-5-2014.pdf. 137 Rokka, J. and Uusitalo, L. (2008), Preference for green packaging in consumer product choices – Do consumers care?. International Journal of Consumer Studies, 32: 516–525.

79
138 Rokka, J. and Uusitalo, L. (2008), Preference for green packaging in consumer product choices – Do consumers care?. International Journal of Consumer Studies, 32: 516–525. doi:10.1111/j.1470-6431.2008.00710.x 139 Royte, Elizabeth. “Consumers Love Squeezable Plastic Pouches for Food - Too Bad Recyclers Hate Them.” Pacific Standard, Pacific Standard, 5 Jan. 2016, psmag.com/consumers-love-squeezable-plastic-pouches-for-food-too-bad-recyclers-hate-them-ad7cf0e46db9. 140 Kimberly Klaiman, David L. Ortega, Cloé Garnache, Consumer preferences and demand for packaging material and recyclability, Resources, Conservation and Recycling, Volume 115, December 2016, Pages 1-8, http://www.sciencedirect.com/science/article/pii/S0921344916302130 141 Personal Interview, Emily Tipaldo, American Chemical Council. 7 December 2016. 142 Personal Interview, Emily Tipaldo, American Chemical Council. 7 December 2016. 143 “Plastics and Sustainability: A Valuation of Environmental Benefits, Costs and Opportunities for Continuous Improvement.” Trucost, July 2016, https://plastics.americanchemistry.com/Plastics-and-Sustainability.pdf. 144 Zhang, Han. Personal Interview, Dow Chemical. 24 October 2016. 145 Defruyt, Sander. Personal Interview, Ellen MacArthur Foundation. 19 December 2016. 146 Defruyt, Sander. Personal Interview, Ellen MacArthur Foundation. 19 December 2016. 147 Defruyt, Sander. Personal Interview, Ellen MacArthur Foundation. 19 December 2016. 148 Zhang, Han. Personal Interview, Dow Chemical. 24 October 2016. 149 Defruyt, Sander. Personal Interview, Ellen MacArthur Foundation. 19 December 2016. 150 Danielson, Joi. Personal Interview, Ocean Conservancy. 18 January 2017. 151 Houlder, Graham. Personal Interview, AluFoil. 5 December 2016. 152 “Country Comparison: Distribution of Family Income: Gini Index.” CIA: The World Factbook, https://www.cia.gov/library/publications/the-world-factbook/rankorder/2172rank.html. Accessed March 2017. 153 Bellù, Lorenzo Giovanni, and Paolo Liberati. "Inequality Analysis: The Gini Index." EASYPOL. Food and Agriculture Organization of the United Nations, FAO. <http://www.fao.org/docs/up/easypol/329/gini_index_040en.pdf>. 154 “Income Inequality Measures.” Journal of Epidemiology and Community Health 61.10 (2007): 849–852. PMC. Web. 18 Apr. 2017. 155 Zhang, Han. Personal Interview, Dow Chemical. 24 October 2016. 156 “Carton Recycling Access Reaches New Heights.” Carton Council, 26 Jan 2016, “http://swana.org/Portals/0/News/IndustryWatch/02-2016/Carton%20Council%20-%202015%20Progress.pdf. 157 “2014 National Postconsumer Plastic Bag & Film Recycling Report.” Moore Recycling Associates Inc, January 2016, https://plastics.americanchemistry.com/Education-Resources/Publications/2014-National-Postconsumer-Plastic-Bag-Film-Recycling-Report.pdf. 158 “Recycling rates for packaging waste.” Eurostat, http://ec.europa.eu/eurostat/tgm/refreshTableAction.do?tab=table&plugin=1&pcode=ten00063&language=en, 2014. 159 Reducing Barriers to International Trade in Non-hazardous Recyclable Materials and Waste: Exploring the Environmental and Economic Benefits." Organisation for Economic Co-operation and Development, <http://www.oecd.org/officialdocuments/publicdisplaydocumentpdf/?cote=COM/TAD/ENV/JWPTE(2008)27/ANN&docLanguage=En> 160 Suwannapan, Tantima, "Assessment of Beverage Carton Waste in Thailand Using Material Flow Analysis." Asian Institute of Technology. <http://faculty.ait.ac.th/visu/public/uploads/images/pdf/2014/tantima.pdf> 161 Plastic Products, Plastic Waste and Resource Recovery." PWMI Newsletter 11.1 (1988): 1-16. Plastic Waste Management Institute. <https://www.pwmi.or.jp/ei/siryo/ei/ei_pdf/ei46.pdf 162 Lodha, Gaurav, and M.W. Sheikh. "Plastic Pollution in Cities of Mumbai and Thane."International Multidisciplinary Research Journal 1.4 (<http://www.rhimrj.com/admin/upload/-upload-NOV14010419.pdf> 163 Truc, Nguyen Thi Thanh, Chi-Hyeon Lee, Byeong-Kyu Lee, and Srinivasa Reddy Mallampati. "Separation of Hazardous Brominated Plastics from Waste Plastics by Froth Flotation after Surface Modification with Mild Heat-Treatment." World Academy of Science, Engineering and Technology,. <http://waset.org/publications/10003189/separation-of-hazardous-brominated-plastics-from-waste-plastics-by-froth-flotation-after-surface-modification-with-mild-heat-treatment>.
80
164 "Advancing Sustainable Materials Management: Facts and Figures." EPA. Environmental Protection Agency, 12 Apr. 2017. <https://www.epa.gov/smm/advancing-sustainable-materials-management-facts-and-figures>. 165"Recent European and American Waste Plastics Recycling." Injection Molding Network. <http://injectionmolding.0086zhusu.com/zhusu_1/content/?1060.html>. 166 Paben, Jared. "How Plastic Packaging Stewardship Is Playing out in Canada." Plastics Recycling Update, 27 Dec. 2016. <https://resource-recycling.com/plastics/2016/07/19/how-plastic-packaging-stewardship-is-playing-out-in-canada/>. 167 "Plastics – the Facts 2016." PlasticsEurope. European Association of Plastics Recycling & Recovry Organization. Web. <http://www.plasticseurope.org/documents/document/20161014113313-plastics_the_facts_2016_final_version.pdf> 168 Environmental Protection Agency - Advancing Sustainable Materials: https://www.epa.gov/sites/production/files/2015-09/documents/2013_advncng_smm_fs.pdf 169 "Waste Disposal by Source." Statcan, http://www.statcan.gc.ca/tables-tableaux/sum-som/l01/cst01/envir25a-eng.htm, 2014. 170 "Mexico – Plastic Materials/Resins." Export.gov, https://www.export.gov/article?id=Mexico-Plastic-Materials-Resins, 2016. 171 “Municipal waste by waste operations.” Eurostat, http://appsso.eurostat.ec.europa.eu/nui/show.do?dataset=env_wasmun&lang=en, 2015. 172 “Municipal Solid Waste Management: Opportunities for Russia.” International Finance Corporation, http://www.ifc.org/wps/wcm/connect/a00336804bbed60f8a5fef1be6561834/PublicationRussiaRREP-SolidWasteMngmt-2012-en.pdf?MOD=AJPERES, 2012. 173 "Advancing Sustainable Materials." Environmental Protection Agency, https://www.epa.gov/sites/production/files/2015-09/documents/2013_advncng_smm_fs.pdf, 2013. 174 "Your Key to European Statistics." Recycling Rate of Municipal Waste - Eurostat. Eurostat. Web. 18 Apr. 2017. <http://ec.europa.eu/eurostat/web/products-datasets/-/t2020_rt120>. 175 "Global Recycling Markets: Plastic Waste." International Solid Waste Association, n.d. Web. <https://www.iswa.org/fileadmin/galleries/Task_Forces/TFGWM_Report_GRM_Plastic_China_LR.pdf>. 176 Visvanathan, C., and Integrated Research System For Sustainability Science (Ir3S), The University Of Tokyo. "Http://www.ir3s.u-tokyo.ac.jp/3e-nexus/pdf/022414/session02-01.pdf." Asian Institute of Technology, n.d. Web. <http://www.ir3s.u-tokyo.ac.jp/3e-nexus/pdf/022414/session02-01.pdf>. 177 "Municipal Waste Status Report." AIT/UNEP Regional Resource Center for Asia and the Pacific (2010): n. pag. Web. <http://www.rrcap.ait.asia/Publications/MW_status_quo.pdf>. 178 Statista. The Statistics Portal. <https://www-statista-com.proxy.lib.umich.edu/>. 179 UNSD Environmental Indicators. United Nations Statistics Division. <https://unstats.un.org/unsd/environment/qindicators.htm>. 180 Chaerul, Mochammad. "Recycling of Plastic Packaging Waste in Bandung City, Indonesia."SpringerLink. Springer Japan, 18 Oct. 2013. <https://link.springer.com/article/10.1007/s10163-013-0201-2>. 181 “Municipal Waste”, OECD Environmental Statistics, http://www.keepeek.com/Digital-Asset-Management/oecd/environment/environment-at-a-glance-2015_9789264235199-en#page52, 2015. 182 "Waste to Energy Information Administration." Department of Energy, http://www.eia.gov/energyexplained/index.cfm/data/index.cfm?page=biomass_waste_to_energy, 2016. 183 "Waste to Energy Plant." Mexico News Network, http://www.mexiconewsnetwork.com/adventure/waste-energy-plant/, 2015. 184 "Waste to Energy Information Administration." Department of Energy, http://www.eia.gov/energyexplained/index.cfm/data/index.cfm?page=biomass_waste_to_energy, 2016. 185 "Waste Disposal by Source." Statcan, http://www.statcan.gc.ca/tables-tableaux/sum-som/l01/cst01/envir25a-eng.htm, 2014. 186 "Waste to Energy Plant." Mexico News Network, http://www.mexiconewsnetwork.com/adventure/waste-energy-plant/, 2015. 187 “What a Waste: A Global Review of Solid Waste Management.” World Bank, http://siteresources.worldbank.org/INTURBANDEVELOPMENT/Resources/336387-1334852610766/What_a_Waste2012_Final.pdf, 2012.
81
188 Global Alliance of Waste pickers, http://globalrec.org/ 189 ProEurope, http://www.pro-e.org/Introduction-to-PRO-EUROPE.html, 2017. 190 Population, total.” World Bank, http://data.worldbank.org/indicator/SP.POP.TOTL, 2015. 191 “Urban population.” World Bank, http://data.worldbank.org/indicator/SP.URB.TOTL.IN.ZS, 2015. 192 “Population density (people per sq. km of land area.” World Bank, http://data.worldbank.org/indicator/EN.POP.DNST?locations=AL, 2015. 193 “Land area.” World Bank, http://data.worldbank.org/indicator/AG.LND.TOTL.K2, 2015. 194 "Human Development Reports." Human Development Data (1990-2015) | Human Development Reports. UNITED NATIONS DEVELOPMENT PROGRAMME. 18 Apr. 2017. <http://hdr.undp.org/en/data>. 195 “Country Comparison: Distribution of Family Income: Gini Index.” CIA: The World Factbook, https://www.cia.gov/library/publications/the-world-factbook/rankorder/2172rank.html. Accessed March 2017. 196 “GDP per capita.” World Bank, http://data.worldbank.org/indicator/NY.GDP.PCAP.CD, 2015. 197 Journal of Material Cycles and Waste Management, Official Journal of the Japan Society of Material Cycles and Waste Management (JSMCWM) and the Korea Society of Waste Management (KSWM) 198 Encyclopedia of Consumption and Waste: The Social Science of Garbage, http://sk.sagepub.com.proxy.lib.umich.edu/reference/consumption-waste