a multisatellite climatology of clouds, radiation, and
TRANSCRIPT

A multisatellite climatology of clouds, radiation,and precipitation in southern West Africaand comparison to climate modelsPeter G. Hill1, Richard P. Allan1, J. Christine Chiu1, and Thorwald H. M. Stein1
1Department of Meteorology, University of Reading, Reading, UK
Abstract SouthernWest Africa (SWA) has a large population that relies on highly variablemonsoon rainfall,yet climate models show little consensus over projected precipitation in this region. Understanding of thecurrent and future climate of SWA is further complicated by rapidly increasing anthropogenic emissions and alack of surface observations. Using multiple satellite observations, the ERA-Interim reanalysis, and fourclimate models, we document the climatology of cloud, precipitation, and radiation over SWA in June–July,highlight discrepancies among satellite products, and identify shortcomings in climate models andERA-Interim. Largedifferences exist betweenmonthlymean cloud cover estimates from satellites, which rangefrom 68 to 94%. In contrast, differences among satellite observations in top of atmosphere outgoing radiationand surface precipitation are smaller, with monthly means of about 230Wm�2 of longwave radiation,145Wm�2 of shortwave radiation, and5.87mmd�1 of precipitation. Both ERA-Interim and the climatemodelsshow less total cloud cover than observations, mainly due to underestimating low cloud cover. Errors in cloudcover, along with uncertainty in surface albedo, lead to a large spread of outgoing shortwave radiation.Both ERA-Interim and the climate models also show signs of convection developing too early in the diurnalcycle, with associated errors in the diurnal cycles of precipitation and outgoing longwave radiation. Clouds,radiation, and precipitation are linked in an analysis of the regional energy budget, which shows thatinterannual variability of precipitation and dry static energy divergence are strongly linked.
1. Introduction
West Africa is currently experiencing a rapid growth in population and associated air pollution; it is alsosubject to the substantial variability of theWest Africanmonsoon (WAM) rains, making this region particularlyvulnerable to climatic impacts relating to health and food security [Knippertz et al., 2015b]. Monsoonprecipitation and related large-scale processes show variability at both intraseasonal [Sultan et al., 2003; Guand Adler, 2004] and interannual [Sylla et al., 2009; Jianping and Qingcun, 2003] scales. This rainfall variabilityaffects regional crop yields [Sultan et al., 2005a] and has been connected to meningitis outbreaks [Sultanet al., 2005b]. The WAM is intimately linked with the global atmospheric circulation, and consequently, itsimpacts spread beyond Africa. For example, modeling studies have shown that a strong monsooncontributes to the positive phase of the North Atlantic Oscillation [Gaetani et al., 2011].
The most populous part of West Africa is predominantly urban and concentrated along the southern coastalregions [Nelson, 2004], yet there is a general lack of surface observations in southern West Africa (SWA) andthe region remains understudied [Knippertz et al., 2015a]. Consequently, this highly populated region remainsrelatively poorly understood and the complex interplay between clouds, precipitation, radiation, aerosolpollution, and the WAM further motivates detailed investigations into the climate and the physical driversof variability across this region.
The West African monsoon season runs between March and October. During this period the southern coastalregions experience two rainy seasons separated by a short dry season [Le Barbé et al., 2002]. The first wet sea-son runs from March to June, with maximum precipitation along the coast in May. The IntertropicalConvergence Zone (ITCZ) and consequently much of the precipitation shift farther north in June/July, whichleads to increased cloudiness and is the focus period for this study. With the ITCZ to the north, the coastalregions experience a short dry season during July and August, which is linked to stronger subsidence asso-ciated with outflows from deep convection to the north [Omotosho, 1988]. The ITCZ retreats back towardthe coast, bringing a second wet season from September to October.
HILL ET AL. MULTISATELLITE CLIMATOLOGY IN SWA 1
PUBLICATIONSJournal of Geophysical Research: Atmospheres
RESEARCH ARTICLE10.1002/2016JD025246
Key Points:• Satellite estimates of cloud cover at allheights show large differences
• Interannual variability of surfaceprecipitation and dry static energydivergence are strongly linked
• AMIP5 models are unable toreproduce the observed meancloud, radiation, and precipitation insouthern West Africa
Supporting Information:• Supporting Information S1
Correspondence to:P. G. Hill,[email protected]
Citation:Hill, P. G., R. P. Allan, J. C. Chiu, andT. H. M. Stein (2016), A multisatelliteclimatology of clouds, radiation, andprecipitation in southern West Africaand comparison to climate models,J. Geophys. Res. Atmos., 121, doi:10.1002/2016JD025246.
Received 18 APR 2016Accepted 1 SEP 2016Accepted article online 5 SEP 2016
©2016. American Geophysical Union.All Rights Reserved.

During the monsoon season, SWA experiences a complex pattern of cloud types with a pronounced diurnalcycle. Stein et al. [2011] identified numerous distinct cloud types in this region, from CloudSat and CALIPSO,with notable differences in cloud type, frequency of occurrence, and amount when present between the dayand night overpasses. Moreover, low-level stratus has been found to occur frequently, with maximum extentbetween 0900 and 1000UTC andminimum around 1800UTC [van der Linden et al., 2015; Schrage et al., 2006].
General circulation models struggle to correctly simulate the complex observed cloud and precipitation cli-matology in SWA. Hourdin et al. [2010] showed large accumulated precipitation differences between themodels that participated in the African Monsoon Multidisciplinary Analysis Model Intercomparison Projectthroughout West Africa. Knippertz et al. [2011] found that Coupled Model Intercomparison Project phase 3(CMIP3) models show little consensus on themean July–September cloud cover in this region and on averageallow too much solar radiation to reach the surface. Cloud and precipitation errors persist in the CMIP5 mod-els, which show large zonal mean precipitation and cloud radiative effect differences throughout West Africaand have problems with the timing and magnitude of the diurnal cycle of precipitation [Roehrig et al., 2013].Even numerical weather prediction models at convection-permitting resolution can have large cloud errors inSWA; Stein et al. [2015] showed that the Met Office Unified Model overestimates low cloud cover and under-estimates anvil cloud cover at all resolutions from 40 to 1.5 km. Cloud errors in SWA can have a large impacton radiation [Knippertz et al., 2011], which in turn may affect the broader circulation [Li et al., 2015; Marshamet al., 2013]. In light of these problems simulating present-day climate, it is perhaps unsurprising that projec-tions of future precipitation in West Africa show large diversity, for both regional [Paeth et al., 2011] and glo-bal coupled [Cook and Vizy, 2006] models.
The uncertainty arising from existing model deficiencies is compounded by rapid increases in anthropogenicemissions in SWA; aerosol concentrations in SWA are poorly understood, as are their interactions with clouds[Knippertz et al., 2015b]. The Dynamics-Aerosol-Chemistry-Cloud Interactions in West Africa (DACCIWA) pro-ject [Knippertz et al., 2015a] aims to improve our understanding of the physical and chemical processes in thisregion, through an extensive field campaign in SWA, including a multiaircraft campaign in June–July 2016,and a broad range of modeling studies.
The present study aims to document and understand the climatology of clouds, radiation, precipitation, andtheir interconnections by combining observations and simulations in June–July over the region of WestAfrica centered upon 5–10°N and 8°W–8°E, which we shall hereafter refer to as the DACCIWA region. The pri-mary motivation is to improve understanding of the physical processes determining the climate of thisregion, to highlight deficiencies in the reanalysis and climate model simulations and to provide context forand interpretation of upcoming planned observational campaigns such as the DACCIWA project. While pre-cipitation is of great importance for health and agriculture, links between the water and energy cycles andthe complex interaction between cloud, aerosol, and radiation require a holistic approach in evaluating theclimate of this region. For this purpose we rely upon satellite measurements which are able to capture thelarge-scale structure of clouds and radiation and greatly add to the limited surface observations available.Advancing on previous studies [Knippertz et al., 2011; Stein et al., 2011; Roehrig et al., 2013; van der Lindenet al., 2015], we make detailed assessment of multiple satellite products and consider state of the art climatemodel simulations including their representation of the diurnal cycle within a focused region. Driving ques-tions are as follows: what are the primary characteristics of the climatology of this region, which satelliteobservations are most suitable for analysis, what are the primary model biases, and what aspects of the cli-mate system are poorly understood for this region? This analysis therefore also seeks to inform and prioritizefuture and ongoing observations and research undertaken as part of the DACCIWA project. The following sec-tions outline the observations used and detail the climatology of clouds, radiation, and precipitation and theirdiurnal cycle in observations, reanalyses, and climate model simulations.
2. Data Sets
This study considers the wider southern West Africa region shown in Figure 1 but focuses in particular on thearea 8°W–8°E and 5–10°N, as highlighted by the dotted boxes, which we refer to as the DACCIWA region.These boundaries were chosen to avoid the Guinea Highlands to the west, the Jos Plateau to the east, andthe Gulf of Guinea to the south. This results in a domain that is large enough to reduce statistical samplingerrors but sufficiently homogeneous for domain-mean values to be meaningful and matches that used for
Journal of Geophysical Research: Atmospheres 10.1002/2016JD025246
HILL ET AL. MULTISATELLITE CLIMATOLOGY IN SWA 2
averaging in the modeling component of the DACCIWA project. The DACCIWA region consists of forests andcropland near the coast, with wooded savannas farther inland and savannas to the north of the domain. Wefocus on the months of June and July coinciding with the progression of the summer monsoon and forconsistency with the planned DACCIWA aircraft campaign [Knippertz et al., 2015a].
As noted in section 1, June–July is a transition period for the DACCIWA region. However, June–July differ-ences (see supporting information) are generally quite small. Cloud cover differences between June andJuly are much smaller than the differences between different satellite cloud cover products discussed inthe following section. Moreover, observed differences in clouds, precipitation, and top of atmosphere radia-tion between June and July are smaller than the errors in the climate models and ERA-Interim discussed insection 4.
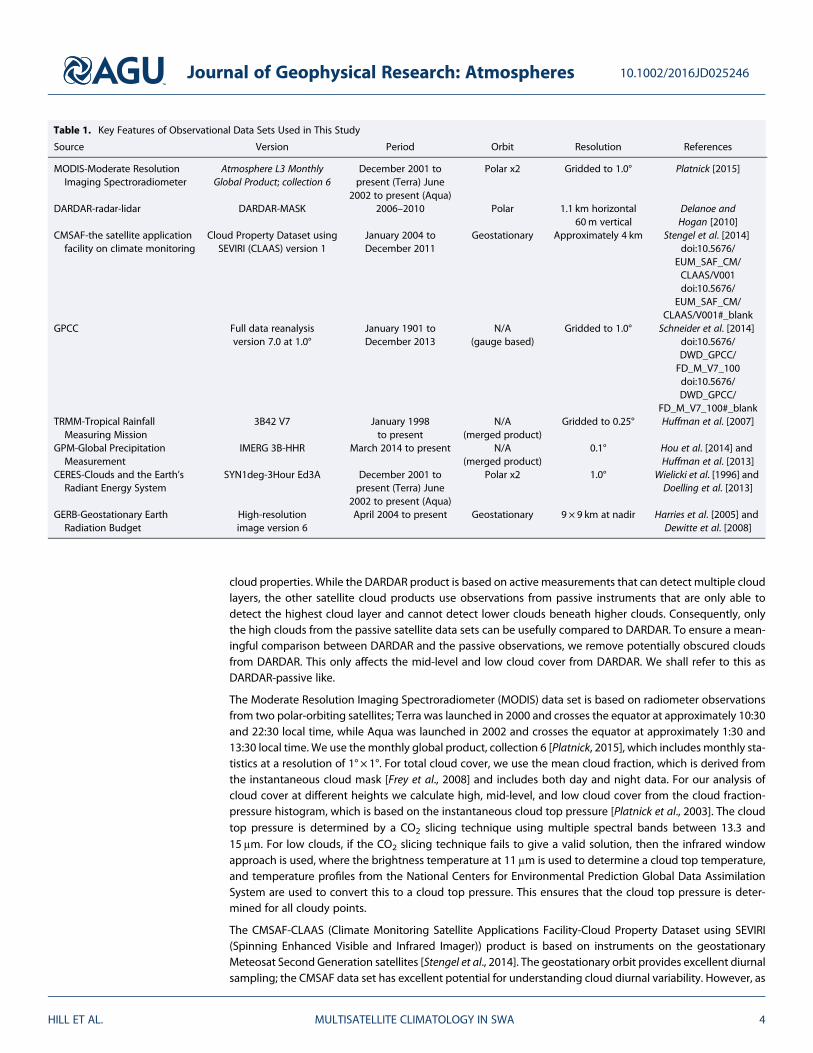
We use seven observational data sets including retrievals from both active and passive sensors and from bothSun synchronous and geostationary orbiting satellites. Expanded acronyms and key properties for these datasets are summarized in Table 1. As few of the data sets exist prior to 2000, we focus on 2000 to present. Forease of comparison, the observational data sets, ERA-Interim, and the climate models are all regridded to aresolution of 1°.
Longwave cloud radiative effects are strongly dependent on the temperature and consequently height of acloud. To facilitate our understanding of cloud-radiation interactions, we consider cloud cover at differentheights, with separate values of cloud cover for high clouds (tops above 440 hPa), mid-level clouds (topsbetween 440 and 800 hPa), and low clouds (tops below 800 hPa). These thresholds were chosen as theyare already in use in many of the data sets considered and consequently can be applied consistently acrossclimate models, ERA-Interim, and observations.
2.1. Satellite Products
The DARDAR [Delanoe and Hogan, 2010] product is based on combined CloudSat radar [Stephens et al., 2002]and CALIPSO lidar [Winker et al., 2009] observations at 1:30 and 13:30 local time, providing vertically resolved
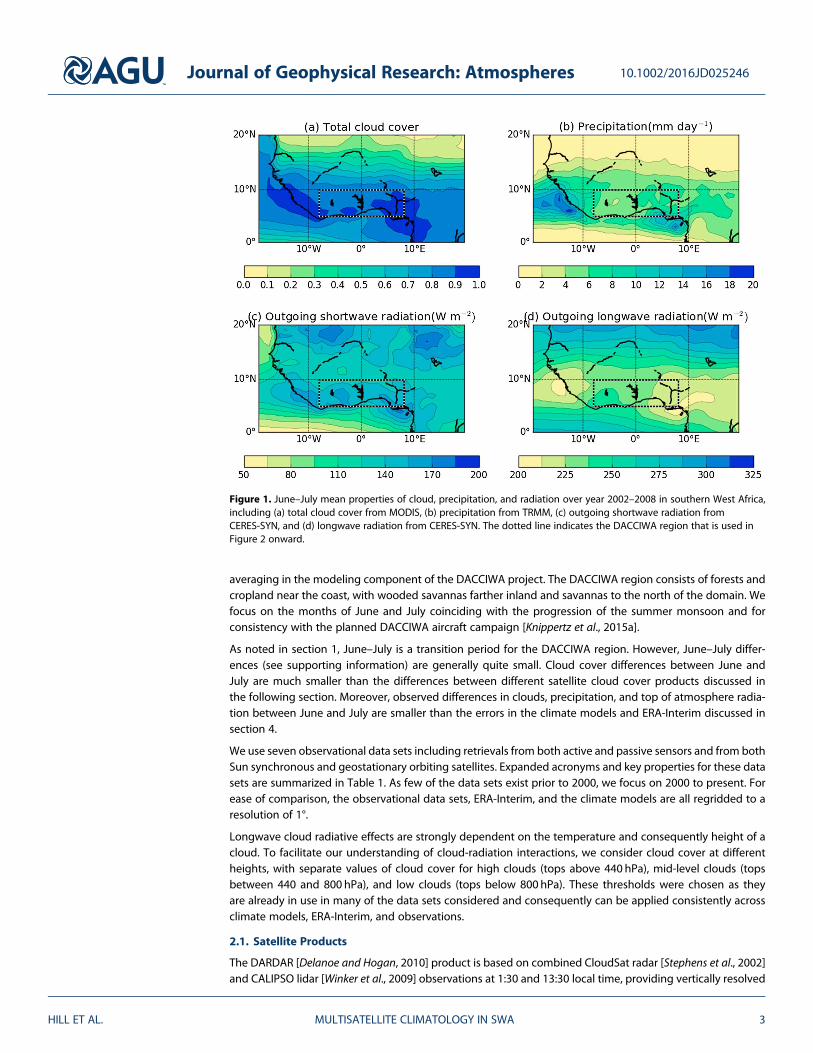
Figure 1. June–July mean properties of cloud, precipitation, and radiation over year 2002–2008 in southern West Africa,including (a) total cloud cover from MODIS, (b) precipitation from TRMM, (c) outgoing shortwave radiation fromCERES-SYN, and (d) longwave radiation from CERES-SYN. The dotted line indicates the DACCIWA region that is used inFigure 2 onward.
Journal of Geophysical Research: Atmospheres 10.1002/2016JD025246
HILL ET AL. MULTISATELLITE CLIMATOLOGY IN SWA 3
cloud properties. While the DARDAR product is based on active measurements that can detect multiple cloudlayers, the other satellite cloud products use observations from passive instruments that are only able todetect the highest cloud layer and cannot detect lower clouds beneath higher clouds. Consequently, onlythe high clouds from the passive satellite data sets can be usefully compared to DARDAR. To ensure a mean-ingful comparison between DARDAR and the passive observations, we remove potentially obscured cloudsfrom DARDAR. This only affects the mid-level and low cloud cover from DARDAR. We shall refer to this asDARDAR-passive like.
The Moderate Resolution Imaging Spectroradiometer (MODIS) data set is based on radiometer observationsfrom two polar-orbiting satellites; Terra was launched in 2000 and crosses the equator at approximately 10:30and 22:30 local time, while Aqua was launched in 2002 and crosses the equator at approximately 1:30 and13:30 local time. We use themonthly global product, collection 6 [Platnick, 2015], which includes monthly sta-tistics at a resolution of 1° × 1°. For total cloud cover, we use the mean cloud fraction, which is derived fromthe instantaneous cloud mask [Frey et al., 2008] and includes both day and night data. For our analysis ofcloud cover at different heights we calculate high, mid-level, and low cloud cover from the cloud fraction-pressure histogram, which is based on the instantaneous cloud top pressure [Platnick et al., 2003]. The cloudtop pressure is determined by a CO2 slicing technique using multiple spectral bands between 13.3 and15μm. For low clouds, if the CO2 slicing technique fails to give a valid solution, then the infrared windowapproach is used, where the brightness temperature at 11μm is used to determine a cloud top temperature,and temperature profiles from the National Centers for Environmental Prediction Global Data AssimilationSystem are used to convert this to a cloud top pressure. This ensures that the cloud top pressure is deter-mined for all cloudy points.
The CMSAF-CLAAS (Climate Monitoring Satellite Applications Facility-Cloud Property Dataset using SEVIRI(Spinning Enhanced Visible and Infrared Imager)) product is based on instruments on the geostationaryMeteosat Second Generation satellites [Stengel et al., 2014]. The geostationary orbit provides excellent diurnalsampling; the CMSAF data set has excellent potential for understanding cloud diurnal variability. However, as
Table 1. Key Features of Observational Data Sets Used in This Study
Source Version Period Orbit Resolution References
MODIS-Moderate ResolutionImaging Spectroradiometer
Atmosphere L3 MonthlyGlobal Product; collection 6
December 2001 topresent (Terra) June
2002 to present (Aqua)
Polar x2 Gridded to 1.0° Platnick [2015]
DARDAR-radar-lidar DARDAR-MASK 2006–2010 Polar 1.1 km horizontal60m vertical
Delanoe andHogan [2010]
CMSAF-the satellite applicationfacility on climate monitoring
Cloud Property Dataset usingSEVIRI (CLAAS) version 1
January 2004 toDecember 2011
Geostationary Approximately 4 km Stengel et al. [2014]doi:10.5676/
EUM_SAF_CM/CLAAS/V001doi:10.5676/
EUM_SAF_CM/CLAAS/V001#_blank
GPCC Full data reanalysisversion 7.0 at 1.0°
January 1901 toDecember 2013
N/A(gauge based)
Gridded to 1.0° Schneider et al. [2014]doi:10.5676/DWD_GPCC/FD_M_V7_100doi:10.5676/DWD_GPCC/
FD_M_V7_100#_blankTRMM-Tropical RainfallMeasuring Mission
3B42 V7 January 1998to present
N/A(merged product)
Gridded to 0.25° Huffman et al. [2007]
GPM-Global PrecipitationMeasurement
IMERG 3B-HHR March 2014 to present N/A(merged product)
0.1° Hou et al. [2014] andHuffman et al. [2013]
CERES-Clouds and the Earth’sRadiant Energy System
SYN1deg-3Hour Ed3A December 2001 topresent (Terra) June
2002 to present (Aqua)
Polar x2 1.0° Wielicki et al. [1996] andDoelling et al. [2013]
GERB-Geostationary EarthRadiation Budget
High-resolutionimage version 6
April 2004 to present Geostationary 9 × 9 km at nadir Harries et al. [2005] andDewitte et al. [2008]
Journal of Geophysical Research: Atmospheres 10.1002/2016JD025246
HILL ET AL. MULTISATELLITE CLIMATOLOGY IN SWA 4

a relatively new data set, there is likely to be potential for further refinements to the algorithm. We use theinstantaneous cloud mask and cloud top pressure to calculate monthly mean total, high, mid-level, andlow cloud cover for West Africa at a resolution of 1° × 1°. The cloud detection algorithm [Derrien and LeGleau, 2005] is based on visible and infrared threshold tests in multiple bands combined with spatial variabil-ity tests. The threshold tests use eight bands, compared to the 22 used in the MODIS cloud mask algorithm.Like MODIS, cloud top pressure is determined using a combination of the infrared window approach and CO2
slicing. However SEVIRI lacks the multiple CO2 channels used in the MODIS algorithm and CO2 slicing is usedmuch less frequently than in MODIS. The infrared window approach is used for low-level and mid-level thickclouds. For semitransparent high clouds, the infrared window intercept method is applied. This is similar toCO2 slicing but uses infrared and water vapor channels. CO2 slicing is only applied for optically thick highclouds or when the infrared window intercept method fails.
Note that the cloud top pressure in the CMSAF-CLAAS product is not estimated for all cloudy pixels. If a pixelcontains fractional clouds (which are mainly low-level water clouds according to Stengel et al. [2014]), thenno cloud top pressure is determined. Consequently, the mid-level, low-level, and high-level cloud covers,which are estimated using the cloud top pressure, do not sum to the total cloud cover, which is based onthe cloud mask.
We compare three precipitation data sets. The first data set, the TRMM (Tropical Rainfall Measuring Mission)Multisatellite Precipitation Analysis (TMPA) [Huffman et al., 2007], has been identified as one of the bestsatellite rainfall data sets over West Africa [Roca et al., 2010; Pfeifroth et al., 2016]. We use the 3B42 data thatprovide precipitation estimates every 3 h. TMPA combines microwave precipitation estimates from a varietyof satellites (which are intercalibrated to precipitation estimates directly from the TRMM satellite) withgeostationary infrared precipitation estimates created using the calibrated microwave precipitation. Toensure good performance at the monthly mean scale, the precipitation estimates are subsequently rescaledto match monthly mean gauge measurements.
The second precipitation data set considered is the Global Precipitation Measurement (GPM) mission [Houet al., 2014], which is the follow up to TRMM. The Integrated Multisatellite Retrievals for GPM (IMERG) dataset [Huffman et al., 2013] used in this study uses a similar algorithm to the TMPA product. GPM was launchedin February 2014, and data are available from March 2014. Consequently, our comparison with TRMM islimited to June–July 2014. Nevertheless, we think that this provides a useful initial examination of thediurnally resolved differences between the data sets in this region. Initial global comparisons on a monthlyscale show that TMPA-IMERG differences are small over land [Liu, 2016]. Quantifying uncertainty in mergedprecipitation products such as TMPA and GPM IMERG is difficult and remains an area of ongoing research[Sorooshian et al., 2011].
The third precipitation data set considered is the Global Precipitation Climatology Centre (GPCC)precipitation reanalysis product [Schneider et al., 2014]. This is based on quality-controlled gauge recordsobtained from 75,000 surface stations between 1900 and 2013. The GPCC reanalysis product is used to cali-brate the TRMM product over land at the monthly mean scale up to 2010. For later years, both TRMM andGPM use the GPCC monitoring product, which is based on fewer gauges. Although the number of gaugesused in the GPCC analysis product in West Africa is relatively small, Nicholson et al. [2003] showed that itcompares well with a denser rain gauge network. However, the GPCC product only provides estimates atthe monthly mean scale, with no diurnal cycle. Consequently, we prefer the TRMM and GPM data sets, whichby design match the monthly mean GPCC values, but provide subdaily data for analyzing the diurnal cycleof precipitation.
Note that satellite precipitation products generally capture convective precipitation but struggle to detectwarm rain (precipitation produced by liquid clouds) events [Ebert et al., 2007]. The use of gauges in theTRMM product may improve total biases at the expense of increasing the precipitation amount when presentto compensate for any undetected precipitation events [Tian et al., 2009]. The sparsity of surface observationsmay also affect the performance of both TMPA and GPM, which depend on local gauge calibration [Worqlulet al., 2014].
For top of atmosphere (TOA) radiation, we use Clouds and the Earth’s Radiant Energy System (CERES) [Wielickiet al., 1996] and Geostationary Earth Radiation Budget (GERB) [Harries et al., 2005] data sets. The CERES
Journal of Geophysical Research: Atmospheres 10.1002/2016JD025246
HILL ET AL. MULTISATELLITE CLIMATOLOGY IN SWA 5

instrument measures radiances in three channels: total (0.3–200μm), SW (0.3–5μm), and LW window(8–12μm). These radiances are converted to instantaneous TOA flux estimates using a scene-dependentangular distribution model (ADM) as described by Loeb et al. [2003]. CERES instruments are limited to thesame two polar-orbiting satellites as MODIS and consequently only sample the diurnal cycle at four times.We use the synoptic radiative fluxes and clouds (CERES-SYN) product [Doelling et al., 2013], which capitalizeson geostationary imagers to estimate the diurnal variability between CERES observations, using coincidentgeostationary and MODIS/CERES observations to ensure that CERES calibration is maintained. The dominantsource of uncertainty in CERES TOA radiation measurements relates to absolute calibration [Loeb et al., 2009],which is estimated to be 2% for the SW channel and 1% for the total channel [Priestley et al., 2002]. Clear-skyfluxes are estimated as the mean for those CERES footprints for which the cloud fraction is less than 1%,where the cloud mask is estimated using MODIS [Minnis et al., 2011].
The GERB data set [Dewitte et al., 2008] is based on a series of GERB instruments on the geostationaryMeteosat Second Generation satellites. GERB2 was launched in August 2002 and began operations inFebruary 2004, while GERB1 was launched in December 2005 and began operations in May 2007. The HR(high-resolution) product used in this study has a temporal resolution of 15min. The GERB instrumentsmeasure radiances in two channels, total (0.3–100μm) and SW (0.3–4μm), and LW radiance is calculatedby subtraction of SW from the total. The theoretical uncertainty for instantaneous unfiltered radiances isabout 2% in the SW and 1% in the LW [Clerbaux et al., 2009].
To convert radiance to flux, the CERES ADMs in the SW and theoretical ADMs [Clerbaux, 2003] in the LW wereused, along with the scene identified from SEVIRI. Comparison of instantaneous fluxes for earlier editions ofthe GERB and CERES products [Clerbaux et al., 2009] found reasonable agreement between GERB2 and CERESin the LW, but larger differences in the SW, which were attributed to differences in the absolute calibrationaccuracy; following the GERB2 data quality summary recommendations, we apply an additional calibrationfactor which reduces this difference.
Unlike CERES products, the GERB product does not report SW fluxes for solar zenith angles larger than 80°. Tocomplete the diurnal cycle, we fill this missing data using mean twilight values from CERES [Kato, 2003] forzenith angles between 86.5° and 104.5°. Kato [2003] does not report fluxes at zenith angles less than 86.5°,so we use linear interpolation in time to fill zenith angles between 80° and 86.5°.
Estimates of the radiative heating of the atmosphere are required to understand the atmospheric energybudget and links between radiative heating and latent heating. The atmospheric radiative heating is calcu-lated by subtracting net downward surface radiative fluxes from the net downward top of atmosphere radia-tive fluxes. Surface fluxes are not measured by satellites but are calculated using radiative transfer models insome CERES products. For consistency, atmospheric radiative heating is calculated using surface and top ofatmosphere fluxes from the same product. In particular, we use the CERES-EBAF [Loeb et al., 2009] productand the CERES-COMPUTED [Rutan et al., 2015] product. We do not use the CERES-SYN product employedin the analysis of top of atmosphere fluxes as it does not have consistent surface flux estimates.
2.2. ERA-Interim
Reanalyses provide spatially and temporally complete estimates of the state of the atmosphere and estimatesof atmospheric motion that are difficult to observe. For regions of sparse observations such as southern WestAfrica, reanalyses are particularly useful, although caution needs to be exercised since they are likely to beless reliable due to the lack of conventional observations to assimilate.
The European Centre for Medium-Range Weather Forecasts (ECMWF) ERA-Interim [Dee et al., 2011] reanalysisruns from 1979 and is continuously updated. If, as Knippertz et al. [2011] suggest, ERA-Interim performs rea-sonably in the DACCIWA region, then it potentially provides a useful tool for understanding errors in othermodels. The analysis is computed using a 2006 release of ECMWF’s Integrated Forecasting System, whichhas a horizontal resolution of approximately 80 km and 60 vertical levels. For comparison to the satellite cloudproducts, we calculated high-level, mid-level, and low-level cloud cover (as seen from space) from the cloudcover on model levels, assuming maximum-random overlap [Geleyn and Hollingsworth, 1979]. Thecontribution of horizontal energy transport to the regional energy budget, as discussed in section 3.2.2, isapproximated by the column-integrated divergence of dry static energy flux and calculated fromERA-Interim with a mass correction following Liu et al. [2015].
Journal of Geophysical Research: Atmospheres 10.1002/2016JD025246
HILL ET AL. MULTISATELLITE CLIMATOLOGY IN SWA 6

Note that ERA-Interim analysis fieldsare available at most every 6 h andonly every 12 h for some fields. To fillin the missing points in the diurnalcycle, we use data from the ERA-Interim forecast, which is availableevery 3 h. We also use ERA-Interim
forecast data for variables that are output as accumulated fluxes and therefore not available at the analysistime (e.g., radiative fluxes and surface precipitation). Differences between ERA-Interim forecast and analysisfields as noted by Knippertz et al. [2011] are beyond the scope of this study.
2.3. Climate Models
To investigate errors in state of the art climate models, we use simulations from the Coupled ModelIntercomparison Project (CMIP) phase 5 experiment [Taylor et al., 2012]. CMIP5 provided the climate modelsimulations that form the basis of the Intergovernmental Panel on Climate Change Fifth AssessmentReport [Pachauri et al., 2014]. As this study focuses exclusively on atmospheric processes, we useAtmospheric Model Intercomparison Project (AMIP) simulations that employ predetermined realistic sea sur-face temperatures and sea ice. As SWA exhibits notable diurnal cycles of cloud, precipitation, and radiation[Stein et al., 2011; van der Linden et al., 2015; Pfeifroth et al., 2016], which will affect their interactions, we focuson those AMIP5 models for which 3-hourly output is available: CanAM4, CNRM-CM5, HadGEM2-A, andMRI-CGCM3. Further details of these models are given in Table 2.
3. Satellite Observations of Cloud, Precipitation, and Radiation3.1. Spatial Variability
To understand the overall relation between cloud, precipitation, and radiation, we first examine their meanregional distribution using MODIS, TRMM, and CERES products, as shown in Figure 1. Regions with extensivecloud cover and heavy precipitation are associated with high outgoing shortwave radiation (OSR) due tosubstantial reflectance of sunlight by clouds and low outgoing LW radiation (OLR) due to cold cloud top tem-perature. Largest cloud cover and precipitation occur to the immediate east and west of the DACCIWA regionand are linked to topography, in particular the Guinea Highlands to the west and the Jos Plateau to the east.Increased cloud cover in these regions is linked to increased OSR and decreased OLR. Between thesecloud/precipitation maxima lies the DACCIWA region, highlighted by the black box. This excludes by designsignificant topography but may be affected by convective systems initiated over the Jos Plateau that travelwestward into the region of interest [Fink et al., 2006]. While the DACCIWA region has less extreme valuesthan observed over the topography to the east and west, it shows larger precipitation, cloud cover, andOSR and smaller OLR than the Sahel to the immediate north and the Gulf of Guinea to the south.
Table 2. Details of Climate Models Used in This Study
Model Name Country Horizontal Resolution Vertical Resolution
CANAM4 Canada 2.8° × 2.8° L35CNRM-CM5 France 1.4° × 1.4° L31HadGEM2-A UK 1.25° × 1.875° L38MRI-CGCM3 Japan 1.125° × 1.125° L48
Table 3. DACCIWA Region (8W–8E, 5–10 N) Mean and Interannual Variability (Standard Deviation of Annual Means, Given in Parentheses) for June–Julya
Variable Observations Models Reanalysis
Cloud DARDAR MODIS CMSAF CanAM4 CNRM-CM5 HadGEM2-A MRI-CGCM3 ERA-InterimTotal cover 0.94 (0.02) 0.89 (0.01) 0.68 (0.02) 0.82 (0.03) 0.71 (0.04) 0.54 (0.04) 0.72 (0.02) 0.74 (0.03)High cover 0.74 (0.05) 0.45 (0.04) 0.36 (0.03) 0.31 (0.06) 0.44 (0.03) 0.29 (0.05) 0.36 (0.04) 0.45 (0.04)Mid-level cover 0.14 (0.03) 0.21 (0.03) 0.13 (0.01) 0.28 (0.02) 0.18 (0.03) 0.16 (0.02) 0.28 (0.03) 0.10 (0.01)Low cover 0.06 (0.01) 0.18 (0.02) 0.05 (0.01) 0.21 (0.02) 0.04 (0.01) 0.09 (0.02) 0.07 (0.01) 0.16 (0.03)Precipitation (mmd�1) TRMM GPM CanAM4 CNRM-CM5 HadGEM2-A MRI-CGCM3 ERA-Interim
5.87 (0.89) 5.00 6.45 (0.97) 5.72 (0.74) 4.65 (0.69) 5.16 (0.59) 5.80 (0.89)Radiation (Wm�2) CERES GERB CanAM4 CNRM-CM5 HadGEM2-A MRI-CGCM3 ERA-InterimOutgoing SW 147.6 (3.2) 144.7 (4.0) 154.6 (4.4) 137.4 (7.0) 127.7 (6.4) 163.8 (4.5) 149.4 (5.3)Clear-sky outgoing SW 58.47 (1.2) - 66.7 (0.5) 69.2 (0.1) 70.5 (0.6) 84.4 (0.1) 62.7 (0.1)TOA SW CRE 88.6 - 87.9 68.2 57.1 79.4 86.7OLR 229.8 (3.5) 230.4 (2.8) 231.1 (6.5) 234.1 (3.2) 246.6 (5.2) 234.7 (3.4) 244.4 (3.0)Clear-sky OLR 273.0 (0.8) - 272.4 (1.0) 272.6 (0.9) 276.6 (2.1) 272.9 (0.7) 271.4(1.0)TOA LW CRE �43.2 - �41.2 �38.5 �30.0 �38.2 �27.0
aFor each data set we use all available years between 2000 and 2015 inclusive.
Journal of Geophysical Research: Atmospheres 10.1002/2016JD025246
HILL ET AL. MULTISATELLITE CLIMATOLOGY IN SWA 7

The DACCIWA region is relatively homogeneous compared to the strong zonal variability to the immediatenorth and topographically induced variability to the east and west. Mean cloud, radiation, and precipitationfields over the DACCIWA region and uncertainty across observational data set are quantified in the followingsection in the context of interannual variability.
3.2. Interannual Variability
The interannual variability can provide insight into the physical processes determining the climate of theregion during June–July as well as contributing context and additional quantification of uncertainty in theplanning for the forthcoming DACCIWA observational field campaign. Multiannual mean and interannualvariability are quantified in Table 3 for each variable and data set.3.2.1. Cloud, Precipitation, and RadiationOverall, Figure 2 highlights the large differences between the three satellite cloud products. There is littlecoherent variability or trends in cloud fraction across data sets, although the DARDAR-passive-like data set
Figure 2. June–July mean cloud cover from various satellite products. (a–d) Total, high-level, mid-level, and low-level cloudcovers. Shaded regions represent spatial variability, indicated by the interquartile range of cloud cover over the DACCIWAregion. (e and f) Weighted cloud covers are calculated by dividing by the fraction that is not already obscured by highercloud. The DARDAR original cloud cover is calculated directly from the DARDAR cloud mask and includes mid-level andlow-level clouds that are detected by DARDAR beneath higher cloud.
Journal of Geophysical Research: Atmospheres 10.1002/2016JD025246
HILL ET AL. MULTISATELLITE CLIMATOLOGY IN SWA 8

displays an increase in high cloud cover from 71% to 83% over the period 2006–2010. Among the three clouddata sets used in the study, DARDAR-passive like produces the largest total cloud cover, primarily due tomuch larger high cloud cover (Figure 2a); this is not surprising because the lidar observations used inDARDAR can detect optically thin clouds at high altitudes that are often missed by MODIS [Sun et al., 2011;Lee et al., 2009]. Although these clouds are optically thin, their radiative effect, particularly in the LW, issignificant [Haladay and Stephens, 2009; Lee et al., 2009; Sun et al., 2011].
In contrast, low and mid-level cloud covers from DARDAR-passive like are less than those from MODIS. Thismay be due to cases such as thin cirrus pixels over lower thicker clouds, which are classified as high cloudby DARDAR-passive like but as low clouds by MODIS. To account for differences in mid-level and low-levelclouds due to obscuration by higher clouds, we calculate new weighted mid-level and low-level cloud covers(Figures 2e and 2f). To calculate the weightedmid-level cloud cover, we divide the mid-level cloud cover by themaximum possible mid-level cloud cover, which is less than one due to the presence of high cloud (i.e., wedivide the mid-level cloud cover by one minus the high cloud cover). Similarly, the weighted low-level cloudcover is calculated by dividing the low-level cloud cover by themaximum possible low-level cloud cover, whichis less than one due to the presence of high-level and mid-level clouds. As detailed in Appendix A, if clouds atdifferent levels are randomly overlapped, then these weighted values represent the true mid-level and low-level cloud covers. Thus, if clouds at different levels are randomly overlapped, then the weighted cloud coverfor passive satellite observations can be compared directly to the original DARDAR data set (where we havenot removed mid-level and low-level clouds beneath higher clouds as in Figures 2c and 2d).
To validate the weighted cloud cover, we focus initially on the difference between the weighted DARDAR-passive-like cloud cover and the original DARDAR mean cloud cover. Agreement between the two indicatesthat the weighting can be applied sensibly to the passive cloud cover data sets (i.e., MODIS and CMSAF) forcomparison to the original DARDAR observations. For mid-level cloud the original DARDARmean cloud coverand weighted DARDAR-passive-like mean cloud cover are very similar (Figure 2e). However, for low-levelclouds, the weighted DARDAR-passive-like cloud cover is larger than the original cloud cover (Figure 2f).This indicates that low clouds and mid-level or high clouds are not randomly overlapped in the DARDAR dataset. This may be because they are not randomly overlapped in reality but could also be due to missing low-level cloud beneath higher cloud in the DARDAR data set. Indeed, Schrage and Fink [2012] highlighted pro-blems detecting low-level stratus beneath higher cloud in SWA, due to attenuation of CALIPSO lidar signalby the higher cloud and contamination in CloudSat radar reflectivity by ground clutter.
Calculating weighted cloud cover for MODIS gives lower mid-level cloud cover than the DARDAR originalproduct (Figure 2e); this confirms that the MODIS mid-level cloud cover is only larger than theDARDAR-passive-like mid-level cloud cover due to larger high cloud cover that obscures mid-level cloud inthe DARDAR-passive-like data set. The difference between DARDAR original and weighted MODIS mid-levelcloud cover shows that MODIS is missing some optically thin mid-level clouds. For low clouds, the weightedMODIS cloud cover is larger than the original DARDAR cloud cover. Interpretation of this result is complicatedby the lack of agreement between the DARDAR original and weighted DARDAR-passive-like cloud cover andrequires a more detailed comparison of DARDAR and MODIS in this region.
Compared to DARDAR-passive like and MODIS, CMSAF tends to detect less cloud cover at all heights, consis-tent with results over tropical lands reported in Reuter et al. [2009]. It matches DARDAR-passive-like mid-leveland low-level cloud covers better, but comparison of the CMSAF weighted cloud cover with the DARDARoriginal cloud cover shows that this good match is due to increased high cloud in DARDAR-passive likeobscuring more mid-level and low cloud. The MODIS-CMSAF difference is largest for low cloud. This differ-ence is primarily due to a lack of nocturnal low cloud in CMSAF, as discussed in section 3.3.
Figure 3a shows surface precipitation from TRMM, GPM, GPCC, and ERA-Interim. For 2014, mean precipitationfrom GPM and TRMM shows agreement to within 0.5mmd�1 due to both being constrained at the monthlymean scale by the same surface rain gauge analysis. Given the lack of extended GPM data at this point intime, TRMM is clearly the better data set for evaluating the climate models and ERA-Interim. TRMM meanprecipitation varies substantially from year to year, ranging from ~4.5mmd�1 in 2013 up to ~7.5mmd�1
in 2002. The longer-term GPCC gauge analysis product shows that this mean and interannual variability isconsistent with the record going back to 1900 (not shown). However, Figure 3b shows that the last few yearshave been consistently drier than both the TRMM mean (5.8mmd�1) and the longer-term GPCC mean
Journal of Geophysical Research: Atmospheres 10.1002/2016JD025246
HILL ET AL. MULTISATELLITE CLIMATOLOGY IN SWA 9

(6.1mmd�1). Indeed, averaging over 5 year periods, the five most recent years of TRMM observations (i.e.,2011–2015) are drier than any other 5 year period in either the TRMM or GPCC record, with the caveat thatthe GPCC full reanalysis currently extends to 2013, so more recent TRMM observations are calibrated usingthe GPCC monitoring product.
Figure 4 shows interannual variability of clear-sky and all-sky TOA outgoing fluxes from CERES-SYN and GERB.For the OSR, there is a notable contrast between the GERB-CERES differences for the GERB2 instrument(2004–2006) and the GERB1 instrument (2007–2011). GERB2-CERES differences are small, while CERES pre-dicts larger monthly mean values than GERB1, the magnitude increasing with time up to about 5Wm�2 in2011, but remains within the sum of the respective observational uncertainties (~6Wm�2). Consequently,the mean value for the GERB OSR (Table 3) is slightly smaller than the CERES value. The difference betweenGERB1 and GERB2 is also evident in the OLR; again, GERB2-CERES differences are smaller, while GERB1appears to overestimate OLR slightly by around 2Wm�2, which is within the observational uncertainty forboth CERES and GERB.
It is worth noting that the limited sampling of the diurnal cycle in CERES-SYN has a nonnegligible effect onthe mean SW fluxes. Sampling the GERB fluxes at similar points in time leads to an increase in the GERB meanoutgoing SW flux of approximately 6Wm�2 and gives GERB2 values that are larger than CERES and GERB1values that are a closer match to CERES. Limited sampling of the diurnal cycle can cause similar problemsin climate models [Zhou et al., 2015] and will be discussed further in section 3.3.
Generally, there are little obvious interannual changes in the cloud or radiation observations. Exceptions includethe GERB SW flux, where the change from GERB2 to GERB1 leads to differences of approximately 3.5Wm�2.
Figure 3. June–July mean precipitation (mmd-1). (a) June–July means for individual years as observed by TRMM, GPM, andGPCC andmodeled in ERA-Interim. (b) Five year runningmeans for June–July for TRMMandGPCC. The shaded regions (errorbar for GPM) shows spatial variability, indicated by the interquartile range over the DACCIWA region, based on 1° resolution.
Figure 4. Mean top of atmosphere outgoing (a) shortwave and (b) longwave radiative fluxes for June–July from CERES-SYNand GERB. Shaded region shows spatial variability, indicated by the interquartile range, over the DACCIWA region based on1° resolution. The break in the GERB lines shows where GERB1 replaces GERB2 in 2007.
Journal of Geophysical Research: Atmospheres 10.1002/2016JD025246
HILL ET AL. MULTISATELLITE CLIMATOLOGY IN SWA 10

The GERB team has more confidence in the calibration of GERB1 (N. Clerbaux, personal communication, 2016),so we focus on CERES and GERB1 when considering radiation observations in the rest of this paper.Another notable change is the fall of approximately 10Wm�2 in OLR between 2007 and 2008, whichhappens to be the year used for the evaluation of the diurnal cycles in the climate models andERA-Interim. This decrease in OLR coincides with a precipitation maximum and high cloud maxima inMODIS and CMSAF. For precipitation, the natural interannual variability in the DACCIWA region appearsto be large and we must bear in mind that individual years (as used, for example, in section 4) may not berepresentative of the longer term.3.2.2. Budget AnalysisTo compare interannual variability of radiation and precipitation, understand how they are linked, andidentify what the sources of variability are, we consider the atmospheric energy and moisture budgets forJune–July. Under the hydrostatic approximation and assuming that kinetic energy transport and changesin energy and water storage are negligible as in Muller and O’Gorman [2011], the time-mean regional atmo-spheric energy budget may be expressed as
LcP ¼ Qþ Hd
where Lc is the latent heat of condensation of water vapor, P is the surface precipitation rate, Hd is theatmospheric horizontal divergence of dry static energy, and Q is the atmospheric net heating from radiationand sensible heat. Similarly, assuming that changes in water storage are negligible, the time-mean moisturebudget may be expressed as
P � E ¼ Mh
where E is the surface evaporation rate and Mh is the horizontal divergence of moisture.
Satellite data sets provide estimates of precipitation rates, SW column radiative heating, and LW columnradiative cooling, while ERA-Interim can provide sensible heating, surface evaporation, divergence of moist-ure, and divergence of dry static energy. Figure 5 illustrates the key terms in the atmospheric energy budgetof the DACCIWA region and includes June–July multiannual mean estimates for each term. The DACCIWA
Figure 5. Key terms in the atmospheric energy budget for the DACCIWA region. Numbers shown are June–July means(standard deviations of interannual means in parentheses) for 2000–2015 from the data source indicated by that color.
Journal of Geophysical Research: Atmospheres 10.1002/2016JD025246
HILL ET AL. MULTISATELLITE CLIMATOLOGY IN SWA 11

region is fueled by ~110Wm�2 of SW radiative heating, ~170Wm�2 of latent energy release through preci-pitation, and ~25Wm�2 of sensible heating from the surface. This is balanced by LW net radiative coolingbetween �188 and �211Wm�2 (depending on data set) and horizontal divergence of dry static energy ofabout �105Wm�2. While SW and LW radiation are among the largest terms in the energy budget, theyand the sensible heat flux show little interannual variability (values in parentheses in Figure 5) and arerelatively homogeneous throughout SWA (not shown). Latent heating and Hd are much more variable, bothtemporally and spatially. Year-to-year changes in latent heating and Hd are well correlated (Figure 6a), with acorrelation coefficient of 0.96 when both are estimated from ERA-Interim and 0.41 when latent heating isbased on TRMM precipitation. For both latent heating and Hd these year-to-year changes are generally largerin the eastern part of the DACCIWA region and appear to be linked to changes in the magnitude and locationof the precipitation maximum near the coast of Nigeria/Cameroon (see supporting information).
Within ERA-Interim, the energy budget balances reasonably well, with cooling exceeding heating by5.7Wm�2. When we combine satellite estimates of latent heating and radiation with ERA-Interim estimatesof sensible heating and divergence of dry static energy, which are not available from satellites, heatingexceeds cooling by 4.3Wm�2 when we use CERES-EBAF for radiation and 13.9Wm�2 for CERES-COMPUTED radiation. These differences are primarily due to lower estimates of LW cooling from the satel-lites. ERA-Interim appears to overestimate LW cooling in the DACCIWA region, which is consistent with anoverestimate of OLR and an underestimate of mid-level cloud cover (Table 3). Assuming that the imbalancein the combined satellite and ERA-Interim energy budget is due to errors in ERA-Interim, closing the budgetrequires either an increase in the divergence of dry static energy or a decrease in sensible heatingin ERA-Interim.
The ERA-interim moisture budget also balances reasonably well; loss of water through precipitation(5.8mmd�1) is balanced by evaporation (3.4mmd�1) and horizontal moisture convergence (2.4mmd�1).The mean difference between ERA-Interim and TRMM precipitation is small (Figure 3a), so the balance isreasonably well maintained when TRMM precipitation (5.9mmd�1) is used. Similarly to the energy budget,interannual variability is dominated by precipitation and horizontal divergence (Figure 6b). Increasedprecipitation is linked to increased horizontal convergence of moisture (i.e., negative divergence), with aPearson correlation coefficient of �0.98 when both are estimated from ERA-Interim and �0.33 forTRMM precipitation.
3.3. Diurnal Cycle
Previous studies have indicated notable diurnal cycles of cloud [van der Linden et al., 2015; Stein et al., 2011]and precipitation [Pfeifroth et al., 2016] in SWA. Interactions between clouds, precipitation, and radiation areaffected by their respective diurnal cycles. For instance, due to the large amplitude of the diurnal cycle ofshortwave radiation, cloud-radiation interactions are strongly dependent on when in the diurnal cycle cloudoccurs; shortwave cloud heating of the atmosphere tends to be larger than longwave cooling during the day,
Figure 6. Mean contributions to the (a) energy budget and (b) moisture budget for the DACCIWA region for June–July.Shaded regions show spatial variability, indicated by the interquartile range, based on 1° resolution. To improve readability,Figure 6a only includes the terms that show largest interannual variability, namely, latent heating and divergence of drystatic energy.
Journal of Geophysical Research: Atmospheres 10.1002/2016JD025246
HILL ET AL. MULTISATELLITE CLIMATOLOGY IN SWA 12

while at night when there is no shortwave radiation, longwave radiation leads to a cooling of the atmosphere.This section investigates links between the diurnal cycles of clouds, precipitation, and radiation.
Figure 7 shows a number of key features of the diurnal cycle of cloud cover, precipitation, and outgoing radia-tion at TOA. To ensure a fair comparison, we focus on those years that are included in all data sets, 2007–2010.
Figure 7. Diurnal cycle of cloud cover, precipitation, and radiativefluxes for June–July. All panels showmeans for 2007–2010,except for Figure 7f which shows 2014. Shaded regions and error bars show spatial variability, indicated by the interquartilerange, based on 1° resolution.
Journal of Geophysical Research: Atmospheres 10.1002/2016JD025246
HILL ET AL. MULTISATELLITE CLIMATOLOGY IN SWA 13
Note that DARDAR is the only data set that uses the same method to retrieve daytime and nighttime cloudcover; therefore, any notable diurnal signature in cloud cover from DARDAR should not be caused by theretrieval method itself. In contrast, MODIS and CMSAF both have separate methods for daytime andnighttime retrievals.
Figure 7a shows that DARDAR and MODIS do not display a noticeable diurnal cycle in total cloud cover, butthere is a clear diurnal difference in high cloud cover (Figure 7b). High clouds are more prevalent at night(roughly at 0000-0500 and 2000-2400 UTC), consistent with reduced OLR (Figure 7h) and following thediurnal maximum in precipitation (Figure 7f), suggesting that the diurnal cycle of high cloud cover stronglylinks to convective systems that develop during the afternoon and evening and lead to increased anvil andcirrus cloud at night [e.g., Stein et al., 2011]. In contrast, low clouds are more prevalent during the day; thiscycle does not match surface synoptic observations presented by van der Linden et al. [2015], showing thatlow cloud cover increases overnight to a maximum at 0600UTC and decreases through the day to aminimum at1800UTC. This discrepancy may be related to the dependence of low cloud cover from passive satellites on highcloud cover, as discussed in section 3.2 and the supporting information; diurnal changes in MODIS and DARDAR-passive-like high cloud cover result in diurnal changes to the amount of low cloud that is obscured by high cloud,which may lead to unrealistic increases in low cloud cover when high cloud cover decreases.
The diurnal cycle of cloud cover from CMSAF behaves differently to the other data sets. For high-level andmid-level clouds, the diurnal cycle from CMSAF is generally consistent with that found in DARDAR andMODIS; however, for the total cloud cover, CMSAF shows a larger cloud cover at daytime than night(Figure 7a), which is primarily due to low-level cloud cover (as seen in Figure 7d). This raises a questionwhy CMSAF has similar low-level cloud cover to DARDAR and MODIS during the day, but at night hasvirtually no low cloud cover, which is much lower than the other two products and warrants moredetailed discussions.
Focusing on nighttime land retrieval algorithm, MODIS relies on the 11–3.9μm brightness temperature dif-ference (BTD) to detect low clouds, with empirically derived thresholds that depend on total precipitablewater predicted by the Global Data Analysis System. Similarly, CMSAF uses the 10.8–3.9 BTD, but with thresh-olds determined from a look-up table that depend on satellite zenith angle, surface type, and numericalweather prediction forecast integrated water vapor content [Derrien and Le Gleau, 2005]. This suggests thatthe lack of nocturnal low cloud in the CMSAF product is due to problems with the threshold applied to the10.8–3.9 BTD. Further evidence for this is provided by Van der Linden et al. [2015] who obtained better lowcloud cover over SWA from SEVIRI by simply fixing the 10.8–3.9 BTD threshold at 2 K. Since a fixed thresholdis unlikely to be applicable to other scenes and cloud types, this suggests further areas for CMSAF developersfor improvement.
Each of the cloud data sets has strengths and weaknesses. The CMSAF product has excellent diurnal samplingbut has large cloud cover biases, particularly for low cloud cover, due to issues detecting nocturnal low cloud.On the other hand, DARDAR has the greatest sensitivity and detects themost cloud but has fewest samples ofthe diurnal cycle. In terms of both cloud cover biases and diurnal sampling, MODIS lies between DARDAR andCMSAF. As a compromise between accuracy and diurnal sampling, we use the MODIS data set for comparisonto climate models and ERA-Interim in this study. Satellite simulators that emulate remotely resolved observa-tions [Bodas-Salcedo et al., 2011] are also a useful tool for evaluating clouds in climatemodels, but the numberof instruments and temporal resolution available from AMIP5 models is limited.
As expected, agreement between the diurnal cycle of precipitation in TRMM and GPM is good (Figure 7f, for2014 only), with a root-mean-square difference of 0.03mmh�1; both show peak precipitation in the earlyevening and a minimum in the morning, which is characteristic of the diurnal cycle of convective precipita-tion over land [Nesbitt and Zipser, 2003]. Although precipitation shows large interannual variability (Figure 3),there are no obvious differences between the mean diurnal cycles for 2014 (Figure 7f) and 2007–2010(Figure 7e). This suggests that the large interannual variability is due to variability in the number and strengthof convective events rather than significant variability in the rainfall type. However, this lack of variability inthe diurnal cycle over a broad region does not necessarily apply at local scales; Pfeifroth et al. [2016] showedthat the diurnal cycle of precipitation at Oueme in Benin showed interannual variability that they linked tochanges in the proportion of precipitation due to local convection and westward propagating convective sys-tems. Similar to previous studies of the diurnal cycle of convection [Tian, 2004; Chung et al., 2007; Soden, 2000],
Journal of Geophysical Research: Atmospheres 10.1002/2016JD025246
HILL ET AL. MULTISATELLITE CLIMATOLOGY IN SWA 14
the diurnal precipitation maximum coincides with an increase in high cloud and precedes the diurnal maxi-mum of high cloud. This may be a consequence of the use of infrared observations in TRMM, which use cloudtop temperature as an indicator of surface precipitation. Pfeifroth et al. [2016] found that the TRMM productlagged the surface synoptic diurnal maximum by 1–2 h for the Ouémé mesosite (centered on 9.5°N, 2°E) andattributed this to the use of infrared observations in TRMM.
Figure 7g shows the diurnal cycle of SW radiation from CERES-SYN and GERB1. For the CERES sample time,differences with GERB values at adjacent times are small. In fact, the mean flux for the GERB1 points closestin time to CERES is 147.1Wm�2, which is slightly larger than the GERB1 diurnal mean (143.3Wm�2) and clo-ser to the 2007–2011 CERES mean (147.1Wm�2). A similar result is obtained when we sample GERB2 at simi-lar times to the CERES-SYN sampling. Differences between CERES-SYN and GERB in the DACCIWA region atthe CERES-SYN sample time are consistent with a previous comparison which showed that GERB2 fluxes weregenerally larger than CERES [Clerbaux et al., 2009]. Diurnal mean differences between the data sets are largerdue to different temporal sampling in GERB and CERES-SYN.
The amplitude of the diurnal cycle of OLR (Figure 7h) is much smaller than the OSR. Consequently, thereduced temporal sampling in CERES has less impact. GERB gives larger values between 2000 and 1330UTC,so the GERB diurnal cycle has smaller amplitude, but the phases show good agreement. The clear-sky OLRhas virtually no diurnal cycle indicating that the all-sky OLR diurnal cycle is due to cloud. The OLR minimumat night (around 0130UTC for CERES) and maximum around 1330UTC are consistent with the high clouddiurnal cycle shown in Figure 7b.
Since the flux differences between CERES and GERB are small, in principle, either is suitable for furtheranalysis. GERB has advantage of better temporal resolution, but it lacks clear-sky flux estimates that arenecessary to extract the radiative effects of clouds. Therefore, CERES data will be used for the followingevaluation of climate models and ERA-Interim. However, bear in mind that the CERES has a potential diurnalaverage difference of ~5Wm�2 due to limitations in temporal sampling.
4. Evaluation of Climate Model Simulations and ERA-Interim
We now undertake a preliminary assessment of CMIP5 simulations and ERA-Interim for the SWA region,focusing on atmosphere-only model AMIP simulations that provide the set of diagnostics necessary to inves-tigate climatological and diurnal variability in radiation, precipitation, and cloud cover. The motivation forthis, rather than providing a comprehensive evaluation of the set of CMIP5 models, is to update previous ana-lyses of older generationmodels [e.g., Knippertz et al., 2011] and to highlight major biases that warrant furtherinvestigation. Based upon the analysis in section 3, the most suitable observational data sets are nowexploited for evaluating ERA-Interim and four climate model simulations and identifying deficiencies in theirrepresentation of cloud, radiation, and precipitation.
With respect to the observed fields shown in Figure 1, Figure 8 shows maps of model mean errors for totalcloud cover, precipitation, OSR, and OLR, respectively. Generally, the climate model errors are fairly homoge-neous across the DACCIWA region and consistent with the error over SWA. Most of the spatial variability inerrors in the DACCIWA region occurs because the climate models are too homogeneous and fail to capturethe limited spatial variability that does exist in the observations; for example, many of the models fail to cap-ture the observed decrease in OLR from west to east, which results in errors that increase from west to east.This is not surprising given the coarse horizontal resolution of the models (Table 2). Of note is the grossunderestimation of cloud and precipitation and overestimation of OLR by the ERA-Interim reanalysis andthe HadGEM2-A climate model simulation at around 10–15°N, immediately to the north of the DACCIWAregion. It is somewhat surprising that the ERA-Interim has the underestimation of cloud by up to ~50% in cover-age and of OLR of up to ~50Wm�2 given the assimilation of observations, although this bias may be partly aconsequence of the paucity of observations in this region. It is also worth noting that cloud is not directly assimi-lated in ERA-Interim and errors in the model microphysics scheme can cause problems in cloud altitude andradiative properties [Chevallier et al., 2001]. Although generally smaller in magnitude, these cloud and radiationbiases also broadly apply across all climate models considered indicating an endemic deficiency in the repre-sentation of the WAM. Zonal (10°W–10°E) mean values (supporting information) show that in the case ofERA-Interim (and to a lesser extent HadGEM2-A and MRI-CGCM3) these errors are linked to a failure to capture
Journal of Geophysical Research: Atmospheres 10.1002/2016JD025246
HILL ET AL. MULTISATELLITE CLIMATOLOGY IN SWA 15

the mean northward progression of the Intertropical Convergence Zone from June to July and are consistentwith the annual mean ERA-Interim precipitation bias identified by Paeth et al. [2011] and the ERA-Interim rainfallonset timing bias identified by Dunning et al. [2016]. This failure to capture the northward shift of the WAM pre-cipitation may be a common feature of reanalyses as it occurs in both ERA-Interim and the Modern-EraRetrospective Analysis for Research and Applications (MERRA) reanalyses [Thorncroft et al., 2011].
Model and ERA-Interim interannual variability is generally of a similar magnitude to the observed interannualvariability (Table 3 and supporting information), the exception being for clear-sky outgoing SW flux, wherethe interannual variability in both ERA-Interim and the climate models is smaller than CERES-SYN. We suspectthat this is because the variability is overestimated in the CERES-SYN observations due to sampling errors inthis cloudy region.
Figure 9 shows diurnal cycles for ERA-Interim and climate model total cloud cover, precipitation, and top ofatmosphere radiative fluxes. For most climate models the diurnal cycle is only available for 2008, so we limitthe comparison to this year. Differences in the phase of the diurnal cycles of radiative flux cannot be disen-tangled from the temporal sampling that the climate models use to reduce the cost of the computationallyexpensive radiative transfer schemes. The different climate models and ERA-Interim use different methods to
Figure 8. Maps of ERA-Interim and climate model errors for June–July 2002–2009. Panels from left to right show errors in cloud cover, precipitation, and outgoingshortwave and longwave radiation, calculated with respect to MODIS, TRMM, and CERES-SYN, respectively. Information on various climate models can be found inTable 2.
Journal of Geophysical Research: Atmospheres 10.1002/2016JD025246
HILL ET AL. MULTISATELLITE CLIMATOLOGY IN SWA 16

account for this reduced temporal sampling, and as a result fluxes output at the same point in time mayrepresent quite different time periods. For example, HadGEM2-A calculates radiative fluxes every 3 h usingatmospheric properties from the start of the radiation time step and a solar zenith angle that is themean overthe radiation time step [Manners et al., 2009], outputting fluxes at the start of the radiative time step. CanAM4on the other hand applies a 1 h radiation time step and uses atmospheric properties and solar zenith anglefrom the start of the time step and output fluxes at the end of the time step. Such differences make compar-ison of the phase of the diurnal cycles of radiation problematic, so we shall restrict our discussion to theamplitude of the diurnal cycles.
There is a large spread of clear-sky OSR values among themodels and ERA-Interim (Figure 9e and Table 3). Thisis primarily due to surface albedo differences (supporting information); MRI-CGCM3 has a particularly largealbedo and is a clear outlier, but the range of albedos in the other models and ERA-Interim is greater than0.02, which is large enough to affect regional climate [Taylor et al., 2002]. The AMIP5 models all overestimateclear-sky OSR compared to CERES-SYN and ERA-Interim, which generally offsets the underestimated SW cloudradiative effect (Table 3) causedby underestimating cloud cover. However, the CERES-SYN clear-skyfluxesmay
Figure 9. Comparison of diurnal cycles for June–July 2008. In each case, the black line shows the observed diurnal cycle(from the data set indicated in the legend) and the colored lined show the four AMIP models and ERA-Interim. Forshortwave radiation (Figures 9c and 9e), the AMIP models are shown at a time that is most consistent with the solar zenithangle used, rather than the output time.
Journal of Geophysical Research: Atmospheres 10.1002/2016JD025246
HILL ET AL. MULTISATELLITE CLIMATOLOGY IN SWA 17
be subject to a sampling bias in this very cloudy region. The spread in surface albedo values is likely to have animpact on the simulated cloud and precipitation; many previous studies have shown the sensitivity of WestAfrican climate to small changes in albedo [Charney et al., 1977; Taylor et al., 2002].
Only CanAM4 and ERA-Interim simulate levels of low cloud cover within 0.05 of the MODIS values (Table 3).CanAM4 actually has a larger value of low cloud cover than MODIS, but this may simply be a consequence ofless higher cloud in CanAM4 to obscure low cloud. The lack of low cloud cover to insulate the surface at nightin ERA-Interim and the climate models leads to a larger surface temperature diurnal cycle (not shown). Thisultimately leads to an overestimate of the amplitude of the diurnal cycle of clear-sky OLR (Figure 9b), but thissignal is dwarfed by the diurnal cycle of cloud in the all-sky OLR. Note that the amplitude of the diurnal cycleof clear-sky OLR in CanAM4 is a consequence of the unique treatment of solar radiation in the infrared range;solar radiation between 4 and 1000μm (approximately 12Wm�2) is treated as LW radiation [Li et al., 2010].This diurnally varying radiation is included in the upwelling LW radiation to ensure that the net LW radiationat the TOA is unaffected.
In the DACCIWA region, the climate models generally underestimate high cloud cover (Table 3). In most casesthis does not result in significant OLR biases (Table 3) due to compensating biases in mid-level cloud.However, HadGEM2-A overestimates OLR due to a lack of both high-level and mid-level clouds. The ampli-tude of the OLR diurnal cycle in HadGEM2-A is much larger than both the observed OLR diurnal cycle andthe HadGEM2-A clear-sky OLR diurnal cycle, which suggests that cold cloud cover is overestimated in the eve-ning and underestimated during the rest of the day, particularly between 0730 and 1530UTC.
While the ERA-Interim mean high cloud cover compares well with MODIS, ERA-Interim overestimates OLRdue to a lack of mid-level cloud. The previous version of the ECMWF reanalysis overestimated OLR over tro-pical land due to cloud errors [Allan et al., 2004], and it seems likely that this remains true for ERA-Interim. OLRdiurnal cycle errors (Figure 9d) suggest that ERA-Interim underestimates mid-level cloud throughout the dayand particularly at night.
Precipitation diurnal cycle errors in ERA-Interim and the models (Figure 9b) are typical of general circulationmodels (GCMs) in convective regions [Dai, 2006]; the amplitude of the diurnal cycle is too large, and peak pre-cipitation occurs too early. However, at least some of the climate models do a better job of capturing theamplitude of the diurnal cycle of OLR (Figure 9d), which is also linked to convective cloud [Hartmann andRecker, 1986]. While CanAM4 and HadGEM2-A overestimate the amplitude, CNRM-CM5 and MRI-CGCM3perform better in reproducing the observed amplitude of the diurnal cycle of OLR of 18.8Wm�2, with ampli-tudes of 25.7Wm�2 and 16.3Wm�2, respectively. ERA-Interim also underestimates the amplitude of thediurnal cycle of OLR (relating to the overall underestimation in precipitation shown in Figure 8).
Each of the AMIP models has large biases between 8°W–8°E and 5–10°N in some (if not all) of the cloud cover,precipitation, and radiation fields considered here. ERA-Interim generally does a better job of reproducingthe mean observed values in the DACCIWA region, but Figure 8 shows that this is at least partly due to afortuitous cancelation of smaller-scale errors. Moreover, OLR and diurnal cycles related to convection inERA-Interim are problematic and over the wider West African region, ERA-Interim biases are as large as theAMIP models, with particularly notable OLR and cloud cover biases over the Sahel.
5. Conclusions
We have constructed a multisatellite climatology of clouds, top of atmosphere (TOA) radiation, and precipita-tion for southern West Africa during June–July to support ongoing investigations of the complex interactionswithin the West Africa monsoon (WAM) and the evaluation of ERA-Interim and climate model simulations.The primary characteristics of this climatology are as follows. Mean cloud cover in the DACCIWA regionranges from 68 to 94%, larger than the global average, which is around 68% [Stubenrauch et al., 2013].Consequently, the regional mean OSR of ~145Wm�2 is also larger than the global average of 100Wm�2,while the regional mean OLR of ~230Wm�2 is smaller than the tropical average of which is estimated tobe ~250Wm�2 [L’Ecuyer and Stephens, 2003]. Additionally, surface precipitation in the DACCIWA region is~5.87mmd�1 which is around double the global mean. Diurnal cycles of high cloud cover, precipitation,and OLR are typical of convective regions; high cloud cover and precipitation peak in the evening andcoincide with the minimum in the OLR diurnal cycle.
Journal of Geophysical Research: Atmospheres 10.1002/2016JD025246
HILL ET AL. MULTISATELLITE CLIMATOLOGY IN SWA 18

Total cloud cover and TOA shortwave and longwave fluxes show little interannual variability; for all three thestandard deviation is less than 2% of the mean. However, the interannual standard deviation of the regionalmean surface precipitation is much larger, around 15% of the mean, with mean values ranging from~4.5mmd�1 in 2013 to ~7.5mmd�1 in 2002. This interannual variability in precipitation in the DACCIWAregion is linked to the regional interannual variability of dry static energy. From an atmospheric energybudget perspective, interannual changes in latent heat release from precipitation are balanced by dry staticenergy changes of a similar magnitude.
Comparisons between different satellite products have been used to identify inconsistencies and determinewhich products are most suitable for further analysis. Differences between the TRMM and GPM precipitationdata sets are small, which is unsurprising given the similarity of their algorithms and their use of the samegauge data. The two radiation data sets, GERB and CERES-SYN, also show generally excellent agreement.However, CERES-SYN overestimates the diurnal mean outgoing SW flux due to insufficient temporal sam-pling. Differences between the satellite cloud observations are much larger. MODIS detects less high (45%compared to 74%) and total (89% compared to 94%) cloud cover than DARDAR but more cloud at all heightsthan CMSAF. All three satellite cloud products have faults. Temporal sampling in MODIS is poor and evenmore so in DARDAR, while CMSAF and MODIS underestimate cloud cover. We use MODIS for comparisonto ERA-Interim and the climate models as a compromise between temporal sampling and accuracy.Clearly, a deeper understanding of the interaction between clouds and radiation in this region requires morefrequent diurnal sampling than provided by MODIS, yet improvements in the geostationary satellite-basedCMSAF cloud products are necessary.
Based on our analysis of satellite products, we chose the products that are best suited for comparison to cli-matemodels and used these to identify a number of significant biases in the climatemodels. With one excep-tion (CanAM4), the AMIP5 models considered in this study significantly underestimate the MODIS-observedlow cloud cover (18%), with a multimodel mean value of 10%. This is consistent with large low cloud errors inthe previous generation of climate models over southern West Africa identified by Knippertz et al. [2011] andindeed with a more general climate model bias, where low cloud occurrence in the tropics is systematicallyunderestimated [Nam et al., 2012]. This is likely to have significant impacts on the surface radiation budget[Knippertz et al., 2011] and consequently the broader circulation [Li et al., 2015]; it is planned to examine thisin detail using radiation calculations in a future study. High-level and mid-level cloud cover errors are smaller,but there are deficiencies in the representation of their diurnal cycle and also that of precipitation, which arelinked to convection parametrization in the models [Pearson et al., 2013]. The models have a surprisinglybroad range of surface albedos, which leads to a substantial range of clear-sky outgoing SW flux values(62.7Wm�2 to 84.4Wm�2) and can mask the effect of cloud errors on the all-sky outgoing SW flux.
Despite assimilating observations, ERA-Interim shares many biases with the free-running climate models. Thisis thought to be due to a combination of a lack of nonsatellite observations to constrain ERA-Interim and thefact that cloud cover, surface precipitation, and top of atmosphere radiative fluxes, which are analyzed in thisarticle, are not directly assimilated. ERA-Interim generally has smaller domain-mean biases in the DACCIWAregion than the AMIP models. However, this is at least partly due to a cancelation of smaller-scale errors(Figure 8). Moreover, ERA-Interim precipitation diurnal cycle errors are as large as any of the AMIP models,as is the overestimate of OLR, both of which are likely to be due to deficiencies in the convection parametri-zation used. Over the broader SWA region, ERA-Interim performs no better than the AMIP models, withparticularly notable cloud and OLR errors over the Sahel, linked to a failure to capture the northwardprogression of the zonal precipitation maximum from June to July.
Current satellite observations provide a wealth of useful data for understanding the climate of southern WestAfrica. However, many aspects of the climate system in the DACCIWA region remain poorly understood andthere are a number of obvious areas that require either improved satellite products or observations fromother sources. In particular, there are large differences between cloud cover data sets and those that arethought to perform better lack adequate temporal sampling in a region with marked diurnal variability. Itis hoped that future releases of the CMSAF data set will address some of the errors identified by this studyas it provides the highest temporal resolution. Surface radiative flux estimates are required to understandthe local atmospheric radiation budget and, consequently, the energy budget. There is a lack of surface-based radiation measurements in the DACCIWA region, but satellite-based surface radiative flux products
Journal of Geophysical Research: Atmospheres 10.1002/2016JD025246
HILL ET AL. MULTISATELLITE CLIMATOLOGY IN SWA 19

such as the CERES-EBAF surface fluxes [Kato et al., 2013] and CMSAF-CLARA [Karlsson et al., 2013] provide anopportunity to fill this data gap. As these products rely on radiative transfer calculations and ancillary datawith associated uncertainties, further validation in the DACCIWA region is required. Similarly, satellitesstruggle to provide robust statistics for aerosol properties in the DACCIWA region due to the rarity of clearsky. The forthcoming DACCIWA field campaign [Knippertz et al., 2015a] will contribute additional observationsthat will be used directly for improving the understanding of the regional climate system and to furtherevaluate and suggest improvements to satellite products in this region.
Future work will focus on quantifying cloud radiative effects in SWA for individual cloud types, assessing howdifferent cloud types contribute to the regional energy budget, and consequently, how they affect theWAM circulation.
Appendix A
One limitation of passive satellite observations is their inability to detect multiple cloud layers, missing lowclouds that may exist beneath higher clouds. In contrast, active radar/lidar observations are less prone tothis problem. Consequently, it is difficult to compare estimates of low cloud cover from different satelliteobservations. To minimize the impact of these obscured clouds on our intercomparison, we define aweighted cloud cover that is normalized by nonobscured areas only. For mid-level clouds, the weightedcloud cover, Cmid,weighted is calculated by
Cmid;weighted ¼ Cmid;passive
1� Chigh; (A1)
where Cmid,passive is mid-level cloud fraction from passive observations and Chigh is high cloud cover. As thenearest clouds to the satellite, high cloud cover is not affected by clouds in other layers. Similarly, theweighted low cloud cover, Clow,weighted, is calculated as
Clow;weighted ¼ Clow;passive
1� Chigh þ Cmid;passive� � ; (A2)
where Clow,passive is low-level cloud fraction from passive observations. A schematic illustration of equations(A1) and (A2) can be found in Figure A1.
The difference between the true mid-level cloud cover, Cmid,true, and the passive mid-level cloud cover is thefraction of mid-level cloud that is obscured, i.e., the amount of overlap between mid-level and high-level
Figure A1. A schematic illustration explaining the definition and difference between the truth, passive-like, and weightedcloud covers.
Journal of Geophysical Research: Atmospheres 10.1002/2016JD025246
HILL ET AL. MULTISATELLITE CLIMATOLOGY IN SWA 20

clouds. Since the amount of overlap would be the product of mid-level and high-level cloud covers if theywere randomly overlapped, we then obtain
Cmid;true ¼ Cmid;passive ¼ ChighCmid;true: (A3)
By rearranging equation (A3), the true mid-level cloud cover is given by
Cmid;true ¼ Cmid;passive
1� Chigh; (A4)
which is the same as Cmid,weighted as shown in equation (A1), demonstrating that the weighted mid-levelcloud cover represents the true midcloud cover. Similarly, if low clouds are randomly overlapped with highand mid-level clouds, then the weighted low cloud cover is equal to the true low cloud cover.
ReferencesAllan, R. P., M. A. Ringer, J. A. Pamment, and A. Slingo (2004), Simulation of the Earth’s radiation budget by the European Centre for
Medium-Range Weather Forecasts 40-year reanalysis (ERA40), J. Geophys. Res., 109, D18107, doi:10.1029/2004JD004816.Bodas-Salcedo, A., et al. (2011), COSP: Satellite simulation software for model assessment, Bull. Am. Meteorol. Soc., 92(8), 1023–1043.Charney, J., W. J. Quirk, S. Chow, and J. Kornfield (1977), A comparative study of the effects of albedo change on drought in semi-arid regions,
J. Atmos. Sci., 34(9), 1366–1385.Chevallier, F., P. Bauer, G. Kelly, C. Jakob, and T. McNally (2001), Model clouds over oceans as seen from space: Comparison with HIRS/2 and
MSU radiances, J. Clim., 14(21), 4216–4229.Chung, E. S., B. J. Sohn, J. Schmetz, and M. Koenig (2007), Diurnal variation of upper tropospheric humidity and its relations to convective
activities over tropical Africa, Atmos. Chem. Phys., 7(10), 2489–2502.Clerbaux, N. (2003), Outgoing longwave flux estimation: Improvement of angular modelling using spectral information, Remote Sens.
Environ., 85(3), 389–395.Clerbaux, N., et al. (2009), Comparison of GERB instantaneous radiance and flux products with CERES Edition-2 data, Remote Sens. Environ.,
113(1), 102–114.Cook, K. H., and E. K. Vizy (2006), Coupled model simulations of the West African monsoon system: Twentieth- and twenty-first-century
simulations, J. Clim., 19(15), 3681–3703.Dai, A. (2006), Precipitation characteristics in eighteen coupled climate models, J. Clim., 19(18), 4605–4630.Dee, D. P., S. M. Uppala, A. J. Simmons, P. Berrisford, P. Poli, S. Kobayashi, et al. (2011), The ERA-Interim reanalysis: Configuration and
performance of the data assimilation system, Q. J. R. Meteorol. Soc., 137(656), 553–597.Delanoe, J., and R. J. Hogan (2010), Combined CloudSat-CALIPSO-MODIS retrievals, J. Geophys. Res., 115, D00H29, doi:10.1029/2009JD012346.Derrien, M., and H. Le Gleau (2005), MSG/SEVIRI cloud mask and type from SAFNWC, Int. J. Remote Sens., 26(21), 4707–4732.Dewitte, S., L. Gonzalez, N. Clerbaux, A. Ipe, C. Bertrand, and B. D. Paepe (2008), The Geostationary Earth Radiation Budget Edition 1 data
processing algorithms, Adv. Space Res., 41(11), 1906–1913.Doelling, D. R., N. G. Loeb, D. F. Keyes, M. L. Nordeen, D. Morstad, C. Nguyen, B. A. Wielicki, D. F. Young, and M. Sun (2013), Geostationary
enhanced temporal interpolation for CERES flux products, J. Atmos. Oceanic Technol., 30(6), 1072–1090.Dunning C.M., E. Black, and R. Allan (2016), The onset and cessation of seasonal rainfall over Africa, J. Geophys. Res. Atmos., 121, doi:10.1002/
2016JD025428.Ebert, E. E., J. E. Janowiak, and C. Kidd (2007), Comparison of near-real-time precipitation estimates from satellite observations and numerical
models, Bull. Am. Meteorol. Soc., 88(1), 47–64.Fink, A. H., D. G. Vincent, and V. Ermert (2006), Rainfall types in the West African Sudanian zone during the summer monsoon 2002,
Mon. Weather Rev., 134(8), 2143–2164.Frey, R. A., S. A. Ackerman, Y. Liu, K. I. Strabala, H. Zhang, J. R. Key, and X. Wang (2008), Cloud detection with MODIS. Part I: Improvements in
the MODIS Cloud Mask for Collection 5, J. Atmos. Oceanic Technol., 25(7), 1057–1072.Gaetani, M., B. Pohl, H. Douville, and B. Fontaine (2011), West African Monsoon influence on the summer Euro-Atlantic circulation, Geophys.
Res. Lett., 38, L09705, doi:10.1029/2011GL047150.Geleyn, J. F., and A. Hollingsworth (1979), An economical analytical method for the computation of the interaction between scattering and
line absorption of radiation, Contrib. Atmos. Phys., 52, 1–16.Gu, G., and R. F. Adler (2004), Seasonal evolution and variability associated with theWest Africanmonsoon system, J. Clim., 17(17), 3364–3377.Haladay, T., and G. Stephens (2009), Characteristics of tropical thin cirrus clouds deduced from joint CloudSat and CALIPSO observations,
J. Geophys. Res., 114, D00A25, doi:10.1029/2008JD010675.Harries, J. E., et al. (2005), The Geostationary Earth Radiation Budget Project, Bull. Am. Meteorol. Soc., 86(7), 945–960.Hartmann, D. L., and E. E. Recker (1986), Diurnal variation of outgoing longwave radiation in the tropics, J. Climate Appl. Meteorol., 25(6),
800–812.Hou, A. Y., R. K. Kakar, S. Neeck, A. A. Azarbarzin, C. D. Kummerow, M. Kojima, R. Oki, K. Nakamura, and T. Iguchi (2014), The Global
Precipitation Measurement Mission, Bull. Am. Meteorol. Soc., 95(5), 701–722.Hourdin, F., et al. (2010), AMMA-Model Intercomparison Project, Bull. Am. Meteorol. Soc., 91(1), 95–104.Huffman, G. J., D. T. Bolvin, E. J. Nelkin, D. B. Wolff, R. F. Adler, G. Gu, Y. Hong, K. P. Bowman, and E. F. Stocker (2007), The TRMM Multisatellite
Precipitation Analysis (TMPA): Quasi-global, multiyear, combined-sensor precipitation estimates at fine scales, J. Hydrometeorol., 8(1),38–55.
Huffman, G. J., et al. (2013), NASA Global Precipitation Measurement (GPM) Integrated Multi-satellitE Retrievals for GPM (IMERG) Algorithmtheoretical basis document, version 4.1. NASA.
Jianping, L., and Z. Qingcun (2003), A new monsoon index and the geographical distribution of the global monsoons, Adv. Atmos. Sci., 20(2),299–302.
Karlsson, K.-G., et al. (2013), CLARA-A1: A cloud, albedo, and radiation dataset from 28 yr of global AVHRR data, Atmos. Chem. Phys., 13(10),5351–5367.
Journal of Geophysical Research: Atmospheres 10.1002/2016JD025246
HILL ET AL. MULTISATELLITE CLIMATOLOGY IN SWA 21
AcknowledgmentsWe thank three anonymous reviewersfor their positive and constructivecomments. The research leading to thispublication has received funding fromthe European Union 7th FrameworkProgramme (FP7/2007-2013) undergrant agreement 603502 (EU projectDACCIWA: Dynamics-Aerosol-Chemistry-Cloud Interactions in WestAfrica). We would like to thank MartinStengel for assistance with the CMSAF-CLAAS data and Chunlei Liu for assis-tance with energy budget calculations.MODIS data can be obtained from theLAADS Web page (https://ladsweb.nas-com.nasa.gov/data/search.html).CMSAF-CLAAS data were obtained fromthe CMSAF web user interface (https://wui.cmsaf.eu/safira/action/viewProduktSearch). The CloudSat-CALIPSO merged product, DARDAR-MASK, is available from the ICARE dataand services Center (icare.univ-lille1.fr/projects/dardar). TRMM and GPM datawere obtained from the GES DISC sim-ple subset wizard (http://disc.sci.gsfc.nasa.gov/SSW/). GPCC data can beobtained from Deutscher Wetterdienst(ftp://ftp.dwd.de/pub/data/gpcc/html/fulldata_v7_doi_download.html). CERESdata can be obtained from the LRCAtmospheric Science Data Center(http://ceres.larc.nasa.gov/order_data.php). GERB data can be accessed via ftpfrom the Royal Meteorological Instituteof Belgium (ftp://gerb.oma.be). The ERA-Interim data used in this study can beobtained from the ECMWF data server(http://apps.ecmwf.int/datasets/).AMIP5 data are available from https://pcmdi9.llnl.gov/projects/esgf-llnl. Weacknowledge the World ClimateResearch Programme’s Working Groupon Coupled Modeling, which is respon-sible for CMIP, and we thank the climatemodeling groups for producing andmaking available their model output.For CMIP the U.S. Department ofEnergy’s Program for Climate ModelDiagnosis and Intercomparison pro-vides coordinating support and leddevelopment of software infrastructurein partnership with the GlobalOrganization for Earth System

Kato, S. (2003), Computation of domain-averaged shortwave irradiance by a one-dimensional algorithm incorporating correlations betweenoptical thickness and direct incident radiation, J. Atmos. Sci., 60(1), 182–193.
Kato, S., N. G. Loeb, F. G. Rose, F. G. Doelling, D. A. Rutan, T. E. Caldwell, L. Yu, and R. A. Weller (2013), Surface irradiances consistent withCERES-derived top-of-atmosphere shortwave and longwave irradiances, J. Clim., 26(8), 2719–2749.
Knippertz, P., A. H. Fink, R. Schuster, J. Trentmann, J. M. Schrage, and C. Yorke (2011), Ultra-low clouds over the southern West Africanmonsoon region, Geophys. Res. Lett., 38, L21808, doi:10.1029/2011GL049278.
Knippertz, P., et al. (2015a), The DACCIWA project: Dynamics-Aerosol-Chemistry-Cloud Interactions in West Africa, Bull. Am. Meteorol. Soc.,doi:10.1175/BAMS-D-14-00108.1.
Knippertz, P., M. J. Evans, P. R. Field, A. H. Fink, C. Liousse, and J. H. Marsham (2015b), The possible role of local air pollution in climate changein West Africa, Nat. Clim. Change, 5(9), 815–822.
Le Barbé, L., T. Lebel, and D. Tapsoba (2002), Rainfall variability in West Africa during the years 1950–90, J. Clim., 15(2), 187–202.L’Ecuyer, T. S., and G. L. Stephens (2003), The tropical oceanic energy budget from the TRMM perspective. Part I: Algorithm and uncertainties,
J. Clim., 16(12), 1967–1985.Lee, J., P. Yang, A. E. Dessler, B.-C. Gao, and S. Platnick (2009), Distribution and radiative forcing of tropical thin cirrus clouds, J. Atmos. Sci.,
66(12), 3721–3731.Li, J., C. L. Curry, Z. Sun, and F. Zhang (2010), Overlap of solar and infrared spectra and the shortwave radiative effect of methane, J. Atmos.
Sci., 67(7), 2372–2389.Li, R., J. Jin, S.-Y. Wang, and R. R. Gillies (2015), Significant impacts of radiation physics in the Weather Research and Forecasting model on the
precipitation and dynamics of the West African Monsoon, Clim. Dyn., 44(5–6), 1583–1594.Liu, C., R. P. Allan, P. Berrisford, M. Mayer, P. Hyder, N. Loeb, D. Smith, P.-L. Vidale, and J. M. Edwards (2015), Combining satellite observations
and reanalysis energy transports to estimate global net surface energy fluxes 1985–2012, J. Geophys. Res. Atmos., 120, 9374–9389,doi:10.1002/2015JD023264.
Liu, Z. (2016), Comparison of Integrated Multisatellite Retrievals for GPM (IMERG) and TRMM Multisatellite Precipitation Analysis (TMPA)monthly precipitation products: Initial results, J. Hydrometeorol., 17(3), 777–790.
Loeb, N. G., N. Manalo-Smith, S. Kato, W. F. Miller, S. K. Gupta, P. Minnis, and B. A. Wielicki (2003), Angular distribution models fortop-of-atmosphere radiative flux estimation from the Clouds and the Earth’s Radiant Energy System instrument on the Tropical RainfallMeasuring Mission satellite. Part I: Methodology, J. Appl. Meteorol., 42(2), 240–265.
Loeb, N. G., B. A. Wielicki, D. R. Doelling, G. L. Smith, D. F. Keyes, S. Kato, N. Manalo-Smith, and T. Wong (2009), Toward optimal closure of theEarth’s top-of-atmosphere radiation budget, J. Clim., 22(3), 748–766.
Manners, J., J.-C. Thelen, J. Petch, P. Hill, and J. M. Edwards (2009), Two fast radiative transfer methods to improve the temporal sampling ofclouds in numerical weather prediction and climate models, Q. J. R. Meteorol. Soc., 135, 457–468.
Marsham, J. H., N. S. Dixon, L. Garcia-Carreras, G. M. Lister, D. J. Parker, P. Knippertz, and C. E. Birch (2013), The role of moist convection in theWest African monsoon system: Insights from continental-scale convection-permitting simulations, Geophys. Res. Lett., 40, 1843–1849,doi:10.1002/grl.50347.
Minnis, P., et al. (2011), CERES edition-2 cloud property retrievals using TRMM VIRS and Terra and Aqua MODIS Data. Part I: Examples ofaverage results and comparisons with other data, IEEE Trans. Geosci. Remote Sens., 49(11), 4374–4400.
Muller, C. J., and P. A. O’Gorman (2011), An energetic perspective on the regional response of precipitation to climate change, Nat. Clim.Change, 1(5), 266–271.
Nam, C., S. Bony, J.-L. Dufresne, and H. Chepfer (2012), The “too few, too bright” tropical low-cloud problem in CMIP5 models, Geophys. Res.Lett., 39, L21801, doi:10.1029/2012GL053421.
Nelson, A. (2004), Population density for Africa in 2000 Population Density for Africa in 2000, fourth. UNEP/GRID Sioux Falls.Nesbitt, S. W., and E. J. Zipser (2003), The diurnal cycle of rainfall and convective intensity according to three years of TRMM measurements,
J. Clim., 16(10), 1456–1475.Nicholson, S. E., et al. (2003), Validation of TRMM and other rainfall estimates with a high-density gauge dataset for West Africa. Part I:
Validation of GPCC rainfall product and pre-TRMM satellite and blended products, J. Appl. Meteorol., 42(10), 1337–1354.Omotosho, J. (1988), Spatial variation of rainfall in Nigeria during the “little dry season”, Atmos. Res., 22(2), 137–147.Pachauri, R. K., et al. (2014), in Climate Change 2014: Synthesis Report. Contribution of Working Groups I, II and III to the Fifth Assessment Report
of the Intergovernmental Panel on Climate Change, edited by R. Pachauri and L. Meyer, pp. 151, IPCC, Geneva, Switz.Paeth, H., et al. (2011), Progress in regional downscaling of West African precipitation, Atmos. Sci. Lett., 12(1), 75–82.Pearson, K. J., G. M. Lister, C. E. Birch, R. P. Allan, R. J. Hogan, and S. J. Woolnough (2013), Modelling the diurnal cycle of tropical convection
across the “grey zone”, Q. J. R. Meteorol. Soc., 140(679), 491–499.Pfeifroth, U., J. Trentmann, A. H. Fink, and B. Ahrens (2016), Evaluating satellite-based diurnal cycles of precipitation in the African tropics,
J. Appl. Meteorol. Climatol., 55(1), 23–39.Platnick, S. E. (2015),MODIS Atmosphere L3Daily Product. NASAMODIS Adaptive Processing System, Goddard Space Flight Center, Greenbelt,Md.Platnick, S., M. King, S. Ackerman, W. Menzel, B. Baum, J. Riedi, and R. A. Frey (2003), The MODIS cloud products: Algorithms and examples
from Terra, IEEE Trans. Geosci. Remote Sens., 41(2), 459–473.Priestley, K., B. Wielicki, R. Green, M. Haeffelin, R. Lee, and N. Loeb (2002), Early radiometric validation results of the CERES Flight Model 1 and
2 instruments onboard NASA’s Terra spacecraft, Adv. Space Res., 30(11), 2371–2376.Reuter, M., W. Thomas, P. Albert, M. Lockhoff, R. Weber, K.-G. Karlsson, and J. Fischer (2009), The CM-SAF and FUB cloud detection schemes
for SEVIRI: Validation with synoptic data and initial comparison with MODIS and CALIPSO, J. Appl. Meteorol. Climatol., 48(2), 301–316.Roca, R., P. Chambon, I. Jobard, P.-E. Kirstetter, M. Gosset, and J. C. Berges (2010), Comparing satellite and surface rainfall products over West
Africa at meteorologically relevant scales during the AMMA campaign using error estimates, J. Appl. Meteorol. Climatol., 49(4), 715–731.Roehrig, R., D. Bouniol, F. Guichard, F. Hourdin, and J.-L. Redelsperger (2013), The present and future of the West African monsoon:
A process-oriented assessment of CMIP5 simulations along the AMMA transect, J. Clim., 26(17), 6471–6505.Rutan, D. A., S. Kato, D. R. Doelling, F. G. Rose, L. T. Nguyen, T. E. Caldwell, and N. G. Loeb (2015), CERES synoptic product: Methodology and
validation of surface radiant flux, J. Atmos. Oceanic Technol., 32(6), 1121–1143.Schneider, U., A. Becker, P. Finger, A. Meyer-Christoffer, M. Ziese, and B. Rudolf (2014), GPCC’s new land surface precipitation climatology
based on quality-controlled in situ data and its role in quantifying the global water cycle, Theor. Appl. Climatol., 115(1–2), 15–40.Schrage, J. M., and A. H. Fink (2012), Nocturnal continental low-level stratus over tropical West Africa: Observations and possible mechanisms
controlling its onset, Mon. Weather Rev., 140(6), 1794–1809.Schrage, J. M., S. Augustyn, and A. H. Fink (2006), Nocturnal stratiform cloudiness during the West African monsoon, Meteorol. Atmos. Phys.,
95(1–2), 73–86.
Journal of Geophysical Research: Atmospheres 10.1002/2016JD025246
HILL ET AL. MULTISATELLITE CLIMATOLOGY IN SWA 22

Soden, B. J. (2000), The diurnal cycle of convection, clouds, and water vapor in the tropical upper troposphere, Geophys. Res. Lett., 27(15),2173–2176, doi:10.1029/2000GL011436.
Sorooshian, S., et al. (2011), Advanced concepts on remote sensing of precipitation at multiple scales, Bull. Am. Meteorol. Soc., 92(10),1353–1357.
Stein, T. H., D. J. Parker, J. Delanoe, N. S. Dixon, R. J. Hogan, P. Knippertz, R. I. Maidment, and J. H. Marsham (2011), The vertical cloud structureof the West African monsoon: A 4 year climatology using CloudSat and CALIPSO, J. Geophys. Res., 116, D22205, doi:10.1029/2011JD016029.
Stein, T. H., D. J. Parker, R. J. Hogan, C. E. Birch, C. E. Holloway, G. M. Lister, J. H. Marsham, and S. J. Woolnough (2015), The representation of theWest African monsoon vertical cloud structure in the Met Office Unified Model: An evaluation with CloudSat, Q. J. R. Meteorol. Soc.,141(693), 3312–3324.
Stengel, M. S., A. K. Kniffka, J. F. Meirink, M. L. Lockhoff, J. T. Tan, and R. H. Hollmann (2014), CLAAS: The CM SAF cloud property data set usingSEVIRI, Atmos. Chem. Phys., 14(8), 4297–4311.
Stephens, G. L., et al. (2002), The CloudSat mission and the A-Train: A new dimension of space-based observations of clouds andprecipitation, Bull. Am. Meteorol. Soc., 83(12), 1771–1790.
Stubenrauch, C. J., et al. (2013), Assessment of global cloud datasets from satellites: Project and database initiated by the GEWEX radiationpanel, Bull. Am. Meteorol. Soc., 94(7), 1031–1049.
Sultan, B., S. Janicot, and A. Diedhiou (2003), The West African monsoon dynamics. Part I: Documentation of intraseasonal variability, J. Clim.,16(21), 3389–3406.
Sultan, B., C. Baron, M. Dingkuhn, B. Sarr, and S. Janicot (2005a), Agricultural impacts of large-scale variability of the West African monsoon,Agric. For. Meteorol., 128(1-2), 93–110.
Sultan, B., K. Labadi, J.-F. Guegan, and S. Janicot (2005b), Climate drives the meningitis epidemics onset in West Africa, PLoS Med., 2(1),doi:10.1371/journal.pmed.0020006.
Sun, W., G. Videen, S. Kato, B. Lin, C. Lukashin, and Y. Hu (2011), A study of subvisual clouds and their radiation effect with a synergy of CERES,MODIS, CALIPSO, and AIRS data, J. Geophys. Res., 116, D22207, doi:10.1029/2011JD016422.
Sylla, M. B., A. Dell’Aquila, P. M. Ruti, and F. Giorgi (2009), Simulation of the intraseasonal and the interannual variability of rainfall over WestAfrica with RegCM3 during the monsoon period, Int. J. Climatol., 30(12), 1865–1883.
Taylor, C. M., E. F. Lambin, N. Stephenne, R. J. Harding, and R. L. Essery (2002), The influence of land use change on climate in the Sahel,J. Clim., 15(24), 3615–3629.
Taylor, K. E., R. J. Stouffer, and G. A. Meehl (2012), An overview of CMIP5 and the experiment design, Bull. Am. Meteorol. Soc., 93(4), 485–498.Thorncroft, C. D., H. Nguyen, C. Zhang, and P. Peyrille (2011), Annual cycle of the West African monsoon: Regional circulations and associated
water vapour transport, Q. J. R. Meteorol. Soc., 137(654), 129–147.Tian, B. (2004), Diurnal cycle of convection, clouds, and water vapor in the tropical upper troposphere: Satellites versus a general circulation
model, J. Geophys. Res., 109, D10101, doi:10.1029/2003JD004117.Tian, Y., C. D. Peters-Lidard, J. B. Eylander, R. J. Joyce, G. J. Huffman, R. F. Adler, K.-L. Hsu, F. J. Turk, M. Garcia, and J. Zeng (2009), Component
analysis of errors in satellite-based precipitation estimates, J. Geophys. Res., 114, D24101, doi:10.1029/2009JD011949.van der Linden, R., A. H. Fink, and R. Redl (2015), Satellite-based climatology of low-level continental clouds in southern West Africa during
the summer monsoon season, J. Geophys. Res. Atmos., 120, 1186–1201, doi:10.1002/2014JD022614.Wielicki, B. A., B. R. Barkstrom, E. F. Harrison, R. B. Lee, G. L. Smith, and J. E. Cooper (1996), Clouds and the Earth’s Radiant Energy System
(CERES): An Earth Observing System experiment, Bull. Am. Meteorol. Soc., 77(5), 853–868.Winker, D. M., M. A. Vaughan, A. Omar, Y. Hu, K. A. Powell, Z. Liu, W. H. Hunt, and S. A. Young (2009), Overview of the CALIPSO mission and
CALIOP data processing algorithms, J. Atmos. Oceanic Technol., 26(11), 2310–2323.Worqlul, A. W., B. Maathuis, A. A. Adem, S. S. Demissie, S. Langan, and T. S. Steenhuis (2014), Comparison of rainfall estimations by TRMM
3B42, MPEG and CFSR with ground-observed data for the Lake Tana basin in Ethiopia, Hydrol. Earth Syst. Sci., 18(12), 4871–4881.Zhou, L., M. Zhang, Q. Bao, and Y. Liu (2015), On the incident solar radiation in CMIP5 models, Geophys. Res. Lett., 42, 1930–1935, doi:10.1002/
2015GL063239.
Journal of Geophysical Research: Atmospheres 10.1002/2016JD025246
HILL ET AL. MULTISATELLITE CLIMATOLOGY IN SWA 23