a microfluidic needle for sampling and delivery of
TRANSCRIPT

1
A Microfluidic Needle for Sampling and Delivery of Chemical
Signals by Segmented Flows
Shilun Feng a, c, Guozhen Liu b, c, e, Lianmei Jiang b, c, Yonggang Zhu d, Ewa M. Goldys b, c & David W. Inglis a, c*
*[email protected]; +61 2 9850 9144.
a. School of Engineering, Macquarie University, NSW 2109 Australia
b. Department of Physics and Astronomy, Macquarie University, NSW 2109 Australia
c. ARC Centre of Excellence for Nanoscale BioPhotonics (CNBP), Macquarie University, NSW 2109 Australia
d. School of Science, RMIT University, Melbourne, VIC 3001, Australia
e. Key Laboratory of Pesticide and Chemical Biology of Ministry of Education, College of Chemistry, Central China Normal University, Wuhan 430079, P.R. China
We have developed a microfluidic needle-like device that can extract and deliver nanoliter samples. The device
consists of a T-junction to form segmented flows, parallel channels to and from the needle tip, and seven
hydrophilic capillaries at the tip that form a phase-extraction region. The main microchannel is hydrophobic and
carries segmented flows of water-in-oil. The hydrophilic capillaries transport the aqueous phase with nearly zero
pressure gradient, but require a 19 kPa pressure gradient for mineral oil to invade and flow through. Using this
device, we demonstrate the delivery of nanoliter droplets, and demonstrate sampling through the formation of
droplets at the tip of our device. During sampling, we recorded the fluorescence intensities of the droplets formed
at the tip while varying the concentration of dye outside the tip. We measured chemical signal response time of
approximately 3 s. The linear relationship between the recorded fluorescence intensity of samples and the external
dye concentration (10 to 40 µg/mL) indicates that this device is capable of quantitative, real-time measurements
of rapidly varying chemical signals.
Keywords: needle, segmented flow, delivery, sampling, microfluidics.

2
1. Introduction
Sampling and delivery of nanoliter and picoliter volumes of aqueous body fluids is an active area of biomedical
research. Accurate sampling of fluids whose composition varies rapidly cannot be done using traditional
technologies. In particular, conventional needles for intravenous, intrathecal or other uses, including microneedle
arrays1, cannot accurately transport time-varying concentrations of chemicals accurately due to Taylor dispersion.
In 1953, Taylor described this effect as “the combined action of molecular diffusion and the variation of velocity
over the cross section”2. This process is analogous to intermodal dispersion in optical fibres and significantly
disrupts chemical information transported through a channel3. This dispersive effect severely limits the temporal
precision of signals and makes it difficult to transport intact chemical samples from a remote site, as illustrated in
Figure 1.
Recent work by Ostromohov et al.4 clearly demonstrates how droplets or segmented flows could solve the
problem of transporting chemical signals without significant dispersion in time and space. A definition of ‘droplet’
in the microfluidic context is a quantity of fluid that forms naturally into one spherical volume within another
immiscible phase. In this work, we focus on “segmented flows” where the aqueous phase forms discrete volumes
that nearly fill the channel. Studies of segmented flows in microchannels predate the explosion of microfluidic
Figure 1. 2D Simulation of a chemical signal transported along a 200 m wide, 2.6 mm long, capillary containing water. The concentration at the input is stepped from 10 to 40 (AU), the diffusion coefficient is 1.5 x 10⁻⁹ m2/s and the maximum velocity in the channel is 1 mm/s. In just a few mm of travel, the step changes in concentration are lost.
3
droplet research by nearly 50 years5,6; however, their use to transport biochemical signals has only been
demonstrated in the past decade.
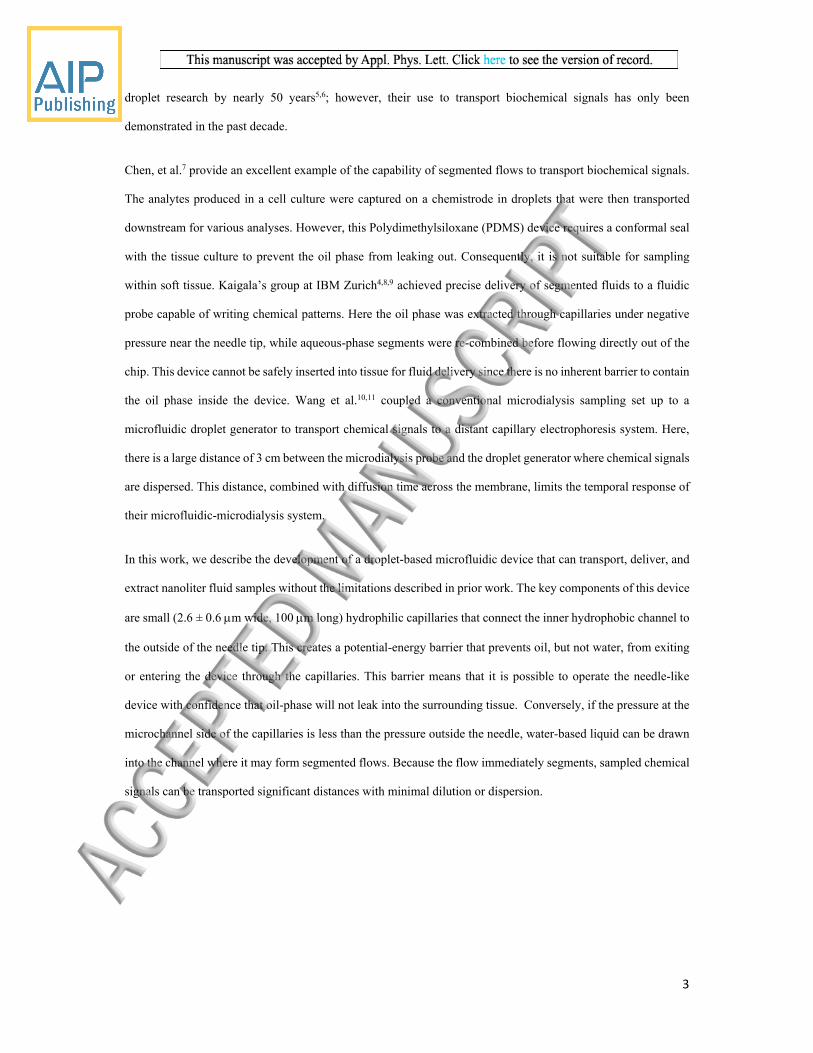
Chen, et al.7 provide an excellent example of the capability of segmented flows to transport biochemical signals.
The analytes produced in a cell culture were captured on a chemistrode in droplets that were then transported
downstream for various analyses. However, this Polydimethylsiloxane (PDMS) device requires a conformal seal
with the tissue culture to prevent the oil phase from leaking out. Consequently, it is not suitable for sampling
within soft tissue. Kaigala’s group at IBM Zurich4,8,9 achieved precise delivery of segmented fluids to a fluidic
probe capable of writing chemical patterns. Here the oil phase was extracted through capillaries under negative
pressure near the needle tip, while aqueous-phase segments were re-combined before flowing directly out of the
chip. This device cannot be safely inserted into tissue for fluid delivery since there is no inherent barrier to contain
the oil phase inside the device. Wang et al.10,11 coupled a conventional microdialysis sampling set up to a
microfluidic droplet generator to transport chemical signals to a distant capillary electrophoresis system. Here,
there is a large distance of 3 cm between the microdialysis probe and the droplet generator where chemical signals
are dispersed. This distance, combined with diffusion time across the membrane, limits the temporal response of
their microfluidic-microdialysis system.
In this work, we describe the development of a droplet-based microfluidic device that can transport, deliver, and
extract nanoliter fluid samples without the limitations described in prior work. The key components of this device
are small (2.6 ± 0.6 m wide, 100 m long) hydrophilic capillaries that connect the inner hydrophobic channel to
the outside of the needle tip. This creates a potential-energy barrier that prevents oil, but not water, from exiting
or entering the device through the capillaries. This barrier means that it is possible to operate the needle-like
device with confidence that oil-phase will not leak into the surrounding tissue. Conversely, if the pressure at the
microchannel side of the capillaries is less than the pressure outside the needle, water-based liquid can be drawn
into the channel where it may form segmented flows. Because the flow immediately segments, sampled chemical
signals can be transported significant distances with minimal dilution or dispersion.

4
2. Theory
A static fluid boundary, such as the meniscus of water in a cylinder, is associated with a pressure difference (P)
between the two fluids. This Laplace pressure is given by12:
∆P cos θ …….…… (1)
where τis the surface tension for the particular fluid interface, is the radius of the cylinder, and is the contact
angle for the two fluids at the solid boundary. For a channel with a rectangular cross-section, the capillary pressure
is given by13
∆P 2τ cos θ ……….…….……… (2)
where h and w are the depth and width of the channel, respectively.
This pressure must be overcome in order to wet a hydrophobic channel or dry a hydrophilic one. It must also be
overcome in order to replace water in a hydrophilic channel with oil, provided the oil/water contact angle at the
surface is less than 90o. This is the case for clean silica surfaces. If a segmented-flow device is to be used as a
needle, this pressure should be high enough to prevent oil from inadvertently leaking out of the needle. We define
‘breakthrough pressure’ as the pressure required to drive oil out of the chip through wet capillaries.
3. Device design
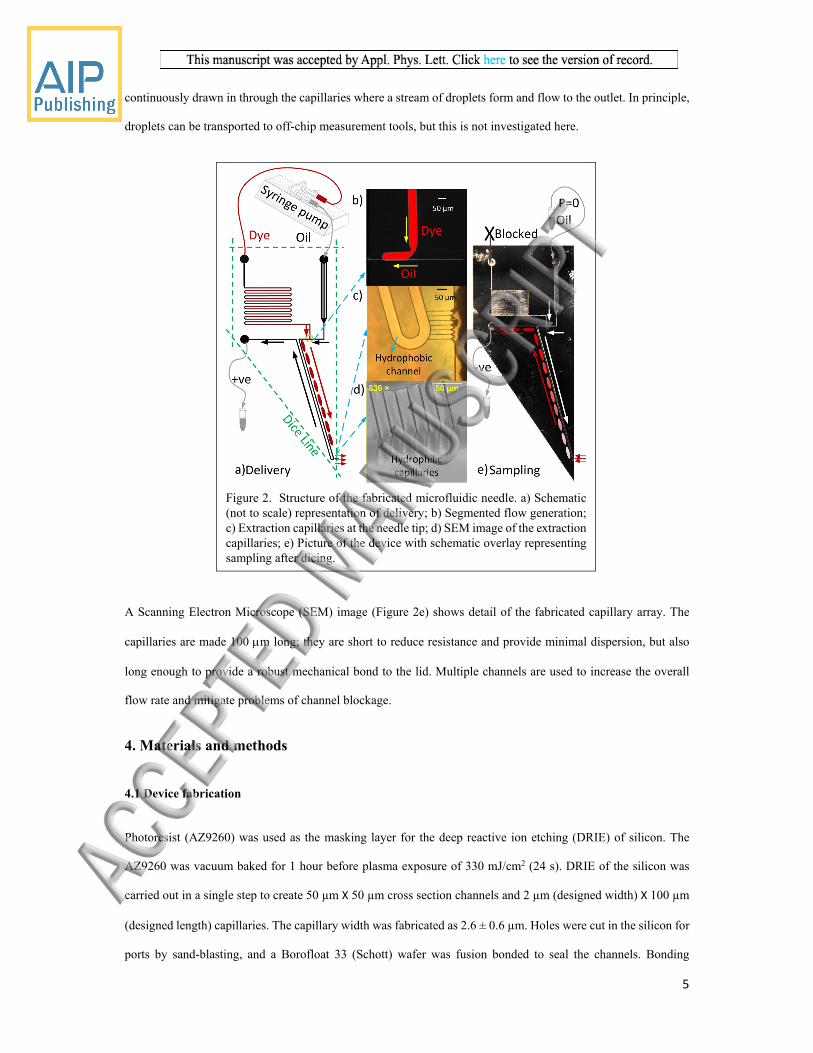
The device is shown in Figure 2. The oil input path has multiple parallel channels to reduce hydraulic resistance,
while the aqueous inlet is a long, 50-µm wide, serpentine channel to increase hydraulic resistance. This ensures
that the inlet pressures required to form segmented flows are similar, leading to a more consistent droplet
generation rate14. For droplet delivery (Figure 2a), the oil phase and aqueous phase are driven by syringe pump
and meet at the T-junction (Figure 2c). The segmented flows are carried along the hydrophobic microchannel (50
µm wide and 50 µm high) to the phase-extraction region (Figure 2d). The aqueous droplet merges with fluid at
the entrance of the hydrophilic capillaries (Figure 2e). Sampling is shown in Figure 2b. Here the water inlet is
blocked, the oil inlet is kept at 0 pressure, and the outlet is given a negative pressure. Aqueous fluid sample is
5
continuously drawn in through the capillaries where a stream of droplets form and flow to the outlet. In principle,
droplets can be transported to off-chip measurement tools, but this is not investigated here.
A Scanning Electron Microscope (SEM) image (Figure 2e) shows detail of the fabricated capillary array. The
capillaries are made 100 m long; they are short to reduce resistance and provide minimal dispersion, but also
long enough to provide a robust mechanical bond to the lid. Multiple channels are used to increase the overall
flow rate and mitigate problems of channel blockage.
4. Materials and methods
4.1 Device fabrication
Photoresist (AZ9260) was used as the masking layer for the deep reactive ion etching (DRIE) of silicon. The
AZ9260 was vacuum baked for 1 hour before plasma exposure of 330 mJ/cm2 (24 s). DRIE of the silicon was
carried out in a single step to create 50 µm Χ 50 µm cross section channels and 2 µm (designed width) Χ 100 µm
(designed length) capillaries. The capillary width was fabricated as 2.6 ± 0.6 µm. Holes were cut in the silicon for
ports by sand-blasting, and a Borofloat 33 (Schott) wafer was fusion bonded to seal the channels. Bonding
Figure 2. Structure of the fabricated microfluidic needle. a) Schematic (not to scale) representation of delivery; b) Segmented flow generation; c) Extraction capillaries at the needle tip; d) SEM image of the extraction capillaries; e) Picture of the device with schematic overlay representing sampling after dicing.

6
consisted of a reverse Radio Corporation of America (RCA) clean, followed by 375 baking for 12 h15. Prior to
dicing, wax was melted into the channels to prevent clogging of small features. After dicing, the wax was removed
by soaking in heptane at 65 overnight. After drying, Sigmacoate (Sigma Aldrich) was used to render the
channels hydrophobic with further baking at 120 for 1 h. The capillaries are brought back to a hydrophilic state
by stripping the silane layer. This is done by flowing 2-propanol at both the inlet (10 kPa) and the outlet (-100
kPa) through the 50 µm channels while drawing 0.1 M potassium hydroxide through the capillaries.
4.2 Experimental setup
The experimental setup includes a Maesflow 4C (Fluigent) system for positive pressure control, 2 syringe pumps,
and a homemade system to apply and measure negative pressure. The oil was first passed through the oil input
port, filling all channels. The dye solution (rhodamine in water) was driven through the water input port until it
reached the T-junction. Segmented flows formed at the T-junction flow down a channel to the aqueous phase
extraction region at the needle tip.
For fluorescence experiments, as shown in Figure 4c, we made dilutions in advance and checked for a linear
fluorescence response using our fluorescence microscope. During the experiment we glue a coverglass to the front
face of the device which supports a small pool of liquid around the capillaries. Using a pipette, we place 10 µL of
liquid on the cover glass and at the capillaries. We start with the lowest concentration, then after a time quickly
remove and replace the droplet with a higher-concentration pool. We recorded all images using an epi-
fluorescence microscope with a monochrome camera (NIKON DS-Qi1Mc), CoolLED pE300 and appropriate
filter cubes. For the data in Figure 4c, we used a 20x long-working-distance objective with an exposure time of
66 ms, and a frame rate of approximately 10 fp. Images and movies were analysed and prepared for publication
using ImageJ. In Figure 4c, we plot the maximum intensity in the channel as a function of time minus the average
background intensity. Figure 3 uses a custom grey-to-green look-up table.

7
5. Results
5.1 Segmented-flow generation and delivery
In order to generate consistent dye segments we control the oil (540 µL/h) and water (80 µL/h) inputs using two
syringe pumps. We applied a small positive pressure to the outlet to ensure complete droplet ejection. This
pressure was typically a few kPa (Figure 2a). Figure 3a demonstrates the process of droplet delivery at the needle
tip. We observed that when the segmented aqueous fluids were transported to the end of the tip only the fluorescent
dye segments flow out of the microchannel via the capillaries; the oil phase continued to flow along the large
microchannel to the exit port.
To measure the breakthrough pressure, the tip of the needle was first immersed in a drop of fluorescent dye, and
the oil was flowed through the entire chip. The same pressure was applied to all three ports, and it was increased
until the oil was observed to form dark droplets outside the needle. The breakthrough pressure was recorded as
19 ± 2 kPa. Using this value and Equations 1 and 2, and a surface tension of 49.6 mN/m at roomtemperature
22 ) 16, we estimate the contact angle in a 2.6-µm capillary to be 75.2 ± 1.6°.
5.2 Fluid sampling with segmented flow
Figure 3b demonstrates the process of sampling using our device. With both inlets filled with oil, we block the
aqueous input and set the oil input to zero. The needle tip was immersed in a rhodamine B dye solution and the
Figure 3: The process of droplet delivery (a) and sampling (b).
8
pressure at the outlet was set at -13 kPa. In these conditions, the capillaries at the tip were able to sample the dye
solution causing a sequence of segments in the main channel that flowed to the outlet port.
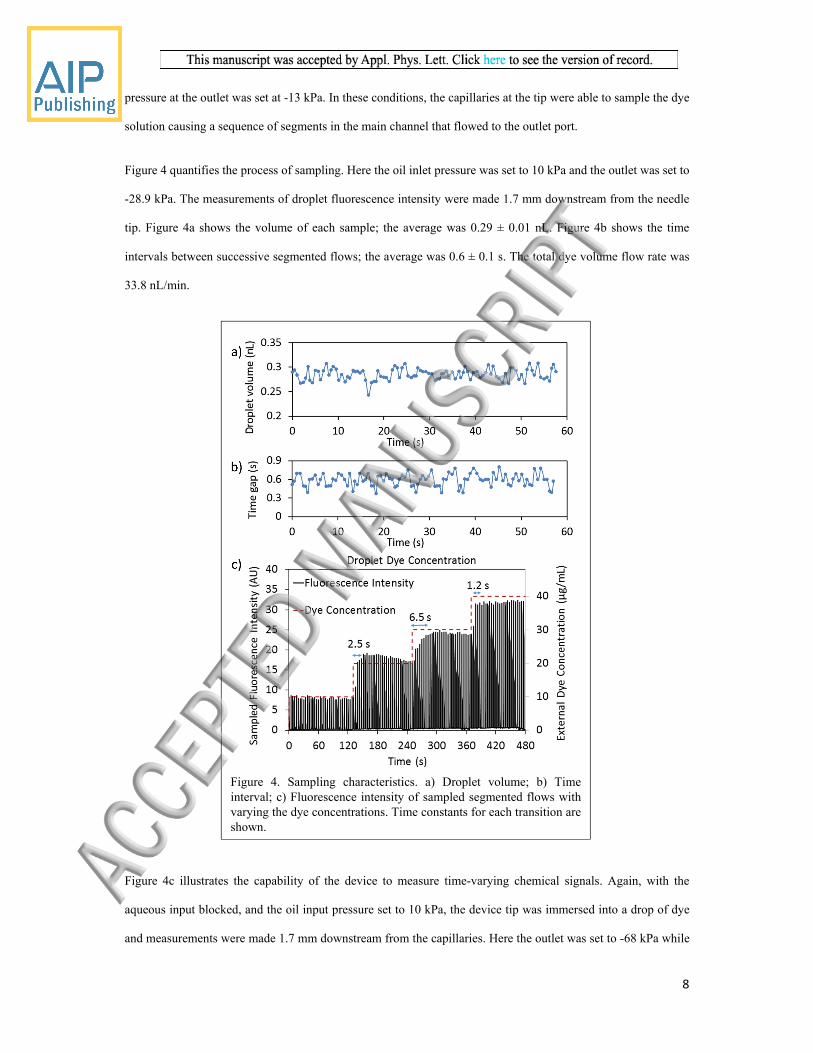
Figure 4 quantifies the process of sampling. Here the oil inlet pressure was set to 10 kPa and the outlet was set to
-28.9 kPa. The measurements of droplet fluorescence intensity were made 1.7 mm downstream from the needle
tip. Figure 4a shows the volume of each sample; the average was 0.29 ± 0.01 nL. Figure 4b shows the time
intervals between successive segmented flows; the average was 0.6 ± 0.1 s. The total dye volume flow rate was
33.8 nL/min.
Figure 4c illustrates the capability of the device to measure time-varying chemical signals. Again, with the
aqueous input blocked, and the oil input pressure set to 10 kPa, the device tip was immersed into a drop of dye
and measurements were made 1.7 mm downstream from the capillaries. Here the outlet was set to -68 kPa while
Figure 4. Sampling characteristics. a) Droplet volume; b) Time interval; c) Fluorescence intensity of sampled segmented flows with varying the dye concentrations. Time constants for each transition are shown.

9
the dye concentration outside the device (at the needle tip) was varied from 0.01 g/L to 0.04 g/L The fluorescence
intensities of the droplets were recorded, and analysed by ImageJ. We fit each step to a sigmoidal function with
response time constants of 2.5, 6.5 and 1.2 s. The average response time is 3.4 s. These values are much lower
than the 15 s observed by Wang et al.11. The linear relationship between the recorded fluorescence intensity and
the dye concentration (10 µg/mL, 20 µg/mL, 30 µg/mL and 40 µg/mL) of the segmented flows over 8 min suggests
that this device may be able to carry out real-time chemical measurement with a very rapid response time.
6. Discussion
This device was realized by leveraging Laplace pressure to restrict the flow of the oil phase in a droplet
microfluidic system. This is enabled by a transition from hydrophobic to hydrophilic surfaces; however, the
location of the hydrophobic-hydrophilic interface is difficult to control. It may lie exactly at the capillary entrance,
or further into the main channel. The location of the hydrophobic-hydrophilic interface has a small effect on the
breakthrough pressure, but it does affect the details of how sampled segmented flows form in the microchannel.
Another critical parameter that varied is the width of the capillaries. The capillary width is designed to be 2 m,
but due to fabrication process variation we found the average to be 2.6 m, with a standard deviation of 0.6 µm.
This affects the breakthrough pressure. Further channel size variations may be due to particles or molecules
adhering to and or blocking the capillaries. These effects are not expected to significantly reduce the breakthrough
pressure, but will change the resistance of the channels, and hence the rate that the aqueous phase can be expelled
or sampled.
Surface tension (Eq. 2) is affected by temperature, which may vary in real time and will be higher in living tissue.
At 37 , we expect the water-oil surface tension to reduce to 48.1 mN/m, from 49.6 mN/m at room temperature16.
The reduction in breakthrough pressure is proportional.
Figure 4c shows the linear relationship between the recorded fluorescence intensity and the dye concentration.
The fit is not perfect and we attribute most of this variation to manual pipetting errors while interchanging the dye
solution at the needle tip.
The rate that aqueous samples leave or enter the channel is also affected by the external pressure. In this work,
this pressure is always 0, but if the needle is inserted into a living organism, it will vary with heart rate, blood

10
pressure, position of the body, and other factors that are difficult to control. These variations in pressure require a
high breakthrough pressure so that oil will not inadvertently escape if there is a pressure drop within the body. To
achieve this, it will be advantageous to have a larger number of even smaller capillaries.
7. Conclusions
In this work, we have demonstrated a microfluidic needle that can both expel the aqueous phase of a segmented
flow and form segmented flows from aqueous surroundings for sampling. Aqueous droplets were observed to exit
the microfluidic channel at integrated hydrophilic capillaries while the oil phase did not. We observed that a
significant breakthrough pressure of 19 kPa was required to force oil out through the capillaries. The device was
also able to form segmented flows at the needle tip by operating at negative pressure. The chemical content of
entrained segmented flows faithfully reflected the chemical concentration outside of the device with a time delay
of approximately 3 s. Having a high breakthrough pressure, as we have shown here, is a critical feature,
particularly for in vivo applications where oil or air leakage into tissue is unacceptable and the pressure in the
tissue is variable. We believe that this work will form an integral part of designing a new type of microfluidic
needle for sampling and delivery in biomedical research.
Acknowledgements
The authors thank Dr Simon Doe, Dr Donghoon Chang and Dr Jing-Hong Pai at the ANFF South Australia for
input and guidance in fabricating the device. This work was performed (in part) at the South Australian node of
the Australian National Fabrication Facility under the National Collaborative Research Infrastructure Strategy.
The authors also acknowledge our colleague Prof. Lisa Wynn in Macquarie University for editing the paper. This
work was financially supported by Macquarie University Wireless Medical Devices grants, the ARC Centre of
Excellence for Nanoscale BioPhotonics CE140100003, the ARC Future Fellowship of Dr. Guozhen Liu, the
National Natural Science Foundation of China (Grant 21575045), and the self-determined research funds of
CCNU (CCNU15A02015). The authors declare no conflicts of interest.
References
1 E. Mukerjee, S. D. Collins, R. L. Smith, and R. Isseroff, in Micro Total Analysis Systems 2001: Proceedings of the µTAS 2001 Symposium, held in Monterey, CA, USA 21–25 October, 2001,

11
edited by J. Michael Ramsey and Albert van den Berg (Springer Netherlands, Dordrecht, 2001), pp. 379.
2 Geoffrey Taylor, Proceedings of the Royal Society of London. Series A. Mathematical and Physical Sciences 219 (1137), 186 (1953).
3 L. G. Cohen and C. Lin, Appl. Opt. 16 (12), 3136 (1977). 4 N. Ostromohov, M. Bercovici, and G. V. Kaigala, Lab Chip 16 (16), 3015 (2016). 5 A. Gupta, S. M. S. Murshed, and R. Kumar, Appl. Phys. Lett. 94 (16) (2009). 6 F. P. Bretherton, Journal of Fluid Mechanics 10 (02), 166 (1961). 7 D. Chen, W. Du, Y. Liu, W. Liu, A. Kuznetsov, F. E. Mendez, L. H. Philipson, and R. F. Ismagilov,
Proc. Natl. Acad. Sci. U S A 105 (44), 16843 (2008). 8 G. V. Kaigala, R. D. Lovchik, U. Drechsler, and E. Delamarche, Langmuir 27 (9), 5686 (2011). 9 X. F. van Kooten, J. Autebert, and G. V. Kaigala, Appl. Phys. Lett. 106 (7) (2015). 10 M. Wang, G. T. Roman, M. L. Perry, and R. T. Kennedy, Anal. Chem. 81 (21), 9072 (2009). 11 M. Wang, G. T. Roman, K. Schultz, C. Jennings, and R. T. Kennedy, Anal. Chem. 80 (14), 5607
(2008). 12 J. P. Hurley and C. Garrod, in Principles of physics (Houghton Mifflin, Boston, 1978). 13 N. Ichikawa, K. Hosokawa, and R. Maeda, J. Colloid. Interf. Sci. 280 (1), 155 (2004). 14 C. A. Stan, S. K. Y. Tang, and G. M. Whitesides, Anal. Chem. 81 (6), 2399 (2009). 15 D. W. Inglis, E. M. Goldys, and N. P. Calander, Angew. Chem. Int. Ed. Engl. 50 (33), 7546 (2011). 16 T. Moritani, M. Yamada, and M. Seki, Microfluid Nanofluid 11 (5), 601 (2011).


