a methodology for defining seismic scenario-structure
TRANSCRIPT
A methodology for defining seismic scenario-structure-based limitstate criteria for rc high-rise wall buildings using net drift
Wael Alwaeli1,*,†, Aman Mwafy2, Kypros Pilakoutas1 and Maurizio Guadagnini1
1Department of Civil and Structural Engineering, University of Sheffield, Mappin Street, Sheffield S1 3JD, UK2Department of Civil and Environmental Engineering, United Arab Emirates University, PO Box. 15551, Al-Ain, United
Arab Emirates
SUMMARY
As a result of population growth and consequent urbanization, the number of high-rise buildings is rapidlygrowing worldwide resulting in increased exposure to multiple-scenario earthquakes and associated risk.The wide range in frequency contents of possible strong ground motions can have an impact on the seismicresponse, vulnerability and limit states definitions of RC high-rise wall structures. Motivated by the pressingneed to derive more accurate fragility relations to be used in seismic risk assessment and mitigation of suchstructures, a methodology is proposed to obtain reliable, Seismic Scenario-Structure-Based (SSSB) defini-tions of limit state criteria. A 30-story wall building, located in a multi-seismic scenario study region, isutilized to illustrate the methodology. The building is designed following modern codes and then modeledusing nonlinear fiber-based approach. Uncertainty in ground motions is accounted for by the selection offorty real earthquake records representing two seismic scenarios. Seismic scenario-based building localresponse at increasing earthquake intensities is mapped using Multi-Record Incremental Dynamic Analyses(MRIDAs) with a new scalar intensity measure. Net Inter-Story Drift (NISD) is selected as a global damagemeasure based on a parametric study involving seven buildings ranging from 20 to 50 stories. This damagemeasure is used to link local damage events, including shear, to global response under different seismicscenarios. While the study concludes by proposing SSSB limit state criteria for the sample building, theproposed methodology arrives at a reliable definition of limit state criteria for an inventory of RChigh-rise wall buildings under multiple earthquake scenarios. Copyright © 2016 John Wiley & Sons, Ltd.
Received 13 November 2015; Revised 11 November 2016; Accepted 14 November 2016
KEY WORDS: high-rise buildings; shear walls; limit state criteria; seismic scenarios; incremental dynamicanalysis
1. BACKGROUND AND MOTIVATION
With changing socioeconomic conditions, rapid population growth and urbanization, many cities allover the world have expanded rapidly in recent years. This expansion has led to a massive increasein high-rise buildings and to the spread of cities to multiple-scenario earthquake-prone regions. Thisincreases the exposure to seismic risk. A risk, which to quantify and mitigate, necessitates a betterunderstanding of the hazard and vulnerability.
The majority of high-rise buildings in most countries employ RC piers and core walls as the primarylateral-force-resisting system because of their effectiveness in providing the strength, stiffness anddeformation capacity needed to meet the seismic demand. The trend to increasingly use RC in high-rise buildings is expected to continue because of the development of commercial high-strengthconcrete and new advances in construction technologies [1]. Quantitative definitions of limit state
*Correspondence to: Alwaeli W., Department of Civil and Structural Engineering, University of Sheffield, Sir FrederickMappin Building, Mappin Street, Sheffield, S1 3JD, UK.†E-mail: [email protected]
Copyright © 2016 John Wiley & Sons, Ltd.
EARTHQUAKE ENGINEERING & STRUCTURAL DYNAMICSEarthquake Engng Struct. Dyn. 2016Published online in Wiley Online Library (wileyonlinelibrary.com). DOI: 10.1002/eqe.2858

criteria form the spine to seismic vulnerability assessment needed for seismic risk analysis andmitigation for RC high-rise wall buildings. These definitions require mathematical representations oflocal damage indices, such as deformations, forces or energy, based on designated structuralresponse levels. Therefore, suitable damage measures need to be adopted to sufficiently correlatelocal damages (events) in the building to its global response.
The broad range of frequency content in real strong ground motions, representative of differentseismic scenarios such as distant and near-field earthquakes, can impose different levels of excitationon both fundamental and higher modes in RC high-rise wall structures. This can result in morecomplex, seismic scenario-based inelastic responses. Another special issue in RC high-rise wallbuildings is the definition of limit state criteria corresponding to predefined performance levelsbecause there are several factors affecting failure modes including building height, axial force levels,supplementary regulations introduced by local authorities, as well as local trends in design andconstruction. For buildings with the fundamental mode-dominated response, the taller the building,the larger is the expected Total Inter-Story Drift (TISD) at specified performance levels. For high-rise wall buildings, especially at lower stories, axial compressive force levels are influenced by thearrangement of the RC shear walls and cores in the building and are usually dominated by gravityloads, particularly for internal shear walls. High compressive loads are expected to delay the onsetof initial cracking and yielding in vertical elements, but can decrease ductility and hence the TISDat which concrete core crushing and rebar buckling occur. Finally, supplementary regulations oflocal authorities, as well as trends adopted by both consultants and contractors, may impact thedesign and hence the seismic performance of buildings. For instance, the minimum steel ratio invertical elements may exceed the value that is stated in code provisions.
Using TISD as a damage measure, seismic guidelines and previous studies have adopted a widerange of limit state criteria associated with different performance levels of RC shear walls and wallstructures. In ASCE/SEI 41-6 [2], TISDs of 0.5%, 1% and 2.0% are assigned to the ImmediateOccupancy (IO), Life Safety (LS) and Collapse Prevention (CP) performance levels, respectively.The SEAOC blue book [3] proposed TISDs of 0.4%, 0.9%, 1.4% and 2.1% for RC shear walls atperformance levels SP1 (negligible damage), SP2 (minor to moderate reparable damage), SP3(moderate to major irreparable damage) and SP4 (collapse performance level). Seismic codes tend tolean to the conservative side, but less conservative TISDs have been recommended in the literaturebased on experimental and analytical results. For ductile RC walls, Ghobarah [4] recommendedTISDs of <0.2%, 0.4%, <0.8%, >0.8%, 1.5% and >2.5% corresponded to damage levels of none,light reparable, moderate reparable, irreparable, severe (or life safe) and collapse, respectively. Inanother study of RC wall buildings with a number of stories ranging between 10 and 60, Mwafy [5]suggested a TISD value of 2.5% for CP, while height-dependent TISDs were proposed for IO(0.32% to 0.83%) and LS (0.81% to 1.35%). In contrast, Ji et al. [6] suggested conservative TISDsto define three performance limit states obtained from inelastic pushover and time history analysesfor a 54-story RC wall building. The proposed TISDs were 0.2%, 0.52% and 1.1% forserviceability, damage control and collapse prevention limit states, respectively. Bearing the abovein mind, reliable definitions of performance limit state criteria for RC high-rise wall structuresremain a significant research issue.
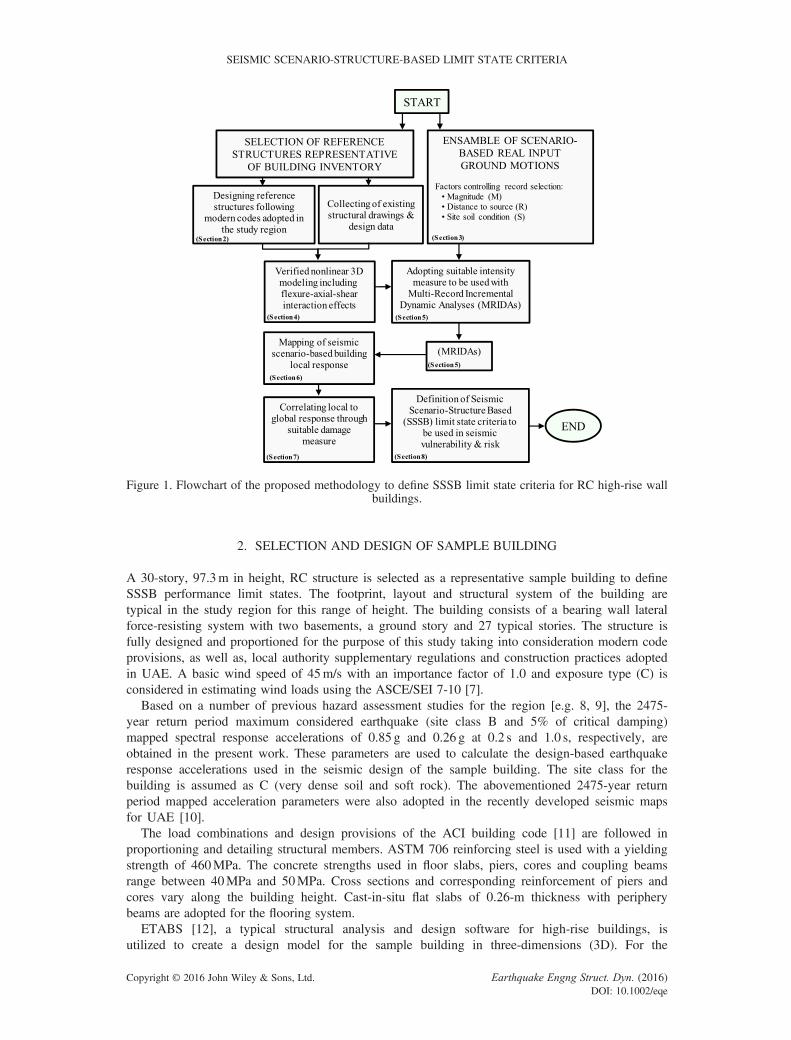
The aim of this paper is to propose a methodology to obtain reliable, SSSB definitions ofperformance limit state criteria for RC high-rise wall buildings. The proposed methodology isillustrated on a 30-story sample building with RC bearing wall system located in Dubai (UAE); amulti-scenario seismic-prone region that is taken as a case study in the current work. Following abrief review of the selection and design of the sample building, this study presents in detail: (i)dealing with ground excitation uncertainty; (ii) the nonlinear modeling approach and key modelingparameters of the sample building; (iii) a discussion on the main parameters of the conductedMRIDAs including a proposition for a new scalar intensity measure; (iv) the mapping of seismicscenario-based building local response; and (v) the selection of suitable damage measure to correlatelocal to global response. The study concludes by proposing SSSB limit state criteria for the samplebuilding. The proposed methodology can be used to arrive at a reliable definition of limit statecriteria for an inventory of RC high-rise wall buildings in regions with multiple earthquake scenarios.Figure 1 pictorially summarizes the methodology proposed in the current work.
W. ALWAELI ET AL.
Copyright © 2016 John Wiley & Sons, Ltd. Earthquake Engng Struct. Dyn. (2016)DOI: 10.1002/eqe
2. SELECTION AND DESIGN OF SAMPLE BUILDING
A 30-story, 97.3m in height, RC structure is selected as a representative sample building to defineSSSB performance limit states. The footprint, layout and structural system of the building aretypical in the study region for this range of height. The building consists of a bearing wall lateralforce-resisting system with two basements, a ground story and 27 typical stories. The structure isfully designed and proportioned for the purpose of this study taking into consideration modern codeprovisions, as well as, local authority supplementary regulations and construction practices adoptedin UAE. A basic wind speed of 45m/s with an importance factor of 1.0 and exposure type (C) isconsidered in estimating wind loads using the ASCE/SEI 7-10 [7].
Based on a number of previous hazard assessment studies for the region [e.g. 8, 9], the 2475-year return period maximum considered earthquake (site class B and 5% of critical damping)mapped spectral response accelerations of 0.85 g and 0.26 g at 0.2 s and 1.0 s, respectively, areobtained in the present work. These parameters are used to calculate the design-based earthquakeresponse accelerations used in the seismic design of the sample building. The site class for thebuilding is assumed as C (very dense soil and soft rock). The abovementioned 2475-year returnperiod mapped acceleration parameters were also adopted in the recently developed seismic mapsfor UAE [10].
The load combinations and design provisions of the ACI building code [11] are followed inproportioning and detailing structural members. ASTM 706 reinforcing steel is used with a yieldingstrength of 460MPa. The concrete strengths used in floor slabs, piers, cores and coupling beamsrange between 40MPa and 50MPa. Cross sections and corresponding reinforcement of piers andcores vary along the building height. Cast-in-situ flat slabs of 0.26-m thickness with peripherybeams are adopted for the flooring system.
ETABS [12], a typical structural analysis and design software for high-rise buildings, isutilized to create a design model for the sample building in three-dimensions (3D). For the
Figure 1. Flowchart of the proposed methodology to define SSSB limit state criteria for RC high-rise wallbuildings.
SEISMIC SCENARIO-STRUCTURE-BASED LIMIT STATE CRITERIA
Copyright © 2016 John Wiley & Sons, Ltd. Earthquake Engng Struct. Dyn. (2016)DOI: 10.1002/eqe
design of the flooring system, the SAFE flooring analysis and design tool is used [13]. Shellelements are used to model shear walls and floor slabs, while frame elements are adopted inmodeling periphery and coupling beams. Seismic demands are estimated using both theequivalent lateral force procedure and the modal response spectrum analysis. P–Δ effects aretaken into account in the analysis.
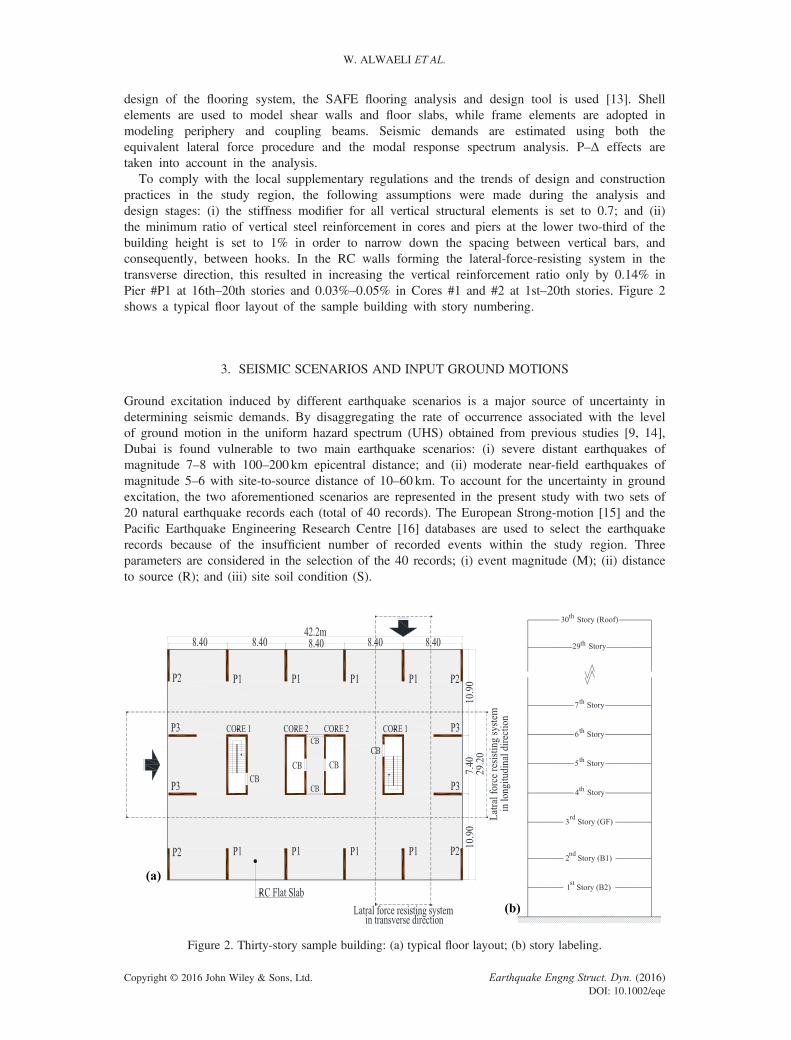
To comply with the local supplementary regulations and the trends of design and constructionpractices in the study region, the following assumptions were made during the analysis anddesign stages: (i) the stiffness modifier for all vertical structural elements is set to 0.7; and (ii)the minimum ratio of vertical steel reinforcement in cores and piers at the lower two-third of thebuilding height is set to 1% in order to narrow down the spacing between vertical bars, andconsequently, between hooks. In the RC walls forming the lateral-force-resisting system in thetransverse direction, this resulted in increasing the vertical reinforcement ratio only by 0.14% inPier #P1 at 16th–20th stories and 0.03%–0.05% in Cores #1 and #2 at 1st–20th stories. Figure 2shows a typical floor layout of the sample building with story numbering.
3. SEISMIC SCENARIOS AND INPUT GROUND MOTIONS
Ground excitation induced by different earthquake scenarios is a major source of uncertainty indetermining seismic demands. By disaggregating the rate of occurrence associated with the levelof ground motion in the uniform hazard spectrum (UHS) obtained from previous studies [9, 14],Dubai is found vulnerable to two main earthquake scenarios: (i) severe distant earthquakes ofmagnitude 7–8 with 100–200km epicentral distance; and (ii) moderate near-field earthquakes ofmagnitude 5–6 with site-to-source distance of 10–60 km. To account for the uncertainty in groundexcitation, the two aforementioned scenarios are represented in the present study with two sets of20 natural earthquake records each (total of 40 records). The European Strong-motion [15] and thePacific Earthquake Engineering Research Centre [16] databases are used to select the earthquakerecords because of the insufficient number of recorded events within the study region. Threeparameters are considered in the selection of the 40 records; (i) event magnitude (M); (ii) distanceto source (R); and (iii) site soil condition (S).
Figure 2. Thirty-story sample building: (a) typical floor layout; (b) story labeling.
W. ALWAELI ET AL.
Copyright © 2016 John Wiley & Sons, Ltd. Earthquake Engng Struct. Dyn. (2016)DOI: 10.1002/eqe

Earthquakes with larger magnitudes come with significantly longer effective durations and moresignificant peaks compared to smaller ones. The site-to-source distance generally affects the groundmotion at the site through path attenuation and high-frequency filtration. Depending on thecharacteristics of the site soil strata, the seismic wave is either amplified or dissipated whiletraveling from the bedrock to the ground level. This modification in the seismic wave impacts thedynamic behavior of wide frequency-sensitive high-rise buildings. The ground motion accelerationto velocity ratio (a/v) forms an important measure to the magnitude, frequency content and site-to-source distance of the earthquake event [17]. High a/v ratios (>1.2 g/ms�1) signify events with highdominant frequencies, medium-to-small magnitudes, short site-to-source distances and short durationperiods. Low a/v ratios (<0.8 g/ms�1), on the other hand, represent earthquakes with low dominantfrequencies, high-to-medium magnitudes, long site-to-source distances and long duration periods.The a/v classification is checked for all 40 records selected in this study.
For the ground motion effective duration, the interval between 0.5% and 95% of each of theacceleration, velocity and displacement integrals is used [18]. This procedure significantly reducesthe computational effort required to perform the MRIDAs for the sample structure, particularly whenapplying the 20 records characterized with long duration (Record Set#1). For the two sets of records,Figure 3 shows the displacement response spectra, the acceleration response spectra (with their means)alongside the 10% Probability of Exceedance in 50-year UHS of the study region (UHS-10% POE in50Y) and the acceleration design spectra for site classes C and D. In Figures 3(a) and 3(c), the designacceleration parameters at 0.2 s and 1.0 s for site class C are 0.60 g and 0.27 g, respectively, while forsite class D, they are 0.66 g and 0.33 g, respectively. Figure 3 shows that for the selected records undereach of the two investigated seismic scenarios, the mean of the acceleration response spectrareasonably correlates with the design spectra at the respective range of periods, that is, long-period
Figure 3. Response spectra of the 40 natural records: (a) Record Set#1 acceleration spectra; (b) Record Set#1displacement spectra; (c) Record Set#2 acceleration spectra; (d) Record Set#2 displacement spectra.
SEISMIC SCENARIO-STRUCTURE-BASED LIMIT STATE CRITERIA
Copyright © 2016 John Wiley & Sons, Ltd. Earthquake Engng Struct. Dyn. (2016)DOI: 10.1002/eqe

range for Record Set#1 and short-period range for Record Set#2. It is worth noting that the formerrange corresponds to the sample building fundamental period, while the latter corresponds to thehigher mode periods.
4. NONLINEAR MODELING
PERFORM-3D analytical tool [19] is utilized to create the nonlinear model of the sample building. Inthis study, the selection of the tool, modeling approach and key modeling parameters are based on amulti-level modeling verification scheme [20]. The verification scheme included the simulation ofthe nonlinear dynamic response of a full-scale seven-story wall building slice tested on the LHPOSTat UCSD [21, 22]. In this scheme, different analytical tools, modeling approaches and keyparameters have been investigated through the comparison of measured against analytical resultsrepresenting both global and local response. For the sake of brevity, results of the verificationscheme are not included in this paper.
Although PERFORM-3D is an efficient 3D modeling package, it is computationally demandingto execute a large number of nonlinear response history analyses for a 3D model of an entirehigh-rise structure, particularly when a wide range of input ground motions is employed. A3D-slice idealization is therefore adopted to develop the nonlinear model of the sample building.The lateral-force-resisting system of the building in the transverse direction is assumed to consistof four framing systems. Each of these, carrying 25% of the total mass of the building, consistsof two external piers (P1) and an internal core as shown in Figure 2(a). Conservatively, the twoframing systems at the right and left edges of the building are assumed not to form a part of thelateral-force-resisting system and only carrying gravity load. In the longitudinal direction,Figure 2(a) shows that the lateral forces are resisted by a single framing system which consistsof all the internal cores and (P3) piers. Other piers (P2 and P1) are assumed not to beparticipating in resisting lateral forces in the longitudinal direction. The results from the freevibration analysis conducted on the entire building using the 3D ETABS model indicate a verycomparable lateral capacity in the two orthogonal directions with elastic (uncracked) fundamentalmode periods of 3.44 s and 3.2 s in the longitudinal and transverse directions, respectively.Vindicated by this fact, the number of MRIDAs, and thus the computational effort, can besignificantly reduced by focusing only on one direction of the building. As a result, the 3D slicerepresenting the lateral-force-resisting system in the transverse direction of the sample building ismodeled and employed in the subsequent sections to define SSSB performance limit states.
Four-noded fiber-based shear wall elements are utilized to model the piers and core wallsegments while two-noded fiber-based frame elements are used for the floor slabs. The couplingbeams between the core walls are modeled as elastic beam elements with nonlinear displacementshear hinge at mid-span (shear-hinge modeling approach) in which the behavior is based on testresults from previous studies [23]. This modeling approach has been shown to have equalaccuracy in capturing the overall nonlinear load-rotation response of the member when comparedto the moment-hinge modeling approach [23–25]. To establish a rigid connection between thetwo-noded and four-noded elements, additional (embedded) beams are used [19]. The embeddedbeams have a very stiff section for bending in the plane of the wall but very small axial,torsional and out-of-plane bending stiffnesses to avoid stiffening the walls. The seismic massesare assigned to the nodes at the story level. The base of the sample building is rigidly modeledat the top-of-foundation level.
Expected strengths of 1.3fc0and 1.17fy are used for concrete and reinforcing steel, respectively
[26]. A four-linear-segment relation is used to approximate the concrete stress–strain relationshipbased on the modified Mander model [27]. For the steel in tension, the post-yield stiffness andcyclic degradation parameters are defined following adjustments described by Orakcal andWallace [28]. For compression, buckling of steel rebar is modeled based on experimental resultsand analytical models from previous studies [29–32]. Inelastic shear deformation in piers andcores is modeled by assigning a trilinear relation similar to the one recommended by ASCE/SEI41-06 [2]. Test results by Thomsen and Wallace [33] and calibration studies by Gogus [34] are
W. ALWAELI ET AL.
Copyright © 2016 John Wiley & Sons, Ltd. Earthquake Engng Struct. Dyn. (2016)DOI: 10.1002/eqe

used to define the shear force–deformation relation. In the used trilinear relation, the uncrackedshear modulus is taken as 0.4Ec, and diagonal (shear) cracking is assumed to start at 0.25
ffiffiffiffiffiffiffif c0
p≤ 0.5vn, where vn is the wall nominal shear strength from ACI code [11] and f
0c is the concrete
expected compressive strength in MPa. The post-cracking slope is reduced to 0.01Ec to accountfor the nonlinear shear deformations because of shear–flexure interaction [35]. Similar to therelations defined for columns in ASCE/SEI 41-06 Supplement #1 [36], the elastic shear strengthof wall segments is also modeled taking into account the shear strength degradation associatedwith varying levels of nonlinear flexural deformation [29, 37]. Using a post-processor, pairs ofnormalized shear force demand (Shear force demand/Vn,ACI) and curvature ductility in wallsegments are pinned, at each time step of the time-history analysis, and checked against atrilinear trend line [38] and a flat line that represents the upper shear strength limit of 0.83
ffiffiffiffiffiffiffif c0
pby the ACI code [11] as predefined envelopes. Moreover, Table 6.18 in ASCE/SEI 41-6 [2] isimplemented to calculate the rotation limits of RC wall segments and coupling beams todifferent levels of building performance taking into consideration the level of axial and sheardemands in these elements. Figure 4 illustrates the relations used for the confined concrete,reinforcing steel and inelastic shear deformation of the core wall segments at the lower one-thirdof the building height, respectively.
To account for the viscous damping, modal damping based on the initial stiffness of the structureis used for the first six modes of vibration in the transverse direction of the sample building. Basedon the outcomes of previous studies [e.g. 39, 40], the damping ratio of 0.5% is considered for thefundamental mode. For higher modes, the following relationship is adopted: ξ i=1.4 ξ i� 1, where ξ iis the damping ratio of the i-th mode [41]. Accordingly, the damping ratios for the next five modesare set to 0.7%, 1.0%, 1.4%, 1.9% and 2.7%, respectively. In addition, and to stabilize lessimportant (higher frequency) modes, a small amount (0.1%) of Rayleigh damping is added to themodel [19].
5. MULTI-RECORD INCREMENTAL DYNAMIC ANALYSES
For the purpose of defining SSSB performance limit state criteria for the sample building, MRIDAs areperformed using the two sets of records described in Section 3. To construct IDA curves that cansufficiently and efficiently represent the variable states of the response of the structure to differentearthquake records with increasing intensities, a suitable ground motion intensity measure needs tobe defined. Peak Ground Acceleration (PGA) used to be the most accepted intensity measure. Theelastic spectral acceleration at the fundamental period of the structure, Sa(T1) or Sa in short, has beenfound to be more efficient, because it is structure dependent, and become a frequently used intensitymeasure for short buildings. However, Sa is not suited to tall buildings [42, 43] nor for structuressubjected to near-field earthquakes [44]. Other intensity measures have been proposed in theliterature in an attempt to overcome the major shortcomings of Sa, namely discounting thecontribution of the higher modes and fundamental period lengthening of the structure associatedwith stiffness degradation [43, 45, 46]. New approaches have led to other kinds of intensity
Figure 4. Force–deformation relations for the core walls in the lower ten stories of the sample building: (a)confined concrete; (b) reinforcing steel; and (c) wall inelastic shear deformation.
SEISMIC SCENARIO-STRUCTURE-BASED LIMIT STATE CRITERIA
Copyright © 2016 John Wiley & Sons, Ltd. Earthquake Engng Struct. Dyn. (2016)DOI: 10.1002/eqe
measures such as inelastic spectral value-based scalar intensity measures [e.g. 44] and vector-valuedintensity measures [47–49]. These approaches, though promising, are not easy to apply because theyrequire probabilistic seismic hazard assessment based on custom-made attenuation laws to obtain thejoint hazard curve.
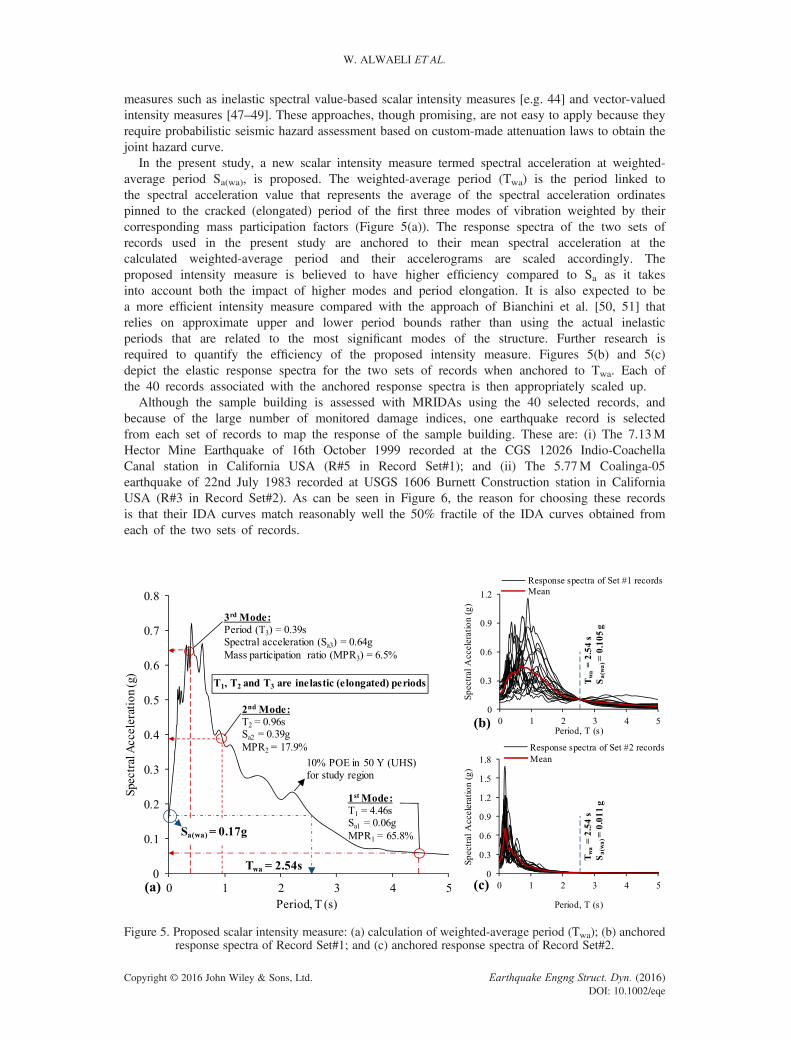
In the present study, a new scalar intensity measure termed spectral acceleration at weighted-average period Sa(wa), is proposed. The weighted-average period (Twa) is the period linked tothe spectral acceleration value that represents the average of the spectral acceleration ordinatespinned to the cracked (elongated) period of the first three modes of vibration weighted by theircorresponding mass participation factors (Figure 5(a)). The response spectra of the two sets ofrecords used in the present study are anchored to their mean spectral acceleration at thecalculated weighted-average period and their accelerograms are scaled accordingly. Theproposed intensity measure is believed to have higher efficiency compared to Sa as it takesinto account both the impact of higher modes and period elongation. It is also expected to bea more efficient intensity measure compared with the approach of Bianchini et al. [50, 51] thatrelies on approximate upper and lower period bounds rather than using the actual inelasticperiods that are related to the most significant modes of the structure. Further research isrequired to quantify the efficiency of the proposed intensity measure. Figures 5(b) and 5(c)depict the elastic response spectra for the two sets of records when anchored to Twa. Each ofthe 40 records associated with the anchored response spectra is then appropriately scaled up.
Although the sample building is assessed with MRIDAs using the 40 selected records, andbecause of the large number of monitored damage indices, one earthquake record is selectedfrom each set of records to map the response of the sample building. These are: (i) The 7.13MHector Mine Earthquake of 16th October 1999 recorded at the CGS 12026 Indio-CoachellaCanal station in California USA (R#5 in Record Set#1); and (ii) The 5.77M Coalinga-05earthquake of 22nd July 1983 recorded at USGS 1606 Burnett Construction station in CaliforniaUSA (R#3 in Record Set#2). As can be seen in Figure 6, the reason for choosing these recordsis that their IDA curves match reasonably well the 50% fractile of the IDA curves obtained fromeach of the two sets of records.
Figure 5. Proposed scalar intensity measure: (a) calculation of weighted-average period (Twa); (b) anchoredresponse spectra of Record Set#1; and (c) anchored response spectra of Record Set#2.
W. ALWAELI ET AL.
Copyright © 2016 John Wiley & Sons, Ltd. Earthquake Engng Struct. Dyn. (2016)DOI: 10.1002/eqe

6. MAPPING OF SEISMIC SCENARIO-BASED BUILDING LOCAL RESPONSE
To determine the SSSB quantitative performance limit state definitions for the sample building, a totalof seven local damage indices are mapped during MRIDAs (Table I). Figures 7 and 8 present theresponse of the sample building at selected damage indices under R#5 and R#3, respectively.
The main observations from the mapping are:
• Under both records, first yielding in steel rebars of RC flooring system occurred at the story wheremaximum differential vertical displacement developed between slab ends (Figures 7(a) and 8(a)).This is not necessarily the story associated neither with maximum TISD nor with maximum NISD(as will be shown later).
• Under R#5, the event sequence starts with yielding in the slab at Sa(wa) = 0.13 g/PGA=0.20 g(Figure 7(a)), followed by the following events in the wall: yielding, exceedance of LS rotationlimit (Figure 7(b and c)), rebar buckling (Figure 7(d and e)), concrete crushing, exceedance ofCP rotation limit and finally exceedance of shear strength at Sa(wa) = 0.84 g/PGA=1.25 g(Figure 7(f–i)). All events occurred within the lower five stories of the building except for the slabyielding that occurred at the 24th story. As above, the event sequence under R#3 starts with yield-ing in the slab at Sa(wa) = 0.06 g/PGA=1.43 g (Figure 8(a)) followed by yielding in the wall. How-ever, the sequence of the other events in the wall conspicuously differs with exceedance of shearstrength next (Figure 8(f–i)), followed by rebar buckling (Figure 8(d and e)), exceedance of LSrotation limit (Figure 8(b and c)), concrete crushing, and ends with exceedance of CP rotationlimit at Sa(wa) = 0.34 g/PGA=7.64 g. Under R#3, the yielding events in slab and wall occurredat higher stories; 28th story and 21st story, respectively, while all other events occurred withinthe lower five stories of the building.
• Under R#5, the shape of the relative lateral displacement plot at the onset of the sequence ofevents indicates a first mode-dominated response (Figures 7(a, c and, e)). However, the secondmode appears responsible for the exceedance of the wall shear strength event (Figure 7(g)). Onthe contrary, under R#3, the shape of the relative lateral displacement plots indicate that the
Figure 6. IDA curves along with their 16%, 50% and 84% fractile curves and selected records to representthe 50% fractile in each set: (a) under Record Set#1; and (b) under Record Set#2.
Table I. Local damage indices adopted in the mapping of the sample building response.
Local damage index Description
First rebar yield-H First yielding in steel rebars of RC slabsFirst rebar yield-V First yielding in steel rebars of RC wallsWall rotation Exceeding rotation limits for RC walls
according to ASCE/SEI 41-6 (Table 6.18)Coupling beam rotation Exceeding rotation limits for RC coupling
beams according to ASCE/SEI 41-6 (Table 6.18)First steel buckling First buckling in steel rebars of RC wallsFirst concrete crushing First crushing in confined concrete zone of RC wallsExceedance of shear capacity Exceeding shear capacity (deformation and or strength)
in wall segments
SEISMIC SCENARIO-STRUCTURE-BASED LIMIT STATE CRITERIA
Copyright © 2016 John Wiley & Sons, Ltd. Earthquake Engng Struct. Dyn. (2016)DOI: 10.1002/eqe
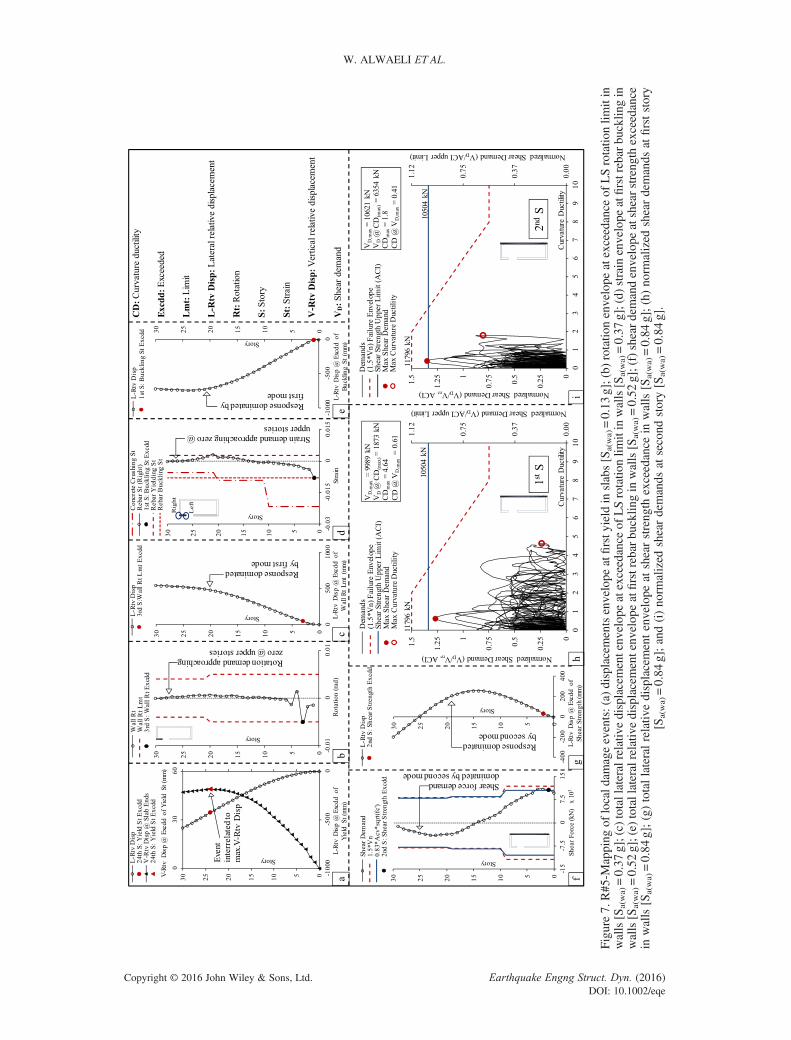
Figure7.R#5-M
apping
oflocald
amageevents:(a)
displacementsenvelope
atfirsty
ield
inslabs[S
a(wa)=0.13
g];(b)
rotatio
nenvelope
atexceedance
ofLSrotatio
nlim
itin
walls[S
a(wa)=0.37
g];(c)totallateralrelativ
edisplacementenvelopeatexceedance
ofLSrotatio
nlim
itin
walls[S
a(wa)=0.37
g];(d)
strain
envelope
atfirstrebar
bucklin
gin
walls[S
a(wa)=0.52
g];(e)
totallateralrelativ
edisplacementenvelopeatfirstrebar
bucklin
gin
walls[S
a(wa)=0.52
g];(f)sheardemandenvelope
atshearstrength
exceedance
inwalls[S
a(wa)=0.84
g];(g)totallateralrelativ
edisplacementenvelope
atshearstrength
exceedance
inwalls[S
a(wa)=0.84
g];(h)norm
alized
sheardemands
atfirststory
[Sa(wa)=0.84
g];and(i)norm
alized
sheardemands
atsecond
story[S
a(wa)=0.84
g].
W. ALWAELI ET AL.
Copyright © 2016 John Wiley & Sons, Ltd. Earthquake Engng Struct. Dyn. (2016)DOI: 10.1002/eqe

Figure8.R#3-M
apping
oflocaldam
ageevents:(a)displacementsenvelope
atfirstyield
inslabs[Sa(wa)=0.06
g];(b)
rotatio
nenvelope
atexceedance
ofLSrotatio
nlim
itin
walls[Sa(wa)=0.25
g];(c)totallateralrelativ
edisplacementenvelopeatexceedance
ofLSrotatio
nlim
itin
walls[Sa(wa)=0.25
g];(d)
strain
envelope
atfirstrebarbucklin
gin
walls[Sa(wa)=0.21
g];(e)totallateralrelativ
edisplacementenvelope
atfirstrebarbucklin
gin
walls[Sa(wa)=0.21
g];(f)sheardemandenvelope
atshearstrength
ex-
ceedance
inwalls[Sa(wa)=0.074g];(g)
totallateralrelativ
edisplacementenvelopeatshearstrength
exceedance
inwalls[Sa(wa)=0.074g];(h)
norm
alized
sheardemands
atfirststory[Sa(wa)=0.074g];and(i)norm
alized
sheardemands
atthirdstory[Sa(wa)=0.074g].
SEISMIC SCENARIO-STRUCTURE-BASED LIMIT STATE CRITERIA
Copyright © 2016 John Wiley & Sons, Ltd. Earthquake Engng Struct. Dyn. (2016)DOI: 10.1002/eqe
building response is controlled by the second mode (Figures 8(a, c and e)) except for wall yieldingand shear strength exceedance (Figure 8(g)) in which the response is dominated by the third mode.
• The mapping of the building local response shows that when comparing between two eventsoccurring at different seismic intensity levels, the event corresponding to the higher intensity leveldoes not necessarily associate with the bigger maximum overall lateral displacement (and conse-quently maximum overall TISD). It also shows that, at the onset of an event, the story at whichmaximum overall lateral displacement is observed is generally not associated with the one wherethe event is taken place. An example of that are the IO wall rebar yielding and LS wall rotationevents under R#5. At the 30th story, the estimated maximum overall lateral displacement is843mm at the occurrence of the former event compared to only 546mm at the occurrence ofthe latter. This indicates that TISD may not be an appropriate damage measure for high-risebuildings; an argument that will be further discussed in the succeeding section.
• Under both seismic scenarios, at the onset of each of the damage events in the walls, seismicdemands (strain/rotation/shear) reduce with building height, diminishing at the top five stories.This trend is inconsistent with the fact that these top stories are showing maximum overall TISDsduring the damage sequence. This is examined further in the next section.
As one of the considered damage indices in this study, the overall nonlinear rotation of the couplingbeams is monitored throughout the entire range of the adopted seismic intensity levels under both R#5and R#3. The results show that, under both investigated seismic scenarios, when coupling beamrotation exceeds the limits given by ASCE/SEI 41-06 for a specified performance limit state, itoccurs at a much higher seismic intensity level compared to other related damage indices. Ingeneral, beam rotation has not reached the code limits throughout the entire range of intensity levels.This indicates that, for diagonally reinforced coupling beams such as the ones used in the samplebuilding, potential damage due to earthquakes is too minor to have any influence on the definitionof limit state criteria. Similar conclusions were also drawn from previous studies in this field [e.g.29]. For the sake of brevity, and to comply with the limit of the total number of pages set by theJournal, the results for the coupling beam deformation are not shown in this paper.
The above highlights the different nature of building response to the two seismic scenarios,vindicating the initial hypothesis of this paper.
7. LINKING LOCAL TO GLOBAL RESPONSE
To quantitatively define performance limit states, damage measures in general need to be adapted to linklocal-to-global response. TISD has been frequently used as a global damagemeasure in previous studies,because it is adopted by most of the seismic design and assessment provisions [e.g. 2] and can be easilycalibrated against experimental data available in the literature. TISD at any story is a combination oftwo major components: (i) lateral net drift caused by shear and flexure deformation, referred tohereafter as NISD; and (ii) drift from rigid body motion caused by the rotation in the lower story,referred to hereafter as RBMISD. The former relates story deformation to the stress and straindemands of members in that story, while the latter has no contribution to structural demand. Thecontribution of the RBMISD to TISD is influenced by the story location, the total building height,and the effect of higher modes. J. Ji et al. [6] illustrated that for high-rise buildings, the traditionaldamage measure of TISD is insufficient to be directly related to structural performance and thereforeneeds to be disaggregated to its main sources. This argument is further investigated in the present study.
There are several methods available for calculating NISD including secant, improved secant, fixingfloor and tangent [e.g. 52]. The latter method is adopted to calculate the NISD using post-processedelement deformation data (mainly from the wall segments) as illustrated in Figure 9 and Equation (1).
NISDi ¼ NHDispihi
¼ 1hi
THDispi � hi sinθið Þcosθi
þ NVDispi � hi 1� cosθið Þ � THDispi � hisinθið Þ tanθi½ � sinθi
� �(1)
where NISDi is the NISD of the ith story, NHDispi is the net lateral (horizontal) displacement of the ith
story, hi is the height of the ith story, θi is tangent angle at the bottom end of the ith story, THDispi is the
W. ALWAELI ET AL.
Copyright © 2016 John Wiley & Sons, Ltd. Earthquake Engng Struct. Dyn. (2016)DOI: 10.1002/eqe

total lateral (horizontal) displacement of the ith story and NVDispi is the net vertical displacement of theith story. Figure 10(a) shows TISD versus NISD envelopes for the sample building at selected seismicintensities of R#5 and R#3. From both seismic scenarios and at all seismic intensities, it can be seenthat NISD approaches zero at the top stories. This is consistent with the low seismic demands on therespective RC walls.
The ratios of RBMISD to TISD at the onset of local damage events are plotted in Figure 10(b) forselected seismic intensities. Under R#5 and R#3, these ratios rise from 0.0 and 0.0 at the first story to
Figure 9. Member deformation shape for calculation of NISD.
Figure 10. Sample building response to selected seismic intensity levels under R#5 and R#3: (a) TISDversus NISD envelopes; and (b) RBMISD to TISD ratio at the onset of local damage event corresponded
to the seismic intensity level.
SEISMIC SCENARIO-STRUCTURE-BASED LIMIT STATE CRITERIA
Copyright © 2016 John Wiley & Sons, Ltd. Earthquake Engng Struct. Dyn. (2016)DOI: 10.1002/eqe
an average of 0.91 and 0.70 at the 20th story, and 0.99 and 0.98 at the 30th story, respectively. Thisconfirms that at the higher stories TISD is almost entirely dominated by RBMISD resulting from therotation of lower stories; hence, there is practically no NISD and no damage.
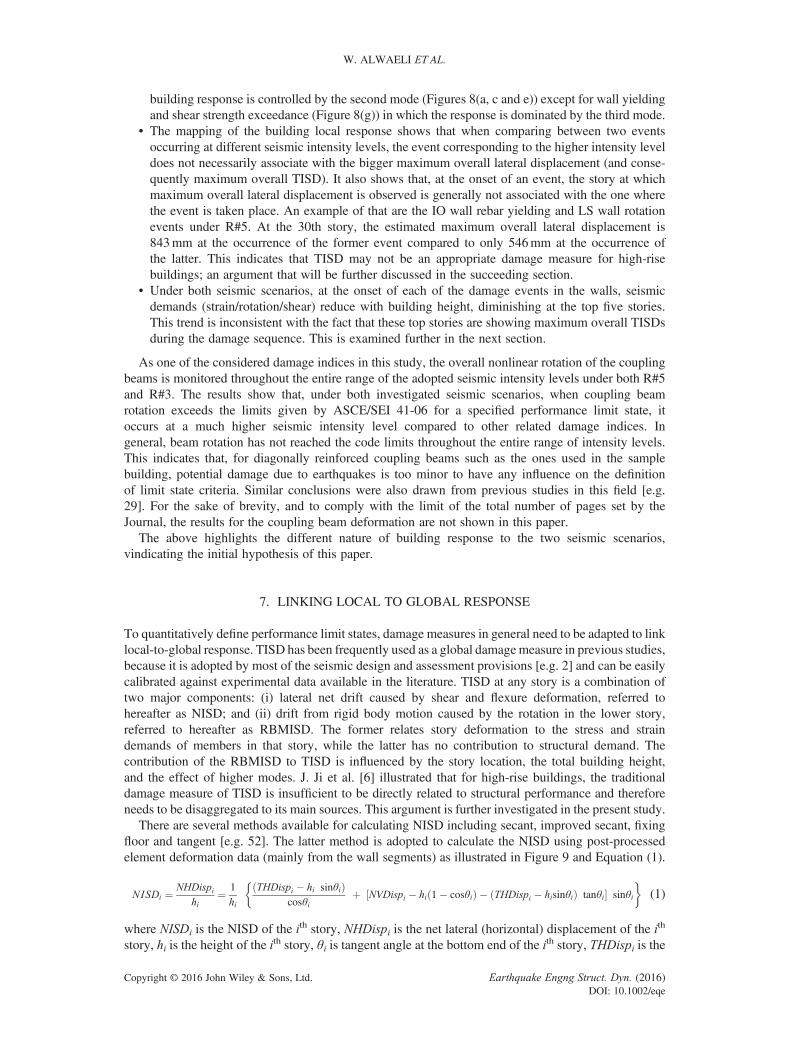
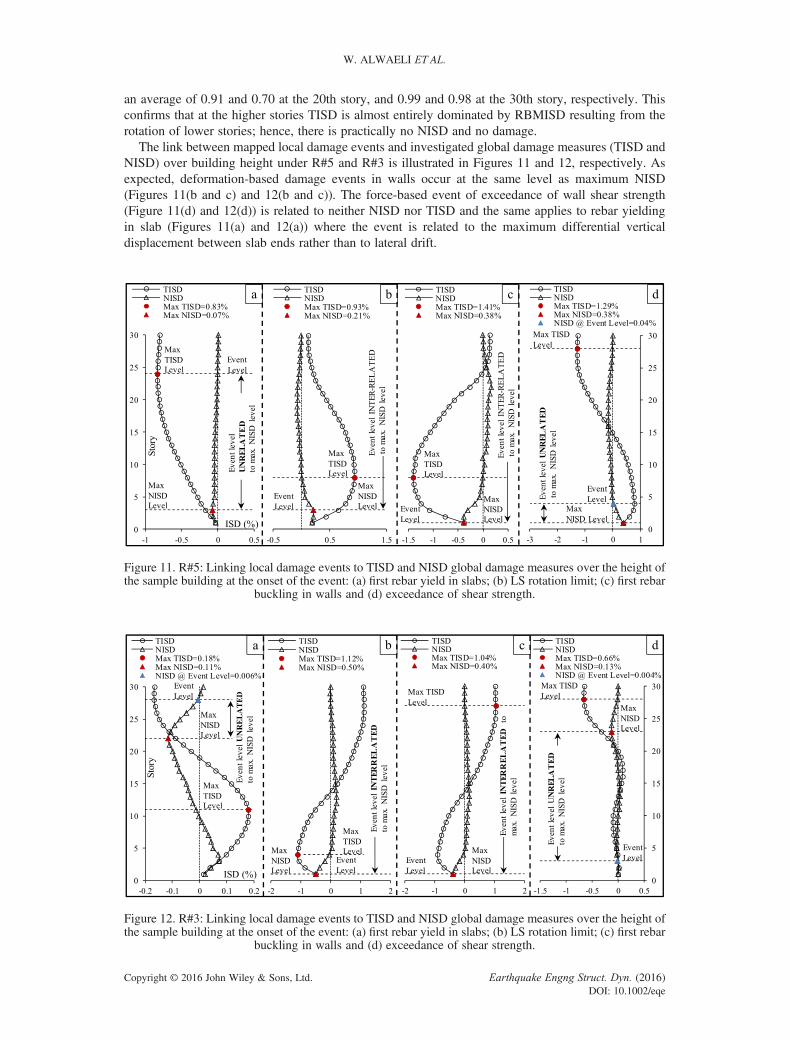
The link between mapped local damage events and investigated global damage measures (TISD andNISD) over building height under R#5 and R#3 is illustrated in Figures 11 and 12, respectively. Asexpected, deformation-based damage events in walls occur at the same level as maximum NISD(Figures 11(b and c) and 12(b and c)). The force-based event of exceedance of wall shear strength(Figure 11(d) and 12(d)) is related to neither NISD nor TISD and the same applies to rebar yieldingin slab (Figures 11(a) and 12(a)) where the event is related to the maximum differential verticaldisplacement between slab ends rather than to lateral drift.
Figure 11. R#5: Linking local damage events to TISD and NISD global damage measures over the height ofthe sample building at the onset of the event: (a) first rebar yield in slabs; (b) LS rotation limit; (c) first rebar
buckling in walls and (d) exceedance of shear strength.
Figure 12. R#3: Linking local damage events to TISD and NISD global damage measures over the height ofthe sample building at the onset of the event: (a) first rebar yield in slabs; (b) LS rotation limit; (c) first rebar
buckling in walls and (d) exceedance of shear strength.
W. ALWAELI ET AL.
Copyright © 2016 John Wiley & Sons, Ltd. Earthquake Engng Struct. Dyn. (2016)DOI: 10.1002/eqe

To investigate the effect of building total height on the relationship between local damage eventsand drifts, a numerical parametric study is conducted. Maintaining the footprint and the geometryof the sample building, six more buildings with total number of stories of 20, 25, 35, 40, 45 and50 (total height of 65.3m, 81.3m, 113.3, 129.3, 145.3, 161.3m, respectively) are designed andnonlinearly modeled following the procedures in Sections 2 and 4. Figure 13 shows NISD andTISD at the onset of local damage events against building total height when subjected to R#5.Nearly all events, except exceedance of wall shear strength, occur at a similar NISD for allbuilding heights. The NISD results for R#3 show higher variability, and this can be attributed againto the bigger impact of higher modes on the response of such buildings to moderate near-fieldearthquakes.
TISD can be responsible for non-structural damage in tall buildings and inconvenience of theoccupants, hence is important at least when evaluating the performance of high-rise buildings atserviceability level. However, the above discussion confirms the superiority of NISD over TISDas a global damage measure for the vulnerability assessment of high-rise buildings because ofits structural significance, its correlation with local response and its consistency in buildingswith varying heights. Thus, it is decided to implement NISD as the global damage measure inthis study.
8. DEFINITION OF PERFORMANCE LIMIT STATE CRITERIA
The three commonly used performance levels, IO, LS and CP, are adopted in the present study, butnew SSSB limit state criteria are proposed for the sample building using the MRIDAs results fromthe 40 selected records and the mapping/linking of predefined local damages discussed in Sections 6and 7. Figures 14 and 15 depict the 50% fractile of the NISDs associated with selected local damageevents (or a combination of events) under R#5 and R#3, respectively. The proposed limit statecriteria are discussed in the succeeding subsections.
8.1. Limit states for severe distant earthquake scenario
Under this scenario, the 50% fractile of the NISDs associated with the first reinforcing steel yield in theflooring system is 0.11% (Figure 14(a)). This value is selected as the IO limit state in the present study.Although the 50% fractile TISD (0.81%) corresponding to this value is higher than that recommendedby ASCE/SEI 41-06 (0.5%), it is justified by the fact that the structural system of the sample building(piers and core walls with flat slabs) has potentially larger deformations when compared with structuresemploying other flooring systems. For the first yield in walls, the 50% fractile of the NISDs is 0.19%(Figure 14(b)), corresponding to 50% fractile TISD=1.43%. Again, this relatively high NISD value isattributed to: (i) the high compressive load on the lower stories, which delays the onset of initialyielding and cracking of vertical elements; and (ii) the larger longitudinal reinforcement ratios
Figure 13. R#5: Response of buildings with different height at the onset of damage events: (a) TISD; and (b)NISD.
SEISMIC SCENARIO-STRUCTURE-BASED LIMIT STATE CRITERIA
Copyright © 2016 John Wiley & Sons, Ltd. Earthquake Engng Struct. Dyn. (2016)DOI: 10.1002/eqe

provided at lower stories to comply with supplementary regulations and construction practice in thestudy region.
For the CP limit state, the 50% fractiles of the NISDs associated with all monitored CP-relateddamage events without and with considering shear strength exceedance local damage index are0.44% and 0.37% (Figures 14(d and e)), corresponding to 50% fractile TISD=2.72% and 2.39%,respectively. In 11 out of the 20 input ground motions, shear wall strength, particularly of coresegments at lower stories, is exceeded prior to the onset of any other CP-related damage events.This is attributed to the increasing influence of higher modes on the structural response at higherinput ground motion intensities, as shown in Figure 7(g). Hence, the NISD associated with the CP
Figure 15. Fifty percent fractile of NISDs associated with selected local damage events under Record Set #2:(a) first rebar yield in slabs; (b) first rebar yield in walls; (c) LS wall rotation limit; (d) all CP-related eventsexcluding the exceedance of shear strength and (e) all CP-related events including the exceedance of shear
strength.
Figure 14. Fifty percent fractile of NISDs associated with selected local damage events under Record Set #1:(a) first rebar yield in slabs; (b) first rebar yield in walls; (c) LS wall rotation limit; (d) all CP-related eventsexcluding the exceedance of shear strength and (e) all CP-related events including the exceedance of shear
strength.
W. ALWAELI ET AL.
Copyright © 2016 John Wiley & Sons, Ltd. Earthquake Engng Struct. Dyn. (2016)DOI: 10.1002/eqe
limit state is taken as 0.37%. The adopted criteria for reaching the LS limit state are either the wallrotation limit according to ASCE/SEI 41-6 or 50% of the NISD associated with all CP-relateddeformation-based damage indices, whichever occurs first. As shown in Figure 14(c), the 50%fractile of NISD associated with wall rotation is 0.30% (corresponding to 50% fractileTISD=2.09%), while the 50% NISD of the deformation-based damage indices corresponding to CPis calculated as 0.22%. Hence, the latter value is selected as the level of NISD corresponds to theLS limit state.
8.2. Limit states for moderate near-field earthquake scenario
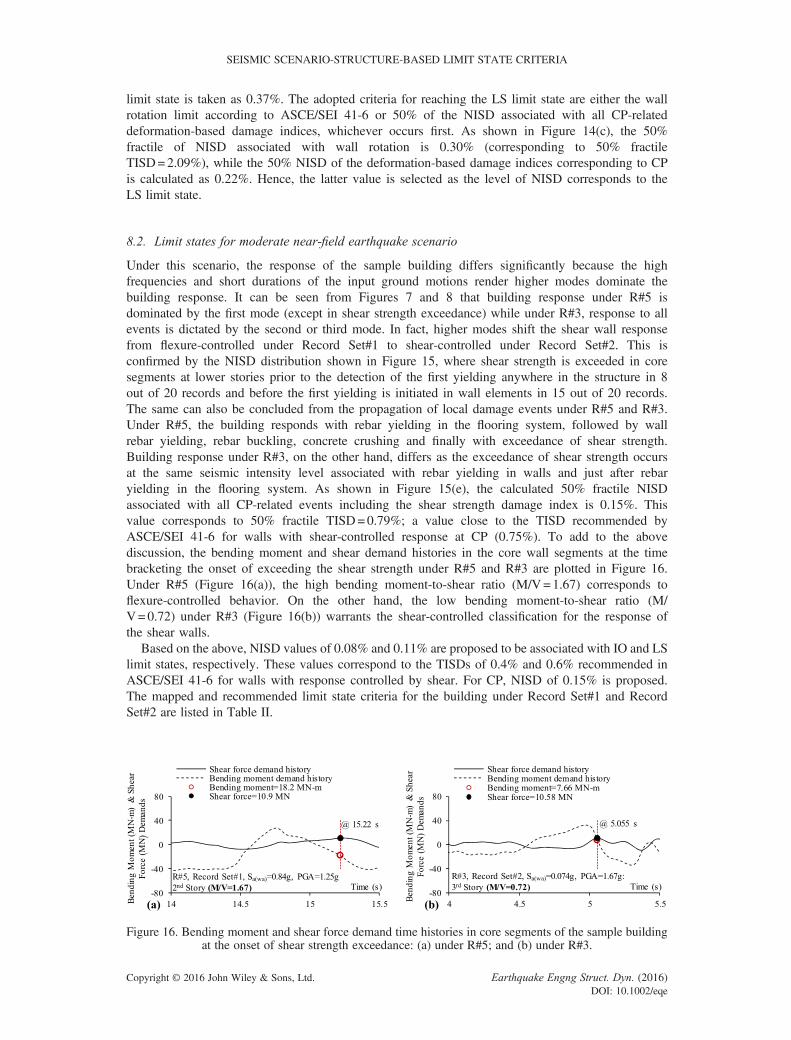
Under this scenario, the response of the sample building differs significantly because the highfrequencies and short durations of the input ground motions render higher modes dominate thebuilding response. It can be seen from Figures 7 and 8 that building response under R#5 isdominated by the first mode (except in shear strength exceedance) while under R#3, response to allevents is dictated by the second or third mode. In fact, higher modes shift the shear wall responsefrom flexure-controlled under Record Set#1 to shear-controlled under Record Set#2. This isconfirmed by the NISD distribution shown in Figure 15, where shear strength is exceeded in coresegments at lower stories prior to the detection of the first yielding anywhere in the structure in 8out of 20 records and before the first yielding is initiated in wall elements in 15 out of 20 records.The same can also be concluded from the propagation of local damage events under R#5 and R#3.Under R#5, the building responds with rebar yielding in the flooring system, followed by wallrebar yielding, rebar buckling, concrete crushing and finally with exceedance of shear strength.Building response under R#3, on the other hand, differs as the exceedance of shear strength occursat the same seismic intensity level associated with rebar yielding in walls and just after rebaryielding in the flooring system. As shown in Figure 15(e), the calculated 50% fractile NISDassociated with all CP-related events including the shear strength damage index is 0.15%. Thisvalue corresponds to 50% fractile TISD=0.79%; a value close to the TISD recommended byASCE/SEI 41-6 for walls with shear-controlled response at CP (0.75%). To add to the abovediscussion, the bending moment and shear demand histories in the core wall segments at the timebracketing the onset of exceeding the shear strength under R#5 and R#3 are plotted in Figure 16.Under R#5 (Figure 16(a)), the high bending moment-to-shear ratio (M/V=1.67) corresponds toflexure-controlled behavior. On the other hand, the low bending moment-to-shear ratio (M/V=0.72) under R#3 (Figure 16(b)) warrants the shear-controlled classification for the response ofthe shear walls.
Based on the above, NISD values of 0.08% and 0.11% are proposed to be associated with IO and LSlimit states, respectively. These values correspond to the TISDs of 0.4% and 0.6% recommended inASCE/SEI 41-6 for walls with response controlled by shear. For CP, NISD of 0.15% is proposed.The mapped and recommended limit state criteria for the building under Record Set#1 and RecordSet#2 are listed in Table II.
Figure 16. Bending moment and shear force demand time histories in core segments of the sample buildingat the onset of shear strength exceedance: (a) under R#5; and (b) under R#3.
SEISMIC SCENARIO-STRUCTURE-BASED LIMIT STATE CRITERIA
Copyright © 2016 John Wiley & Sons, Ltd. Earthquake Engng Struct. Dyn. (2016)DOI: 10.1002/eqe

9. SUMMARY AND CONCLUSIONS
This study develops a methodology for reliable Seismic Scenario-Structure-Based (SSSB) definitionsof performance limit state criteria for high-rise RC wall buildings. The methodology is illustrated ona 30-story RC wall sample building located in Dubai (study region). Multi-Record IncrementalDynamic Analyses (MRIDAs) with new intensity measure are conducted to assess building localresponse to two different seismic scenarios. Seismic scenario-based local damages, presented with arange of deformation and capacity-based damage indices, are mapped and linked to building globalresponse. Finally, a new set of SSSB limit state criteria is proposed for the sample structure.
A parametric study involving the sample 30-story building in addition to six other buildings withdifferent heights shows that for such buildings, Net Inter-Story Drift (NISD) is a more reliableglobal damage measure for use in defining limit state criteria. NISD is better linked with the localresponse over the height of the building and well correlated to deformation-based local damageevents for buildings with varying heights. The study shows that structural system, arrangement andgeometry of vertical elements and axial force level in the lower stories influence the seismicintensity and deformation levels that are related to local damage events. It is found that moderatenear-field earthquake events can shift the seismic response from flexure-controlled to shear-controlled. This leads to the conclusion that the response of RC high-rise wall buildings andconsequently the definition of limit state criteria for designated performance levels are stronglyinfluenced by both the structure and the seismic scenario. As a result, the presented methodologycan be used to arrive at a reliable definition of limit state criteria for RC high-rise wall buildingswith different characteristics under multiple earthquake scenarios.
REFERENCES
1. Ali MM, Moon KS. Structural developments in tall buildings: current trends and future prospects. ArchitecturalScience Review 2007; 50(3):205–223.
2. ASCE. ASCE/SEI 41-06: Seismic Rehabilitation of Existing Buildings. American Society of Civil Engineers: Reston,VA, 2007.
Table II. Mapped and recommended limit state criteria for the sample building.
Limit state Damage index (DI)
NISD (%)
Record Set #1 Record Set #2
Mapped Recomd.a Mapped Recomd.a
IO First rebar yield in slabs 0.11 0.11 0.14 0.08First rebar yield in walls 0.19 0.18Wall rotation limit (ASCE 41-6) 0.19 0.17All IO-related deformation-based DIs (combined) 0.11 0.14NISD associated with value recommended by ASCE41-6 for RC shear wall response controlled by shear
N/Ab 0.08
LS Wall rotation (ASCE 41-6) 0.30 0.22 0.32 0.1150% of minimum NISD associated to all CP-relateddeformation-based DIs (combined)
0.22 0.25
NISD associated with value recommended by ASCE41-6 for RC shear wall response controlled by shear
N/Ab 0.11
CP First rebar buckling in walls 0.44 0.37 0.49 0.15First confined concrete crushing in walls 0.59 0.67Wall rotation (ASCE 41-6) 0.51 0.71Exceedance of shear strength 0.34 0.15All CP-related deformation-based DIs (combined) 0.44 0.49All CP-related DIs inclusive of exceedance of shearstrength (combined)
0.37 0.15
NISD associated with value recommended by ASCE41-6 for RC shear wall response controlled by shear
N/Ab 0.14
aRecommended.bNot applicable.
W. ALWAELI ET AL.
Copyright © 2016 John Wiley & Sons, Ltd. Earthquake Engng Struct. Dyn. (2016)DOI: 10.1002/eqe

3. SEAOC. Recommended Lateral Force Requirements and Commentary. Seismology Committee Structural EngineersAssociation of California: Sacramento, CA, 1999.
4. Ghobarah A. On drift limits associated with different damage levels. International Workshop on Performance-basedSeismic Design. Pacific Earthquake Engineering Research Center (PEER), University of California, College ofEngineering: Berkeley, U.S.A, 2004.
5. Mwafy A. Analytically derived fragility relationships for the modern high-rise buildings in the UAE. The StructuralDesign of Tall and Special Buildings 2012; 21(11):824–843.
6. Ji J, Elnashai AS, Kuchma DA. Seismic fragility relationships of reinforced concrete high-rise buildings. TheStructural Design of Tall and Special Buildings 2009; 18(3):259–277.
7. ASCE. ASCE/SEI 7-10: Minimum Design Loads for Buildings and Other Structures. American Society of CivilEngineers: Reston, VA, 2010.
8. Abdalla JA, Al-Homoud AS. Seismic hazard assessment of United Arab Emirates and its surroundings. Journal ofEarthquake Engineering 2004; 8(06):817–837.
9. Sigbjornsson R, Elnashai AS. Hazard assessment of Dubai, United Arab Emirates, for close and distant earthquakes.Journal of Earthquake Engineering 2006; 10(05):749–773.
10. DMA-AD. Abu Dhabi International Building Code. Department of Municipal Affairs: Abu Dhabi, UAE, 2013.11. ACI. Building Code Requirements for Structural Concrete (ACI 318M-14) and commentary. American Concrete In-
stitute: Farmington Hills, MI, 2014.12. CSI. ETABS: Extended 3D Analysis of Building Systems. Computers, and Structures, Inc.: 1995 University Ave.:
Berkeley, CA, 2015.13. CSI. SAFE: Slab Analysis by Finite Element Method. Computers and Structures, Inc.: 1995 University Ave.:
Berkeley, CA, 2014.14. Mwafy A, Elnashai AS, Sigbjörnsson R, Salama A. Significance of severe distant and moderate close earth-
quakes on design and behavior of tall buildings. The Structural Design of Tall and Special Buildings 2006;15(4):391–416.
15. Ambraseys N, Douglas J, Sigbjörnsson R, Berge-Thierry C, Suhadolc P, Costa G, Smit M. Dissemination ofEuropean strong-motion data, Volume 2, using storng-motion dataspace navigator, CD-ROM collection. in TheProceedings of the 13th World Conference on Earthquake Engineering. 2004. Vancouver, Canada.
16. PEER. Ground motion database, 2014. Available from: http://peer.berkeley.edu/nga.17. Tso W, Zhu T, Heidebrecht A. Engineering implication of ground motion A/V ratio. Soil Dynamics and Earthquake
Engineering 1992; 11(3):133–144.18. Kwon O-S, Elnashai AS. The effect of material and ground motion uncertainty on the seismic vulnerability curves of
RC structure. Engineering Structures 2006; 28(2):289–303.19. CSI. PERFORM-3D V5: Nonlinear Analysis and Performance Assessment for 3D Structures: User Manual.
Computer and Structures, Inc.: 1995 University Avenue: Berkeley, CA, 2011.20. Alwaeli W, Mwafy A, Pilakoutas K, Guadagnini M. Framework for Developing Fragility Relations of High-Rise RC
Wall Buildings Based on Verified Modelling Approach, in Second European Conference on Earthquake Engineeringand Seismology. EAEE: Istanbul, Turkey, 2014.
21. Panagiotou M, Restrepo JI, Conte JP. Shake Table Test of a 7 Story Full Scale Reinforced Concrete Structural WallBuilding Slice Phase I: Rectangular Wall Section, SSRP–07-07. Department of Structural Engineering, University ofCalifornia: San Diego, CA, 2007.
22. Panagiotou M, Restrepo JI, Conte JP. Shake-table test of a full-scale 7-story building slice. Phase I: Rectangular wall.Journal of Structural Engineering 2011; 137(6):691–704.
23. Naish D. Testing and Modeling of Reinforced Concrete Coupling Beams: Doctoral Dissertation. University ofCalifornia: Los Angeles, CA, 2010.
24. Naish D, Fry A, Klemencic R, Wallace J. Experimental evaluation and analytical modeling of ACI 318-05/08reinforced concrete coupling beams subjected to reversed cyclic loading. Report No. UCLA-SGEL 2009; 6:2009.
25. Wallace JW. Behavior, design, and modeling of structural walls and coupling beams—lessons from recent laboratorytests and earthquakes. International Journal of Concrete Structures and Materials 2012; 6(1):3–18.
26. LATBSDC. An Alternative Procedure for Seismic Analysis and Design of Tall Buildings Located in the Los AngelesRegion. Los Angeles Tall Buildings Structural Design Council: Los Angeles, CA, 2011.
27. Martínez-Rueda JE, Elnashai AS. Confined concrete model under cyclic load. Materials and Structures 1997;30(3):139–147.
28. Orakcal K, Wallace JW. Flexural modeling of reinforced concrete walls—experimental verification. ACI StructuralJournal 2006; 103(2):196–206.
29. Tuna Z. Seismic Performance,Modeling, and Failure Assessment of RC ShearWall Buildings. Ph.D. Thesis, Universityof California: Los Angeles, CA, 2012.
30. Bae S, Mieses AM, Bayrak O. Inelastic buckling of reinforcing bars. Journal of Structural Engineering 2005;131(2):314–321.
31. Cosenza E, Prota A. Experimental behaviour and numerical modelling of smooth steel bars under compression.Journal of Earthquake Engineering 2006; 10(3):313–329.
32. Rodriguez ME, Botero JC, Villa J. Cyclic stress–strain behavior of reinforcing steel including effect of buckling.Journal of Structural Engineering 1999; 125(6):605–612.
33. Thomsen JH, Wallace JW. Displacement-based design of slender reinforced concrete structural walls—experimentalverification. Journal of Structural Engineering 2004; 130(4):618–630.
SEISMIC SCENARIO-STRUCTURE-BASED LIMIT STATE CRITERIA
Copyright © 2016 John Wiley & Sons, Ltd. Earthquake Engng Struct. Dyn. (2016)DOI: 10.1002/eqe

34. Gogus A. Structural Wall Systems-Nonlinear Modeling and Collapse Assessment of Shear Walls and Slab-ColumnFrames. Ph.D. Thesis, University of California: Los Angeles, CA, 2010.
35. Massone LM. RC Wall Shear–Flexure Interaction: Analytical and Experimental Responses. Ph.D. Thesis, Universityof California: Los Angeles, CA, 2006.
36. Elwood KJ, Matamoros AB, Wallace JW, Lehman DE, Heintz JA, Mitchell AD, Moore MA, Valley MT, Lowes LN,Comartin CD. Update to ASCE/SEI 41 concrete provisions. Earthquake Spectra 2007; 23(3):493–523.
37. Wallace JW. Performance-based design of tall reinforced concrete core wall buildings. Earthquake Engineering inEurope, (Mihail G, Ansal A Eds.). Springer: Netherlands, 2010. p 279–307.
38. Orakcal K, Massone LM, Wallace JW. Shear strength of lightly reinforced wall piers and spandrels. ACI StructuralJournal 2009; 106(4):455–465.
39. Panagiotou M, Restrepo JI. Model Calibration for the UCSD 7-Story Building Slice. NEES/UCSD Seminar onAnalytical Modeling of Reinforced Concrete Walls for Earthquake Resistance, La Jolla: California, USA December2006, 2006.
40. Waugh JD, Sritharan S. Lessons learned from seismic analysis of a seven-story concrete test building. Journal ofEarthquake Engineering 2010; 14(3):448–469.
41. Satake N, Suda K, Arakawa T, Sasaki A, Tamura Y. Damping evaluation using full-scale data of buildings in Japan.Journal of Structural Engineering 2003; 129(4):470–477.
42. Vamvatsikos D, Cornell CA. Incremental dynamic analysis. Earthquake engineering & structural dynamics 2002;31(3):491–514.
43. Shome N. Probabilistic Seismic Demand Analysis of Nonlinear Structures. Ph.D. Thesis, Stanford University:Stanford, CA, 1999.
44. Luco N, Cornell CA. Structure-specific scalar intensity measures for near-source and ordinary earthquake groundmotions. Earthquake Spectra 2007; 23(2):357–392.
45. Cordova PP, Deierlein GG, Mehanny SS, Cornell CA. Development of a two-parameter seismic intensity measureand probabilistic assessment procedure. The Second US-Japan Workshop on Performance-Based EarthquakeEngineering Methodology for Reinforced Concrete Building Structures. Pacific Earthquake Engineering ResearchCenter (PEER), University of California, College of Engineering: Berkeley, U.S.A., 2000.
46. Carballo JE, Cornell CA. Probabilistic Seismic Demand Analysis: Spectrum Matching and Design, RMS Program-41. Department of Civil and Environmental Engineering, Stanford University: Stanford, CA, 2000.
47. Baker JW, Cornell CA. A vector-valued ground motion intensity measure consisting of spectral acceleration andepsilon. Earthquake Engineering & Structural Dynamics 2005; 34(10):1193–1217.
48. Bazzurro P, Cornell CA. Vector-valued probabilistic seismic hazard analysis (VPSHA). in Proceedings of the 7th USnational conference on earthquake engineering. 2002. Boston, MA.
49. Conte JP, Pandit H, Stewart JP, Wallace J. Ground motion intensity measures for performance-based earthquakeengineering. Proc. 9th ICASP 2003.
50. BianchiniM. ImprovedGroundMotion IntensityMeasures for Reliability-BasedDemand Analysis of Structures. Ph.D.Thesis, University of Bologna: Italy, 2008.
51. Bianchini M, Diotallevi P, Baker J. Prediction of inelastic structural response using an average of spectral accelera-tions. in Proc. of the 10th International Conference on Structural Safety and Reliability (ICOSSAR09), Osaka, Japan.2009.
52. Cai J, Bu G, Yang C, Chen Q, Zuo Z. Calculation methods for inter-story drifts of building structures. Advances inStructural Engineering 2014; 17(5):735–746.
W. ALWAELI ET AL.
Copyright © 2016 John Wiley & Sons, Ltd. Earthquake Engng Struct. Dyn. (2016)DOI: 10.1002/eqe