a “method” to the madness: using the scientific method to
TRANSCRIPT

A “Method” to the Madness: Using the Scientific Method to Analyze an Epidemic Cristin Calder Archbishop Edward A. McCarthy High School Fort Lauderdale, Florida Abstract: This activity introduces AP Biology students to the scientific method and data analysis in the context of a real-world problem: the continuing outbreaks of Ebola in Africa. Students begin with a short video and reading on Ebola to answer questions about its nature, spread, and containment. Next, they simulate transmission of a virus using a mini lab activity. This sets the stage for them to trace an outbreak to its source using real data from the 2014 outbreak in Zaire. Next, they will analyze data from Ebola outbreaks from 1979 - 2014 to calculate mortality and summarize infection rate by location. Then, they will learn about the Ebola vaccination experiment and analyze the experimental design. Finally, they will read about the difficulties in providing the vaccine to patients in the field to gain an understanding of the limits of science in real-world situations. Rationale: In all science classes, but in particular Advanced Placement Biology, there is a large emphasis on the science skills of analyzing and graphing data in order to draw conclusions. In years past, I have covered this at the beginning of the year using fictitious data sets on a variety of topics. However, since Evolution and Genetics are also emphasized in the course, I thought it might be more interesting for the students as well as a clear preview to upcoming units if we started the year with real data from a viral epidemic that is ongoing and relevant right now. We could return to the topic as the year progressed and use DNA segments to discuss classification and evolution as well as how mutations lead to new strains. But for now this would “set the stage” and at the same time serve as our way of reviewing the process of discovery as well as graphing and analyzing data. Description of Unit and Expected Outcomes: This activity will take approximately 3 days to complete. On day 1 students will watch the video and read the background information in order to complete the questions. They should be able to describe what Ebola is, how it is transmitted, and how it is treated by the end of this activity. We will also do Part 2 where they will simulate an outbreak and determine the source. At the end of Part 2, students should be able to distinguish between positive and negative control groups, use data to draw a conclusion about the source of the outbreak and create a graph that shows the relationship between the number of contacts and infection rate. On day 2, students will map the epidemic using the Epidemiological Report Patient Summaries. They should be able to explain how the infection spread and determine the source. On day 3, students will complete Part 4 of the activity which focuses on reading data tables, performing calculations, and graphing. At the end of this activity they should be able to calculate percents, create a summary table, create a graph, and describe the experimental design from the vaccine trials. They will also be able to describe how science is limited by fear and lack of government infrastructure after reading the articles provided on obstacles to Ebola treatment. Data Collection and Assessment: Students will fill out a data sheet which has the activity broken into 4 parts. Part 1 is the introductory information and assessment will be through questions they answer on the worksheet. Part 2 is the Modeling an outbreak activity. Students will insert pictures of their results and answer questions about the activity. They will also create a graph of sample data and draw a conclusion. For Part 3 they will insert a picture of their completed map and answer questions about the source and spread of Ebola in the outbreak. For part 4, there are direct questions and places for them to insert their calculations on the math as well as space for their graph. CATALySIS Elements Included: Parts 1 – 3 of this activity were taken from the Ebola Epidemic activity posted on the CPET site. All parts were modified to suit the design of this unit but some instructions will be used exactly as they are in the original activity. Part 4 was taken from the CDC and WHO websites which were also utilized during the CATALySIS training and the information about vaccination trials and obstacles was taken from the lecture given by Dr. Natalie Dean on Vaccine Efficacy. How this Differs from Traditional Teaching of this Unit: Normally I don’t teach about Ebola at all. Viruses may be mentioned in the DNA unit, but in a very general sense. When teaching the Scientific Method, I typically have used

fictitious data unrelated to anything relevant in society. By using this unit, I am hoping to show the scientific method in action in a real-world situation. I also hope to later in the year relate back to Ebola when we discuss genetics, genetic engineering, evolution, and phylogeny. This unit will provide an introduction to Ebola and set my class up for this later. Literature Cited:
Parts 1-3 relied heavily on information in the CPET UF Ebola Epidemic Activity:
https://www.cpet.ufl.edu/resources/curricula/biomedical-curriculum-series/ebola-epidemic/
Table taken from PBS Ebola Newshour activity: https://www.pbs.org/newshour/extra/lessons-plans/ebola-outbreak-
lesson-plan/
Ebola Outbreak Video from TedEd on You Tube: https://www.youtube.com/watch?v=UMMwgvLmN-M
Information about Ebola from the CDC’s website: https://www.cdc.gov/vhf/ebola/about.html
Table of confirmed cases and information about vaccinations taken from WHO’s website:
https://www.who.int/csr/don/16-may-2019-ebola-drc/en/
Articles for why Ebola vaccine is not reaching people taken from:
NPR article about doctor being killed https://www.npr.org/sections/goatsandsoda/2019/04/23/716121928/the-doctor-
killed-in-fridays-ebola-attack-was-dedicated-but-also-afraid
Washington Post article about why people aren’t receiving vaccinations https://www.washingtonpost.com/news/to-
your-health/wp/2018/05/22/a-new-ebola-vaccine-could-help-stop-an-epidemic-but-faces-enormous-obstacles-in-
crucial-test/?noredirect=on&utm_term=.bcbf57399719
Budget: Minimal Cups, 31 tabs, and pH paper are all supplies schools typically have on hand or can be purchased for under $10. Additionally, teacher needs to have maps printed on large paper for each group and it is recommended to laminate the patient cards to make them more durable.

AP Biology – Scientific Method Lesson Plan
Cristin Calder Archbishop Edward A. McCarthy High School Fort Lauderdale, Florida
TITLE: A “Method” to the Madness: Using the Scientific Method to Analyze an Epidemic
KEY QUESTION(S): How are collaboration and the scientific method used to solve real world problems? How can data
tables be summarized and analyzed? How do graphs help to organize data? What is the importance of control groups
and how is a positive control different from a negative control?
SCIENCE SUBJECT: Biology
GRADE AND ABILITY LEVEL: Advanced Placement Biology (but could be used with lower levels), Grades 9-12, class size
up to 32 students (working in groups of 4 for the map activity)
SCIENCE CONCEPTS: How to analyze data to draw a conclusion, identifying Independent and dependent variables,
Identifying positive and negative control groups, how to graph data, how to draw conclusions
OVERALL TIME ESTIMATE: 3 days – some portions can be done for homework in order to save time if necessary. Class
activities can be done in 2 days.
LEARNING STYLES: Visual, kinesthetic, auditory
VOCABULARY: The vocabulary for parts 1-3 of this lesson are outlined in the activity on which it is based from University
of Florida: https://www.cpet.ufl.edu/resources/curricula/biomedical-curriculum-series/ebola-epidemic/ (teacher pages)
For part 4 students will learn the term ring vaccination.
LESSON SUMMARY: After a brief video introduction, students will read background information on the Ebola virus to
answer some baseline questions about the virus and its transmission. They will simulate an outbreak using a lab activity.
They will then use real outbreak data to track the source of an epidemic. They will analyze data from several Ebola
outbreaks from 1976 to 2019 in order to answer questions about the spread of the disease. Finally, after watching a
brief clip on ring vaccination, they will relate the scientific method to the vaccine trials for Ebola and discuss why the
vaccine is not reaching patients in the current epidemic.
STUDENT LEARNING OBJECTIVES WITH STANDARDS: (from new AP Biology Standards as of 2019-20)
1. Describe the basic symptoms and transmission of the Ebola Virus from a video, reading, and graphic representation of
the ecology of the virus (Science Practice 2.A, 2.D)
2. Perform a simulated epidemic, collect the data, analyze the data and draw conclusions about the source of the
infection. (Science Practice 3.C, 3.D, 4.A)
3. Then use real viral epidemic data to similarly track the source. (Science Practice 2.B, 3.C, 3.D)
3. Read data from tables and perform calculations from this data (percents, summaries, graphs) in order to answer
questions about the data (Science Practice 4.B, 5.A)
4. Evaluate the barriers that doctors face in vaccinating high risk groups (Science Practice 6.D; Learning Objective SYI2A)
MATERIALS: (for a class of 30)
30 Cups (1 per person)
1 L Water (for each cup)
100 mL 0.05M NaOH or other weak base (for 1 cup)

30 pH test strips
8 Maps (approximately 1 per group of 4-5)
31 Colored Tabs for map
8 Copies of Epidemiological Report Patient Summaries (1 set of cards per group of 4-5 students)
Internet Access
BACKGROUND INFORMATION:
Ebola is a virus which first appeared in Africa in 1976 and has reappeared in local outbreaks over the past 40 years. Because of its devastating effects and high mortality rate, it has gotten a lot of media attention and attracts the interest of students. It can be a model for the devastation of a viral outbreak, the development of vaccines to treat outbreaks, and the effect of obstacles (such as economic poverty and government turmoil) on treatment. In order to teach this lesson, the teacher does not need to have an extensive understanding of viruses. Information is provided in the background readings and video that the students will watch/access. The teacher should visit the websites in the activity and watch the 2 videos ahead of time. This should give all base information on Ebola necessary to present the lesson. The vocabulary for parts 1-3 can be found in the teacher pages of the CPET Ebola Epidemic activity at the following website https://www.cpet.ufl.edu/resources/curricula/biomedical-curriculum-series/ebola-epidemic/ . For Part 4, vaccines are discussed and the method of ring vaccination. A video link is provided which explains how ring vaccination works. A major goal of this lesson is for students to practice using the scientific method. The teacher needs to understand the parts of the method including: Independent variable, dependent variable, positive control, and negative control. The teacher also needs to understand how to calculate percents, how to read a table, and how to make a graph. A key is provided for the data sheet with answers to all questions.
ADVANCE PREPARATION:
Day 1: Load video clip for introduction, Fill cups with water and 1 cup with NaOH solution
Day 2: Have maps printed & tape to tables (1 per group of 4-5). Have printed Patient cards at each station and
colored tabs to place on the map.
Day 3: Load video clip on ring vaccination
PROCEDURE AND DISCUSSION QUESTIONS WITH TIME ESTIMATES: (designed for 3 50-minute periods)
DAY 1 (have video loaded and cups ready to hand out. Inconspicuously mark the infected cup to ID later)
1. Provide quick overview of the Activity to the class – explain that students will learn about the disease Ebola,
simulate the spread of a virus, use real data to trace the source of a virus, analyze data on the Ebola outbreaks,
and relate the scientific method to the vaccination trials. Have students download the data sheet and tell them
they will work with the person next to them as a partner. If there is an odd number of students, assign one
group of 3. Each person has their own data sheet. Tell them this will be a 3 day activity and not to work ahead.
(5-10 minutes)
2. Watch video clip (TedEd clip – 4 minutes)
3. Instruct students to work with their partner to complete Part 1 of the activity (15 minutes)
4. Give all students one of the cups prepared before class (MAKE A NOTE OF WHO GETS THE INFECTED CUP!) and
explain the instructions for Part 2 (on the data sheet). Allow students to mix with 2 others. If a student can not
find a 3rd person to mix with, allow one person to mix 4x to accommodate them (5-10 minutes)
5. Model the positive and negative control and give each student a test strip to determine if they are infected.
Have the infected stand up and interview them to see who they switched with in order to determine the source
of the outbreak. It is possible you will not be able to limit this to one person. If you can trace the source to 2
people, list both as possible sources. (10 minutes)
DAY 2: (Maps should be taped to the tables and card sets/tabs left at each map prior to class)
1. Summarize the activity from yesterday and give about 10 minutes to complete the last graph on Part 2. Remind
students about graphing rules (scales, labeling, etc) (10 minutes)

2. Start Part 3: Two groups of students will work together on 1 map. Students will follow protocol in the attached
sheet taken directly from the original CPET activity. They will create a tab for each patient and place the location
of the patient on the map at their table. They should take a picture of the map once they are done and answer
the questions on their data sheet about the outbreak. You should circulate in case any groups need help. (40
minutes)
Day 3: (Load video clip on ring vaccination)
1. Review what has been done so far (experimental parts, how a virus is tracked) (5 minutes)
2. Part 4: explain that students will be provided with data about Ebola outbreaks and information about an
experimental vaccine. Show the video on ring vaccination (10 minutes)
3. Allow students to work the rest of the period on the calculations and graphs. Finish for HW. Circulate to help any
students struggling with the calculations. (35 minutes)
4. Students should finish for HW.
ASSESSMENT SUGGESTIONS:
The entire activity will be assessed by the data sheet submitted at the end. Part 1 questions show they know the
symptoms, transmission, and treatment of the disease. Part 2 questions show they can identify the parts of an
experiment, make a graph and draw a conclusion. Part 3 mapping shows they can track a disease and the accompanying
questions show they can use reasoning to draw a conclusion. Part 4 questions show they can calculate percents,
summarize data, create a graph of a data table, and analyze the parts of an experiment and reasoning for the
experimental design.
EXTENSIONS/ACTIVITIES: Here are activities that delve further into the Ebola Virus
PBS Ebola Newshour activity: https://www.pbs.org/newshour/extra/lessons-plans/ebola-outbreak-lesson-plan/
Biointeractive Website: https://www.biointeractive.org/classroom-resources/ebola-disease-detectives
CPET UF Ebola Epidemic Activity: https://www.cpet.ufl.edu/resources/curricula/biomedical-curriculum-series/ebola-
epidemic/
The movie “Outbreak” from 1995 is a fictitious account of an Ebola-like virus and also brings in the idea of biological
weapons. It is Rated “R” but if an edited version was available it would bring up great discussion about how to handle an
outbreak the ethics of quarantining and of biological weapons.
The 6 part series “The Hot Zone” on National Geographic is the actual account of the Ebola virus’ appearance in Reston,
Virginia and documents the government’s response to an outbreak.
LITERATURE:
A great book on the topic of Ebola is The Hot Zone by Richard Preston. A fictional book that would be a great extension
as it discusses the idea of using viruses for bioterrorism is The Cobra Event by Richard Preston.
RESOURCES/REFERENCES:
Part 1, 2, and 3 of the worksheet borrowed in part from the University of Florida CPET activity “Ebola Epidemic” and
more resources and other versions of this activity can be found at:
https://www.cpet.ufl.edu/resources/curricula/biomedical-curriculum-series/ebola-epidemic/
Ebola Outbreak Video from TedEd on You Tube: https://www.youtube.com/watch?v=UMMwgvLmN-M

Information about Ebola from the CDC’s website: https://www.cdc.gov/vhf/ebola/about.html
Table of confirmed cases and information about vaccinations taken from WHO’s website:
https://www.who.int/csr/don/16-may-2019-ebola-drc/en/
Articles about limits of Ebola vaccine taken from:
NPR article about doctor being killed https://www.npr.org/sections/goatsandsoda/2019/04/23/716121928/the-doctor-
killed-in-fridays-ebola-attack-was-dedicated-but-also-afraid
Washington Post article about why people aren’t receiving vaccinations https://www.washingtonpost.com/news/to-
your-health/wp/2018/05/22/a-new-ebola-vaccine-could-help-stop-an-epidemic-but-faces-enormous-obstacles-in-
crucial-test/?noredirect=on&utm_term=.bcbf57399719
Information also taken from lecture by Dr. Natalie Dean, Department of Biostatistics, University of Florida
COPY OF DATA SHEET AND ANSWER KEY ATTACHED:

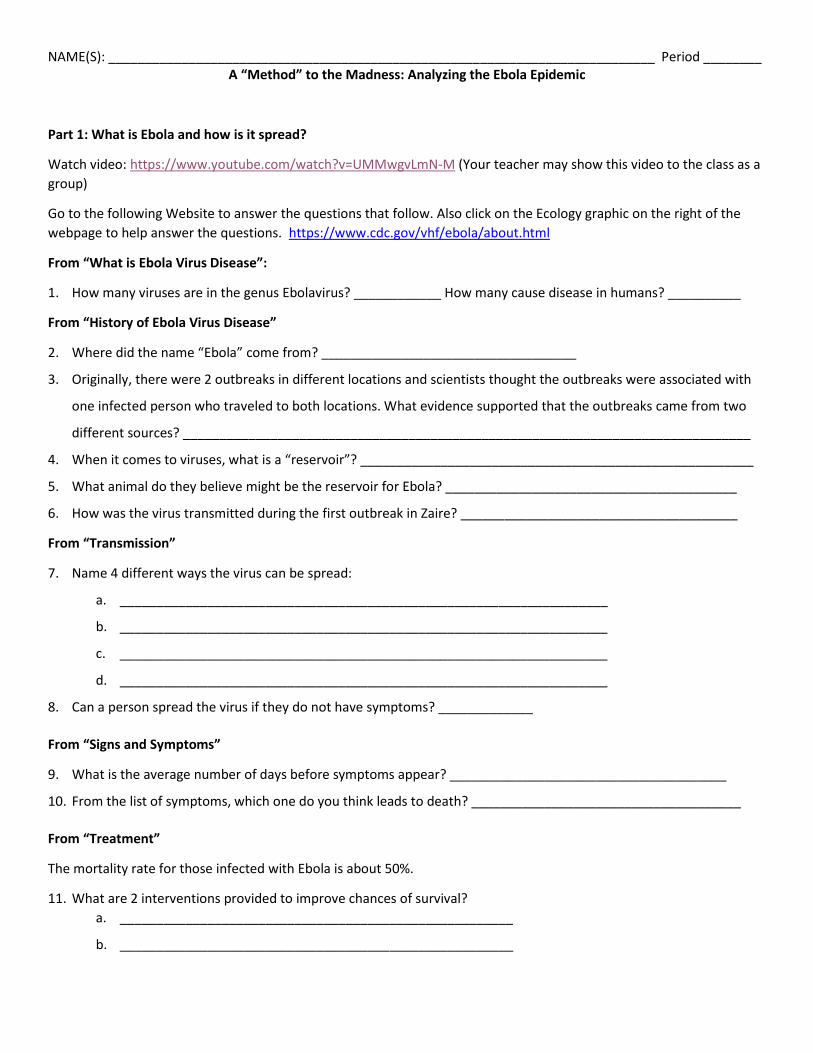
A “Method” to the Madness: Analyzing the Ebola Epidemic
Part 1: What is Ebola and how is it spread?
Watch video: https://www.youtube.com/watch?v=UMMwgvLmN-M (Your teacher may show this video to the class as a
group)
Go to the following Website to answer the questions that follow. Also click on the Ecology graphic on the right of the
webpage to help answer the questions. https://www.cdc.gov/vhf/ebola/about.html
From “What is Ebola Virus Disease”:
1. How many viruses are in the genus Ebolavirus? ____________ How many cause disease in humans? __________
From “History of Ebola Virus Disease”
2. Where did the name “Ebola” come from? ___________________________________
3. Originally, there were 2 outbreaks in different locations and scientists thought the outbreaks were associated with
one infected person who traveled to both locations. What evidence supported that the outbreaks came from two
different sources? ______________________________________________________________________________
4. When it comes to viruses, what is a “reservoir”? ______________________________________________________
5. What animal do they believe might be the reservoir for Ebola? ________________________________________
6. How was the virus transmitted during the first outbreak in Zaire? ______________________________________
From “Transmission”
7. Name 4 different ways the virus can be spread:
a. ___________________________________________________________________
b. ___________________________________________________________________
c. ___________________________________________________________________
d. ___________________________________________________________________
8. Can a person spread the virus if they do not have symptoms? _____________
From “Signs and Symptoms”
9. What is the average number of days before symptoms appear? ______________________________________
10. From the list of symptoms, which one do you think leads to death? _____________________________________
From “Treatment”
The mortality rate for those infected with Ebola is about 50%.
11. What are 2 interventions provided to improve chances of survival?
a. ______________________________________________________
b. ______________________________________________________

Part 2: Modeling an Epidemic (How do scientists trace an epidemic?) Adapted from University of Florida Center for Precollegiate Education and Training: https://www.cpet.ufl.edu/resources/curricula/biomedical-curriculum-
series/ebola-epidemic/
1. Take a cup of liquid from your teacher.
2. When told to do so, find a partner and pour all the liquid from one cup into the other. Then pour half of the liquid
back so that both cups have the same amount they began with. This will simulate the exchange of fluids between 2
people and also the spread of infection (if one of you is infected). Repeat this step with 2 other partners. Record the
names of your 3 partners below:
Person 1: ____________________ Person 2: ______________________ Person 3: ______________________
3. Your teacher will provide you with a test strip to see if you are infected. This will simulate an antibody test that
might be given in the field to test a person for infection. Your teacher will show you both a POSITIVE CONTROL and a
NEGATIVE CONTROL.
What is the purpose of using both a Positive and a negative control in this experiment? _______________________
_______________________________________________________________________________________________
Take a picture of the Positive and negative control and insert it on the left. On the right, insert a picture of your result and
identify if you were infected:
POSITIVE CONTROL NEGATIVE CONTROL YOUR TEST Circle (INFECTED, NOT INFECTED)
How many people were infected? ______________ Could you determine the source? _________________
Name the suspected source(s): ________________________________________________________________________
On the left is some data from a sample groups of 25 that performed this lab using different numbers of exchanges. Graph this data
and draw a conclusion about the relationship between the number of exchanges and the number of infections:
Number of Exchanges Number of Infections GRAPH:
1 2
2 4
3 8
4 14
5 20
6 22
7 23
8 25
9 25
10 25
Conclusion: ________________________________________________________________________________________

Part 3: Mapping an Epidemic (Trace a real epidemic from data)
Use the directions in the activity “Tracking an Epidemic” sheet. Your teacher will put you in groups to do the activity.
Taken From University of Florida Center for Precollegiate Education and Training: https://www.cpet.ufl.edu/resources/curricula/biomedical-curriculum-series/ebola-
epidemic/
Insert a picture of your completed map below
Questions:
1. When did the outbreak begin? _______________________ Where? ___________________________________
2. Who was patient Zero in this outbreak? ___________________________________
3. Based on your previous reading on page 1, how might the first patient have become infected?
___________________________________________________________________________________________
___________________________________________________________________________________________
4. Which patients were likely responsible for bringing the outbreak to each of the other cities? (Name at least 5 and include how they caught the disease, and to what city they brought the disease) ___________________________________________________________________________________________
___________________________________________________________________________________________
___________________________________________________________________________________________
___________________________________________________________________________________________
___________________________________________________________________________________________

Part 4: Analyzing Data from an Epidemic
The following data table shows a breakdown of the number of Ebola cases from 1976 to 2014 according to the World
Health Organization. Use this data to answer the questions that follow:
Table copied June 2019 from: https://www.pbs.org/newshour/extra/app/uploads/2014/09/Ebola-outbreak-analyzing-the-data-worksheet.pdf
1. What percentage of all cases occurred in the Democratic Republic of Congo? _________________
2. Based on this data, what is the average fatality rate (# deaths/# cases) for the Democratic Republic of Congo? _______
3. In which year were there the most cases? _________ In which were there the most fatalities? ____________
4. Fill in the table below summarizing cases by region:
Region # of Cases Percentage of Cases
Congo
Democratic Republic of Congo
Gabon
Liberia-Guinea-Sierra Leone
South Africa
Sudan
Uganda
TOTAL: 100%
5. Create a Pie Chart that shows the overall PERCENTAGE of cases by region.

In 2015, scientists had developed an experimental vaccine. Although it does not have FDA approval yet, scientists
received approval from the National Regulatory Authority of DRC and the Ethics Review Committee of the Ecole de
Santé Pùblique in Kinshasa to use this vaccine (rVSV-ZEBOV). They used a ring vaccination method. This entailed
vaccinating contacts and contacts of contacts of the infected as well as health care workers who were treated infected
people. Watch the video on Ring Vaccination from the WHO: https://www.youtube.com/watch?v=4dL1kqLLXbw
What is the purpose of using the ring vaccination method? (rather than mass vaccinations?)
__________________________________________________________________________________________________
__________________________________________________________________________________________________
In order to conduct a true controlled experiment, what should have been the negative control group?
__________________________________________________________________________________________________
Scientists modified the control group in this experiment. They vaccinated some in the ring immediately and then
vaccinated the rest 21 days later. Why do you think scientists made this decision (based on what you know about
Ebola)?
__________________________________________________________________________________________________
__________________________________________________________________________________________________
In 2018, there was another outbreak of Ebola in the Democratic Republic of Congo.
The table below shows Confirmed and probable Ebola virus disease cases, and number of health areas affected, by health zone, North
Kivu and Ituri provinces, Democratic Republic of the Congo, data as of 14 May 14, 2019 according to the World Health Organization.
Data taken June 2019 from: https://www.who.int/csr/don/16-may-2019-ebola-drc/en/ Map: https://www.cdc.gov/vhf/ebola/outbreaks/drc/east-drc-map.html
1. Based on this table, what percentage of confirmed cases came from North Kivu? _____ Ituri? ______
2. What is the average mortality rate for confirmed cases in North Kivu? ___________
3. What is the average mortality rate for confirmed cases in Ituri? ___________

Ring Vaccination protocol was initiated and continues in the Republic of Congo. Unfortunately, although this vaccine is
over 95% effective, people are not getting the vaccine they need. Why isn’t everyone getting vaccinated? Read the
articles in the 2 attached websites and explain in 5-6 sentences the barriers to vaccination:
https://www.npr.org/sections/goatsandsoda/2019/04/23/716121928/the-doctor-killed-in-fridays-ebola-attack-was-
dedicated-but-also-afraid
https://www.washingtonpost.com/news/to-your-health/wp/2018/05/22/a-new-ebola-vaccine-could-help-stop-an-
epidemic-but-faces-enormous-obstacles-in-crucial-test/?noredirect=on&utm_term=.bcbf57399719
Give at least 4 reasons why not everyone is getting vaccinated: At least one should come from EACH article!
__________________________________________________________________________________________________
__________________________________________________________________________________________________
__________________________________________________________________________________________________
__________________________________________________________________________________________________
__________________________________________________________________________________________________
__________________________________________________________________________________________________
NAME(S): ___________________________________________________________________________ Period ________ A “Method” to the Madness: Analyzing the Ebola Epidemic
Part 1: What is Ebola and how is it spread?
Watch video: https://www.youtube.com/watch?v=UMMwgvLmN-M (Your teacher may show this video to the class as a
group)
Go to the following Website to answer the questions that follow. Also click on the Ecology graphic on the right of the
webpage to help answer the questions. https://www.cdc.gov/vhf/ebola/about.html
From “What is Ebola Virus Disease”:
1. How many viruses are in the genus Ebolavirus? ____________ How many cause disease in humans? __________
From “History of Ebola Virus Disease”
2. Where did the name “Ebola” come from? ___________________________________
3. Originally, there were 2 outbreaks in different locations and scientists thought the outbreaks were associated with
one infected person who traveled to both locations. What evidence supported that the outbreaks came from two
different sources? ______________________________________________________________________________
4. When it comes to viruses, what is a “reservoir”? ______________________________________________________
5. What animal do they believe might be the reservoir for Ebola? ________________________________________
6. How was the virus transmitted during the first outbreak in Zaire? ______________________________________
From “Transmission”
7. Name 4 different ways the virus can be spread:
a. ___________________________________________________________________
b. ___________________________________________________________________
c. ___________________________________________________________________
d. ___________________________________________________________________
8. Can a person spread the virus if they do not have symptoms? _____________
From “Signs and Symptoms”
9. What is the average number of days before symptoms appear? ______________________________________
10. From the list of symptoms, which one do you think leads to death? _____________________________________
From “Treatment”
The mortality rate for those infected with Ebola is about 50%.
11. What are 2 interventions provided to improve chances of survival?
a. ______________________________________________________
b. ______________________________________________________

NAME(S): ___________________________________________________________________________ Period ________ Part 2: Modeling an Epidemic (How do scientists trace an epidemic?) Adapted from University of Florida Center for Precollegiate Education and Training: https://www.cpet.ufl.edu/resources/curricula/biomedical-curriculum-
series/ebola-epidemic/
1. Take a cup of liquid from your teacher.
2. When told to do so, find a partner and pour all the liquid from one cup into the other. Then pour half of the liquid
back so that both cups have the same amount they began with. This will simulate the exchange of fluids between 2
people and also the spread of infection (if one of you is infected). Repeat this step with 2 other partners. Record the
names of your 3 partners below:
Person 1: ____________________ Person 2: ______________________ Person 3: ______________________
3. Your teacher will provide you with a test strip to see if you are infected. This will simulate an antibody test that
might be given in the field to test a person for infection. Your teacher will show you both a POSITIVE CONTROL and a
NEGATIVE CONTROL.
What is the purpose of using both a Positive and a negative control in this experiment? _______________________
_______________________________________________________________________________________________
Take a picture of the Positive and negative control and insert it on the left. On the right, insert a picture of your result and
identify if you were infected:
POSITIVE CONTROL NEGATIVE CONTROL YOUR TEST Circle (INFECTED, NOT INFECTED)
How many people were infected? ______________ Could you determine the source? _________________
Name the suspected source(s): ________________________________________________________________________
On the left is some data from a sample groups of 25 that performed this lab using different numbers of exchanges. Graph this data
and draw a conclusion about the relationship between the number of exchanges and the number of infections:
Number of Exchanges Number of Infections GRAPH:
1 2
2 4
3 8
4 14
5 20
6 22
7 23
8 25
9 25
10 25
Conclusion: ________________________________________________________________________________________

NAME(S): ___________________________________________________________________________ Period ________
Part 3: Mapping an Epidemic (Trace a real epidemic from data)
Use the directions in the activity “Tracking an Epidemic” sheet. Your teacher will put you in groups to do the activity.
Taken From University of Florida Center for Precollegiate Education and Training: https://www.cpet.ufl.edu/resources/curricula/biomedical-curriculum-series/ebola-
epidemic/
Insert a picture of your completed map below
Questions:
1. When did the outbreak begin? _______________________ Where? ___________________________________
2. Who was patient Zero in this outbreak? ___________________________________
3. Based on your previous reading on page 1, how might the first patient have become infected?
___________________________________________________________________________________________
___________________________________________________________________________________________
4. Which patients were likely responsible for bringing the outbreak to each of the other cities? (Name at least 5 and include how they caught the disease, and to what city they brought the disease) ___________________________________________________________________________________________
___________________________________________________________________________________________
___________________________________________________________________________________________
___________________________________________________________________________________________
___________________________________________________________________________________________

NAME(S): ___________________________________________________________________________ Period ________ Part 4: Analyzing Data from an Epidemic
The following data table shows a breakdown of the number of Ebola cases from 1976 to 2014 according to the World
Health Organization. Use this data to answer the questions that follow:
Table copied June 2019 from: https://www.pbs.org/newshour/extra/app/uploads/2014/09/Ebola-outbreak-analyzing-the-data-worksheet.pdf
1. What percentage of all cases occurred in the Democratic Republic of Congo? _________________
2. Based on this data, what is the average fatality rate (# deaths/# cases) for the Democratic Republic of Congo? _______
3. In which year were there the most cases? _________ In which were there the most fatalities? ____________
4. Fill in the table below summarizing cases by region:
Region # of Cases Percentage of Cases
Congo
Democratic Republic of Congo
Gabon
Liberia-Guinea-Sierra Leone
South Africa
Sudan
Uganda
TOTAL: 100%
5. Create a Pie Chart that shows the overall PERCENTAGE of cases by region.

NAME(S): ___________________________________________________________________________ Period ________ In 2015, scientists had developed an experimental vaccine. Although it does not have FDA approval yet, scientists
received approval from the National Regulatory Authority of DRC and the Ethics Review Committee of the Ecole de
Santé Pùblique in Kinshasa to use this vaccine (rVSV-ZEBOV). They used a ring vaccination method. This entailed
vaccinating contacts and contacts of contacts of the infected as well as health care workers who were treated infected
people. Watch the video on Ring Vaccination from the WHO: https://www.youtube.com/watch?v=4dL1kqLLXbw
What is the purpose of using the ring vaccination method? (rather than mass vaccinations?)
__________________________________________________________________________________________________
__________________________________________________________________________________________________
In order to conduct a true controlled experiment, what should have been the negative control group?
__________________________________________________________________________________________________
Scientists modified the control group in this experiment. They vaccinated some in the ring immediately and then
vaccinated the rest 21 days later. Why do you think scientists made this decision (based on what you know about
Ebola)?
__________________________________________________________________________________________________
__________________________________________________________________________________________________
In 2018, there was another outbreak of Ebola in the Democratic Republic of Congo.
The table below shows Confirmed and probable Ebola virus disease cases, and number of health areas affected, by health zone, North
Kivu and Ituri provinces, Democratic Republic of the Congo, data as of 14 May 14, 2019 according to the World Health Organization.
Data taken June 2019 from: https://www.who.int/csr/don/16-may-2019-ebola-drc/en/ Map: https://www.cdc.gov/vhf/ebola/outbreaks/drc/east-drc-map.html
1. Based on this table, what percentage of confirmed cases came from North Kivu? _____ Ituri? ______
2. What is the average mortality rate for confirmed cases in North Kivu? ___________
3. What is the average mortality rate for confirmed cases in Ituri? ___________

NAME(S): ___________________________________________________________________________ Period ________ Ring Vaccination protocol was initiated and continues in the Republic of Congo. Unfortunately, although this vaccine is
over 95% effective, people are not getting the vaccine they need. Why isn’t everyone getting vaccinated? Read the
articles in the 2 attached websites and explain in 5-6 sentences the barriers to vaccination:
https://www.npr.org/sections/goatsandsoda/2019/04/23/716121928/the-doctor-killed-in-fridays-ebola-attack-was-
dedicated-but-also-afraid
https://www.washingtonpost.com/news/to-your-health/wp/2018/05/22/a-new-ebola-vaccine-could-help-stop-an-
epidemic-but-faces-enormous-obstacles-in-crucial-test/?noredirect=on&utm_term=.bcbf57399719
Give at least 4 reasons why not everyone is getting vaccinated: At least one should come from EACH article!
__________________________________________________________________________________________________
__________________________________________________________________________________________________
__________________________________________________________________________________________________
__________________________________________________________________________________________________
__________________________________________________________________________________________________
__________________________________________________________________________________________________

Name: _________________________________________
7
Part 3: Tracking an Epidemic
Epidemiology is the study of the distribution and determinants of health problems in specified populations and the application of that information to control health problems. In other words, epidemiology is the study of health problems—specifically who they affect, what factors play a role in getting a disease and how to contain it. It is the scientific method of problem-solving used by "disease detectives," which includes epidemiologists, laboratory scientists, statisticians, physicians and other health care providers, and public health professionals. These professionals work to get to the root of health problems in a community, solving issues that range from a measles outbreak on a small college campus to a global influenza pandemic, an increase in homicide in a single community to a national surge in violence, or a localized to widespread rise in cancer.
Like investigators at the scene of a crime, disease detectives begin by looking for clues. They systematically gather information about what happened, asking questions like: who is sick? What are their symptoms? When did they get sick? Where could they have been exposed to the illness? Using statistical analysis, investigators study the answers to these questions to find out how a particular health problem entered a community. The Epidemiological Triangle is a model that scientists have developed to understand infectious diseases and how they spread is the Epidemiological Triangle. The triangle has three corners (vertices):
Agent, or microbe that caused the disease (the “what” of the triangle)
Host, or organism harboring the disease (the “who” of the triangle)
Environment, or external factors contributing to disease transmission (the “where” of the triangle) The mission of an epidemiologist is to break at least one side of the triangle, disrupting the connection between the agent, the host, and the environment, and stopping the continuation of the disease.
Instructions In the previous section of this lesson, you modeled an outbreak of infectious disease. In this portion, you will act
as a disease detective, using patient epidemiological reports provided by healthcare workers active on-scene, to track the current outbreak of Ebola Zaire in Guinea to its origin. Each group will be given 2-3 patient records. Based on the information provided, each group will:
1. Determine the chronology of the outbreak in Guinea. Using the chart below, indicate the date and patient case
number on the flag as shown on the sample here.
Date of Onset or Date of Patient Sample Flag color to use on Ebola Timeline
December 2013 Red
January 2014 Yellow
February 2014 Green
March 2014 Blue
2. Once you have a flag for each patient, place the flags in the correct location on the large wall map of Guinea.
For patients that are deceased, label the map with the flags at the location of death
12/13, 01101

Ebola Epidemic: Teacher Pages
Summary
This lesson engages students in a series of inquiry-based activities providing information on the current outbreak of Ebola in West Africa, including: a jigsaw activity using resources from the Centers for Disease Control, a simulation based on fluid exchange to model the spread of an outbreak of an infectious disease, and a “disease detective”-style mapping activity based on published data outlining the start of the current Ebola outbreak in Guinea.
Time Estimate
Two ~45 minute class periods; alternatively, the jigsaw portion can be given as a homework assignment, in which case the Modeling/Tracking an Outbreak components can fit into one class period.
Learning Styles
Visual, kinesthetic, and auditory
Vocabulary
Agent: a microbe that causes a disease (“what” of the Epidemiological Triangle)
Endemic: an outbreak of disease affecting a population or location at consistent levels and for consistent periods of time
Environment: external factors that cause or allow transmission of a disease (“where” of the Epidemiological Triangle)
Epidemic: an outbreak of disease affecting a disproportionately high number of individuals at a given time
Epidemiology: branch of science dealing with the spread and control of disease throughout populations or systems
Host: an organism harboring a disease (“who” of the Epidemiological Triangle)
Index Case: the initial patient in a population of an epidemiological investigation; also referred to as Patient Zero
Outbreak: an occurrence of disease greater than would otherwise be expected at a particular time or place
Pandemic: an epidemic that occurs over a wide area, such as over multiple continents or across the whole world
Spillover Event: Occurs when a reservoir population causes an epidemic in a novel host population. The epidemic is transmitted by the reservoir population and not the host population
Student Learning Outcomes The student will be able to:
x Describe the following for Ebola Virus Disease: symptoms, sources and risk factors, diagnosis and detection, treatment, prevention and control.
x Simulate the spread of an infectious disease x Analyze and graph data, determining dependent and independent variables x Describe the Epidemiological Triangle: agent, host, and environment x Describe how epidemiologists think about the origins and spread of infectious disease
THIS PAGE TAKEN FROM CPET ACTIVITY KEY - INCLUDES VOCABULARY DEFINITIONS. NOTE TIME ESTIMATE FOR MY ACTIVITY IS DIFFERENT.

Epidemiological Report Patient Summary
Case Number: 01101 Age:20 Gender: Female Hospital: Guéckédou Sample Date: March 12 Symptoms: Fever, diarrhea, vomiting Outcome: Deceased, March 18 Laboratory Confirmation: Y
Epidemiological Report Patient Summary
Case Number: 01102 Age:25 Gender: Female Hospital: Guéckédou Sample Date: March 13 Symptoms: Fever, diarrhea, vomiting Outcome: Deceased, March 25 Laboratory Confirmation: Y
Epidemiological Report Patient Summary
Case Number: 01103 Age:35 Gender: Female Hospital: Guéckédou Sample Date: March 13 Symptoms: Fever, vomiting Outcome: Deceased, March 17 Laboratory Confirmation: Y
Epidemiological Report Patient Summary
Case Number: 01104 Age:25 Gender: Female Hospital: Guéckédou Sample Date: March 18 Symptoms: Fever, diarrhea, vomiting, hemorrhage Outcome: Deceased, March 18 Laboratory Confirmation: Y
Epidemiological Report Patient Summary
Case Number: 01105 Age:16 Gender: Female Hospital: Guéckédou Sample Date: March 19 Symptoms: Miscarriage Outcome: Survived Laboratory Confirmation: Y
Epidemiological Report Patient Summary
Case Number: 01106 Age:27 Gender: Female Hospital: Guéckédou Sample Date: March 20 Symptoms: Fever, diarrhea, vomiting Outcome: Deceased, Date unknown Laboratory Confirmation: Y
Epidemiological Report Patient Summary
Case Number: 01107 Age: 47 Gender: Female Hospital: Guéckédou Sample Date: March 20 Symptoms: Fever, diarrhea, vomiting Outcome: Deceased, March 22 Laboratory Confirmation: Y
Epidemiological Report Patient Summary
Case Number: 01108 Age: 29 Gender: Male Hospital: Macenta Sample Date: March 16 Symptoms: Fever, hemorrhage Outcome: Deceased, March 16 Laboratory Confirmation: Y
Epidemiology Reports for Patients - Taken from CPET Activity. Copies need to be made for each group.

Epidemiological Report Patient Summary
Case Number: 01109 Age: 55 Gender: Female Hospital: Macenta Sample Date: March 16 Symptoms: Fever, diarrhea, vomiting Outcome: Deceased, March 19 Laboratory Confirmation: Y
Epidemiological Report Patient Summary
Case Number: 01110 Age: 17 Gender: Male Hospital: Macenta Sample Date: March 16 Symptoms: Fever, diarrhea, vomiting Outcome: Unknown Laboratory Confirmation: Y
Epidemiological Report Patient Summary
Case Number: 01111 Age: 7 Gender: Male Hospital: Macenta Sample Date: Unknown Symptoms: Fever, diarrhea, vomiting Outcome: Deceased, March 26 Laboratory Confirmation: Y
Epidemiological Report Patient Summary
Case Number: 01112 Age: 30 Gender: Male Hospital: Macenta Sample Date: February 28 Symptoms: Fever, vomiting Outcome: Deceased, February 28 in Nzérékoré Laboratory Confirmation: Y
Epidemiological Report Patient Summary
Case Number: 01113 Age: 50 Gender: Male Hospital: Macenta Sample Date: March 12 Symptoms: Fever, diarrhea, vomiting Outcome: Deceased, March 12 Laboratory Confirmation: Y
Epidemiological Report Patient Summary
Case Number: 01114 Age: 41 Gender: Male Hospital: Macenta Sample Date: March 13 Symptoms: Fever, diarrhea, vomiting, hemorrhage Outcome: Deceased, March 16 in Nzérékoré Laboratory Confirmation: Y
Epidemiological Report Patient Summary
Case Number: 01115 Age: 28 Gender: Female Hospital: Kissidougou Sample Date: March 17 Symptoms: Fever, diarrhea, vomiting, hemorrhage Outcome: Survived Laboratory Confirmation: Y

Epidemiological Report Patient Summary
Case Number: 02101 Village: Meliandou, Guéckédou Symptoms: Fever, black stool, vomiting Onset: December 2, 2013 Outcome: Deceased, December 6 Investigation Details: Male Child, Age 2
Epidemiological Report Patient Summary
Case Number: 02102 Village: Meliandou, Guéckédou Symptoms: Fever, black stool, vomiting Onset: December 25, 2013 Outcome: Deceased, December 29 Investigation Details: Age 3, sister of patient 02101
Epidemiological Report Patient Summary
Case Number: 02103 Gender: Female Village: Meliandou, Guéckédou Symptoms: Bleeding Onset: Unknown Outcome: Deceased, December 13 Investigation Details: Mother of patients 02101 and 02102
Epidemiological Report Patient Summary
Case Number: 02104 Gender: Female Village: Meliandou, Guéckédou Symptoms: Fever, diarrhea, vomiting Onset: Unknown Outcome: Deceased, January 1 Investigation Details: Grandmother of patients 02101 and 02101
Epidemiological Report Patient Summary
Case Number: 02105 Gender: Female Village: Meliandou, Guéckédou Symptoms: Fever, diarrhea, vomiting Onset: January 29, 2014 Outcome: Deceased, February 2 Investigation Details: Nurse
Epidemiological Report Patient Summary
Case Number: 02106 Gender: Female Village: Meliandou, Guéckédou Symptoms: Fever, diarrhea, vomiting Onset: January 25, 2014 Outcome: Deceased, February 2 Investigation Details: Village Midwife
Epidemiological Report Patient Summary
Case Number: 02107 Gender: Female Village: Dawa, Guéckédou Symptoms: Fever, diarrhea, vomiting, hemorrhage Onset: January 20, 2014 Outcome: Deceased, January 26 Investigation Details: Sister of patient 02104
Epidemiological Report Patient Summary
Case Number: 02108 Gender: Female Village: Dawa, Guéckédou Symptoms: Fever, bleeding Onset: January 25, 2014 Outcome: Deceased, January 30 Investigation Details: Attended funeral of patient 02104

Epidemiological Report Patient Summary
Case Number: 02109 Symptoms: Fever, hemorrhage Onset: February 28, 2014 Outcome: Deceased, exact date unknown Investigation Details: Friend of patient 02106; died in Kaliahun, Sierra Leone
Epidemiological Report Patient Summary
Case Number: 02110 Symptoms: Fever, vomiting, diarrhea Onset: Unknown Outcome: Deceased, February 1 Investigation Details: Nephew of patient 02106; died in Conakry, Guinea
Epidemiological Report Patient Summary
Case Number: 02112 Village: Baladou District, Guéckédou Symptoms: Fever, diarrhea, hemorrhage Onset: February 28, 2014 Outcome: Deceased, March 12 Investigation Details: Trader by occupation; traveled to Loffa County, Liberia prior to death
Epidemiological Report Patient Summary
Case Number: 02113 Village: Pombo, Guéckédou Symptoms: Fever, hemorrhage Onset: February 4, 2014 Outcome: Deceased, February 11 Investigation Details: Family member of patient 02106
Epidemiological Report Patient Summary
Case Number: 02114 Village: Pombo, Guéckédou Symptoms: Fever, vomiting, diarrhea Onset: February 5, 2014 Outcome: Deceased, February 10 Investigation Details: Related to patient 01107. Health care worker at Guéckédou hospital; died in Macenta
Epidemiological Report Patient Summary
Case Number: 02115 Symptoms: Vomiting, bleeding, hiccups Onset: February 19, 2014 Outcome: Deceased, February 24 Investigation Details: Doctor of patient 02114 at Macenta hospital. Funeral took place in Kissidigou
Epidemiological Report Patient Summary
Case Number: 02116 Symptoms: Fever, vomiting Onset: February 24, 2014 Outcome: Deceased, March 7 Investigation Details: Brother of patient 02115
Epidemiological Report Patient Summary
Case Number: 02117 Symptoms: Fever, vomiting, hiccups Onset: February 24, 2014 Outcome: Deceased, March 8
Investigation Details: Brother of patient 02115
NAME(S): ___________________________________________________________________________ Period ________ A “Method” to the Madness: Analyzing the Ebola Epidemic
Part 1: What is Ebola and how is it spread?
Watch video: https://www.youtube.com/watch?v=UMMwgvLmN-M (Your teacher may show this video to the class as a group)
Go to the following Website to answer the questions that follow. Also click on the Ecology graphic on the right of the webpage to help answer the questions. https://www.cdc.gov/vhf/ebola/about.html
From “What is Ebola Virus Disease”:
1. How many viruses are in the genus Ebolavirus? ____________ How many cause disease in humans? __________
From “History of Ebola Virus Disease”
2. Where did the name “Ebola” come from? ___________________________________
3. Originally, there were 2 outbreaks in different locations and scientists thought the outbreaks were associated with
one infected person who traveled to both locations. What evidence supported that the outbreaks came from two
different sources? ______________________________________________________________________________
4. When it comes to viruses, what is a “reservoir”? ______________________________________________________
5. What animal do they believe might be the reservoir for Ebola? ________________________________________
6. How was the virus transmitted during the first outbreak in Zaire? ______________________________________
From “Transmission”
7. Name 4 different ways the virus can be spread:
a. ___________________________________________________________________
b. ___________________________________________________________________
c. ___________________________________________________________________
d. ___________________________________________________________________
8. Can a person spread the virus if they do not have symptoms? _____________
From “Signs and Symptoms”
9. What is the average number of days before symptoms appear? ______________________________________
10. From the list of symptoms, which one do you think leads to death? _____________________________________
From “Treatment”
The mortality rate for those infected with Ebola is about 50%.
11. What are 2 interventions provided to improve chances of survival? a. ______________________________________________________
b. ______________________________________________________
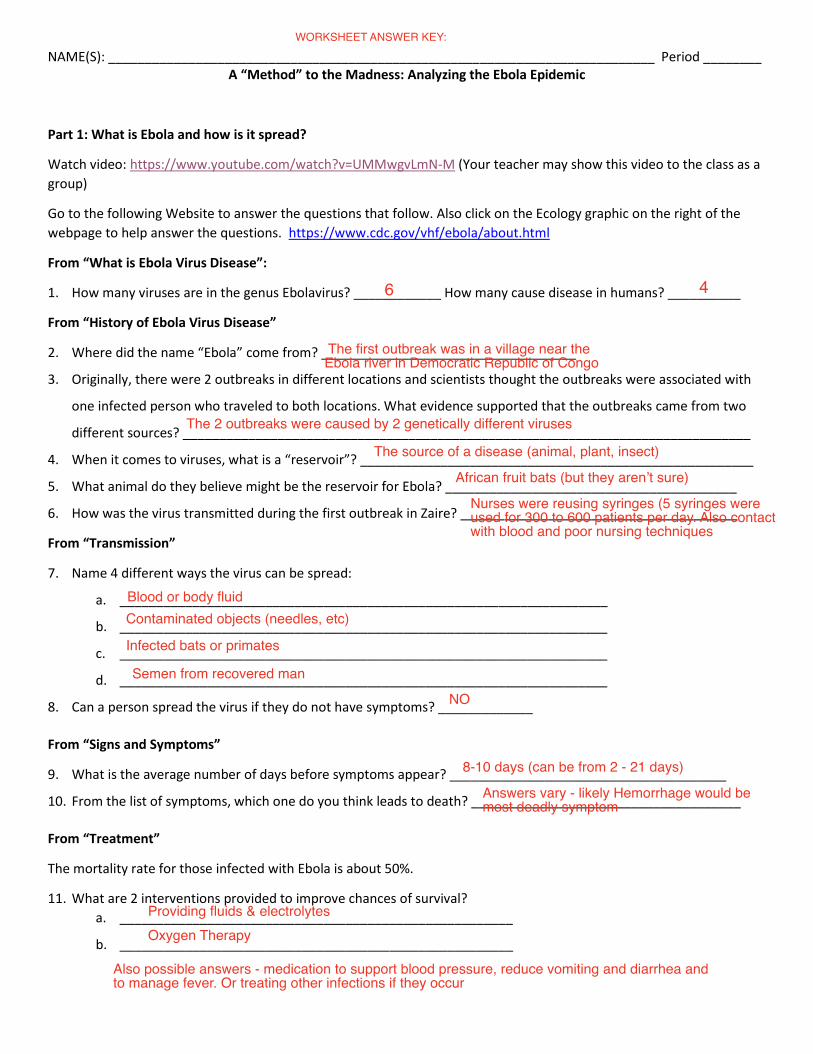
WORKSHEET ANSWER KEY:
6 4
The first outbreak was in a village near the Ebola river in Democratic Republic of Congo
The 2 outbreaks were caused by 2 genetically different viruses
The source of a disease (animal, plant, insect)
African fruit bats (but they aren’t sure)
Nurses were reusing syringes (5 syringes were used for 300 to 600 patients per day. Also contact with blood and poor nursing techniques
Blood or body fluid
Infected bats or primates
Contaminated objects (needles, etc)
Semen from recovered man
NO
8-10 days (can be from 2 - 21 days)
Answers vary - likely Hemorrhage would be most deadly symptom
Providing fluids & electrolytesOxygen Therapy
Also possible answers - medication to support blood pressure, reduce vomiting and diarrhea and to manage fever. Or treating other infections if they occur

NAME(S): ___________________________________________________________________________ Period ________ Part 2: Modeling an Epidemic (How do scientists trace an epidemic?) Adapted from University of Florida Center for Precollegiate Education and Training: https://www.cpet.ufl.edu/resources/curricula/biomedical-curriculum-series/ebola-epidemic/
1. Take a cup of liquid from your teacher. 2. When told to do so, find a partner and pour all the liquid from one cup into the other. Then pour half of the liquid
back so that both cups have the same amount they began with. This will simulate the exchange of fluids between 2 people and also the spread of infection (if one of you is infected). Repeat this step with 2 other partners. Record the names of your 3 partners below:
Person 1: ____________________ Person 2: ______________________ Person 3: ______________________
3. Your teacher will provide you with a test strip to see if you are infected. This will simulate an antibody test that might be given in the field to test a person for infection. Your teacher will show you both a POSITIVE CONTROL and a NEGATIVE CONTROL.
What is the purpose of using both a Positive and a negative control in this experiment? _______________________
_______________________________________________________________________________________________
Take a picture of the Positive and negative control and insert it on the left. On the right, insert a picture of your result and identify if you were infected:
POSITIVE CONTROL NEGATIVE CONTROL YOUR TEST Circle (INFECTED, NOT INFECTED)
How many people were infected? ______________ Could you determine the source? _________________
Name the suspected source(s): ________________________________________________________________________
On the left is some data from a sample groups of 25 that performed this lab using different numbers of exchanges. Graph this data and draw a conclusion about the relationship between the number of exchanges and the number of infections:
Number of Exchanges Number of Infections GRAPH: 1 2 2 4 3 8 4 14 5 20 6 22 7 23 8 25 9 25
10 25
Conclusion: ________________________________________________________________________________________
25
zo x
toS o
I l l l l l l l l l2 4 6 8 10
ANSWERS VARY
Positive control shows what a positive test will look like and shows the test paper works - negative shows what negative will look like & again confirms test paper works.
SHOULD BE BLUE SHOULD BE YELLOW/GREEN
Answers vary but if picture is positive they should have circled INFECTED and if negative they should circle NOT INFECTED
Answers vary Usually students can get it down to 2 people
The more exchanges, the higher the number of infections# of exchanges
# infections
Exchanges vs. Number of Infections

Name: _________________________________________
7
Part 3: Tracking an Epidemic
Epidemiology is the study of the distribution and determinants of health problems in specified populations and the application of that information to control health problems. In other words, epidemiology is the study of health problems—specifically who they affect, what factors play a role in getting a disease and how to contain it. It is the scientific method of problem-solving used by "disease detectives," which includes epidemiologists, laboratory scientists, statisticians, physicians and other health care providers, and public health professionals. These professionals work to get to the root of health problems in a community, solving issues that range from a measles outbreak on a small college campus to a global influenza pandemic, an increase in homicide in a single community to a national surge in violence, or a localized to widespread rise in cancer.
Like investigators at the scene of a crime, disease detectives begin by looking for clues. They systematically gather information about what happened, asking questions like: who is sick? What are their symptoms? When did they get sick? Where could they have been exposed to the illness? Using statistical analysis, investigators study the answers to these questions to find out how a particular health problem entered a community. The Epidemiological Triangle is a model that scientists have developed to understand infectious diseases and how they spread is the Epidemiological Triangle. The triangle has three corners (vertices):
x Agent, or microbe that caused the disease (the “what” of the triangle) x Host, or organism harboring the disease (the “who” of the triangle) x Environment, or external factors contributing to disease transmission (the “where” of the triangle)
The mission of an epidemiologist is to break at least one side of the triangle, disrupting the connection between the agent, the host, and the environment, and stopping the continuation of the disease.
Instructions In the previous section of this lesson, you modeled an outbreak of infectious disease. In this portion, you will act
as a disease detective, using patient epidemiological reports provided by healthcare workers active on-scene, to track the current outbreak of Ebola Zaire in Guinea to its origin. Each group will be given 2-3 patient records. Based on the information provided, each group will:
1. Determine the chronology of the outbreak in Guinea. Using the chart below, indicate the date and patient case number on the flag as shown on the sample here.
Date of Onset or Date of Patient Sample Flag color to use on Ebola Timeline December 2013 Red
January 2014 Yellow February 2014 Green
March 2014 Blue
2. Once you have a flag for each patient, place the flags in the correct location on the large wall map of Guinea. For patients that are deceased, label the map with the flags at the location of death
12/13, 01101
INSTRUCTIONS FOR PART 3 - TAKEN FROM CPET ACTIVITY (COPIES SHOULD BE PROVIDED TO STUDENTS!)
LINK for MAP to print: https://www.un.org/Depts/Cartographic/map/profile/guinea.pdf

NAME(S): ___________________________________________________________________________ Period ________ Part 3: Mapping an Epidemic (Trace a real epidemic from data)
Use the directions in the activity “Tracking an Epidemic” sheet. Your teacher will put you in groups to do the activity.
Taken From University of Florida Center for Precollegiate Education and Training: https://www.cpet.ufl.edu/resources/curricula/biomedical-curriculum-series/ebola-epidemic/
Insert a picture of your completed map below
Questions:
1. When did the outbreak begin? _______________________ Where? ___________________________________
2. Who was patient Zero in this outbreak? ___________________________________
3. Based on your previous reading on page 1, how might the first patient have become infected?
___________________________________________________________________________________________
___________________________________________________________________________________________
4. Which patients were likely responsible for bringing the outbreak to each of the other cities? (Name at least 5 and include how they caught the disease, and to what city they brought the disease) ___________________________________________________________________________________________
___________________________________________________________________________________________
___________________________________________________________________________________________
___________________________________________________________________________________________
___________________________________________________________________________________________
SAMPLE PICTURE FROM CPET
December 2013 Gueckedou
Patient 02101 Two year old boy
Answers may vary - likely bitten by bat or came in contact with infected animal or food contaminated by animal body fluids
02115 was doctor of patient 02114 and went to Kissidigou for funeral
01112 and 01114 were patients at Macenta hospital but went to N’Zérekore
02109 was friend of patient 02106 and brought disease to Kaliahun
02110 was nephew of 02106 and brought disease to Conakry
02114 was Healthcare worker at hospital and relative of 01107 brought disease to Macenta
POSSIBLE ANSWERS INCLUDE:

NAME(S): ___________________________________________________________________________ Period ________ Part 4: Analyzing Data from an Epidemic
The following data table shows a breakdown of the number of Ebola cases from 1976 to 2014 according to the World Health Organization. Use this data to answer the questions that follow:
Table copied June 2019 from: https://www.pbs.org/newshour/extra/app/uploads/2014/09/Ebola-outbreak-analyzing-the-data-worksheet.pdf
1. What percentage of all cases occurred in the Democratic Republic of Congo? _________________
2. Based on this data, what is the average fatality rate (# deaths/# cases) for the Democratic Republic of Congo? _______
3. In which year were there the most cases? _________ In which were there the most fatalities? ____________
4. Fill in the table below summarizing cases by region:
Region # of Cases Percentage of Cases Congo Democratic Republic of Congo Gabon Liberia-Guinea-Sierra Leone South Africa Sudan Uganda
TOTAL: 100%
5. Create a Pie Chart that shows the overall PERCENTAGE of cases by region.
M 23
if I 38.4
38.4%
Total cases: 2570DRC Cases: 987DRC Deaths: 765
77.5%
1976 1976
98771
117
NOTE: They must combine 2 countries to get this year as answer.
4531
335606
2570
2.8%38.4%
4.6%17.6%0.4%13%23.6%
Answers may vary slightly depending on rounding!
SAMPLE:Color coded to country above
Percentage of Ebola Cases by Region

NAME(S): ___________________________________________________________________________ Period ________ In 2015, scientists had developed an experimental vaccine. Although it does not have FDA approval yet, scientists received approval from the National Regulatory Authority of DRC and the Ethics Review Committee of the Ecole de Santé Pùblique in Kinshasa to use this vaccine (rVSV-ZEBOV). They used a ring vaccination method. This entailed vaccinating contacts and contacts of contacts of the infected as well as health care workers who were treated infected people. Watch the video on Ring Vaccination from the WHO: https://www.youtube.com/watch?v=4dL1kqLLXbw
What is the purpose of using the ring vaccination method? (rather than mass vaccinations?)
__________________________________________________________________________________________________
__________________________________________________________________________________________________
In order to conduct a true controlled experiment, what should have been the negative control group?
__________________________________________________________________________________________________
Scientists modified the control group in this experiment. They vaccinated some in the ring immediately and then vaccinated the rest 21 days later. Why do you think scientists made this decision (based on what you know about Ebola)?
__________________________________________________________________________________________________
__________________________________________________________________________________________________
In 2018, there was another outbreak of Ebola in the Democratic Republic of Congo.
The table below shows Confirmed and probable Ebola virus disease cases, and number of health areas affected, by health zone, North Kivu and Ituri provinces, Democratic Republic of the Congo, data as of 14 May 14, 2019 according to the World Health Organization.
Data taken June 2019 from: https://www.who.int/csr/don/16-may-2019-ebola-drc/en/ Map: https://www.cdc.gov/vhf/ebola/outbreaks/drc/east-drc-map.html
1. Based on this table, what percentage of confirmed cases came from North Kivu? _____ Ituri? ______
2. What is the average mortality rate for confirmed cases in North Kivu? ___________
3. What is the average mortality rate for confirmed cases in Ituri? ___________
This treats the most likely people to become infected and therefore protects the others. It may not be feasible to vaccinate everyone, particularly if the vaccine is not FDA approved yet - but we can vaccinate those most at risk to stop they spread.
A group not given any treatment or given a placebo.
This would be more humane since Ebola is deadly.
90.6%. 9.4%
57.4%
1496
155 89
970
64.8%

NAME(S): ___________________________________________________________________________ Period ________ Ring Vaccination protocol was initiated and continues in the Republic of Congo. Unfortunately, although this vaccine is over 95% effective, people are not getting the vaccine they need. Why isn’t everyone getting vaccinated? Read the articles in the 2 attached websites and explain in 5-6 sentences the barriers to vaccination:
https://www.npr.org/sections/goatsandsoda/2019/04/23/716121928/the-doctor-killed-in-fridays-ebola-attack-was-dedicated-but-also-afraid
https://www.washingtonpost.com/news/to-your-health/wp/2018/05/22/a-new-ebola-vaccine-could-help-stop-an-epidemic-but-faces-enormous-obstacles-in-crucial-test/?noredirect=on&utm_term=.bcbf57399719
Give at least 4 reasons why not everyone is getting vaccinated: At least one should come from EACH article!
__________________________________________________________________________________________________
__________________________________________________________________________________________________
__________________________________________________________________________________________________
__________________________________________________________________________________________________
__________________________________________________________________________________________________
__________________________________________________________________________________________________
Health care workers are in danger of being shot by the civil unrest in the area & can’t 1.get to patients due to this limitation
2. Bad roads & no electricity
3. High temperatures make it hard to keep the vaccine stable
4. Lack of trust in the community
5. Poor people who don’t seek medical care for themselves or their children
6. Side effects of medication
7. People can’t afford to miss work (miss pay) in order too receive treatment
Analyzing the Ebola Epidemic
Cristin Calder
AP Biology
Archbishop McCarthy HS

Purpose/Rationale • In AP Biology, students must be able to analyze parts of an experiment,
perform calculations from data, and make and read tables and graphs
• This activity has students apply the scientific method in the context of a real-world problem – the Ebola epidemic(s) in Africa
• In the past, I used fake data and experiments as examples of the scientific method. In this unit, I can introduce students to real data on a relevant topic so they can see how the scientific method is applied in the field.
• Students will be able to: • Model an Epidemic
• Trace an Epidemic to its source
• Identify the parts of the experiment
• Distinguish between positive and negative control groups
• Analyze data and create graphs to represent data
• Describe the limits of science in real situations
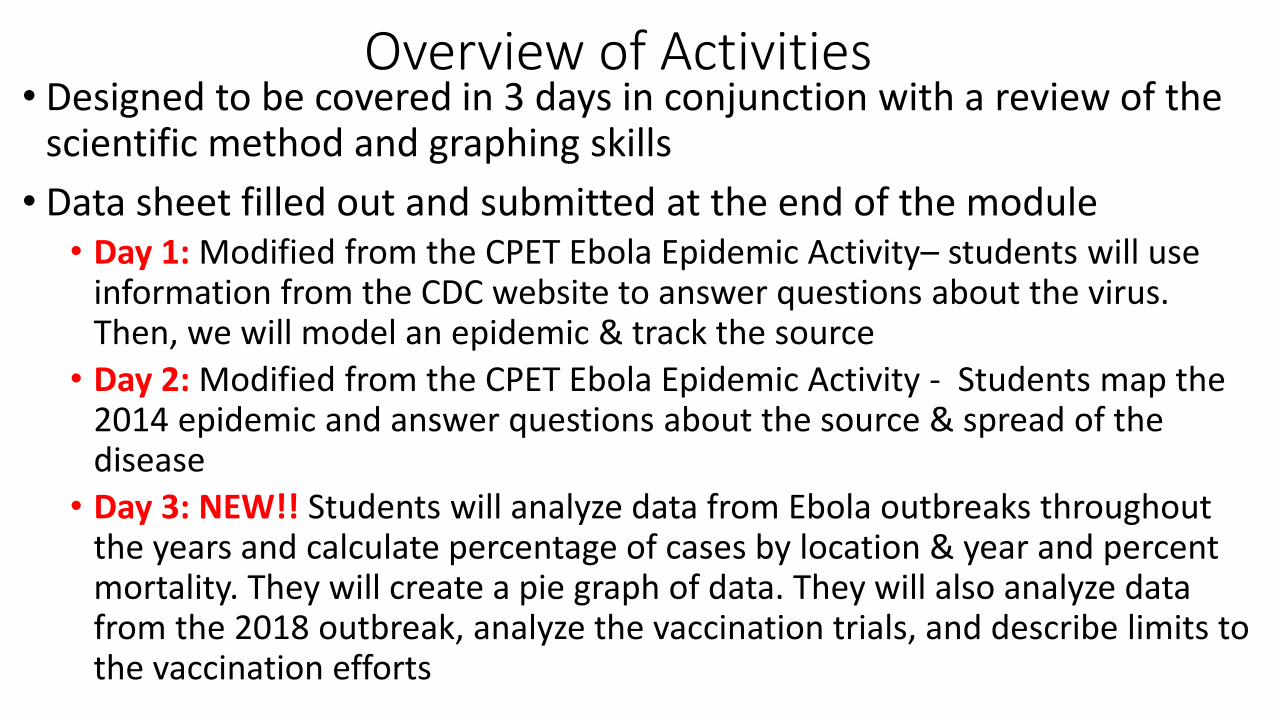
Overview of Activities • Designed to be covered in 3 days in conjunction with a review of the
scientific method and graphing skills
• Data sheet filled out and submitted at the end of the module • Day 1: Modified from the CPET Ebola Epidemic Activity– students will use
information from the CDC website to answer questions about the virus. Then, we will model an epidemic & track the source
• Day 2: Modified from the CPET Ebola Epidemic Activity - Students map the 2014 epidemic and answer questions about the source & spread of the disease
• Day 3: NEW!! Students will analyze data from Ebola outbreaks throughout the years and calculate percentage of cases by location & year and percent mortality. They will create a pie graph of data. They will also analyze data from the 2018 outbreak, analyze the vaccination trials, and describe limits to the vaccination efforts

Example of skills for Part 3:
Region # of Cases Percentage of Cases
Congo
Democratic Republic of Congo
Gabon
Liberia-Guinea-Sierra Leone
South Africa
Sudan
Uganda
TOTAL: 100%
They must break down the cases by region and calculate percentage from each region. Then they must make a pie graph of the data. They also have to answer questions about which year has most cases, which location has highest mortality rate, etc.
The vaccine trials are then presented & students ID discuss the ring vaccination and modified control group rationale. They finish by reading articles on the problems faced trying to get vaccine to people.