a measure of success - hfmamd.org · challenges inherent in the transformation of the payment model...
TRANSCRIPT

A Measure of SuccessUsing KPIs to Accelerate Revenue
Cycle Performance
Sandy Richman, Director of Advisory Services
Daniel Bergantz, Director of Advisory Services
PNC Healthcare
March 23, 2015

Today’s Presentation Goals
1. Review current factors affecting the hospital industry and revenue cycle environment
2. Developing and reporting Key Performance Indicators (KPIs)
3. Interpreting the value of selected KPIs
4. How to be MAD about Revenue Cycle Management
5. Learn something new and have fun!!!
1

CURRENT INDUSTRY FACTORS
2
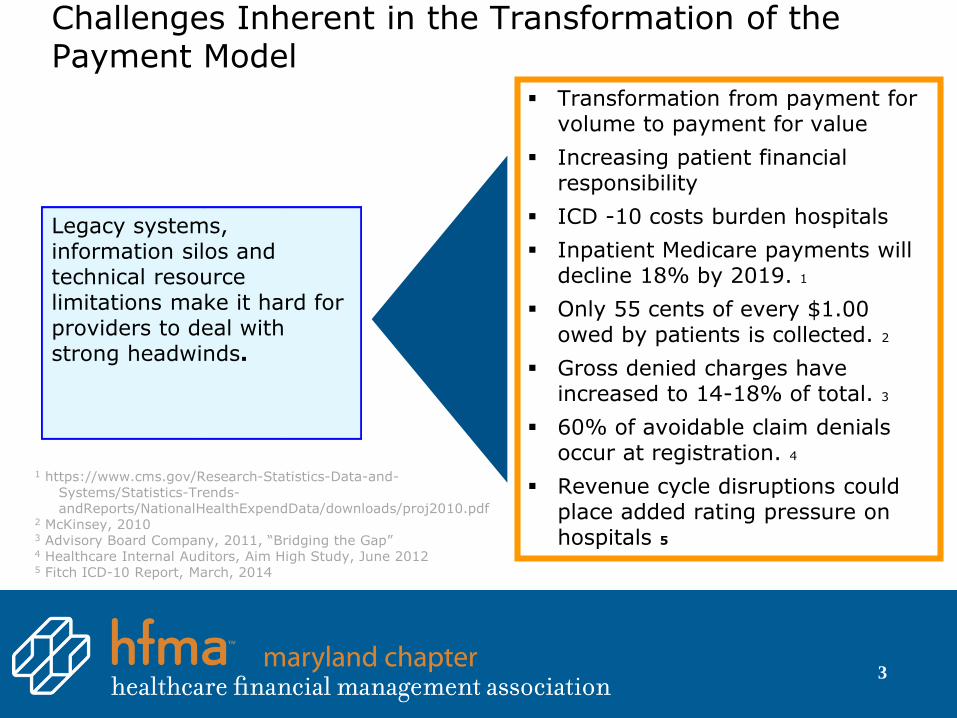
Challenges Inherent in the Transformation of the Payment Model
Transformation from payment for volume to payment for value
Increasing patient financial responsibility
ICD -10 costs burden hospitals
Inpatient Medicare payments will decline 18% by 2019. 1
Only 55 cents of every $1.00 owed by patients is collected. 2
Gross denied charges have increased to 14-18% of total. 3
60% of avoidable claim denials occur at registration. 4
Revenue cycle disruptions could place added rating pressure on hospitals 5
Legacy systems, information silos and technical resource limitations make it hard for providers to deal with strong headwinds.
1 https://www.cms.gov/Research-Statistics-Data-and-Systems/Statistics-Trends-andReports/NationalHealthExpendData/downloads/proj2010.pdf
2 McKinsey, 20103 Advisory Board Company, 2011, “Bridging the Gap”4 Healthcare Internal Auditors, Aim High Study, June 20125 Fitch ICD-10 Report, March, 2014
3

ICD-10 What to Consider to Protect Your Revenue Cycle
Post implementation impactsCosts to prepare
Costs and shortages of qualified coding specialists
Initial direct and indirect costs of conversion and compliance preparation
Direct and opportunity costs of systems integration, testing, IT staff
Updating the chargemaster, super bill, etc.
Identifying specialties requiring the greatest change/impact
ROI of additional training, mitigating negative impact through process change
Error rates are expected to jump to 6-10% of total claims from current 3% *
Days in AR are projected to grow 20-40% *
Claim denials are projected to increase 100-200% for 2 years or more *
Under-coding likely to have most significant negative impact on revenue
4
Source: 2011 HIMSS ICD-10 Transformation: Five Critical Risk Mitigation Strategies

WHAT IS ALL THIS TALK OFHEALTHCARE CONSUMERISM?
5

Employers/Payers Shifting Responsibility to Consumers
• Ever increasing strategy is for employers to shift costs to the consumer by offering high deductible health plans (HDHPs) and health savings accounts (HSAs)
• In 2013, about 58% of employers offered a HDHP
• Hospital uncompensated care rose to a record $45.9 billion in 2013
• Out-of-pocket payments by insured patients are expected to grow by 68% from 2009 to 2015
• Increasing HDHPs = Increasing patient financial responsibility = Consumer behavior
6

Healthcare Consumerism is a movement giving the participant purchasing power that promotes decision-making in their own healthcare. It empowers the consumer to become more educated and involved in decisions like what physician they want to see, what procedures they want to have done, what facility they want to go to, and how much they are willing to pay for services.
Healthcare Consumerism
7

“Cashification” of Healthcare
• With HDHPs and HSAs, consumers’ financial responsibility for their medical treatment is increasing
• Trends are moving toward employers only offering HDHP options
• Consumers usually don’t plan on ever hitting their deductibles
• Behavior is modified to save $$$$
8

Effects on Hospital Providers
• Increased pressure to update/acquire technologies and processes to help consumers understand their out-of-pocket costs prior to service and provide options to pay in an easy and timely manner
• Increased consumer pressure for pricing transparency
• Increased competition from less costly, more agile and easily accessible delivery channels, potentially putting market share at risk
9

And now…a Demotivational Thought
10

The Problem
• Sometimes our meetings consist of “a lot of talking as if it’s business as usual.”
• In Healthcare there is “a lot of experience around the table.”
• We sometimes think we know what the problem is but we often are not even looking at the real problem.
11

Developing KPIs
• What to measure?
– Don’t just collect data, Data ≠ Information
– Metrics aren’t KPIs
– KPIs help staff make better business decisions and find solutions to problems
– Choose KPIs according to relevancy
– Apply KPIs where you can affect change
– Develop indicators for each process at the department/ functional level as well as overall RCM indicators
12
Important decisions will be made based on KPIs. Choose them wisely!

Developing KPIs
• Define how to measure selected KPIs (i.e., operational definition)
– A precise description of the specific criteria used for the measures
– The methodology to get the value for the characteristic you are trying to measure
• Develop a baseline - where are you today?
• Where have you been?
– Trending information is more valuable than one point in time
– Calculate values for the previous 12 – 18 months
– Track a 3 – 6 month rolling average
13

14
If these were your KPIs, what would you do?
51 daysNet Days in A/R
Recommend Range:
45 – 55 days
2.5%POS Collections Ratio
Recommend Range:
1.5% - 3%
3.8%Denials Write-off Ratio
Recommend Range:
2% - 3%

Developing KPIs
• Where do you want to be?
– Implementing initiatives to reduce operating costs is the number one priority of hospital CEOs in response to healthcare reform.
– Hospital CEOs report that the most effective way to reduce costs is through benchmarking and the use of decision support tools.
– Use resources such as HFMA & HARA for best practice benchmarks
– Try to find benchmarks more specific to your type of facility and geographic region
– Look for opportunities and create your “own” target
15
Processes Used to Reduce Costs in the Hospital % UsedEffectiveness(Scale 1-5)
Benchmarking 93% 3.84
Decision Support Tools 68% 3.66
National or Regional Collaborative 58% 3.76
Lean Six Sigma 42% 3.69
Management Engineers or Financial Liaisons 33% 3.70
Source: American College of Healthcare Executives. “CEO Survey: Hospital Initiatives to Reduce Operating Costs.” Healthcare Executive. May/June 2011.

Gap Analysis
Current Performance
Good Performance
Better Performance
BEST PERFORMANCE
Good, Better, BEST!
16

KPIs by Functional Area
PATIENTACCESS
REVENUE INTEGRITY CLAIMS MANAGEMENT REIMBURSEMENT
OTHERMANAGEMENT
• Pre-Registration Rate
• Days Gross Revenue in Discharged-Not-Final-Billed (DNFB)
• Final-Billed-Not-Submitted (FBNS)
• Initial Zero Paid Denial Rate
• Cash Collections as % of Net Revenue
• Point-of-ServiceCollections Rate
• Discharged-Not-Submitted to Payer (DNSP)
• Clean Claim Submission Rate
• Initial Partial Paid Denial Rate
• Days Cash on Hand
• Uninsured Patient Conversion Rate
• Late Charges as % of Total Charges
• Net Days in A/R • Total Denial Write-Off as a % of Net Revenue
• Case Mix Index
• Insurance Verification Rate
• A/R Aging Distribution
• Overturned DenialRate
• Bad Debt Write-offs as % of Gross Revenue
• InsuranceAuthorization Rate
• Billed A/R >90 Days∙ 3rd Party >90 Days∙ Self Pay >90Days
• Charity Care Write-offs as % of Gross Revenue
• Charity Care to Uncompensated Care
• Days Gross Revenue Held in Credit Balances
• Cost-to-Collect
17

KPI Reporting Process
• Determine how you will display and track KPIs
– Charts, graphs, dashboards, spreadsheets, etc.
• Decide which indicators will be tracked daily, weekly, monthly, quarterly
• Put someone in charge of collecting the data
– Automate data collection where possible
• Schedule regular meetings with the CFO and revenue cycle leadership team to review indicators
– Give updates on current initiatives, identify new opportunities and create action plans
– Results in common goals
• Schedule separate department meetings that includes director, managers, supervisors & leads
18

Using Your KPIs
• The ability to set goals and make projections.
• Use data to “find value that others oversee” (i.e., information).
• Effective KPIs allow you to find the “championship combination” for your organization that you can afford.
• Your KPI tools will be specific to your organization and will allow you to customize solutions.
19

And Now…
Time to get MAD about
KPIs and Revenue Cycle Management!!!
20

Thomas Edison…Example of a “MAD” Man
• Many often referred to Edison as a genius.
• What was his response?
• “Genius is 1% inspiration and 99% perspiration.
• He was also noted as saying: “Genius is hard work, stick-to-it-iveness, and common sense.
• Invented the lightbulb – now a symbol synonymous with idea and inspiration.
21

Inspiration
• Your “lightbulb” moment
• Involve everyone in the “lightbulb” process
• Consider rewarding staff for coming up with their own “lightbulbs”
• Your lightbulb, or idea, is only the first step, next comes the real work of implementing your idea
22

The Keys to being a MAD success!
Measurement
DisciplineAccountability
Patient Access
Scheduling/ Pre-registration
Ins. Verification/ Authorization
POS Collections
Financial Counseling
Registration
Revenue Integrity
Charge Capture
Clinical Documentation
Chargemaster Management
Coding
HIM Throughput
Business Office
Billing
AR Follow-up & Management
Payment Posting
Customer Service
Collections/ Agency Management
Reimbursement
3rd Party Contracting
Denials Management
Contract Management
Pricing Strategy/ Fee Schedules
Revenue Recognition
23

Measurement
• We’ve all heard it: you can’t manage what you don’t measure.
– Measurement aids in identifying problem areas.
– Sets the stage for setting goals/targets and working toward them.
• It is also a proven principle that:
– When performance is measured, performance improves. When performance is measured and reported, the rate of improvement will accelerate beyond mere measurement alone.
• Other principles to keep in mind:
– Ensure that what you are measuring is accurate and meaningful. Use a standard data source.
– Use metrics instead of just data reporting – the more standardized and widely used, the better. Examples: HARA, HFMA’s Revenue Cycle MAP Keys
– Measure early and measure often.
– Automate the measurement process as much as possible.
24

Key Performance Indicator Target
Overall pre-registration rate of scheduled patients >98%
Overall insurance verification rate of scheduled/pre-registered patients >98%
Registration accuracy rate >98%
Successful attempts for collection of elective services deposits prior to service 100%
Successful attempts for collection of inpatient self-pay deposits prior to discharge >65%
Successful attempts for collection of ED self-pay deposits prior to departure >50%
Days of gross revenue held in Discharged-not-Final-Billed status <4-6 days
Physician documentation completion deliquency greater than 30 days <5%
Final-Billed-Claim-not-Submitted backlog <1 A/R day
Billed insurance A/R >90 days from service/discharge <15-20%
Bad debt write-offs as a % of gross revenue <3%
Charity care write-offs as a % of gross revenue <3%
Total cash to net-collectible revenue (60 day average lag) ~100%
Cost to collect (HIM excluded) <2-3%
Net A/R days <45-55 days
Point-of-service collections as a % of total cash collections >2-3%
Outsourced bad debt netback ([collections-fees]/placements) >7-11%
Overall initial denials rate (% of net revenue) <4%
Clinical initial denials rate (% of net revenue) <5%
Appealed denials overturned rate 40-60%
Pati
en
t A
ccess
HIM
Pati
en
t A
cco
un
tsD
en
ials
Examples of Measurement
KPIs, Dashboards, and Graphs, oh my!
0% 0%
0% 0%
Project Plan (click on image below to see detailed workplan)
Safety Metrics Project Milestones
Current
Employee Injuries
(# of events)
0%
Completeness % 0%Overall Progress
Indicator
Falls (per 1k IP days)
VTEs (# of events)
0
0
0
Current
Project Dashboard
Exce
ss
Mar
gin
0.0%
0
Day
s C
ash
on
Han
d
-1.9
4%
0.9
9%
-1.6
8%
-1.8
5%
-1.3
0%
0.2
2%
0.7
%
Sep
-13
Nov
-13
Jan-
14
Mar
-14
May
-14
Jul-
14
Sep
-14
Nov
-14
Jan-
15
Mar
-15
May
-15
Jul-
15
Sep
-15
Nov
-15
Jan-
16
Mar
-16
May
-16
Jul-
16
Sep
-16
Nov
-16
Jan-
17
Mar
-17
Create a C
ulture
of Excellence
Invest in
Strategic
Grow
thLev
erag
e
Med
icar
e
Gro
wth
1 2 3 4 5 6 7 8 9 10 11 12 13 14 15 16 17 18 19 20 21 22 23 24 25 26 27 28 29 30 31 32 33 34 35 36
# List of Activties
Progress
Indicator % Completed May
-14
Jun
-14
Jul-
14
Au
g-1
4
Sep
-14
Oct
-14
No
v-1
4
Dec
-14
Jan
-15
Feb
-15
Mar
-15
Ap
r-1
5
May
-15
Jun
-15
Jul-
15
Au
g-1
5
Sep
-15
Oct
-15
No
v-1
5
Dec
-15
Jan
-16
Feb
-16
Mar
-16
Ap
r-1
6
May
-16
Jun
-16
Jul-
16
Au
g-1
6
Sep
-16
Oct
-16
No
v-1
6
Dec
-16
Jan
-17
Feb
-17
Mar
-17
Ap
r-1
7
1 Increase Market Share by 5% 0%
2Increase Market Share by 5% in Targeting Service
Lines through Physician Alignment0%
3 ARHS Days Cash on Hand 0%
4 Increase CMI by ≥ 0.05 0%
5 Achieve Breakeven Status on Medicare IP 0%
6 Achieve MH "Best Places to Work" Status 0%
7Improve Overall ARHS Physician Alignment by ≥ 10%
Over Baseline0%
8 Achieve Magnet Status 0%
Show Gantt for Planned Show Status? █ What is current month? 1
Create a C
ulture
of Excellence
Invest in
Strategic
Grow
thLev
erag
e
Med
icar
e
Gro
wth
Project Kickoff
Team Selection
May
-14
Jul-
14
Sep
-14
Nov
-14
Jan-
15
Mar
-15
May
-15
Jul-
15
Sep
-15
Nov
-15
Jan-
16
Mar
-16
May
-16
Jul-
16
Sep
-16
Nov
-16
Jan-
17
Mar
-17
43 38 41 39 35 36 35
Sep
-13
Nov
-13
Jan-
14
Mar
-14
Ma
y-1
4
Jul-
14
Sep
-14
Nov
-14
Jan-
15
Mar
-15
Ma
y-1
5
Jul-
15
Sep
-15
Nov
-15
Jan-
16
Mar
-16
Ma
y-1
6
Jul-
16
Sep
-16
Nov
-16
Jan-
17
Mar
-17
26 32 35 38 38 35 40
42
5
1
Protect the
Core
Protect the
Core
ABC Health System
25

Accountability
• Accountability must start with leadership.
– A waterfall without a source is just a cliff – the source of accountability must be with leadership, then it can flow to the rest of the organization.
• Establish accountability for every process of the revenue cycle.
– Ensure that every revenue cycle process reports to the right person – the “right people in the right seats on the bus” principle.
• Accountability is enhanced when coupled with measurement.
– Every metric being measured should be tied to an accountable leader.
– All staff level employees should be accountable to at least one quality and one productivity metric.
26

Accountability
Not this…
No Accountability!
Sr. Assoc. Dir.
Associate
Director
Assistant
Director
Admission
Officer
Asst. to Director
Transfer
Coordinator
Sr. HCPPA
Asst. Coor. Mgr. HCPPA Asst. Coor. Mgr HCPPA
Coord. Manager
Tour II
Coord. Manager
Tour I
Coord. Manager
Tour III
Sr. HCPPA
Admitting/ER
Clerical Assoc.
Admitting / ER
C.A.
Sr. HCPPA
Pre-Adm/
Information
Clerical Assoc.
C.A.
Sr. HCPPA
Admitting/
Discharge
PAA
Admitting
Clerical Assoc
Discharge Office
C.A.
Clerical Assoc
Admitting
C.A.
C.A.
Sr. HCPPA
ER/Bed Board
Asst. Coor.
Manager
ER
Clerical Assoc.
ER
C.A.
Sr. HCPPA
Admitting
PAA
Admitting
Asst. Coor.
Manager
ER
Clerical Assoc.
Admitting
C.A. C.A.
Systems
Analyst
Asst. Coor. Mgr.
Census / TCEs
Census Team
Clerical Assoc.
Clerical Assoc.
27

Discipline
• Process discipline = a standardized approach:
– Define each task within the revenue cycle very clearly, then stick to that definition each time the task is performed to improve overall revenue cycle performance.
• You don’t have to be a six sigma black belt to identify areas and ways in which a process can be improved and where process discipline can be implemented.
• If you talk to different employees who perform the same task and they give different answers on how the task is done, you know you have a problem.
• Develop tools such as workflows, scripts, and training sheets so staff can easily follow the standard approach.
• Identify or create a process champion – someone who performs the task (or is willing to) in the best manner and utilize him/her as an example/role model/trainer for others.
28

Putting it All Together
• Develop your idea – your “lightbulb”
• Identify which measurements relate to the area you are desiring to improve
• Utilize measurements to assess where you are now compared to where you want to be
– Identify gaps and quantify opportunities
• Prioritize opportunities based on financial and operational impact
• Develop standardized, disciplined approaches for each process to be improved
• Assign accountability to each measurement and process so that everything is tied to an accountable individual
• Implement changes
• Continue to measure and report to determine progress
• Celebrate successes
29

Lessons for Success
Once you figure out your KPI recipe:
• You can “accomplish what no one has before…”
• Find the best path even in impossible situations
• Don’t let the past define you
30

Contact Info
Dan Bergantz - Director
801-755-4628
Sandy Richman - Director
801-300-0221
31

Speaker Biography
• Sandy Richman has 15 years of combined clinical, financial, and consulting experience in the healthcare industry. In his current role as Director of Advisory Services for PNC Healthcare, he specializes in revenue cycle process improvement. Prior to joining PNC, Sandy was Manager of ARUP Laboratories’ Consultative Services Division where he and his team worked closely with hospitals nationwide to develop or expand their laboratory outreach operations. Sandy also has extensive experience in ED improvement, strategic planning, financial analysis, strategic pricing, operations improvement, and market research. He holds an MBA degree from the University of Utah, and is an active member of the Utah HFMA chapter.
32

Speaker Biography
• Dan Bergantz has 15 years of combined research, financial, and consulting experience in the healthcare industry. He currently serves as Director of Advisory Services for PNC Healthcare specializing in revenue cycle process improvement, and also has extensive experience in strategic planning, labor management and productivity, strategic pricing, and physician productivity. Prior to joining PNC, Dan developed his expertise and passion for the healthcare industry working for organizations including the Premier Healthcare Alliance, Phase 2 Consulting, GE Healthcare, and the Utah Medical Education Council. Dan earned his MBA in Health Administration from the Eccles School of Business at the University of Utah, and is an active member of HFMA’s Utah Chapter.
33

APPENDIX
34

Patient Access KPIs
Indicator Calculation Things to Consider Target
• Pre-Registration Rate of Scheduled Patients
Number of patient encounters pre-
registered
Number of scheduled patient encounters
All scheduled encounters pre-registered prior to date of service. A scheduled encounter is considered prior to day of service.
90-98%
• Point-of-Service(POS) Collections Rate
POS Payments
Total Cash Collected
Defined as patient payments collected prior to or up to seven days after discharge/dateof service for the current encounter only.
1.5 - 3%
• Inpatient Uninsured Patient ConversionRate
Number of uninsured patients converted to a
payer source
Total number of uninsured patients
Payer source can include COBRA, Medicaid, workers comp, other insurances such as motor vehicle, and other government programs.
10-20%
35

Patient Access KPIs
Indicator Calculation Things to Consider Target/BestPractice
• Insurance Verification Rate
Total number of verified encounters
Total number of registered encounters
All scheduled patient encounters where eligibility/insurance is verified prior to date of service and non-scheduled encounters verified within one day of service/admission date.
90-98%
• InsuranceAuthorization Rate
Number of encounters authorized
Number of encounters requiring authorization
Authorization is defined as required approval from the 3rd party payer for the services ordered.
90-98%
• Charity Care to Uncompensated Care
Charity care write-off
Total uncompensated care
(charity care + bad debt)
36

Revenue Integrity KPIs
Indicator Calculation Things to Consider Target/BestPractice
• Days Gross Revenue in Discharged-Not-Final-Billed (DNFB)
Gross dollars in A/R not final billed
Average daily gross patient service
revenue
Include inpatient and outpatient, and exclude in-house claims.
4 – 6 Days
• Discharged-Not-Submitted to Payer (DNSP)
Gross dollars in DNFB + gross dollars in FBNS
Average daily gross patient service
revenue
5 – 8 Days
• Late Charges as % of Total Charges
Charges with post date >3 days from last
service date
Total gross charges
< 2%
37

Claims Management KPIs
Indicator Calculation Things to Consider Target/BestPractice
• Final-Billed-Not-Submitted to Payer (FBNS)
Gross dollars in FBNS
Average daily gross patient service revenue
1-2
• Clean ClaimSubmission Rate
Number of claims that pass edits requiring no manual intervention
Total claims accepted in to billing scrubber for
editing
> 85%
• Net Days in A/R Net A/R
Average daily net patient service revenue
Should exclude credit balance accounts and any non-patient service A/R
45 – 55 Days
38

Claims Management KPIs
Indicator Calculation Purpose Target/Best Practice
• Billed A/R >90 Days∙ 3rd Party >90 Days∙ Self Pay >90 Days
Billed A/R > 90 days
Total billed A/R
Should only include debit balance accounts aged from discharge date.
15 – 20 %
• Days Net Revenue Held in Credit Balances
Dollars in credit balance
Average daily net patient service
revenue
Should not include accounts in pre-admit or in-house status.
1.5 – 2 Days
39

Reimbursement KPIs
Indicator Calculation Things to Consider Target/Best
Practice
• Initial Zero Paid Denial Rate
Number of zero paid claims denied
Number of claims remitted
Total number of zero pay claims received from 3rd party payers with a denial code on the remittance advice.
< 4 %
• Initial Partial Paid Denial Rate
Number of partially paid claims denied
Number of claims remitted
Total number of partial pay claims received from 3rd party payers with a denial code on the remittance advice.
• Total Denial Rate Denial write-off amount
Net patient service revenue
Should include all net account balances written off within the month resulting from un-appealable denials. Do not include contractual allowances.
2-3 %
• Overturned DenialRate
Number of appealed claims paid
Number of claims appealed and finalized
or closed
Should include all appealed claims (in response to a denial or take-back) that were closed/finalized within the month due to a receipt of payment.
40 – 60%
40

Other Management KPIsIndicator Calculation Things to Consider Target/Best
Practice
• Cash Collections as a % of Net Revenue
Total cash collected
Average net patient service revenue
Total cash collected from patient service accounts. Exclude any non-patient service cash.
> 100%
• Days Cash on Hand (Cash on hand + market securities)
[(Total operating expense -
depreciation expense)/365]
Include all cash and other liquid assets as reported on the balance sheet.
150
• Case Mix Index∙ Total∙ Medicare
Sum of relative weights of all DRGs
billed
Total number of DRGs billed
Trending indicator that reflects the diversity, clinical complexity and the needs for resources in the population of patients in a hospital
Monitor for significant change
41

Other Management KPIs
Indicator Calculation Things to Consider Target/BestPractice
• Bad Debt Write-offs as % of Gross Revenue
Bad debt write-off
Gross patient service revenue
<2.5 -3.5 %
• Charity Care Write-offs as % of Gross Revenue
Charity care write-off
Gross patient service revenue
<2.5 -3.5 %
• Cost-to-Collect Total revenue cycle cost (patient access, patient
accounts)
Total cash collected
Should include all Patient Access departments’ costs, including the functions of: scheduling, pre-registration, eligibility/insurance verification, admissions, registration, and financial counseling. Include all Business Office departments’ costs, including the following functions: billing, A/R follow up & collections, cash posting, customer service, and denials/underpayments management. Include costs for any outsourced functions.
<1.5 –3 %
42