À matilde e à vera · medição do teor de humidade higroscópica. ... solúveis na secagem de...
TRANSCRIPT

UNIVERSIDADE TÉCNICA DE LISBOA
INSTITUTO SUPERIOR TÉCNICO
Salt crystallization in plastered or rendered walls
Teresa Cláudio Diaz Gonçalves
(MSc)
Thesis carried out at the Laboratório Nacional de Engenharia Civil (LNEC) for the purpose of obtaining a PhD degree in Civil Engineering at the Universidade Técnica de Lisboa, whithin the scope of a partnership contract between Instituto Superior Técnico and LNEC
Promotor: Licentiate José Delgado Rodrigues
Co-Promotor: Doctor Fernando António Baptista Branco
Jury
President: Rector of the Technical University of Lisbon
Members: Doctor Fernando Manuel Anjos Henriques
Doctor Fernando António Baptista Branco
Licentiate José Delgado Rodrigues
Doctor Augusto Martins Gomes
Doctor Maria do Rosário da Silva Veiga
Doctor Ana Paula Patrício Teixeira Ferreira Pinto França de Santana
Lisbon, July 2007


À Matilde e à Vera


Agradecimentos / Acknowledgements This thesis was carried out at the National Laboratory for Civil Engineering (LNEC), in Lisbon, partially within the framework of two research projects: the European project “COMPASS - Compatibility of plasters and renders with salt loaded substrates in historic buildings”, and the national project FCT/LNEC “Metodologias para a mitigação do risco associado à degradação das construções (Methodologies for the mitigation of risks associated with the degradation of constructions)”. The use of magnetic resonance imaging was carried out at the Centre for Material Research with Magnetic Resonance in Eindhoven University of Technology (TUE). Gostaria de agradecer a todos aqueles que contribuíram para que esta tese chegasse a bom termo. Quero expressar, em particular, a minha gratidão: Ao Laboratório Nacional de Engenharia Civil (LNEC), onde realizei esta tese. Agradeço ao LNEC, na pessoa do seu presidente Engenheiro Carlos Matias Ramos, o ter-me proporcionado todas as condições materiais e humanas que permitiram realizar o trabalho. Estendo este agradecimento aos restantes membros da actual Direcção do LNEC, Professor Pedro Mendes, Engenheiro Francisco Carvalhal e Engenheiro Carlos Pina pela ajuda em momentos críticos do processo. Ao Instituto Superior Técnico (IST), na pessoa do seu presidente Professor Carlos Matos Ferreira, pela oportunidade que tive de obter o grau de doutor na mesma escola onde me licenciei. Ao meu orientador, Doutor José Delgado Rodrigues, pela amizade, pela disponibilidade irrestrita e pelas críticas certeiras. Os bons resultados conseguidos devem-se ao seu apoio constante e motivação transmitida. Todos os outros são da minha exclusiva responsabilidade. Ao meu co-orientador, Professor Fernando Branco, pela confiança, pelo incentivo e pela liberdade com que me permitiu realizar o trabalho. À Engenheira Adélia Rocha, actual Directora do Departamento de Materiais do LNEC, por ter proporcionado as condições necessárias à realização da tese nesse departamento, pelo apoio que sempre me deu e pelo empenhamento com que me ajudou a ultrapassar algumas fases críticas da tese.

VI Agradecimentos / Acknowledgements
Ao Engenheiro José Manuel Catarino, anterior Chefe do mesmo Departamento, pela confiança que depositou em mim e nesta tese e por ter criado as condições que me permitiram iniciar o trabalho. Ao Engenheiro João Manuel Mimoso, Chefe do Núcleo de Cimentos e Materiais Cerâmicos do LNEC, onde levei a cabo o trabalho, por me ter proporcionado as condições e a disponibilidade de que necessitei para realizar a tese e pelas úteis sugestões que me foi dando ao longo dos últimos três anos. Ao Ministério da Defesa Nacional, que me apoiou financeiramente, suportando as propinas de doutoramento durante os três primeiros anos da tese. À Fundação Calouste Gulbenkian por ter co-financiado em conjunto com o LNEC a minha primeira estadia na Universidade de Eindhoven. To the Group Transport in Permeable Media of The Department of Applied Physics of TUE, where all the NMR measurements presented in this thesis were carried out. I am particularly grateful to Doctor Leo Pel, who supervised my work at TUE and carried out the 2D measurements, for his support and critical review of the sections which include NMR results. I am also grateful to Doctor Henk Huinink, with whom I had several useful discussions, for his help. Thanks also to Ir Gijs van der Heijden, for carrying out the 1D NMR measurements and Doctor Kristina Terheiden for her help with some of the 2D NMR measurements. To Professor Rob van Hees, coordinator of the COMPASS project, for his critical reading of the thesis and useful suggestions. To other colleagues of the project from TNO (the Netherlands), LRMH (France) and IET (Spain), particularly, Ir Tomas Wijfels and Doctor Mohamed Nasraoui, who provided extra-material for the experiments in this thesis and Doctor Maria Pilar de Luxán, who kindly made available the results of her water vapour permeability tests. Ao João Júnior, que me acompanhou desde o início e executou a maioria dos provetes e ensaios da tese, pela dedicação e empenhamento. Ao João Ribeiro, pela amizade e apoio constantes. Ao Engenheiro Miguel Abreu, pela colaboração durante o último ano e meio do projecto COMPASS. A outros colegas do LNEC que foram responsáveis por técnicas específicas ou levaram a cabo as correspondentes medições: Engenheira Ana Maria Esteves, Joana Cardoso e António Carvalho (Cromatografia Iónica), Doutor António Santos Silva e Ludovina Matos (Difracção de Raios X), Luís Nunes (porosimetria de mercúrio). Ao Professor João Carlos dos Reis que amavelmente calculou os coeficientes osmóticos de soluções aquosas de NaCl e Na2SO4 a 40ºC. To those who helped in particular aspects of the thesis, namely: Professor George Scherer, for discussing some of the experimental results, Doctor Michael Steiger for discussing some results and allowing the use of his new phase-diagram for sodium sulphate, Doctor Kaj Thomsen, for providing thermodynamic data for carbonate solutions.

Agradecimentos / Acknowledgements VII
Às entidades responsáveis pelos edifícios e monumentos utilizados como casos-de-estudo: IPPAR (Igreja das Salvas), Câmara Municipal da Moita (Moinho de Maré de Alhos-Vedros), DGEMN (Mosteiro de Santa Clara-a-Nova e Casa do Despacho da Igreja da Misericórdia de Pereira) e Câmara Municipal de Almada (Igreja de S. Sebastião). Deixo uma palavra de agradecimento em particular a algumas pessoas cuja ajuda foi crítica: Arquitecto Luís Marreiros, Arquitecto Manuel Lacerda, Arquitecta Maria José Lopes e Engenheira Lúcia Costa. À Rosália Jesus, chefe da Secção de Expediente do Departamento de Materiais, pela ajuda constante e boa vontade durante as fases mais difíceis da tese. À Angela O’Driscoll, pelo apoio na rvisão do texto. Ao Professor Vasco Freitas, que se disponibilizou para discutir alguns dos perfis unidimensionais obtidos por ressonância magnética nuclear. A várias outras pessoas cuja boa vontade foi essencial em diferentes momentos do trabalho, nomeadamente, Engenheiro Arlindo Gonçalves e João Balsinha que disponibilizaram a sala condicionada onde realizei muitos dos ensaios, Doutora Paulina Faria que, numa impossibilidade minha, apresentou a comunicação sobre a Igreja de S. Sebastião ao simpósio da RILEM e José Costa, técnico do NMCM que ajudou a realizar muito do trabalho experimental. Quero finalmente destacar a contribuição do Engenheiro José Carvalho Lucas, anterior Chefe do Núcleo de Cimentos e Materiais Cerâmicos do LNEC, infelizmente falecido em 2003. O seu apoio, incentivo e amizade foram essenciais para o arranque e desenvolvimento desta tese.


Salt crystallization in plastered or rendered walls
Abstract
This thesis was aimed at understanding the behaviour of plasters and renders on salt-loaded
walls. The current state-of-the-art and state-of-the-practice were accessed focusing
particularly on old plastered/rendered buildings and their conservation practice in Portugal.
Afterwards, experimental work was carried out aiming at answering the identified questions.
Two laboratory techniques, for relative humidity control with salt solutions and for salt content
determination by hygroscopic moisture content measurements, were investigated. Drying of
salt-loaded materials was studied by means of drying experiments monitored using a
magnetic resonance imaging (MRI) technique. The behaviour of plasters and renders in
relation to salt crystallization was then accessed by means of crystallization tests and
MRI-monitored drying tests. Most drying and crystallization tests were carried out on
specimens composed by a plaster or render applied on a given substrate. Finally, the study of
five old buildings in Portugal provided an insight into practice-related salt decay features.
On the basis of this research, guidelines are proposed to select plasters and renders for salt-
loaded walls. Conclusions were also achieved on: (i) possibilities and limitations of the test
methods, particularly salt crystallization tests, and diagnostic methodology used;
(ii) salt decay processes, namely, influence of soluble salts on drying, mechanisms of
salt-induced dampness and salt distribution in masonry; (iii) reasons for sodium chloride being
typically much less damaging than sodium sulfate in laboratory tests; (iv) influence of factors
such as the type of salt, kind of substrate material or presence of a paint layer on the
behaviour of plasters and renders; (v) factors that can account for a worsening of salt damage
after restoration interventions; (vi) field or application conditions that favour salt damage.
Key-words: soluble salt crystallization, salt decay, plasters and renders, old buildings,
salt-damp, efflorescence


Cristalização de sais solúveis em paredes rebocadas
Resumo
A presente tese visa compreender o comportamento de rebocos aplicados em paredes
contaminadas com sais solúveis. O estado-da-arte e o estado-da-prática foram avaliados
focando, em particular, o caso dos edifícios antigos e a situação da prática em Portugal. O
trabalho experimental seguidamente realizado visou dar resposta às principais questões
identificadas. Foram avaliadas duas técnicas laboratoriais de interesse geral, para controlo da
humidade relativa por meio de soluções salinas e para avaliação do teor de sal com base na
medição do teor de humidade higroscópica. A secagem de materiais contaminados com sais
foi investigada através de ensaios de secagem monitorizados por ressonância magnética
nuclear. O comportamento de rebocos relativamente à cristalização de sais for estudado por
meio de ensaios de cristalização e de ensaios de secagem monitorizados por ressonância
magnética nuclear. A maioria dos ensaios, quer de cristalização, quer de secagem, foram
realizados em provetes compostos por um reboco aplicado num determinado suporte.
Finalmente, foram estudados cinco edifícios antigos portugueses, o que possibilitou
compreender causas e tipos de degradação que frequentemente ocorrem na prática.
A tese permitiu estabelecer orientações para a selecção de rebocos para paredes
contaminadas com sais solúveis. Permitiu ainda retirar conclusões sobre: (i) possibilidades e
limitações dos métodos de ensaio, em particular de cristalização de sais, e metodologia de
diagnóstico utilizados; (ii) processos de degradação, nomeadamente, influência dos sais
solúveis na secagem de materiais porosos, problemas de humidade devidos a sais solúveis e
distribuição de sal em alvenarias; (iii) razões para o cloreto de sódio provocar tipicamente
maior degradação do que o sulfato de sódio em ensaios laboratoriais de cristalização;
(iv) influência no comportamento dos rebocos de factores como o tipo de sal, natureza dos
materiais do suporte ou presença de pintura; (v) factores que podem originar um
agravamento dos danos por sais solúveis após intervenções de conservação; (vi) condições
de obra que favorecem a degradação por sais solúveis.
Palavras-chave: cristalização de sais solúveis, degradação por sais solúveis, rebocos,
edifícios antigos, humidade em edifícios, eflorescências


List of contents
Chapter 1 – Introduction
1.1 Motivation and scope...........................................................................................................................1
1.2 Aims and objectives.............................................................................................................................3
1.3 Outline of the thesis.............................................................................................................................4
1.4 Delimitations of scope and key-assumptions ......................................................................................5
Chapter 2 – Research and practice: current situation
2.1 Introduction..........................................................................................................................................7
2.2 State of the art .....................................................................................................................................8
2.2.1 - Salt decay pathology ..............................................................................................................8
2.2.2 - Signs.......................................................................................................................................9
2.2.3 - Moisture ................................................................................................................................11
2.2.4 - Soluble salts .........................................................................................................................12
2.2.5 - Damage mechanisms...........................................................................................................16
2.2.6 - Influencing factors ................................................................................................................19
2.2.7 - Working principles of plasters and renders ..........................................................................22
2.2.8 - Salt crystallization tests ........................................................................................................24
2.3 State of the practice...........................................................................................................................24
2.3.1 - Introduction...........................................................................................................................24
2.3.2 - General approach to salt decay problems............................................................................25
2.3.3 - Main types of plasters and renders used on salt-loaded walls.............................................26
Chapter 3 – General laboratory techniques
3.1 Introduction......................................................................................................................................31
3.2 Fundamentals.................................................................................................................................32
3.2.1 - Relative equilibrium humidity of aqueous solutions ............................................................32
3.2.2 - Control of the relative humidity by means of aqueous solutions.........................................33
3.2.3 - Hygroscopic behaviour of soluble salts ...............................................................................33
3.3 Use of aqueous solutions for control of the relative humidity ........................................................34
3.3.1 - Introduction..........................................................................................................................34

XIV List of contents
3.3.2 - Materials and methods ........................................................................................................35
3.3.3 - Results.................................................................................................................................35
3.3.4 - Discussion ...........................................................................................................................36
3.4 Fundamentals, scope and accuracy of the HMC method..............................................................38
3.4.1 - Introduction..........................................................................................................................38
3.4.2 - Systematization of the HMC method...................................................................................40
3.4.2.1 Measurement of the HMC ...............................................................................................40
3.4.2.2 Determination of the salt content.....................................................................................40
3.4.3 - Discussion ...........................................................................................................................42
3.4.3.1 Accuracy of HMC measurements....................................................................................42
3.4.3.2 Mass stabilization ............................................................................................................44
3.4.3.3 Scope of the HMC method ..............................................................................................45
3.5 HMC experiments on salt-loaded materials ...................................................................................46
3.5.1 - Introduction..........................................................................................................................46
3.5.2 - Materials and methods ........................................................................................................48
3.5.3 - Results.................................................................................................................................50
3.5.3.1 - General..........................................................................................................................50
3.5.3.2 - Mass stabilization..........................................................................................................51
3.5.3.3 - Pure salts ......................................................................................................................51
3.5.3.4 - Base-materials (mortar and brick).................................................................................53
3.5.3.5 - Sodium chloride or sodium sulphate loaded materials: HMC at 80% RH.....................53
3.5.3.6 - Sodium chloride loaded materials .................................................................................54
3.5.3.7 - Sodium sulphate loaded materials ................................................................................54
3.5.3.8 - Mortar loaded with other soluble salts ..........................................................................56
3.5.3.9 - Salt mixtures..................................................................................................................57
3.5.3.10 - Error in salt content estimates.....................................................................................59
3.5.4 - Discussion ...........................................................................................................................60
3.5.4.1 - Influence of the base-materials and their state of cohesion .........................................60
3.5.4.2 - Mass stabilization..........................................................................................................60
3.5.4.3 - Correlation HMC/salt content ........................................................................................61
3.5.4.4 - Accuracy........................................................................................................................61
3.5.4.5 - Sodium sulphate ...........................................................................................................62
3.5.4.6 - Salt mixtures..................................................................................................................63
3.6 Conclusions....................................................................................................................................64
Chapter 4 – Drying of salt-contaminated materials
4.1 Introduction.........................................................................................................................................69
4.2 Drying of porous materials .................................................................................................................71
4.2.1 - Porosity and hygroscopicity..................................................................................................71
4.2.2 - Liquid water transport ...........................................................................................................72
4.2.3 - Water vapour transport.........................................................................................................77
4.2.4 - Drying of porous materials....................................................................................................78

List of contents XV
4.3 Materials and methods .......................................................................................................................81
4.3.1 - Materials ...............................................................................................................................81
4.3.2 - Drying experiments...............................................................................................................83
4.3.3 - Salt distribution .....................................................................................................................83
4.4 Results................................................................................................................................................84
4.4.1 - Drying of water-filled specimens ..........................................................................................84
4.4.2 - Drying in the presence of NaCl ............................................................................................86
4.4.3 - Overall drying curves............................................................................................................87
4.4.4 - Evaporation from free liquid surfaces...................................................................................87
4.4.5 - Salt deposition ......................................................................................................................88
4.5 Discussion ..........................................................................................................................................89
4.5.1 - Salt-induced dampness........................................................................................................89
4.5.2 - Salt distribution .....................................................................................................................91
4.5.3 - Other soluble salts................................................................................................................93
Chapter 5 – Behaviour of plasters and renders
5.1 Introduction........................................................................................................................................95
5.2 Salt crystallization tests .....................................................................................................................98
5.2.1 - Introduction...........................................................................................................................98
5.2.2 - Test variables .......................................................................................................................99
5.2.3 - Type of specimens .............................................................................................................100
5.2.4 - Contamination conditions ...................................................................................................101
5.2.5 - Drying procedure ................................................................................................................102
5.2.6 - Salt solutions ......................................................................................................................103
5.2.7 - Damage assessment..........................................................................................................104
5.3 Sorption of porous building materials ..............................................................................................104
5.4 Material characterization .................................................................................................................106
5.5 Crystallization tests on plaster/substrate specimens (set 1) ...........................................................109
5.5.1 - Introduction.........................................................................................................................109
5.5.2 - Experimental conditions .....................................................................................................109
5.5.2.1 - Definition of the main testing protocol.........................................................................109
5.5.2.2 - Materials and methods................................................................................................111
5.5.3 - Results................................................................................................................................113
5.5.3.1 - Salt crystallization tests...............................................................................................113
5.5.3.2 - Tests with pure water ..................................................................................................118
5.5.3.3 - Salt introduced in the specimens ................................................................................118
5.5.3.4 - Drying curves ..............................................................................................................119
5.5.3.5 - Summary of results .....................................................................................................121
5.5.4 - Discussion on set 1 ............................................................................................................122
5.5.4.1 - Main behaviour features..............................................................................................122
5.5.4.2 - Influence of the type of salt .........................................................................................124
5.5.4.3 - Influence of the paint................................................................................................126

XVI List of contents
5.5.4.4 - Influence of the substrate material...........................................................................127
5.5.4.5 - Test method .............................................................................................................128
5.6 Drying of a salt-accumulating plaster (set 2) ...................................................................................129
5.6.1 - Introduction.........................................................................................................................129
5.6.2 - Materials and methods .......................................................................................................129
5.6.3 - Results................................................................................................................................131
5.6.4 - Discussion on set 2 ............................................................................................................135
5.6.4.1 - Totally saturated specimens .......................................................................................135
5.6.4.2 - Partially saturated specimens .....................................................................................135
5.7 Influence of a paint on drying (set 3) ...............................................................................................140
5.7.1 - Introduction.........................................................................................................................140
5.7.2 - Materials and methods .......................................................................................................140
5.7.3 - Results................................................................................................................................140
5.7.4 - Discussion on set 3 ............................................................................................................142
5.8 Drying of hydrophobic agent containing plaster (set 4)...................................................................143
5.8.1 - Introduction.........................................................................................................................143
5.8.2 - Materials and methods .......................................................................................................143
5.8.3 - Results................................................................................................................................144
5.8.4 - Discussion on set 4 ............................................................................................................146
5.9 Crystallization tests on painted stone (set 5) ..................................................................................147
5.9.1 - Introduction.........................................................................................................................147
5.9.2 - Materials and methods .......................................................................................................147
5.9.3 - Results................................................................................................................................148
5.9.4 - Discussion on set 5 ............................................................................................................150
5.10 Discussion .....................................................................................................................................151
5.10.1 - Salt distribution .................................................................................................................151
5.10.2 - Plasters and renders ........................................................................................................152
5.10.3 - Sodium chloride and sodium sulphate .............................................................................155
5.10.4 - Development of an accelerated-ageing test.....................................................................157
5.10.5 - Restoration interventions..................................................................................................158
5.10.6 - Adequability of plasters and renders ................................................................................159
Chapter 6 – Case studies
6.1 Introduction......................................................................................................................................161
6.2 Description of the buildings and main decay patterns.....................................................................163
6.2.1 - Salvas Chapel ....................................................................................................................163
6.2.2 - Alhos-Vedros tide mill.........................................................................................................165
6.2.3 - Despacho House ................................................................................................................167
6.2.4 - Cloister of Sta Clara-a-Nova Monastery.............................................................................168
6.2.5 - S. Sebastião Church...........................................................................................................171
6.3 Methods...........................................................................................................................................172

List of contents XVII
6.4 Results and discussion....................................................................................................................173
6.4.1 - General ...............................................................................................................................173
6.4.2 - Salvas Chapel ....................................................................................................................174
6.4.3 - Alhos-Vedros tide mill.........................................................................................................175
6.4.4 - Despacho House ................................................................................................................177
6.4.5 - Cloister of Sta Clara-a-Nova Monastery.............................................................................179
6.4.6 - S. Sebastião Church...........................................................................................................182
6.5 Research on experimental test panels ............................................................................................183
6.5.1 - Materials and methods .......................................................................................................183
6.5.2 - Execution of the test panels ...............................................................................................185
6.5.3 - Evaluation of the systems after three years of natural exposure .......................................187
6.6 Discussion .......................................................................................................................................189
6.6.1 - Main causes of decay.........................................................................................................189
6.6.2 - Diagnosis ............................................................................................................................191
6.6.3 - Test panels .........................................................................................................................191
Chapter 7 – Summary, conclusions and future perspectives
7.1 Summary .........................................................................................................................................193
7.2 Conclusions .....................................................................................................................................195
7.2.1 - Test methods......................................................................................................................195
7.2.2 - Salt decay processes .........................................................................................................197
7.2.3 - Sodium chloride versus sodium sulphate...........................................................................198
7.2.4 - Factors that influence salt damage features ......................................................................199
7.2.5 - Factors that can contribute for an aggravation of salt damage .........................................200
7.2.6 - Other field conditions that favour salt damage...................................................................200
7.2.7 - Diagnostic methodology .....................................................................................................201
7.2.8 - Application technique of industrial plasters and renders....................................................201
7.2.9 - Selecting plasters and renders for moist salt-loaded walls ................................................201
7.3 Future perspectives .........................................................................................................................203
References ............................................................................................................................................207
Annex I – Magnetic resonance imaging
I.1 Introduction................................................................................................................................... AI.1
I.2 One-dimensional technique ......................................................................................................... AI.3
I.3 Two-dimensional technique ......................................................................................................... AI.5
Annex II – Making of the test specimens for set 1 tests
Annex III – Damage assessment and diagnosis form


List of figures
Chapter 1 – Introduction
Fig. 1.1 – Two typical salt-damage patterns ...........................................................................................1
Chapter 2 – Research and practice: current situation
Fig. 2.1 – Salt decay pathology...............................................................................................................8
Fig. 2.2 – Some common salt decay patterns of plasters and renders. ...............................................10
Fig. 2.3 – Alveolar decay.......................................................................................................................11
Fig. 2.4 – Masonry disintegration ..........................................................................................................11
Fig. 2.6 – Solubility diagram of sodium chloride ...................................................................................15
Fig. 2.7 – RH/T phase diagram of sodium chloride...............................................................................15
Fig. 2.8 – Solubility diagram of sodium sulphate ..................................................................................16
Fig. 2.9 – RH/T phase diagram of sodium sulphate..............................................................................16
Fig. 2.10 – Representation of the four main working principles of plasters and renders......................23
Chapter 3 – General laboratory techniques
Fig. 3.1 – Hygroscopic moisture absorbed by a non-hydratable salt at a certain temperature ............33
Fig. 3.2 – Experimental set-up ..............................................................................................................36
Fig. 3.3 – Evolution of the RH in the container where NaCl samples were stored over water .............36
Fig. 3.4 – 1g NaCl sample: RH and T in the container .........................................................................36
Fig. 3.5 – 5g NaCl sample: RH and T in the container .........................................................................36
Fig. 3.6 – HMC of single material samples ...........................................................................................41
Fig. 3.7 – HMC of salt-loaded samples .................................................................................................41
Fig. 3.8 – HMC of six soluble salts as a function of the RH..................................................................42
Fig. 3.9 – HMC variation due to deviation of the RH ............................................................................43
Fig. 3.10 – Possible divergence in the HMC of NaCl-loaded samples .................................................44
Fig. 3.11 – HMC expected for NaCl at 20ºC or 25ºC ............................................................................50
Fig. 3.12 – Evolution over time of the HMC of mortar samples loaded with NaCl in the
deep narrow receptacles (second set of tests) ...................................................................51
Fig. 3.13 – Actual HMC of the pure salts in different receptacles .........................................................52
Fig. 3.14 – Actual HMC of the pure salts in deep-narrow receptacles and expected HMC..................52

XX List of figures
Fig. 3.15 – HMC of the base materials at 95% RH and 20ºC ..............................................................53
Fig. 3.16 – HMC at 80% RH of mortar and brick samples loaded with NaCl or Na2SO4 ......................54
Fig. 3.17 – HMC at 95% RH of NaCl-loaded brick or mortar samples..................................................54
Fig. 3.18 – HMC at 95% RH of Na2SO4-loaded brick or mortar samples .............................................55
Fig. 3.19 – Evolution over time of the HMC of mortar samples with up to 100% Na2SO4 ....................56
Fig. 3.20 – HMC at 95% RH of mortar samples loaded with each of six distinct salts .........................57
Fig. 3.21 – HMC of mortar loaded with salt mixtures ............................................................................57
Fig. 3.22 – Actual HMC for the salt mixtures and theoretical HMC ......................................................58
Chapter 4 – Drying of salt-contaminated materials
Fig. 4.1 – Capillary pressure in a cylindrical capillary ...........................................................................72
Fig. 4.2 – Porous material in free absorption ........................................................................................75
Fig. 4.3 – Typical water absorption curves for porous building materials .............................................75
Fig. 4.4 – Moisture transport at the pore scale during wetting of a porous material .............................79
Fig. 4.5 – Drying of a porous material at a macroscopic scale .............................................................79
Fig. 4.6 – Typical drying curve of a porous building material................................................................80
Fig. 4.7 – Pictures of one specimen......................................................................................................81
Fig. 4.8 – Pore size distribution (MIP) ..................................................................................................82
Fig. 4.9 – Drying with pure water: MRI snapshots ................................................................................85
Fig. 4.10 – Drying with pure water: 1D moisture profiles at cross-sections CS1 and CS2...................85
Fig. 4.11 – MRI snapshots of specimen DL1 (side-view) during drying with: (a) pure water;
(b) 3m NaCl solution. ............................................................................................................86
Fig. 4.12 – MRI snapshots of specimen ML1 (side-view) during drying with: (a) pure water;
(b) 3m NaCl solution .............................................................................................................86
Fig. 4.13 – Overall drying curves ..........................................................................................................87
Fig. 4.14 – Evaporation from free surfaces of pure water and saturated NaCl solution .......................87
Fig. 4.15 – Final salt distribution in specimen DL1 ...............................................................................88
Fig. 4.16 – Final salt distribution in specimen ML1 ...............................................................................88
Chapter 5 – Behaviour of plasters and renders
Fig. 5.1 – Crystallization test on brick treated with hydrophobic surface treatment on all faces
except the bottom (specimen I) and non-treated brick (specimen II) ...................................96
Fig. 5.2 – Test panels on the interior of S. Sebastião church ...............................................................97
Fig. 5.3 – Preliminary crystallization tests by wet-dry cycles ..............................................................103
Fig. 5.4 – Water characteristic curve of a porous building material ....................................................105
Fig. 5.5 – Capillary absorption tests - WAC in kg/(m2.h
1/2) ................................................................107
Fig. 5.6 – Drying curves ......................................................................................................................107
Fig. 5.7 – Pore size distribution (MIP) .................................................................................................108
Fig. 5.8 – Water vapour transport. ......................................................................................................108
Fig. 5.9 – Preliminary crystallization tests by continuous immersion .................................................110
Fig. 5.10 – Specimens (side view) used in set 1 tests ........................................................................111
Fig. 5.11 – HMC profiles of some non-painted specimens tested with pure water.............................118

List of figures XXI
Fig. 5.12 – MEP on brick drying curves ..............................................................................................119
Fig. 5.13 – Parlumière on brick drying curves.....................................................................................119
Fig. 5.14 – LNEC on brick drying curves.............................................................................................120
Fig. 5.15 – LNEC on lime mortar drying curves ..................................................................................120
Fig. 5.16 – Drying curves of the three LNEC on lime mortar specimens with sodium sulphate .........120
Fig. 5.17 – Correlation HMC / ion content .........................................................................................130
Fig. 5.18 – Results of the MRI-monitored drying experiments on fully saturated specimens.............132
Fig. 5.19 – Drying curves: total amount of water in the saturated specimens ....................................132
Fig. 5.20 – Results of the MRI-monitored drying experiments on partially saturated specimens.......133
Fig. 5.21 – Drying curves: total amount of water in the partially saturated specimens.......................133
Fig. 5.22 – Difference between evaporation and liquid fluxes in the partially saturated specimens ..133
Fig. 5.23 – Liquid fluxes in the partially saturated specimens ............................................................134
Fig. 5.24 – Evaporation fluxes in the partially saturated specimens...................................................134
Fig. 5.25 – Chloride distribution in MEP 2...........................................................................................134
Fig. 5.26 – Sulphate distribution in MEP 1 ..........................................................................................134
Fig. 5.27 – Representation of liquid migration in MEP plaster ............................................................137
Fig. 5.28 – Representation of the specimen assemblage (side-view) and cross-sections .................140
Fig. 5.29 – MRI snapshots of specimens D2 and D1P during drying with pure water........................141
Fig. 5.30 – Moisture content profiles at cross-sections NP (above) and P (below) ............................141
Fig. 5.31 – Drying curves ....................................................................................................................141
Fig. 5.32 – Drying with pure water: MRI snapshots of specimens DL1 and DH3 on side-view..........144
Fig. 5.33 – Drying with pure water: 1D moisture profiles at cross-sections CS1 and CS2 of
specimens DH3 and DL1 ....................................................................................................144
Fig. 5.34 – Normalized drying curves..................................................................................................145
Fig. 5.35 – Gravimetric drying experiments on water-filled specimens of non-additivated
plaster L or additivated plaster H. ......................................................................................145
Fig. 5.36 – Damage on the acrylic paint at the end of the first crystallization experiment..................148
Fig. 5.37 – Damage on the non-painted stone specimens at the end of the first crystallization
experiment.........................................................................................................................149
Fig. 5.38 – Damage to the acrylic paint during the second crystallization experiment .......................149
Fig. 5.39 – Paint damage arising without the presence of efflorescence ...........................................156
Fig. 5.40 – Paint damage by salt efflorescence ..................................................................................156
Chapter 6 – Case studies
Fig. 6.1 – Salvas Chapel, SW (front) façade.......................................................................................163
Fig. 6.2 – Salvas Chapel, NE (rear) façade .......................................................................................164
Fig. 6.3 – Salvas Chapel, SE façade ..................................................................................................164
Fig. 6.4 – Salvas Chapel, NW façade .................................................................................................164
Fig. 6.5 – Salvas Chapel, damage spots on the SE façade ...............................................................164
Fig. 6.6 – Dona Bataça (water fountain plus reservoir).......................................................................164
Fig. 6.7 – Tide-mill (N façade) ............................................................................................................165
Fig. 6.8 – Tide-mill, damage at the ground floor, northern wall ..........................................................166
Fig. 6.9 – Tide-mill, damage on the southern wall ..............................................................................166
D2

XXII List of figures
Fig. 6.10 – Tide-mill: moisture stains, probably due to dew point condensation, on the stone
pavement of the ground floor ..............................................................................................166
Fig. 6.11 – Pereira Misericórdia West façade .....................................................................................167
Fig. 6.12 – Extensive damage at the interior of Despacho House......................................................168
Fig. 6.13 – Sta. Clara-a-Nova cloister gallery .....................................................................................169
Fig. 6.14 – Sta. Clara: damage appears either close to the ground (NE wall, on the left)
or higher on the walls, next to stone elements (NW wall, on the right) ..............................169
Fig. 6.15 – Sta. Clara: details of lower (on the left) and upper (on the centre) damage spots ...........169
Fig. 6.16 – Sta. Clara: sequence of a possible damage mechanism..................................................170
Fig. 6.17 – Sta. Clara: sporadic cracks are observed .........................................................................170
Fig. 6.18 – Sta. Clara: in some cases, damage starts by the bulging and further detachment
of a thin surface layer of the render, accompanied by peeling of the paint, without the
presence of efflorescence...................................................................................................170
Fig. 6.19 – Sta. Clara: moisture spots on the stone (left), moisture spots (centre) and biological
growth (right) on the render ................................................................................................170
Fig. 6.20 – Sta. Clara: on the same day in February 2004 probable dew point condensation
events were also observed on the stone floor (left and centre). Accumulation
of water in the cloister garden (right) had been observed during a previous
inspection, in January 2004 ................................................................................................171
Fig. 6.21 – São Sebastião Church: NE (front) façade in 1999............................................................171
Fig. 6.22 – São Sebastião: masonry damage.....................................................................................172
Fig. 6.23 – Assessment of the possible water loss from the drilling technique ..................................173
Fig. 6.24 – Salvas rear façade: drilling location (left) and MC/HMC profiles (centre and right) .........174
Fig. 6.25 – Tide mill NW wall: drilling location (left) and MC/HMC profiles (centre and right) ...........176
Fig. 6.26 – Despacho internal wall: drilling location (left) and MC/HMC profiles (centre and right) ...178
Fig. 6.27 – Sta Clara NW wall: drilling location (left) and MC/HMC profiles (centre and right) ..........179
Fig. 6.28 – Sta Clara NE wall: drilling location (left) and MC/HMC profiles (centre and right) ...........180
Fig. 6.29 – S. Sebastião: drilling location (left) and MC/HMC profiles (centre and right) ..................182
Fig. 6.30 – Test panels: traditional renders A and C and industrial renders D, E and F ....................183
Fig. 6.31 – Capillary water absorption of the three industrial systems and traditional mortar A.........184
Fig. 6.32 – Before making the panels, the substrate was prepared ...................................................185
Fig. 6.33 – Test panel execution .........................................................................................................186
Fig. 6.34 – Cracking of the rendering systems three years after their application .............................187
Fig. 6.35 – Comparison between the salt content of the masonry materials ......................................188
Fig. 6.36 – In-depth HMC profiles at 0.4m height from the ground.....................................................188
Annex I – Magnetic resonance imaging
Fig. I.1 – NMR set-up for 1D measurements at TUE......................................................................... AI.3
Fig. I.2 – Test-specimen sealed with Teflon tape .............................................................................. AI.4
Fig. I.3 – NMR coil, with specimen inside the central sample-holder, and air-flow tube.................... AI.4
Fig. I.4 – Moisture distribution profiles obtained during one drying experiment (above) and
representation of the measured specimen (bellow) ............................................................ AI.4

List of figures XXIII
Fig. I.5 – Correlation moisture content / NMR signal for MEP plaster and brick................................ AI.5
Fig. I.6 – NMR set-up for 2D measurements at TUE......................................................................... AI.5
Fig. I.7 – Test-specimen made of plaster on mortar/stone substrate ................................................ AI.6
Fig. I.8 – Sample-holder with specimen inside .................................................................................. AI.6
Fig. I.9 – NMR coil with sample-holder connected to air-flow............................................................ AI.6
Fig. I.10 – Representation of 2D measurement on a sample ............................................................ AI.7
Fig. I.11 – Example of a 2D NMR image............................................................................................ AI.7
Fig. I.12 – Correlation moisture content / NMR signal for plaster on mortar + stone specimens ...... AI.8
Fig. I.13 – Colour scale for the 2D NMR measurements ................................................................... AI.8


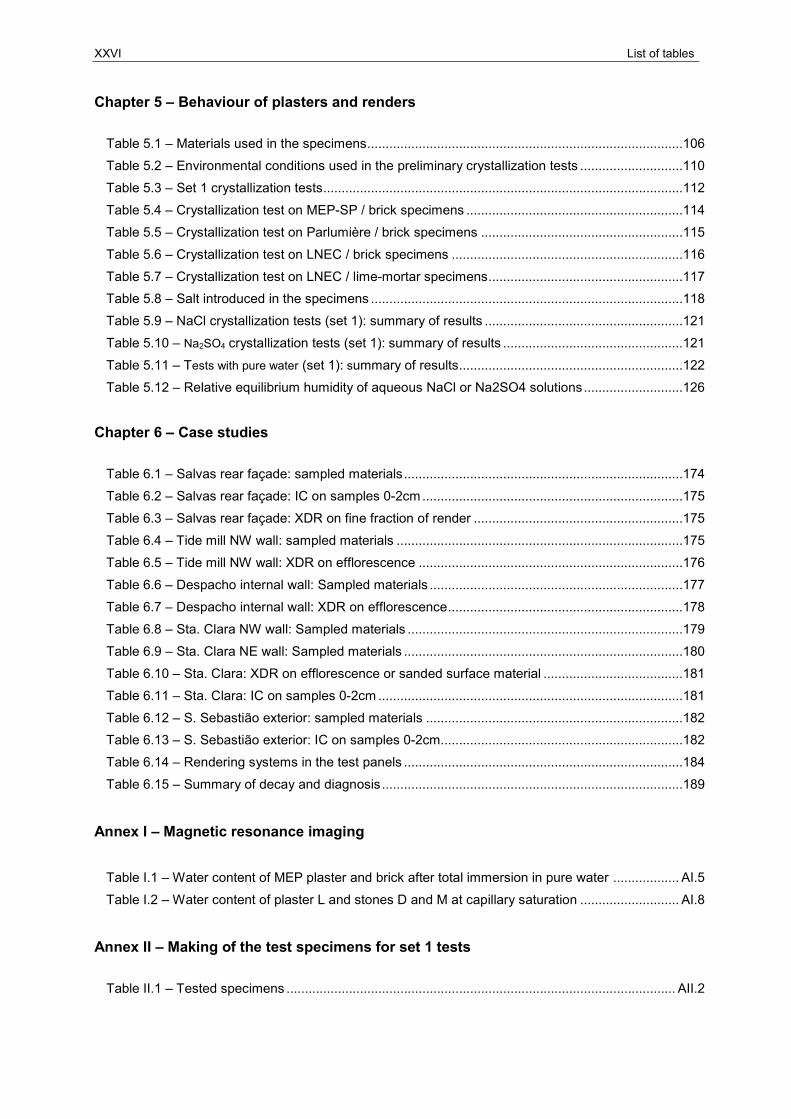
List of tables
Chapter 2 – Research and practice: current situation
Table 2.1 – Requirements for moisture transport properties of CEN renovation mortars
and WTA sanierputz...........................................................................................................28
Chapter 3 – General laboratory techniques
Table 3.1 – HMC experiments ..............................................................................................................48
Table 3.2 – Relative equilibrium humidity of the salts...........................................................................49
Table 3.3 – Composition of the salt mixtures........................................................................................49
Table 3.4 – Actual RH during the second set: at the end of the tests on loaded brick or mortar
(29 days) and on pure salt samples (64 days)......................................................................53
Table 3.5 - HMC at 80%RH and 20ºC: actual RH and correlation equations for NaCl-loaded
brick or mortar samples ........................................................................................................54
Table 3.6 - HMC at 95%RH and 20ºC: actual RH and correlation equations for NaCl-loaded
brick or mortar samples ........................................................................................................54
Table 3.7 – HMC at 95%RH and 20ºC: actual RH and correlation equations for mortar or
brick samples with Na2SO4-content below 2% .....................................................................55
Table 3.8 – HMC at 95%RH and 20ºC: actual RH and correlation equations for mortar samples
loaded with six distinct salts..................................................................................................57
Table 3.9 – HMC at 95%RH and 20ºC: correlation equations for mortar samples loaded
with four salt mixtures ...........................................................................................................57
Table 3.10 – Agreement of the actual HMC of the mixture with the value obtained by weighting
the HMC of the individual salts .............................................................................................58
Table 3.11 – Significance of the maximum HMC variation among the salt mixtures............................59
Table 3.12 – Error in salt content estimates..........................................................................................59
Chapter 4 – Drying of salt-contaminated materials
Table 4.1 – Composition, porosity and capillary coefficient of the materials ........................................82
XXVI List of tables
Chapter 5 – Behaviour of plasters and renders
Table 5.1 – Materials used in the specimens......................................................................................106
Table 5.2 – Environmental conditions used in the preliminary crystallization tests ............................110
Table 5.3 – Set 1 crystallization tests..................................................................................................112
Table 5.4 – Crystallization test on MEP-SP / brick specimens ...........................................................114
Table 5.5 – Crystallization test on Parlumière / brick specimens .......................................................115
Table 5.6 – Crystallization test on LNEC / brick specimens ...............................................................116
Table 5.7 – Crystallization test on LNEC / lime-mortar specimens.....................................................117
Table 5.8 – Salt introduced in the specimens .....................................................................................118
Table 5.9 – NaCl crystallization tests (set 1): summary of results ......................................................121
Table 5.10 – Na2SO4 crystallization tests (set 1): summary of results .................................................121
Table 5.11 – Tests with pure water (set 1): summary of results.............................................................122
Table 5.12 – Relative equilibrium humidity of aqueous NaCl or Na2SO4 solutions...........................126
Chapter 6 – Case studies
Table 6.1 – Salvas rear façade: sampled materials............................................................................174
Table 6.2 – Salvas rear façade: IC on samples 0-2cm.......................................................................175
Table 6.3 – Salvas rear façade: XDR on fine fraction of render .........................................................175
Table 6.4 – Tide mill NW wall: sampled materials ..............................................................................175
Table 6.5 – Tide mill NW wall: XDR on efflorescence ........................................................................176
Table 6.6 – Despacho internal wall: Sampled materials .....................................................................177
Table 6.7 – Despacho internal wall: XDR on efflorescence................................................................178
Table 6.8 – Sta. Clara NW wall: Sampled materials ...........................................................................179
Table 6.9 – Sta. Clara NE wall: Sampled materials ............................................................................180
Table 6.10 – Sta. Clara: XDR on efflorescence or sanded surface material ......................................181
Table 6.11 – Sta. Clara: IC on samples 0-2cm ...................................................................................181
Table 6.12 – S. Sebastião exterior: sampled materials ......................................................................182
Table 6.13 – S. Sebastião exterior: IC on samples 0-2cm..................................................................182
Table 6.14 – Rendering systems in the test panels ............................................................................184
Table 6.15 – Summary of decay and diagnosis..................................................................................189
Annex I – Magnetic resonance imaging
Table I.1 – Water content of MEP plaster and brick after total immersion in pure water .................. AI.5
Table I.2 – Water content of plaster L and stones D and M at capillary saturation ........................... AI.8
Annex II – Making of the test specimens for set 1 tests
Table II.1 – Tested specimens .......................................................................................................... AII.2

Glossary of initials, acronyms and abbreviations
Initials and acronyms
ASTM - ASTM International, originally known as the American Society for Testing and
Materials
BRE - Building Research Establishment
CEN - European Committee for Standardization
COMPASS - Compatibility of plasters and renders with salt-loaded substrates in historic buildings
(European research project, EC contract EVK4-CT-2001-00047)
EC - European Commission
EN - European standard
FCT - Fundação para a Ciência e a Tecnologia (Foundation for Science and Technology)
IET - Instituto de Ciencias de la Construcción Eduardo Torroja (Eduardo Torroja Institute
of Construction Sciences)
IPPAR - Instituto Português do Património Arquitectónico (Portuguese Institute of
Architectural Heritage)
ISO - International Organization for Standardization
LNEC - Laboratório Nacional de Engenharia Civil (National Laboratory for Civil Engineering)
LRMH - Laboratoire de Recherche des Monuments Historiques (Historical Monuments
Research Laboratory)
RILEM - International Union of Laboratories and Experts in Construction Materials, Systems
and Structures
TNO - The Netherlands Organisation for Applied Scientific Research
TUE - Technical University of Eindhoven
UNI - Italian Organization for Standardization
WTA - Wissenschaftlich-Technischen Arbeitsgemeinschaft für Bauwerks- erhaltung und
Denkmalpflege (International Association for Science and Technology of Building
Maintenance and Monuments Preservation)

XXVIII Glossary of initials, acronyms and abbreviations
Abbreviations
%V - percent by volume
%W - percent by mass
1D - one-dimensional
2D - two-dimensional
a.u. - arbitrary units
CS - cross-section
FID - free induction decay
HMC - hygroscopic moisture content
IC - ion chromatography
m - molal (mol/kg)
MC - moisture content
MIP - mercury intrusion porosimetry
MRI - magnetic resonance imaging
NMR - nuclear magnetic resonance
RF - radio frequency
RH - relative humidity
RHeq - relative equilibrium humidity of a salt solution
RHeqsat - relative equilibrium humidity of a salt; corresponds to the relative equilibrium humidity
of a saturated solution of that salt
S/N - signal/noise ratio in MRI techniques
Stage I - first stage of the drying process of a porous material
Stage II - second stage of the drying process of a porous material
Stage III - third stage of the drying process of a porous material
T - temperature
WAC - water absorption coefficient
XRD - X-ray diffraction

Glossary of Symbols
Latin
a - amount of hygroscopic moisture absorbed, in equilibrium conditions, by a sample of salt
with unitary mass
A - water absorption coefficient (WAC)
aw - water activity
b - amount of hygroscopic moisture absorbed, in equilibrium conditions, by a sample of a
porous material with unitary mass
B - capillary penetration coefficient
B0 - strength of the main magnetic field used in NMR techniques
B1 - secondary oscillating magnetic used in NMR techniques
c - solute concentration in a supersaturated solution
cs - solute concentration in a saturated solution
cv - concentration of water vapour
d - penetration of the meniscus in a capillary
D - coefficient of ion diffusivity in a porous medium
dr - drying rate
Dv - diffusion coefficient or diffusivity (of water vapour in a porous material)
E - HMC of a salt at the set-point RH in a climatic chamber
E – - HMC of a salt at the minimum RH attained in a climatic chamber
E + - HMC of a salt at the maximum RH attained in a climatic chamber
f - Larmor frequency; resonance frequency of nuclei in NMR techniques
G - magnetic gradient used in NMR techniques

XXX Glossary of symbols
g - gravitational constant
Gx - x-axis component of G
Gy - y-axis component of G
h - hydraulic head
H - height of capillary rise
H0 - height of capillary rise in equilibrium conditions in a cylindrical capillary
HMC - HMC of a sample; given as a percentage by weight
HMC– - HMC of a sample at the minimum RH attained in a climatic chamber
HMC+ - HMC of a sample at the maximum RH attained in a climatic chamber
HMCe - HMC of a sample at the set-point RH in a climatic chamber
j - water vapour diffusion flux across a porous material
K1 - unsaturated permeability coefficient or liquid conductivity (across a porous material)
L - length
l - distance
m - molality of the solution (concentration expressed in number of moles of solute per litre of
solvent)
M - molar mass
M - net magnetization; vector sum of the magnetic moments of all protons in a sample
mdry - dry mass
mi - mass of a sample at a given weighing i
mmat - dry mass of a sample of a porous building material
ms - mass
msalt - dry mass of a salt sample
Msalt - molar mass of a salt
Mw - molar mass of pure water
p - water column weight
pc - capillary suction, capillary pressure or suction stress
pcr - pressure on the loaded face of a growing crystal

Glossary of symbols XXXI
Pe - Péclet number
pl - ambient pressure
pv - partial pressure of water vapour in air
pvi, pve - partial pressures of water vapour in air at the two sides (interior and exterior) of a given
element
Q - amount of hygroscopic moisture in a sample of salt or porous material
Qeq - amount of hygroscopic moisture that forms a saturated salt solution
r - radius of capillary
R - ideal gas constant (8.3145 MPa.cm3.mol
-1.K-1)
RH- - minimum RH in a climatic chamber
RH+ - maximum RH in a climatic chamber
RHe - set-point RH in a climatic chamber
S - amplitude of the NMR spin-echo signal
s’ - thickness of air layer
t - time
T - absolute temperature
T1 - spin-lattice relaxation time in NMR techniques
T2 - spin-spin relaxation time in NMR techniques
TE - echo-time in NMR techniques
TR - repetition time in NMR techniques
u - density of the liquid flux across a porous material
Vc - molar volume of a solid crystal
W - total amount of liquid water absorbed by a porous material
w0 - positive intercept of the absorption curve of a porous material on the Y axis
x - salt content in a sample; given as a percentage by weight
xcrit - maximum salt content in a sample for which the mass variation of the sample due to
fluctuation of the RH in a climatic chamber is equal to a percentage β of the dry mass of
the sample
z - gravitic potential or distance to the ground

XXXII Glossary of symbols
Greek
α - parameter expressing the relevance of the possible error due to the uncertainty
associated to HMC measurements in a climatic chamber or salt content estimates by
the HMC method
α (Annex I) - radial axis of changeable direction; radial profiles are measured in the direction of α
by the 2D MRI technique
β - percentage of the dry mass of a sample used as criterion for considering that
equilibrium was achieved, typically, within a drying process
γ - gyromagnetic ratio of nuclei
δ - diffusion coefficient of water vapour in air
∆m - mass variation between consecutive weighings of a sample
∆p - crystallization pressure
∆x - uncertainty associated to the measurement of the salt content x in a sample
η - dynamic viscosity of water
θ - water content
θm - water content at capillary saturation
µ - water vapour resistance of a porous material
νννν - stoichiometric parameter; corresponds to the number of moles of ions produced when
a mole of solute molecules is dissociated
Π - water vapour permeability of a porous material
Πair - diffusion coefficient of water vapour in air
ρ - bulk density of water
ρ (Annex I) - density of the nuclei in a sample subjected to NMR measurements
σ - surface tension of a liquid
φ - contact angle liquid / pore wall

Glossary of symbols XXXIII
φ (Annex I) - rotation angle for measuring radial profiles by the 2D MRI technique
φ - osmotic coefficient
ψ - capillary potential


Chapter 1 – Introduction
“A experiência é a madre das coisas e por ela soubemos radicalmente a verdade”
(Because experience is the mother of things, by it we discovered the very root of
truth) Duarte Pacheco Pereira, in Esmeraldo de situ orbis, 1505-1508.
1.1 Motivation and scope
Soluble salts can cause major damage to porous materials in man-made constructions and
geological outcrops. In buildings, soluble salts cause aesthetical problems, degrade health
conditions in rooms and often require high-cost recurrent repairs. In extreme situations,
soluble salts may endanger the structural safety of old constructions. A progressive and
widespread loss of historic material is another, unfortunately common, consequence.
Fig. 1.1 - Two typical salt-damage
patterns. Left: efflorescence and
damage to paint, temporary
exhibition gallery, south wing of
Alcobaça Monastery, 2002. Right:
sanding of lime plaster and of the
lime bedding mortar leading to
masonry disintegration, Paulistas
tide-mill, Corroios, 2004.
Salt damage (Fig. 1.1) originates from ions (chloride, sulfate, nitrate or others) that migrate,
dissolved in liquid water, in the pore network of building materials. Salt crystallization can
occur mostly as a result of evaporative processes or temperature changes that cause these
solutions to supersaturate.
Salt decay is today considered one of the main weathering processes of porous construction
materials (Goudie and Viles 1997, Harris 2001, Scherer 2006a) and it is especially relevant
in old buildings, i.e., those built before the use of Portland cement. Several factors can
account for this particular relevance of salt decay in old buildings (Gonçalves 2003b, for
instance):

2 Chapter 1
• Salts and water - Soluble salts are commonly more active in old buildings because:
(i) most of these buildings are based on thick solid walls made of porous hydrophilic
materials that favour the ingress and permanence of water and salt solutions in their
pore network; (ii) the walls were normally built in direct contact with the ground, thus,
rising damp is a common feature; (iii) salts and moisture from different origins often
accumulate in the masonry over the years, namely during periods of constructive
deterioration (roof damage, masonry cracking, etc.).
• Physical medium - Salt decay progresses faster in old masonry because these are
currently based on lime mortars which are mechanically weaker than the porous
materials in new buildings.
• Structural impact - Salt damage may have more serious consequences in old buildings
where the walls often have a structural function and, hence, masonry damage may
eventually lead to structural collapse of the building.
• Historic relevance - Many old buildings have a high historic value. Hence, whether they
are single monuments or part of architectural assemblies, they should be preserved for
future generations, as stated in the “Venice Charter” (ICATHM 1964). In contrast with
current buildings, the concept of service life does not therefore apply to historic
buildings. They should be preserved into a non-dated future.
• Artistic relevance - Old buildings often include valuable sculptures or other artistic
elements that can be lost or damaged by soluble salts.
Evaporation-induced crystallization is probably the most common case within salt decay
processes. This is why plasters and renders play a key role in these processes. In fact:
• Plasters and renders are the surface layers of walls. They condition the exchange of
moisture between the masonry and the environment and, hence, strongly influence
moisture migration and drying processes in the entire masonry. Therefore, they may
determine salt decay processes and features, as will be discussed in this thesis.
• Along with a sanitary or aesthetic role, plasters and renders had (and have) a main
sacrificial role: they protect the masonry from destructive actions such as those from
wind, rain, human action or salt crystallization. Indeed, plaster/render damage is not as
harmful as (structural) masonry damage. Furthermore, it is much easier to repair.
Because damage by salt crystallization usually starts at the surface of walls and
progresses as the superficial layers are destroyed, plasters and renders minimize the
occurrence of masonry damage. This is probably one of the reasons why, in many
countries such as Portugal, plasters and renders were normally used on (weaker)
ordinary masonry, currently made from irregular stone elements and lime-based
bedding mortar (Leitão 1896), and less used on (stronger) ashlar masonry. Segurado
(1908), for instance, argues that plastering/rendering of ordinary masonry is
indispensable.
Due to the high number of buildings affected by salt decay features, as well as to the
harmfulness and complexity of such processes, more and more researches are carried out in
the subject involving chemists, physicists, geologists and engineers. However, despite of
many advancements made, several fundamental aspects of salt decay processes are not yet
fully understood, more specifically, the (micro-scale) damage mechanisms, salt-induced
dampness or the (macro-scale) behaviour of building elements. Accordingly, adequate
strategies of prevention or mitigation are often lacking (Harris 2001, Scherer 2006a).

Introduction 3
The behaviour of plasters and renders in relation to salt crystallization is one of the topics
where further research was needed. In Portugal, for example, end-users complain that salt
decay is often aggravated after restoration interventions on plasters/renders. Further, despite
their relevance in salt decay processes, no standard crystallization tests exist for plasters
and renders, in contrast to other materials such as stone or brick. The need for research on
this topic justified the launch of the European project, COMPASS - Compatibility of plasters
and renders with salt-loaded substrates in historic buildings. Some of the work presented in
this thesis, namely in sections 3.4, 3.5, 5.5 and 6.2 to 6.4, was carried by the author under
the framework of the COMPASS project.
1.2 Aims and objectives
This thesis aims at understanding the behaviour of plasters and renders on salt-loaded walls.
Its main objectives are the following:
• To assess the possibilities and limitations of two general laboratory techniques, for
relative humidity (RH) control using salt solutions and for salt content determination by
means of hygroscopic moisture content (HMC) measurements, in order to decide
whether and in which conditions they can be adequate experimental tools.
• To gain further understanding of the drying features of salt-loaded masonry, namely, the
influence that soluble salts have on drying of porous materials, on salt distribution during
drying and on salt-induced damp mechanisms.
• To investigate the possible influence that factors, such as the type of salt, presence of a
paint layer, type of substrate material, use of water-repellent additives or the material
saturation conditions have on the behaviour of plasters and renders in relation to salt
crystallization.
• To assess the possibilities and limitations of a given crystallization test as a performance
test for plasters and renders.
• To identify factors that may account for sodium chloride, which is frequently involved in
real decay processes but in laboratory crystallization tests is normally much less
damaging, or even completely innocuous, than salts such as sodium sulfate.
• To understand the nature and causes of some serious salt decay problems in old
Portuguese buildings, specifically as regards the type of salts and sources of moisture.
• To compare the possibilities and limitations of expertise-based diagnostic methodologies,
that rely mostly on visual inspections, and those based on physical/chemical testing.
• To test the application technique and performance of three industrial plasters available on
the Portuguese market for salt-loaded walls.
• To identify chief factors that can account for the worsening of dampness and decay
problems after restoration interventions on plastered/rendered buildings
• To provide guidelines for selecting plasters and renders for moist salt-loaded walls.

4 Chapter 1
1.3 Outline of the thesis
This thesis was structured into seven different chapters and three annexes. The first chapter
is the present introductory chapter. The remaining six chapters and annexes address the
following subjects:
• Chapter 2 concerns the current state-of-the-art and state-of-the-practice in salt decay
pathology and mitigation processes. There is particular focus on old plastered/rendered
buildings and on the situation in practice in Portugal. The state-of-the-art is assessed by
means of a review of published scientific literature. The state-of-the-practice is approached
mostly on the basis of interviews with Portuguese end-users and of a survey of the
Portuguese market regarding industrial products for moist salt-loaded walls.
• In Chapter 3 the possibilities and limitations of two general laboratory techniques are
evaluated. The method of RH control by salt solutions is discussed on the basis of
experimental research on sodium chloride. The HMC method for salt content determination
is assessed by means of both theoretical and experimental research on nine different salts.
• Chapter 4 concerns the drying behaviour of salt-loaded materials. This research is mostly
based on drying experiments monitored by a 2D (two-dimensional) MRI (magnetic
resonance imaging) technique.
• Chapter 5 discusses the behaviour of plasters and renders in relation to salt crystallization.
Five different sets of crystallization tests or drying tests monitored by the same 2D or by a
1D (one-dimensional) MRI technique are presented and serve as a basis for: (i) assessing
the influence of various factors such as the type of salt, nature of the substrate material,
presence of a paint layer, material saturation condition or use of mass water-repellent
additives (ii) identifying different factors that can account for an aggravation of salt decay
problems after restoration interventions; (iii) examining the possibilities and limitations of
using salt crystallization tests to predict the performance of plasters and renders on salt-
loaded walls; (iv) discussing how to choose plasters and renders for salt-loaded walls.
• Chapter 6 presents the five case studies investigated within this thesis: Salvas Chapel
(Sines), Alhos-Vedros tide-mill (Moita), Despacho House (Pereira), Cloister of
Sta. Clara-a-Nova Monastery (Coimbra) and São Sebastião Church (Almada).
Site inspections and a systematic sampling/testing procedure were used to assess the
nature and causes of the decay in these buildings. On the basis of this field research, some
factors, additional to those discussed in Chapter 5, that may account for an aggravation of
salt damage after restoration interventions are discussed. Further, a comparison between
expertise-based and sampling/testing-based diagnostic methodologies is made. Finally, the
application technique and performance of industrial rendering systems for salt-loaded walls
are evaluated by means of test panels made in São Sebastião church.
• Chapter 7 presents the overall conclusions achieved, focusing on the aims and objectives
of the thesis. A summary of the work performed and the main topics on which further
research is needed are also presented in this final chapter.

Introduction 5
• In chapters 3, 4 and 5 background information on specific topics such as hygroscopicity,
moisture transport, sorption and drying of porous materials or salt crystallization tests is
presented to allow a better understanding of the main subjects addressed in each chapter.
• Annex I introduces the principles of MRI and presents the 1D and 2D techniques used.
• Annex II describes the making of the test specimens used in set 1 tests of Chapter 5.
• Annex III includes the damage assessment and diagnosis form used for guiding the
inspections of the case studies presented in Chapter 6.
• A glossary of initials, acronyms and abbreviations and a glossary of symbols are included
in the thesis immediately before the present chapter.
1.4 Delimitations of scope and key-assumptions
This thesis deals with salt decay in plasters and renders. Plasters and renders are here
defined as mortar-based coverings used on the interior and exterior, respectively, of
buildings. Even in the cases where, as a simplification, only plasters are mentioned, all the
work presented in the thesis concerns and is applicable to both types of coverings.
Salt decay is a weathering process arising from the presence of salt crystals on the surface
of porous materials (efflorescence) or from mechanical stresses introduced by salt crystals
deposited in the material pores (subflorescence). In a broad sense, salt decay may also refer
to salt-induced dampness features. Other processes, such as those primarily based on
chemical reactions between soluble salts and building materials, are not covered. In this
thesis, “salt damage”, “damage by soluble salts”, “damage by salt crystallization”, “salt
weathering” or related terms refer to salt decay processes, as defined above.
Damage by soluble salts is particularly current and harmful in old buildings, as stated in
section 1.1. Therefore, although many topics and conclusions in this thesis are also
applicable to recent buildings, by default, the case of old buildings is addressed.
Salt decay requires the simultaneous presence of soluble salts and moisture in the porous
material. Although this moisture may have different origins (Massari and Massari 1993, for
instance), rising damp is probably the most frequent and perhaps one of the hardest to solve
sources of moisture in old buildings. Hence, in this thesis, rising damp is considered the
default case. Unless otherwise specified, moisture is assumed to be due to rising damp.
Salt crystallization may arise from temperature changes for salts whose solubility varies with
temperature. It may also arise from the contact between the salt solution and pre-existing salt
crystals when these correspond to phases with different solubility. As will be explained in the
following chapters, both processes may take place, for instance, with sodium sulfate. They
can be very relevant in laboratory tests where the material is subjected to high temperatures
or wet-dry cycles ranging from moistness to dryness. In buildings, however, evaporative
crystallization is likely to be the most relevant process. Therefore, in this thesis, this will be
the mechanism considered by default and focused in greater detail.

6 Chapter 1
Salt ions generaly migrate in porous materials by advection, that is, carried by the flowing
liquid water. Yet, ion diffusion in the liquid phase can also take place due to gradients of ion
concentration. For instance in evaporative processes, ion concentration increases at the
drying front and, hence, a backwards migration of salt can arise which tends to minimize the
concentration gradient. As it will be explained latter, ion diffusion can be relevant for very low
liquid fluxes. In the experiments in this thesis, ion diffusion will not in general be considered
due to the short time periods involved and because no evidence was found that it had any
relevancy.

Chapter 2 – Research and practice: current situation
2.1 Introduction
Since the first crystallization tests on stone carried out by Brard for simulating the disruptive action of ice (Thury 1828) salt crystallization has been progressively recognized, at a scientific level, as a specific damage process. Today it is considered one of the most powerful decay mechanisms of porous materials in man-made constructions and geological outcrops. Salt decay has been attracting more and more attention from the scientific community, especially over recent decades, as demonstrated by the growing number of research articles and by some general reviews on the subject (Evans 1969-1970, Charola 2000, Doehne 2003, Rodrigues and Gonçalves 2005). But, despite the great deal of progress made, it is still one of the least understood deterioration mechanisms of porous building materials (Rodrigues 1991, Scherer 2006a). Despite the lack of comprehensive scientific explanations, salt decay is something that practitioners, particularly those working with old buildings, have to deal with currently. In fact, damage by salt crystallization has long been known, as shown by Herodotus’ (484 B.C. - 425 B.C.) observation that “salt exuded from the soil to such an extent as even to injure the pyramids”. In many constructions, especially those composed of weaker masonry of lime mortar and stone or brick, plasters and renders were traditionally used as sacrificial layers for protection against damaging actions, namely, salt crystallization. Salt decay was typically handled by means of assiduous maintenance that included repainting, localized repairs and periodic replacement of plasters and renders. This situation progressively changed after the industrial revolution. New materials appeared which behave differently when used in moist and salt-loaded walls, namely cement-based mortars and emulsion paints. More demanding, health and aesthetical, requirements arose both from higher living standards and from the increasing interest in the conservation of old buildings. Decay caused by salts from cement-based materials, conservation treatments or air pollution became often more relevant than that caused by salts from natural sources such as the soil or seawater. In fact, although the care of old buildings was one of the driving motivations for scientific research in the field (Jokilehto 1999), conservation interventions were eventually found to be a frequent cause of damage. Further, severity of material durability requirements increased not only because better performances were expected by

8 Chapter 2
more demanding end-users but also because of the higher labour costs associated with repair and maintenance work. Traditional knowledge in construction techniques could no longer respond to the new situations and was gradually lost from generation to generation. Today, as scientific knowledge on salt decay slowly progresses, end-users are forced to solve practical decay problems. The building material industry, through a combined scientific and empirical approach, tries to respond to the needs of end-users. Special plasters and renders have been developed that are aimed at being more durable or at presenting specific performance features, such as preventing the occurrence of surface damage. This chapter is aimed at giving an overview of the present situation of salt decay theory and practice focusing particularly on the case of plasters and renders for old buildings. The state-of-the-art is discussed in section 2.2 and the state-of-the-practice in section 2.3.
2.2 State of the art
2.2.1 - Salt decay pathology
Salt decay requires the simultaneous presence of soluble salts and water in the pores of building materials, as well as appropriate environmental conditions. Although these deterioration processes are very complex, the general pathology can be described (Fig. 2.1):
Efflorescence Subflorescence Cause
Predisposing factors
- simultaneous presence is required
- type and quantity condition decay process
-
Adjuvant factors - condition the
occurrence of damage - influence decay
prossess
Physical medium it’s characteristics influence the process of decay
Soluble salts
Porous building materials
Water Environmental
conditions
Salt decay
Signs
Decay patterns: efflorescence, staining,
dampness, sanding, powdering, cracking, etc.
Anomalies
Poor health conditions, aesthetical damage, loss of historic material, reduced mechanical resistance of
materials and building elements, etc.
Fig. 2.1 - Salt decay pathology

Research and practice: current situation 9
There are three main types of factors underlying salt decay processes as seen in Fig 2.1: (i) the predisposing factors, soluble salts and moisture, without which damage cannot occur; (ii) a physical medium, that is, the porous material where the process takes place; (iii) adjuvant factors which condition the occurrence and influence the process, thereby determining the damage patterns. The cause of salt decay, which arises from the joint influence of these three types of factors, is the occurrence of salt crystals either on top (efflorescence) or inside (subflorescence) the porous material. In evaporative crystallization processes, crystals precipitate at the drying front where the solute evaporates and, hence, the solution concentration increases up to (or above) the maximum solubility of the salt. In such processes, the drying front tends to find a position that corresponds to equality between the liquid and vapour fluxes that cross the material to and from that front, respectively. Efflorescence occurs when the liquid flux is high enough to compensate the evaporative demand. In that case, the liquid is able to reach and evaporate on the outer surface of the material. Subflorescence takes place when the liquid flux is lower than this and, hence, the drying front is located inside the material. Building anomalies caused by salt crystallization can manifest as a wide range of signs (Fig. 2.1). These anomalies can configure three different types of damage: material damage, aesthetical damage or damage associated to the presence of moisture. Subflorescence can induce internal stresses that overcome the mechanical strength of the porous material and, hence, cause it physical damage. Efflorescence does not constitute or cause material damage, though it may account for aesthetical or dampness problems. However, efflorescence can be redissolved, then reabsorbed into the material and eventually recrystallize as subflorescence.
2.2.2 - Signs
Common damage patterns of porous building materials are described in Normal 1/88 (ICR and CNR 1988) which was recently re-published as UNI Standard 11182 (UNI 2006). A “damage atlas” focusing specifically on damage patterns of plasters and renders was drawn up within the COMPASS project (TNO 2002). Some examples of common salt decay patterns are shown below in Fig 2.2. These were observed on traditional plastering / rendering systems during preliminary inspections carried out within this thesis on 31 buildings and monuments. Other patterns will be presented in Chapter 6 when describing the five case-studies selected out of these 31. The damage patterns in Fig. 2.2 occur when soluble salts crystallize on or close to the surface of the wall and, thereby producing efflorescence, dampness problems or physical damage to the surface layer of the plaster or render. But salts may also deposit deeper in the wall. In this case, damage may arise without being immediately visible as, for instance, detachment of plaster/render coats from each other or from the substrate. This sort of damage can often be detected, even while there are no visible signs of it, simply by tapping the surface: a hollow sound indicates that detachment has occurred.

10 Chapter 2
(a) Efflorescence – New See basement, Coimbra, 2003
(b) Salt-damp – Cloister of Sta. Cruz Monastery, Coimbra, 2002
(c) Salt damp and staining – Alcobaça Monastery, 2002
(d) Paint peeling – building in the historic centre of Santarém, 2003
(e) Scaling of lime-wash / lime-render system – Torre das Cabaças,
Santarém, 2002
(f) Delamination (layering of material with laminated structure, in this case,
a render applied in different coats) – Tibães Monastery, Braga, 2002
(g) Exfoliation (layering of material with non-laminated structure, in this case, the surface coat of the
render) – Sta. Clara-a-Nova Monastery, Coimbra, 2005
(h) Sanding of render – Salvas Church, Sines, 2003
(i) Erosion – Arouca city hall library, 2002
Fig. 2.2 – Some common salt decay patterns of plasters and renders.
Damage pattern definition according to the Plaster Damage Atlas (TNO 2005).

Research and practice: current situation 11
When soluble salts crystallize in the pores of building materials they can have a cementing rather than a disruptive effect (Rossi-Manaresi and Tucci 1991). In this case, damage is not likely to arise straight away. However, the hardened surface layer tends to behave differentially, namely under thermal or hydric dilation processes, and can eventually detach. Alveolar (or honeycomb) decay is a particular pattern where numerous small cavities separated by hardened walls develop on the surface of the material. Though this sort of decay is also observed in hot deserts or Arctic landscapes, it seems to develop especially well in costal areas, particularly on the Atlantic coast (Goudie and Viles 1997, for instance) and on the spray zone above ordinary wave action level (Rodríguez-Navarro et al. 1999). Alveolar decay is typically observed in stone materials but it can also occur in rendering mortars, as seen in Fig. 2.3. However, despite its scientific interest, this type of decay will not be focused on this thesis because it is associated with long time periods. In fact, in contrast to stone materials, one of the main features of plasters and renders is their replaceability. Hence, though alveolar decay may be significant in very specific cases (for instance, archaeological ruins), it is not expected to be relevant in buildings subjected to periodic maintenance.
In plastered/rendered walls, salt decay patterns are typically observed on the plaster or render but, especially when those have already suffered extensive damage, can affect the masonry as well, as seen in the examples of Figs. 2.3 and 2.4.
Fig. 2.3 - Alveolar decay – building adjacent to a branch of the Tagus river, at less than 10 km from
the open sea, Alhos-Vedros, 2002
Fig. 2.4 - Masonry disintegration
– Paulistas tide mill, Corroios, 2004
2.2.3 - Moisture
Soluble salts originate from ions that are transported while dissolved in liquid water that migrates in the pore network of building materials. Liquid water can penetrate into these materials by different processes (Paiva 1969, Massari and Massari 1993, Henriques 1994, for instance):
- Construction humidity originates from the water used in the mixing of mortars or setting of bricks, from the use of materials previously exposed to rain or from specific processes such as water-jet cleaning.

12 Chapter 2
- Rising damp is ground moisture that rises up in the walls by capillarity.
It can be either phreatic water or rain water that penetrated into the soil surface
layers.
- Dew point condensation is another possible source of moisture. When humid air
comes into contact with colder surfaces its temperature drops and, in consequence,
its RH increases. If the absolute saturation humidity is exceeded, dew point
condensation can occur on the cold surface. Dew point condensation may also take
place inside masonry materials. Since the absolute saturation humidity varies with
temperature, it may be attained somewhere across a material subjected to a
temperature gradient.
- Hygroscopic moisture is attracted from the air. Both common building materials (such
as mortars, brick or stone) and soluble salts have hygroscopic properties. However,
soluble salts are much more hygroscopic. Accordingly, hygroscopic dampness can be
particularly severe when salts are present. The mechanisms of hygroscopicity will be
discussed in more detail throughout this thesis.
- Penetration of rainwater can take place through cracks, construction joints, damaged
roofs, etc.
- Moisture can also arise from accidental causes such as leaking of pipes or fouling of
gutters.
Liquid water is ordinarily present in old building materials. In fact, while in new buildings
dampness is typically acute but transitory and results mostly from poor construction, in old
buildings dampness is chronic by nature (Massari and Massari 1993). The major source of
moisture in these buildings is probably rising damp because, as pointed in the previous
chapter, old buildings are ordinarily based on thick solid walls built with porous hydrophilic
materials in direct contact with the ground. Further, old buildings often went through periods
of constructive deterioration that may have allowed penetration and further accumulation in
the masonry of moisture and salts. And, since soluble salts are common in these buildings,
hygroscopic damp occurs often. As for dew point condensation, its relevance as respects salt
decay processes in old buildings is mostly unknown.
2.2.4 - Soluble salts
Old masonry normally contains soluble salts. A large variety of salts can be found in these
walls, namely chlorides, sulfates, nitrates and carbonates of sodium, potassium, magnesium
or calcium (Arnold 1981). According to Goudie and Viles (1997), sodium chloride, sodium
sulfate, sodium carbonates and gypsum are particularly common.
Soluble salts can have different origins. In some cases they may have been involved in
complex chemical reactions (Arnold 1981) that impede tracing their sources. Nonetheless,
the type of salt is still the best indicator of its origin. Sodium chloride, for instance, often
arises from direct contact of the building materials with seawater, by marine fog, seawater
spray or contaminated groundwater. Sodium chloride may also come from salty goods once
stored in the building or even, due to human consumption of sodium chloride, from

Research and practice: current situation 13
groundwater contaminated by domestic residues (Arnold and Zehnder 1989). Groundwater
often carries nitrates produced by decomposition of organic materials, particularly in soils
treated with organic fertilizers. Nitrates may also be introduced by animal excrements and
tissues, for instance in buildings used as stables or colonized by pigeons, or by
microbiological activity in building materials. Sulfates, for instance of sodium, can also
originate from the soil (Schaffer 1932). Carbonate salts typically originate from high alkali
content materials, for example, cement-based mortars (Arnold 1981). The alkali hydroxides
in these materials react with carbonic acid (which results from dissolution of air CO2 in the
water in damp walls) and thereby transform into alkali carbonates. In polluted environments,
the alkali hydroxides (Arnold 1981) or the resulting alkali carbonates (Schaffer 1932) may
eventually form alkali sulfates by reaction with sulphuric acid from the atmosphere. Ceramic
materials may also carry salts into the masonry, namely sulfates of sodium or magnesium
(Schaffer 1932). The gypsum that composes many plasters may dissolve and migrate to
other masonry materials. Gypsum may as well form, in polluted atmospheres, by reaction of
sulphuric anhydride (SO3) in the air with calcium carbonate in calcareous stones or lime
mortars. Further, many other salts and salt origins are possible in old buildings.
Soluble salts crystallize mostly as a consequence of evaporative processes or temperature changes. In this context, the two fundamental characteristics of soluble salts are their solubility and relative equilibrium humidity. Solubility is the ability of a salt to dissolve, in this case, in water. It may be expressed quantitatively as the maximum amount of salt that can be dissolved at a certain temperature. When the water contained in a dilute salt solution evaporates, the concentration of the solution increases. If the concentration that corresponds to the maximum solubility (or simply “solubility”) of the salt is exceeded, the salt in excess can crystallize. Crystallization may also arise from temperature changes in the case of salts whose solubility varies with temperature. In both cases, crystallization may not occur readily because salt solutions can supersaturate, that is, attain non-equilibrium states where a higher amount of solute is dissolved than that which can be held in equilibrium conditions. But all systems tend to equilibrium and, hence, crystallization will ultimately take place. The higher the supersaturation of the solution the higher the tendency of the salt to crystallize. The maximum supersaturation that salt solutions can reach under certain conditions is called the metastable limit (Strege 2004, for instance). At this point crystallization occurs readily. Salt crystallization from solution proceeds in two main phases. In the first phase, the nucleation phase, very small crystals are formed, often randomly. These nuclei grow during the subsequent crystal growth phase. Nucleation occurs more easily in the presence of the so-called "seeds" (for instance, solid dust particles) than in homogenous solutions. Therefore, the presence of seeds may strongly condition the ability of a salt solution to supersaturate. The relative equilibrium humidity (RHeq
sat) of a salt corresponds to the RH below which the solid crystal is in equilibrium with air at a certain temperature. When the environmental RH attains this value, the crystal attracts moisture from the air and ultimately dissolves forming a saturated solution. Above the RHeq
sat of the salt, the higher the air RH the more dilute the resulting salt solution. At 100% RH, salt solutions tend to become infinitely diluted.

14 Chapter 2
Conversely, when a salt solution is exposed to an RH lower than the RHeq
sat of the salt, all the salt in that solution eventually crystallizes while the solvent (water) is evaporated. Many soluble salts possess different equilibrium crystal phases for distinct conditions of temperature or RH. Some salts can even exist in non-equilibrium (metastable) crystalline phases which, although they tend to transform into the equilibrium phase at that temperature and RH, can be stable for long periods. The different phases of a salt or salt solution and the conditions under which each phase exists are expressed in the so-called phase diagrams. In such diagrams, lines of equilibrium (phase boundaries) are used to represent the phase transitions that the substance may undergo. Phase diagrams can address numerous types of parameters and properties. In the present case, there are two types of phase diagrams that can be of interest: (i) solubility phase diagrams (Figs. 2.6 and 2.8) where the solution concentration is plotted against the temperature; phase boundaries are used to represent the solubility of the possible crystal phases; (ii) RH-temperature phase diagrams (Figs. 2.7 and 2.9) that express the environmental conditions under which the salt is stable as a certain crystalline phase or as solution; phase boundaries represent the transition between the possible phases. Strictly, phase diagrams concern equilibrium situations. Yet, for practical reasons, non-equilibrium features are often included, usually as dashed lines, such as the solubility of metastable forms or supersaturation boundaries. Salt crystals may present different shapes, that is, different habits. They can be acicular (needle-like crystals), fibrous (hair-like crystals), equant (with nearly equal dimensions), etc. Habits do not depend exclusively on the internal structure of the crystal. They are influenced also by the conditions under which the crystal grows, for instance the environmental conditions (Bloss 1971, for example). When a salt is dissolved in water it forms an electrolyte solution or, simply, electrolyte. An electrolyte contains free ions and is able to conduct an electric current. Indeed, when a soluble salt is mixed in water, its ions are chemically dissociated because water molecules have stronger (covalent) bonds than the salt molecules (ionic) bonds. Building materials rarely contain a single type of salt. Normally a mixture of different salts occurs. The properties of mixed salt solutions cannot generally be predicted by weighing the properties of the individual salts due to the mutual interaction between the dissolved ions. Only in very dilute solutions can that interaction be neglected. The RHeq
sat of salt mixtures, for instance, arises not as a single value but as a range of values that do not necessarily fall within the limits of the RHeq
sat of the individual salts (Price and Brimblecombe 1994). Also the solubility of the salts may change in the presence of other salts. As summarized by Charola (2000), in general: (i) if two salts do not have any ions in common, the solubility of both salts increases due to the higher ionic strength of the solution; the less soluble salt has a higher solubility increase; (ii) if two salts have an ion in common, their solubility decreases; the less soluble salt has a higher solubility decrease.

Research and practice: current situation 15
Sodium sulfate and sodium chloride are amongst the most common salts in decayed buildings. Moreover, these are the salts generally used in laboratory crystallization tests. Since they were also the salts used in the experiments for this thesis, a more detailed description of their properties will be presented here. Sodium chloride (Figs 2.6 and 2.7) is perhaps the simplest and best known of all soluble salts involved in the decay of old buildings. Above 0ºC, sodium chloride possesses only one crystalline form, the anhydrous halite (NaCl). The solubility of sodium chloride practically does not vary with the temperature. Normally, sodium chloride does not reach high supersaturations and, hence, it readily crystallizes at a concentration of around 6 molal.
0
20
40
60
80
0 2 4 6 8 10
Concentration (m)
Tem
pera
ture
(ºC
)
NaClSolution
1
1 - Solubility of halite
0
20
40
60
80
100
0 20 40 60 80
Temperature (ºC)
RH
(%
)
NaCl
NaCl (aq)
Fig. 2.6 – Solubility diagram of sodium chloride.
Data from Steiger (2006).
Fig. 2.7 – RH/T phase diagram of sodium
chloride. Data from Steiger (2006).
Conversely, sodium sulfate (Figs. 2.8 and 2.9) is probably one of the most complex salts involved in salt decay processes. It can form three distinct crystalline phases, can easily supersaturate and its solubility is highly temperature dependent. The stable phase in contact with a saturated solution of sodium sulfate is mirabilite (Na2SO4.10H2O) or thenardite (Na2SO4) for temperatures below or above 32.4ºC, respectively. The heptahydrate (Na2SO4.7H2O) may also exist below 32.4ºC in contact with a saturated solution but it is not an equilibrium form, that is, the solution is supersaturated with respect to mirabilite. The RH-temperature diagram of sodium sulfate was recently (re)calculated by Linnow et al. (2006). As seen in Fig. 2.9, the only stable phase in the air above 32.4ºC is thenardite. Below 32.4ºC the three crystal phases are possible. For instance at the ordinary temperature of 20ºC, thenardite is the stable phase below 77% RH (and not 71%, as previously accepted) and mirabilite is stable between 77% and 95.6% HR (and not between 71% and 93.6%, as previously accepted). Therefore, in drying processes, mirabilite can change into thenardite when the air RH is of 77% or less. Yet, thenardite solubilises only at 87% RH (and not 82%). Thus, in absorption processes, thenardite will probably only change into mirabilite when the air RH is of 87% or more. This is expected to happen because the hydration of sodium sulfate does not consist of direct absorption of moisture by the anhydrous phase but rather of dissolution of thenardite and its reprecipitation as mirabilite (Charola and Weber 1992, MacMahon et al. 1992, Rodriguez-Navarro et al. 2000). The heptahydrate can form between

16 Chapter 2
77% and 95.6% RH but, since it is a metastable phase, it may transform into mirabilite at any time. The RHeq
sat of mirabilite is 95.6% RH, therefore, in equilibrium conditions above this RH, a liquid solution of sodium sulfate exists.
0
10
20
30
40
50
0 1 2 3 4Concentration (m)
Tem
pera
ture
(ºC
)
hjgfh
Solution
1=solubility of mirabilite
2=solubility of the heptahydrate
3=solubility of thenardite
4=thenardite / mirabilite boundary
Temperature (ºC)
RH
(%
)
(a) deliquescence-crystallization of mirabilite
(b) hydration-dehydration (c) deliquescence-crystallization of thenardite Light grey - metastable branch
Fig. 2.8 – Solubility diagram of sodium sulfate. Adapted from Rodríguez-Navarro et al. (2000).
Fig. 2.9 – RH/T phase diagram of sodium sulfate. From Linnow et al. (2006).
2.2.5 - Damage mechanisms
Soluble salts can cause three main types of damage to porous building materials: aesthetical
damage, damage associated to the presence of moisture and material damage.
Aesthetical damage arises from the presence of efflorescence but can be associated with the
two other types of damage, material damage and salt damp.
Dampness problems (Figs. 2.2 b and c) often arise from the presence of soluble salts in
building materials. Although the mechanisms of salt damp are not fully understood (Harris
2001, for instance), hygroscopicity is generally pointed out as the cause of many of these
problems (Massari and Massari 1993, Henriques 2006). In fact, the high hygroscopic
absorption of soluble salts and the low RHeqsat of some salt species (for example, at 20ºC,
75% RH for sodium chloride or even 33% RH for magnesium chloride) allow the absorption
of high amounts of moisture from the air at relatively low RH.
Material damage, such as that in Figs. 2.2 d) to e), can occur when salts crystallize and
thereby introduce internal stresses in the pore system of building materials. The following
discussion in this and in the next section refers, by default, to this sort of damage.

Research and practice: current situation 17
It is generally accepted that material damage occurs when a confined crystal grows against
the pore walls. This can happen when, due to repulsive forces between the crystal and the
porous material, a film of solution interposes between the crystal and the pore wall. The
higher the supersaturation ratio of this solution, the higher the pressure exerted by the
growing crystal. This was first expressed by Correns’ equation (Correns 1949):
==∆
sc
lcrc
c
V
TRppp ln- Eq. 2.1
In this equation, ∆p (MPa) is the crystallization pressure, pcr (MPa) the pressure
on the loaded face of the growing crystal, pl (MPa) the ambient pressure, T (K) the absolute
temperature, Vc (cm3. mol-1) the molar volume of the solid crystal,
R (8.3145 MPa.cm3.mol-1.K-1) the ideal gas constant, cs the solute concentration in a
saturated solution and c the solute concentration in the supersaturated solution.
The subject of crystallization pressure is still largely under discussion. After Correns’, other
equations have been proposed, as summarized in the recent literature review by Steiger
(2005a). The main objection to Correns’ or similar theories comes from the fact that, in
mechanical equilibrium conditions, when a film of solution surrounds the crystal, the pressure
exerted on the pore walls depends on the curvature of the crystal. In that case, megapascal
pressures sufficiently high to damage porous building materials could only develop in very
small pores, smaller than around 100 nm (Scherer 2006a), which contradicts reality (Scherer
2004, Steiger 2005b). However, it is possible that Correns’ theory might be applicable to non-
equilibrium situations arising during drying processes where the liquid film is disrupted and
some solution is trapped in the gap between the crystal and the pore wall, which then would
act as a small pore (Scherer 2004).
Hydration pressure was for a long time considered a possible damage mechanism but some
practical evidences contradict this possibility. Firstly, many salts such as sodium chloride do
not possess hydrates in the normal temperature range. Secondly, hydration consists
probably of dissolution of the anhydrous phase followed by reprecipitation of the hydrated
phase, rather than of direct absorption of moisture by the anhydrous phase. This happens
with sodium sulfate (Charola and Weber 1992, MacMahon et al. 1992, Rodriguez-Navarro et
al. 2000), so, it is possible that the same occurs with other hydratable salts.
Other damage mechanisms were also considered to explain how salts damage porous
building materials, as reviewed and discussed by Charola (2000). Hydrostatic crystallization
pressure was once considered because the volume of a supersaturated solution is smaller
than that of the resulting crystal plus saturated solution. But the solubility of salts increases
with pressure. For this reason, it was argued that hydrostatic pressure could not generate
pressures high enough to overcome the mechanical strength of most building materials.
Some other damage mechanisms have also been proposed, such as shear stress by salt
films on pore walls (Pühringer 1983) or ion diffusion (Lewin 1990), but their validity was not
effectively demonstrated.

18 Chapter 2
Soluble salts have a cementing rather than a disruptive effect when the crystallization
pressure is lower than the mechanical strength of the material, as argued by Rossi-Manaresi
and Tucci (1991). In that case, damage is likely to arise later due to differential (thermal or
hydric) behaviour between the contaminated and the non-contaminated material.
The mechanism of hydric dilation, originally proposed by Snethlage and Wendler (1997), was the object of recent experimental research (Lubelli 2006). The author concluded that salt crystals (of NaCl, NaNO3 or KCl) may form a layer on the pore walls and thereby induce relevant hydric dilation during drying. In contrast, non-contaminated materials expand during wetting. Hence, shear stresses due to differential hydric dilation could develop between the contaminated and the non-contaminated material and induce damage such as scaling, bulging or spalling. There is, however, some disagreement with this model. Scherer (2006b) argues that crystallization pressure rather than hydric dilation could cause the expansion of salt-loaded materials during drying. Some salt could crystallize on the walls of the larger pores as the (initially saturated) salt solution evaporated from these larger pores. If salt crystals were to grow in the smaller pores, high stresses would be generated which could totally disrupt the material. However, if a film of solution remains on the mineral surfaces, then the smaller crystals would be unstable with respect to the larger ones, so ions would diffuse through the film and attach themselves to the larger crystals. Since this process takes time, there would be a transient stress (until the small crystals had all dissolved) that could cause the observed expansion. If the film of solution becomes discontinuous, then the stress would continue to be exerted in the small pores. At the same time, a film isolated under the crust of salt on the walls of the large pores could contribute to the expansion. The above considerations show that the mechanisms by which salts damage porous building materials are still far from established. Nonetheless, linear crystallization pressure seems to be today the most widely accepted mechanism (Scherer 2004, Steiger 2005a). The occurrence of material damage and its patterns depend largely on the depth at which salts crystallize. In evaporative crystallization processes salts deposit within the pores when the liquid flux towards the drying surface is not high enough to compensate the evaporative demand, as explained in section 2.2.1. Lewin (1982) argued that the process of salt-decay “is characteristically manifested in the form of a thin layer (around 1 mm thick) of the surface that lifts up in the form of a blister, peels outward as a spall, flakes off, or powders away”. Based on his own experimental work, he further postulated that “the necessary condition for the occurrence of this decay is the development of a steady state at the exposed surface, wherein the rate of evaporation of water via diffusion through a layer of the porous solid is balanced by the viscous flow of solution”. In this approach to salt decay mechanisms, ion transport is assumed to occur only by advection. Yet, in certain cases, ion diffusion may also play a role. The competition between advection and diffusion is expressed by the Péclet number Pe. For Pe << 1 diffusion dominates, whereas for Pe >> 1 advection dominates. In the case of a unidirectional drying experiment, Pe is given by Eq. 2.2:
D
LdrPe
m .
.
θ= (Eq. 2.2)

Research and practice: current situation 19
In this equation, dr (m3.m-2.s-1) is the drying rate, L (m) the length of the sample, θm (m3/m3)
the maximum fluid content by capillary saturation and D (m2.s-1) the coefficient of ion diffusivity in the porous medium. Equation 2.2 shows that the slower the transport of liquid towards the drying surface, the
higher the significance of the (backwards) ion diffusion. This means that, at very low drying
rates, ion diffusion may theoretically impede salt crystallization at the drying front.
2.2.6 - Influencing factors
Old masonry normally contains soluble salts and moisture. Although factors directly related
to these predisponent factors are certainly relevant, such as the kind and quantity of salt and
the amount of moisture, the occurrence and type of decay depends also, as depicted in Fig.
2.1, on other factors:
• Adjuvant factors, namely, the environmental conditions (air temperature, RH and
velocity, solar radiation, etc.);
• Physical properties of the porous medium where the process takes place.
Salt decay processes are indeed complex and still largely unknown. Rodriguez-Navarro and
Doehne (1999) argued that the intensity of damage and the damage patterns depend
fundamentally on the solution supersaturation ratio and on the location of crystallization
within the porous material. From these authors’ and others’ experimental work, several
influencing factors could be identified that are listed and discussed bellow. Most of those
works were carried on sodium chloride and/or sodium sulfate. Indeed, one of the issues
currently addressed in salt decay researches is the behaviour of sodium chloride versus that
of sodium sulfate. The reason for this interest is that, in laboratory crystallization tests,
sodium sulfate typically causes extensive damage to porous materials while sodium chloride
is often much less damaging or even completely innocuous. And, yet, sodium chloride is
often found to be involved in salt decay processes in real constructions.
Solution composition
The velocity of capillary transport in porous materials may differ for distinct liquids due to
changes in their viscosity, surface tension or contact angle with the material. Rodriguez-
-Navarro and Doehne (1999) sustain that, depending on the type of salt and solution
concentration, the capillary flow can be relevantly slower for some salt solutions (for
example, sodium sulfate in comparison to sodium chloride). Therefore, these solutions have
more difficulty in reaching the drying surface and, hence, a higher tendency to form harmful
subflorescence. Differently, Hall and Hoff (2002) argue that soluble salts do not alter
significantly liquid transport properties but that, in contrast, they can induce relevant vapour
pressure changes. They maintain that, because soluble salts depress the vapour pressure of
the liquid, a slower evaporation rate and, hence, an advancement of the evaporation front
towards the outer surface arises during drying. This suggests that the higher tendency of
some salt solutions to form subflorescence may arise from a faster evaporation rate rather
than from a slower liquid transport.

20 Chapter 2
The higher vapour pressure and, hence, faster evaporation of some salt solutions, for
instance sodium sulfate in comparison to sodium chloride, promotes higher supersaturation,
thus, higher crystallization pressure, hence, stronger damage (Rodriguez-Navarro and
Doehne 1999). This could also account for the higher destructive power of sodium sulfate in
laboratory tests.
Temperature-induced crystallization may occur for salts whose solubility is temperature
dependent. This is the case of Na2SO4 but not of NaCl, which configures another important
difference between the two salts. Mirabilite (Na2SO4.10H2O) is the stable phase of sodium
sulfate below 32.4ºC, not only in the air when the RH exceeds that corresponding to the
hydration of the salt but also when in contact with a saturated solution (MacMahon et al.
1992). Hence, if specimens filled at ambient temperature with a saturated solution are
subjected to a temperature drop, mirabilite, whose solubility increases with temperature
(Fig. 2.8), may readily crystallise. A similar effect was noticed early on by Brard who reported
(Thury 1828), regarding his Na2SO4 crystallization test, that “rocks which resist (…) the action
of solution saturated when cold, fall apart completely when exposed to the action of solution
saturated when hot”. Indeed, above 32.4ºC thenardite is the equilibrium phase of sodium
sulfate. Because the solubility of thenardite is mostly higher than the solubility of mirabilite
(Fig. 2.8), when the temperature falls, mirabilite tends to crystallize readily. Doehne et al.
(2002) indicates that temperature-dependence of salts solubility is one of the features that
may enhance crystallization damage in porous materials.
For salts that possess crystal phases with distinct solubility, such as sodium sulfate,
crystallization may occur simply when a saturated solution contacts with pre-existing crystals.
Doehne et al. (2002) indicates this as another feature that results in increased damage to
porous building materials. As suggested by Chatterji and Jensen (1989), Flatt (2002) or Tsui
et al. (2003), sodium sulfate damage in tests involving cycles of impregnation (at ambient
temperature) and drying (commonly in an oven) occurs during the impregnation stage due to
such an effect. This is, for example, the case of ASTM (2005) test for aggregates or CEN
(1999b) test for natural stone. In these tests, very concentrated or saturated solutions are
used, respectively. At the end of drying, which takes place at a high temperature in both
cases, the porous material contains thenardite because this is the equilibrium phase in the
air above 32.4ºC. Yet, below 32.4ºC the equilibrium phase in contact with saturated sodium
sulfate solution is mirabilite. Hence, when thenardite comes into contact with the solution
introduced at a new impregnation, a solution highly supersaturated with respect to mirabilite
results and crystallization may readily occur.
Salt crystallization growth patterns
By means of experiments on sodium sulfate and sodium chloride, Rodriguez-Navarro and
Doehne discovered that some crystals (mirabilite and thenardite) tend to precipitate inside
the solution, hence, making the occurrence of subflorescence more likely, while others
(halite) tend to precipitate at the air-solution interface. Thus, the formation of efflorescence is
more probable for sodium chloride, while for sodium sulfate subflorescence can more easily
occur.

Research and practice: current situation 21
Furthermore, the precipitation and growth rate of different crystals may vary under the same test conditions. In the experiments by Rodriguez-Navarro and Doehne, halite showed a slow rate of precipitation and growth. The slower the growth rate, the lower the crystallization pressure. This could also account for a low damage capability of sodium chloride. Some crystalline habits seem to be associated with more severe damage in porous materials. But all soluble salts can cause severe damage to porous building materials regardless of their equilibrium habits, as stated by Arnold and Zehnder (1985a, 1985b). These authors observed that habits different from the equilibrium ones commonly appeared on walls and argued that crystal morphology is mostly governed by the humidity of the substrate (Zehnder and Arnold 1989). According to them, equilibrium crystal forms are rare in efflorescence, nonetheless they may be found in bristly efflorescence or crusts on very wet substrates. In contrast, whiskers (needle or hair-like crystals) are a common habit for different salts in efflorescence growing on substrates with lower moisture content. Chatterji (2005) also stresses the importance of crystal habits. This author argues that needle-like habits and fast crystal growth are particularly damaging and partially interrelated features. He sustains that fast crystal growth from a highly supersaturated solution gives rise to needle-like crystals, fast growth at low supersaturation originates plate-like habits and slow growth from any solution yields equant crystals.
Environmental conditions Fast evaporation can induce the growth of subflorescence, rather than efflorescence, because the drying front tends to be located deeper in the material. Further, fast evaporation induces higher supersaturation, hence, higher crystallization pressure. The work of Chatterji (2005) suggests that a faster evaporation (hence faster crystal growth and higher supersaturation) gives rise to more damaging habits, namely, needle-like crystals. It is not completely clear to what extent this work contradicts that of Arnold and Zehnder who observed (1985b) that needle-like efflorescence often arises under slow evaporation conditions. The environmental conditions can cause direct precipitation of crystal phases able to generate greater crystallization pressures. In the case of sodium sulfate, for instance, a temperature above 32.4ºC may induce direct precipitation of thenardite, a phase able to generate greater crystallization pressure than mirabilite for equal supersaturation ratios. It is not clear whether precipitation of the heptahydrate, which can occur in metastable conditions bellow 32.4ºC, may cause damage. MacMahon et al. (1992) consider its formation extremely unlikely under all except laboratory conditions because crystallization of that metastable form requires a very rapid temperature drop and because it is unstable in the presence of mirabilite. Furthermore, Rijniers (2004) argues that this metastable phase is not able to produce crystallization-induced damage in porous materials because its solubility is independent of the pore size.
Substrate properties, namely, porosity and pore size distribution Schaffer (1932) observed that salt crystallization caused higher damage to stones with small
pores than to those with larger pores. Rodriguez-Navarro and Doehne pointed that salt
solutions are drawn from the larger to the smaller pores during drying. Hence, crystallization
occurs in the smaller pores, the larger pores acting as solution supply reservoirs.

22 Chapter 2
Yet, Scherer (2004) argues that crystallization may take place both in small and in large
pores: “under equilibrium conditions, where the crystal is surrounded by a film of solution,
high stresses are expected only in small pores, but when that film is discontinuous (as may
occur during drying), high stresses can arise even in large pores”. Indeed, salt crystallization
in large pores (diameter from 1 to 10 µm) was observed by Zehnder and Arnold (1989) within
laboratory tests on brick and mortar samples.
The material porosity and pore size distribution influence also the decay process at a
macroscopic level. Rodriguez-Navarro and Doehne argued that small-pored stones are more
susceptible to salt decay, to a large extent, because a different hydric flux balance arises
during drying: (i) liquid migration occurs more slowly in smaller than in larger pores; (ii)
smaller pores result in a larger surface area for evaporation, hence, in a higher evaporation
flux. Subflorescence occurs more easily in small-pored stones because drying is faster and,
thus, the drying front is located more deeply. Further, a fast evaporation rate can also lead to
higher supersaturations, thus, to stronger crystallization pressures. These flux differences
may also influence crystal habits, as explained above.
A faster evaporation rate from smaller-pored than from larger-pored stones was also
reported by Rousset-Tournier (2001). Moreover, she observed that, with no air velocity, the
evaporation rate from all the stones was always higher than from free water surfaces. This
suggested that the faster drying rate of the fine-pored stones was due to a higher effective
surface of evaporation arising, at least partially, from a higher curvature of the menisci in the
small pores.
The mechanical resistance of the material is also a relevant parameter because physical
damage occurs when the crystallization pressure exceeds this resistance. Indeed, the
stronger the material the less damage is the crystallization process able to cause.
2.2.7 - Working principles of plasters and renders
There are important differences between plasters/renders and other building materials as
regards salt crystallization. Firstly, plasters and renders are replaceable. Secondly, they often
have the role, which superimposes over their own preservation, of protecting the masonry or
adjacent elements from salt decay. Therefore, salt crystallization on or in plasters/renders is
not in itself a negative feature.
Failure of plasters and renders occurs when they divert salt solutions to adjacent elements,
introduce harmful salts into the masonry or present too low durability. But above all, plasters
and renders fail when they do not behave in accordance with their working principle. The
working principle of a plaster or render concerns the depth(s) at which salts are expected to
accumulate. Therefore, it conditions major use requirements such as the absence of damage
at the surface or in the masonry.

Research and practice: current situation 23
There are four main working principles (Wijffels et al. 1997, Vegès-Belmin et al. 2005,
Rodrigues et al. 2005) which are expressed in Fig. 2.10 as concern evaporative
crystallization processes:
a) Salt-transporting plasters and renders transport liquid solutions towards the outer
surface of walls. Therefore, efflorescence may easily form. This behaviour is
expected, for example, from traditional air lime plasters and renders.
b) Salt-accumulating plasters and renders allow penetration of liquid solutions from the
substrate but prevent these solutions from reaching the outer surface. Thus, salt
accumulates in the pore system of the plaster/render. Many industrial plasters and
renders are formulated on the basis of this working principle. They are particularly
interesting when surface damage is undesirable such as in houses, libraries, etc.
c) Salt-blocking plasters and renders allow vapour but not liquid transport. Therefore,
evaporation and crystallization take place at the plaster/substrate interface or in the
masonry. This sort of behaviour is expected, for example, from fully hydrophobic
materials.
d) Moisture-sealing plasters and renders do not allow either liquid or vapour transport.
Hence evaporative crystallization does not occur. However, two kinds of problems
may arise: (i) salt solutions are totally diverted and may damage adjacent elements;
(ii) if points of escape arise, for instance due to cracking of the plaster/render, salt
damage occurs and may progress very quickly, as shown in Fig. 2.10 d).
a) Salt-transporting b) Salt-accumulating c) Salt-blocking
Caption
d) Moisture-sealing: damage sequence due to cracking of the plaster or render
Fig. 2.10 - Representation of the four main working principles of plasters and renders
Liquid transport
Vapour transport
Salt crystals

24 Chapter 2
2.2.8 - Salt crystallization tests
The performance of porous material in relation to salt crystallization and the effects of different salts are currently assessed by means of salt crystallization tests. Typically, in these tests, the specimens are first contaminated by absorbing the salt solution under a predefined contamination procedure. Afterwards, they are allowed to dry under certain environmental conditions. Normally, several wetting/drying cycles are carried out, though some crystallization tests are performed on specimens in continuous partial immersion. In the last case, absorption and drying occur simultaneously throughout the entire testing period. In crystallization tests, damage is evaluated, either periodically during the test, or at the end, by visual observation or by measuring certain material properties. Some crystallization tests are the object of official standards, for instance, CEN’s test for natural stone (CEN 1999b) or ASTM’s test for aggregates (ASTM 2005). Yet, to the best of the author’s knowledge, no crystallization tests specific for plasters/renders exist as standard methods. Salt crystallization testing of porous materials was reviewed by Evans in his fundamental article (1969-1970). More recently, other authors such as Alonso et al. (1987) or Goudie and Viles (1997) have also reviewed the theme. But no crystallization tests specific for plasters/renders are mentioned in these review articles, either.
2.3 State of the practice
2.3.1 - Introduction
Salt decay is, in Portugal, commonly called “the cancer of ancient constructions”. That shows
how serious and hard to deal with practitioners consider this degradation process to be.
To figure out how salt decay problems are handled in practice, end-users from different
areas were interviewed (Gonçalves et al. 2003). The interviews were carried out under the
framework of the COMPASS project simultaneously with others carried out in The
Netherlands, France and Spain (TNO 2002). They were mostly aimed at: (i) evaluating the
framework in which salt decay problems are approached, namely, the level of knowledge and
interaction between the different actors, preliminary investigations carried out and main
concerns of practitioners as regards salt damage; (ii) knowing the type of plasters and
renders used on salt-loaded walls; (iii) identifying decayed buildings for further selection of
case-studies.
A preliminary questionnaire was sent to Portuguese entities and technicians involved in old
building conservation: 6 regional delegations of the national authority for monument
preservation (IPPAR), 123 local authorities (members of the Portuguese Association of
Research and practice: current situation 25
Municipalities with a Historic Centre), 24 contractors and 1 painter. This questionnaire asked
mostly for information on plastered/rendered buildings with salt problems. Answers were
received from the 6 regional delegations of IPPAR, 30 municipal authorities and the painter.
More than 120 buildings throughout the whole country were indicated. Among the
professionals that answered the questionnaire, 2 architects and 1 civil engineer from the
national authority, 3 architects and 1 civil engineer from local authorities, as well as the
painter, were selected for the interviews. None of the contractors answered the preliminary
questionnaire. It was therefore necessary to make direct contacts with some contractors,
which allowed the selection of 2 civil engineers and 1 conservator/restorer. In addition, a civil
engineer from a consultancy company and an independent consultant (architect), both
experts in old building conservation, were selected for the interviews.
A survey was also carried out in the Portuguese market in 2001 (Gonçalves 2002a). It was
aimed at identifying industrial plasters/renders or related products available for use on moist
salt-loaded walls.
The main conclusions on how salt decay problems are approached in practice are presented
in the next section (2.3.2). The types of plasters and renders used in Portugal on salt loaded
walls will be focused in section 2.3.3 within a historical perspective. The case-studies will be
presented later, in Chapter 6.
2.3.2 - General approach to salt decay problems
The interviews carried out with end-users from different professional areas allowed the
following conclusions to be drawn (Gonçalves et al. 2003):
• There is a generalized lack of scientific knowledge on salt damage processes among
the various actors in the four countries. Only some actors have a reasonably high level
of knowledge. In Portugal, only the independent consultant and some technicians from
the national authority IPPAR revealed a high level of knowledge. In fact, many end-
users in Portugal aim at improving their knowledge on the subject. This was shown by
an inquiry performed within a recent seminar on the subject carried out at LNEC (LNEC
2006). Indeed, 78% of the 94 answers received from the 211 participants (professionals
from national or local authorities, researchers, academics, contractors, conservator-
restorers, consultants, etc.) indicated the improvement of their theoretical knowledge on
salt decay features as one main objective for their attendance at the seminar.
• The responsibility of the various actors (contractors, authorities, suppliers, etc.) is not
often clear and the exchange of information between them is frequently insufficient.
• Preliminary inspections or analyses by independent experts are rarely carried out in
Portugal, France and The Netherlands.
• In Portugal, end-users in general show more concern about surface than in-depth
damage.

26 Chapter 2
• Portuguese end-users complain that salt damage is often aggravated after restoration
interventions. This general complaint seems to refer to an increase in surface damage,
namely, enlargement of the affected area or more intense dampness, efflorescence or
material damage. In many cases the main objective of these interventions was
precisely to solve salt damage problems.
The fundamental question that arises from these interviews concerns the factors that can
contribute to the worsening of salt decay problems after restoration interventions. One
straightforward hypothesis is the type of plasters and renders used, namely, cement-based
materials that, as seen in section 2.3.2, can give rise to carbonate or sulfate salts. Decay by
these types of salt was identified in many old buildings (Arnold 1981, for instance) but its
relevance in Portugal is mostly unknown.
A second important question concerns a possibly wrong approach to salt decay problems.
Indeed, the present state-of-the-art does not yet allow a full understanding of many salt
decay features. Yet, it is possible that the lack of preliminary investigations, the insufficient
background knowledge of many professionals, the unclear responsibilities or the poor
interaction between the involved actors impede solving even the simpler problems.
2.3.3 - Main types of plasters and renders used on salt-loaded walls
Air lime plasters and renders were used in ancient times to prevent masonry deterioration, to improve the habitability conditions in buildings or for aesthetical reasons. Under current working conditions, air lime plaster and renders required assiduous (typically annual) maintenance and total replacement in periods of a few years. On salt-loaded walls, even more intense maintenance was most likely needed. Firstly, because lime-based materials have low mechanical strength. Secondly, because lime plasters and renders behave typically as salt-transporting systems and, hence, may show significant surface damage. Sometimes, additives such as animal or vegetal fats (Rojas 1987, Gonçalves 2002b) were used, aimed at improving the performance of lime-based materials in relation to salt crystallization. It seems reasonable to suppose that hydrophobic (salt-blocking) or else moisture-sealing plasters and renders that postponed the occurrence of surface damage would be obtained. Other techniques existed also to fight against salt damage such as that reported to the author of this thesis by a contractor from Évora (Gonçalves 2002b): the plaster or render was applied over a cotton sheet previously laid on the masonry. The tissue probably created a thin air layer capable of impeding liquid transport from the masonry to the plaster/render. It is possible that the system would therefore work as a salt-blocking system. But there is no scientific evidence on the effective performance and durability of these ancient techniques which have an essentially regional and artisanal character. After the industrial revolution, Portland cement was eventually introduced as the main binder of plasters and renders. But, despite advantages such as higher mechanical strength and quick hardening even under high RH conditions, cement-based materials often presented low performance on moist and salt-loaded walls. Indeed, worsening of dampness and salt-
Research and practice: current situation 27
induced surface damage or detachment from the substrate is regularly observed with cement-based plasters and renders. Further, it was found that cement based materials could give rise to salt damage mostly caused by carbonate salts originating from the (high) alkali content in these materials. Because of the limitations of lime-based materials and poor performance of cement-based materials, industrial plasters and renders specific for salt-loaded walls have been (and are being) developed in modern times. They are generally dry factory-mixed mortars and are aimed at meeting more demanding requirements of durability and performance. Industrial salt-blocking plasters/renders based on hydrophobic additives or moisture-sealing plasters/renders based on hydraulic-plus-polymeric binders are common. The so-called “sanierputzsysteme” (restoration plaster/render systems) were first developed in Germany. WTA established the requirements for such systems in technical specification WTA 1-85, later replaced by WTA 2-2-91 (WTA 1992) and WTA E-2-6-99/D (WTA 2000). WTA systems are composed of dry factory-made mortars that include: (i) hydraulic binders that allow quick hardening and provide good mechanical resistance; (ii) hydrophobic additives that reduce liquid transport; (iii) air-entraining additives or lightweight aggregates that enhance vapour transport. The main purpose of WTA systems is to keep moisture and salts away from the surface and to present good resistance to salt crystallization. They may, therefore, work as salt-accumulating or salt-blocking systems. More recently, industrial salt-transporting plasters/renders have also been developed to overcome some limitations of salt-accumulating plasters, namely (Hilbert et al. 1992, Meier 1992, Hilbert 1995, Goretzki and Karolewski 1995, Hafezi and Figgemeier 1999, Holmström 2000): (i) risk that salts crystallize in the substrate and thereby damage it; (ii) increase in the maximum height of capillary rise in walls due to a reduced moisture transport capability; (iii) uncertain salt-accumulation capability; (iv) progressive decrease in the vapour permeability of the system due to accumulation of salt; (v) poor compatibility with weak substrates. These industrial salt-transporting plasters/renders are aimed at reproducing the moisture-transport and salt-accumulation behaviour of traditional lime-based plasters and renders, while presenting a higher resistance to salt crystallization. They promote the quick transport of liquid solutions towards the outer surface and, hence, a fast drying rate, as it will be explained along this thesis. Yet, dampness and efflorescence are likely to occur with these systems and, therefore, periodic cleaning is necessary. Recently, European standard EN 998-1 (CEN 2003) framed plasters and renders for salt-loaded walls by defining the concept of “renovation mortar” as being a “designed rendering/plastering mortar used on moist masonry walls containing water soluble salts” that “has a high porosity and vapour permeability and reduced capillary action”. The standard does not state which kind of accumulation behaviour is expected from plasters and renders made from these renovation mortars. Nevertheless, the similarity (Table 2.1) between the moisture transport properties in EN 998-1 and those in WTA 2-2-91 (WTA 1992) suggests that they refer to the same type of plaster/render. Yet, it is not clear why CEN requirements for capillary absorption and vapour permeability are only applicable to mortars intended to be used in external elements.

28 Chapter 2
Table 2.1 – Requirements for moisture transport properties of CEN renovation mortars and WTA sanierputz
Test parameter CEN renovation mortars (CEN 2003) WTA sanierputz (WTA 1992)
Capillary water
absorption
Mortars to be used on external elements:
≥ 0.3 kg/m2 after 24 h
Test according to EN 1015-18 (CEN 2002)
> 0.3 kg/m2 after 24 h
Test according to DIN 52617 (DIN 1987)
Water penetration ≤ 5 mm
After the capillary absorption test
< 5 mm
After the capillary absorption test
Water vapour diffusion resistance
Mortars to be used on external elements:
µ ≤ 15
Vapour diffusion resistance µ measured
according to EN 1015-19 (CEN 1998b)
µ < 12
Vapour diffusion resistance µ measured
according to DIN 52615 (DIN 1973)
Different kinds of industrial plasters/renders for salt-loaded walls were identified on the Portuguese market (Gonçalves 2002a). Some claim, more or less clearly, to be moisture-sealing, salt-blocking or, although these were mostly introduced in Portugal only around 2000, salt-accumulating. No industrial salt-transporting products were found. Other products that, often with no clearly stated working principle, claim to be adequate for avoiding salt damage were also identified: hydrophobic or moisture-sealing (synthetic-polymer or bituminous) primers, hydrophobic or air-entraining additives for site-made mortars or surface hydrophobic treatments. As regards the type of plasters and renders used in practice, the interviews carried out (Gonçalves et al. 2003) indicated that:
• In Portugal and Spain, traditional plasters and renders, sometimes with hydrophobic or sealing additives, are currently used on moist salt-loaded walls. In the Netherlands and France, it is mostly salt-accumulating or salt-transporting industrial plasters and renders that are used particularly on walls with high moisture or salt content.
• In the four countries, plasters and renders are chosen primarily on the basis of the technicians’ own practical experience. In Portugal, end-users with a lower level of knowledge, for instance, professionals from local authorities, are more likely to use plasters/renders with which they do not have experience, namely industrial products. The cost is in general a second order factor, although it seems to be particularly relevant for contractors.
• Several end-users in Portugal and in The Netherlands think that supplier companies do not provide totally independent advice.
• In Portugal and France, the written documentation for industrial products is often unclear or is not in accordance with the stated working principle. For instance, some products are claimed to work as salt-accumulating plasters/renders and, yet, include a strongly hydrophobic first layer.

Research and practice: current situation 29
These interviews revealed a general distrust of the effectiveness of most plasters and renders on moist salt-loaded walls. This is a consequence of recurrent failures experienced with both traditional and non-traditional systems. Accordingly, in Portugal where end-users are more concerned about surface than in-depth damage, hiding the problem was systematically pointed to as the most effective solution. This is normally achieved by building a secondary wall in front of the damaged one. Two end-users (national authority and contractor) also indicated the use of draining geocomposites (a draining nucleus covered with two geotextiles, one on each side of the nucleus) close to the masonry. The lime or lime/cement plaster/render is applied over the geocomposite. An armour of distended metal (fastened to the masonry) or fibreglass (fastened to the geocomposite) is previously placed, to hold the mortar. The SALTEX dessolidarized plastering system (Holmström 2000) is a somewhat similar solution. It was developed by the Royal Institute of Technology in Stockholm and is composed of: (i) an air layer of 12 to 25 mm that is typically located between the plaster and the masonry; (ii) vapour permeable membrane whose properties are defined on a case-by-case basis according to the type of salts and moisture content in the wall; (iii) one or several traditional mortar layers that may incorporate a metal mesh mechanically fastened to the masonry. Apart from “hiding the problem”, this system is aimed at preventing salt crystallization. Although the principle is not totally clear, this purpose is apparently achieved with a vapour permeable membrane by which an RH above the RHeq of the contaminant salt(s) is created in the air layer next to the masonry. Secondary walls or intermediate air layers are not always feasible because they involve higher costs, especially when compared to traditional plasters/renders, or a sometimes relevant reduction of room area. Also, thick surface layers are frequently not compatible with window frames, doorframes or artistic elements in old buildings. Hence it is not often possible to use them on these buildings when the original aesthetics is to be maintained. Further, masonry preservation is sometimes a real, although not generalized, concern. Particularly in the cases of valuable monuments and end-users with a high level of knowledge, plasters and renders that can effectively work as sacrificial layers are normally sought.


Chapter 3 – General laboratory techniques
3.1 Introduction
Efficient laboratory techniques, for control of the environmental conditions and for evaluation
of the salt content in building materials, were required to perform the experimental work in
this thesis. Two simple and inexpensive methods were considered for each of these
purposes: (i) the use of aqueous solutions for generating constant RH; (ii) the hygroscopic
moisture content (HMC) method for assessment of the salt content. However, a question
arose as to whether these techniques were fully adequate for testing salt-loaded building
materials.
In fact, both techniques required deeper investigation because:
(i) The use of aqueous solutions for humidity control in the presence of salt-loaded materials
had not been, to the best of the author's knowledge, discussed in any publication. In
particular, ASTM standard E104-02 (ASTM 2002), which is of wide scope, does not refer
that specific kind of material.
(ii) The HMC method revealed, in recent laboratory research (Lubelli et al. 2004), good
results as a method for determination of the salt content in porous building materials.
However, a systematic analysis of its possibilities and limitations was still necessary,
particularly for the testing conditions used in the experiments performed in this thesis.
Efficient experimental methods of general use, as these ones, are an added value for
laboratories working on building conservation. Since salt-loaded materials are becoming
more and more current in these laboratories, the present study was of broader interest than
just the experiments carried out in this thesis.
Aiming at defining adequate guidelines for practice, research work was therefore carried out
with the objective of assessing the possibilities and limitations of the two methods. In this
chapter, that work is presented. Background information on hygroscopicity is introduced in
section 3.2. The method of relative humidity control by aqueous solutions is analysed by
means of the experimental research presented in section 3.3. The HMC method is evaluated
by means of the theoretical and of the experimental research presented in sections 3.4 and
3.5, respectively. The overall conclusions on the two methods are presented in section 3.6.

32 Chapter 3
3.2 Fundamentals
3.2.1 - Relative equilibrium humidity of aqueous solutions
Molecules in liquids or gases are in constant movement. At a given temperature, liquid
substances are continuously evaporating because a number of their molecules possess
enough kinetic energy to get away from the liquid surface. At the same time, condensation
occurs constantly because some of the evaporated gaseous molecules collide with the liquid
surface and are held again by the intermolecular forces in the liquid. In closed systems, a
state of dynamic equilibrium, where evaporation is compensated by condensation, is
eventually reached between the liquid and its environment.
The pressure exerted under these equilibrium conditions by the (evaporated) gas phase is
the “equilibrium vapour pressure” or simply “vapour pressure” of the substance. Vapour
pressure increases with increasing temperature because more molecules have enough
kinetic energy to leave the liquid. If the liquid is water or an aqueous salt solution, that vapour
pressure is the so-called “water vapour pressure” of water or of the salt solution at the given
temperature.
The relative humidity (RH) refers to the concentration of water vapour in the air.
It corresponds to the ratio, expressed as a percentage, of the actual water vapour pressure
in the air to the water vapour pressure above a flat surface of water at the same temperature.
In equilibrium conditions, the RH above a liquid is the “relative equilibrium humidity” (RHeq) of
the liquid. Thus, the RHeq of a flat surface of pure water is 100% at any temperature. The
RHeq above an aqueous salt solution is lower because salt ions replace some water
molecules at the liquid surface. Therefore, fewer water molecules are available for
evaporation. Accordingly, the evaporation rate, the water vapour pressure and the RHeq of
aqueous salt solutions are lower than those of pure water. The more dilute a solution the
higher its RHeq at the same temperature. The RHeq of an infinitely dilute solution is 100%.
In Equilibrium Thermodynamics, the RHeq of a solution is expressed as a fraction instead of
as a percentage and is called “water activity” (aw). Eq. 3.1 relates the water activity aw of a
solution to another relevant thermodynamic parameter, the molal osmotic coefficient which
expresses the deviation of the solution from ideality (Robinson and Stokes 2002).
mvMa ww ...ln φ−≡ (Eq. 3.1)
In this equation, φ (dimensionless) is the osmotic coefficient, Mw (kg/mol) the molar mass of
pure water, m (mol/kg) the molality of the solution and νννν the stoichiometric parameter
(dimensionless) which corresponds to the number of moles of ions produced when a mole of
solute molecules is dissociated (Blandamer et al. 2005, for instance).
For an ideal solution, φ is unitary. The higher the concentration of a salt solution the lower its
osmotic coefficient φ. Both aw and φ are experimental parameters that can be obtained in
published tables of thermodynamic data such as those in Robinson and Stokes (2002) or
Lobo (1989). This sort of tables presents aw or φ for different concentrations of a given salt
solution at a certain temperature.

General Laboratory Techniques 33
3.2.2 - Control of the relative humidity by means of aqueous solutions
The previous considerations show how pure water and salt solutions can influence the RH of
the environment. In closed systems, they force the air RH to match the value of their RHeq at
the corresponding temperature. This is the basis of the methods of generating constant RH
in relatively small containers by means of aqueous solutions, such as those of ASTM
E104-02 (ASTM 2002) or ISO 483:2005 (ISO 2005), the latter being specific for plastics. The
containers are placed in rooms at a constant temperature. Generally, saturated salt solutions
with an excess of salt are used. A wide range of RH can be obtained from different salts: for
instance, at 20ºC, a saturated caesium-fluoride solution generates 3.8% RH while a
saturated potassium-sulfate solution generates 97.6% RH (ASTM 2002). Also pure water is
sometimes used, though mostly for research studies, when an RH around 100% is required.
3.2.3 - Hygroscopic behaviour of soluble salts
Soluble salts are hygroscopic which means that, because they have a strong affinity for
moisture, they readily attract moisture from the air under certain environmental conditions.
Further, they are deliquescent, that is, they eventually dissolve in this hygroscopic water and
form liquid solutions.
At a given temperature, both the occurrence of dissolution and the equilibrium concentration
of the resulting solution depend on the actual RH of the air and on the relative equilibrium
humidity of the salt (RHeqsat). The RHeq
sat corresponds to the RHeq of a saturated solution.
Three equilibrium situations are possible for non-hydratable salts as NaCl (Fig. 3.1):
• at RH < RHeqsat the salt attracts no moisture from the air;
• at RH = RHeqsat the salt attracts and eventually holds an amount of moisture
Q = Qeq, forming a saturated solution;
• at RH > RHeqsat the salt attracts and ultimately holds a given amount of moisture
Q > Qeq, forming an unsaturated solution; Q increases exponentially with the air
RH; at an RH of 100% the salt solution tends to infinite dilution.
0 100
RH of the air (%)
Hygro
scopic
mois
ture
(g)
Qeq
HReq
RH (%)
RHeqsat
Qeq
Fig. 3.1 - Hygroscopic moisture
held by a non-hydratable salt at
a certain temperature. Price and
Brimblecombe (1994) present a
similar graph for a 1g NaCl
sample.

34 Chapter 3
For hydratable salts there may be other values of the air RH, below the RHeq
sat of the salt, at
which the salt attracts moisture from the air and undergoes the corresponding phase
change. For instance, sodium sulfate can form three distinct crystalline phases, as explained
in section 2.2.4 and depicted in Fig. 2.9: the anhydrous thenardite (Na2SO4), the decahydrate
mirabilite (Na2SO4.10H2O) and the metastable heptahydrate (Na2SO4.7H2O).
When soluble salts are present in or on porous building materials, either as crystals or salt
solutions, their hygroscopic properties may cause or worsen moistening of the material even
in the absence of other sources of moisture. Indeed, if the air RH is higher than the RHeqsat of
the salt, salt crystals attract moisture from the air and dissolve. Further, while the air RH is
higher than the RHeq of the salt solution, either this solution was newly formed by
deliquescence of pre-existing crystals or was previously present in the material, a negative
vapour pressure gradient exists between the salt-loaded material and the surrounding air.
Hence, water vapour diffuses from the environment to the surface and, thus, the water
content in the material increases. In contrast, when the environmental RH is lower than the
RHeq of the salt solution, the vapour pressure gradient is positive. Therefore water vapour
diffuses in the opposite direction, that is to say, from the material to the environment. Hence,
the salt-loaded material dries.
3.3 Use of aqueous solutions for control of the relative humidity
3.3.1 - Introduction
Methods of controlling the RH by means of aqueous salt solutions are widely used for storing
or testing building materials. Relatively small containers where the RH is controlled by
chosen solutions are utilized, placed in rooms at a constant temperature. Indeed, stable and
accurate RH is much more difficult to obtain in laboratory rooms than temperature. The low
cost and simplicity of such methods of RH control make them a good alternative to climatic
chambers. These chambers are large, expensive and energy consuming equipments whose
availability is normally restricted and needs to be rationalized.
In the case of salt-loaded materials, accurately controlled environmental conditions are often
indispensable because the behaviour of soluble salts depends on the air RH (and
temperature). Yet, as far as the author knows, the correctness of using aqueous solutions for
generating a constant RH when the stored materials contain soluble salts had never been
evaluated before this thesis.
In such methods of RH control, selected salt solutions or even pure water are used to
generate a constant RH (identical to their RHeq). When wet materials that contain soluble
salts are stored in the containers, secondary salt solutions are also present, which
supposedly may influence the environmental conditions as well. Yet, the only thing currently
taken into consideration is that wet materials can affect the environmental conditions,
particularly in the case of low RH and high temperature, because water vapour can be
released and because evaporation consumes heat.
Accordingly, no major problems are expected from dry materials. However, soluble salts are
deliquescent. Consequently, secondary salt solutions can form also on salt-loaded materials
even when they are initially dry.

General Laboratory Techniques 35
Research was, therefore, undertaken (Gonçalves and Abreu 2007) with the main purpose of
verifying whether the use of aqueous solutions allows stable control of the RH in the case of
salt-loaded materials. Its specific objectives were:
- To test, by means of adequate experiments, the null hypothesis that stable
environmental conditions are always obtained with dry materials even if they contain
soluble salts;
- To examine the case of wet materials.
This section presents and discusses the research carried out. Two experiments are
described where NaCl samples were kept over water in section 3.3.2. Then, the results are
presented in section 3.3.3 and discussed in section 3.3.4.
3.3.2 - Materials and methods
The two experiments were performed by placing NaCl samples (RHeqsat ≈75.6% at 20ºC) of
1g and 5g, respectively, inside a closed container over water (RHeq =100%). The RH in the
container, a small glass desiccator cabinet, was monitored through periodical observations
by means of a thermo-hygrometer. This experimental set-up can be seen in Fig. 3.2. The two
experiments were carried out in similar conditions, one after the other, in a conditioned room
at 20ºC and 50% RH.
3.3.3 - Results
The results of the experiments are shown in Figs. 3.3 to 3.5. It is seen that the RH inside the
container decreased rapidly from the early moments of either experiment. In the case of the
1g sample, this happened after an initial RH increase. Minimum RH of 91% or 85% was
attained after 2 and 5 days for the 1g and the 5g sample, respectively. Afterwards, the RH
started to rise again. In the case of the 5g sample, a secondary RH drop is clearly visible
between the 8th and the 12th day: a second RH minimum of around 85% was reached on the
12th day. In the case of the 1g sample, only a slight irregularity was detected between the 3rd
and the 4th day.
A sharp fall in the temperature in the container was detected in both experiments when the
RH dropped (Figs. 3.4 and 3.5). In the case of the 5g sample, the temperature fall was
simultaneous to the second RH drop. However, since in this experiment the initial
temperature values were not recorded, it is not known if there had been a previous
temperature fall during the first RH drop.
For the 1g sample, equilibrium of the RH inside the container was attained at the expected
value of 100% after 16 days of testing. In the case of the 5g sample, RH of around 99% was
recorded, during four consecutive days, only after 56 days of testing.
The amount of water in the samples was visually observed to increase during the
experiments.

36 Chapter 3
80
85
90
95
100
0 10 20 30 40 50 60
Time (days)
RH
(%
)
NaCl (5g)
NaCl (1g)
Room T ≈ 20ºC
Fig. 3.2 - Experimental set-up Fig. 3.3 - Evolution of the RH in the container where NaCl
samples were stored over water
80
85
90
95
100
0 10 20
Time (days)
RH
(%
)
-15
-10
-5
0
5
10
15
20
25
T (ºC
)
RH (1g)
T (1g)
Room T ≈ 20ºC
80
85
90
95
100
0 10 20 30 40 50 60
Time (days)
RH
(%
)
-15
-10
-5
0
5
10
15
20
25
T (ºC
)
RH (5g)
T (5g)
Room T ≈ 20ºC
Fig. 3.4 - 1g NaCl sample:
RH and T in the container
Fig. 3.5 - 5g NaCl sample: RH and T in the container
3.3.4 - Discussion
The results presented above indicate that aqueous solutions may not allow an adequate
control of the environmental conditions when salt-loaded materials are stored in the
container. Indeed, secondary solutions with a distinct RHeq may influence the air RH.
Secondary solutions exist on wet materials or may form, as seen in the present experiments,
on dry materials when the air RH is above the RHeqsat of the contaminant salt. Moreover,
enthalpy changes may cause disturbance in the temperature. These enthalpy changes can
arise from dissolution, as in these experiments, or crystallization processes.
In the present experiments, the NaCl samples were stored at an RH that, under the influence
of pure water, tended to rise (towards 100%) immediately after the container was closed.
That is clearly seen in the case of the 1g sample (Fig. 3.4).
Although disturbed by the opening of the container, the RH in the interior was, at beginning
of both experiments, well above the RHeqsat of NaCl (75.5%), as seen in Fig. 3.3. Therefore,
deliquescence of the salt took place and NaCl solutions were formed.
10 c
m

General Laboratory Techniques 37
The initial RH drops most likely resulted from the influence of those NaCl solutions whose
early RHeq was that of a saturated NaCl solution (75.5%). Indeed, the actual RH in the
container reached a lower value when more NaCl was present: 85% RH for the 5g sample
and 91% RH for the 1g sample.
The sharp temperature falls (Figs. 3.4 and 3.5) were most likely a result of enthalpy changes
due to NaCl dissolution being endothermic. It is interesting to note that a mere 1g of NaCl
was able to lower the temperature in the container by 4ºC to 5ºC during around 24 hours.
The further rise of the actual RH in the container observed in both experiments arose
presumably from a progressively lower influence of the NaCl solutions, as they became
gradually more dilute and, hence, their RHeq increased. This is consistent with the RH
increasing faster in the case of the 1g sample that corresponds to a lower amount of salt
solution.
Temperature drops cause an increase in RH of the air. This is probably the case of the small
RH increase observed for the 5g sample between the 6th and the 10th day. Such an effect is
not clear for the 1g sample, though it may very well have happened at the same time than
the initial RH increase
Equilibrium was eventually attained, perhaps not fully in the case of the 5g sample, but only
after several days. The higher the amount of NaCl in the sample the longer the period before
constant RH was registered: 16 and 56 days for the 1g sample and the 5g sample,
respectively.
These results show, therefore, that when the RH is controlled inside small containers by
means of water, it can be significantly influenced by the presence of soluble salts stored in
those containers. This conclusion can be generalized to any conditioning solution with RHeq
higher than the RHeqsat of the contaminant salt because pure water corresponds to a solution
with RHeq = 100%.
In fact, if the air RH is above the RHeqsat of the contaminant salt, that salt eventually
dissolves. Disturbance of the environmental conditions may arise firstly from the dissolution
process itself (for example, NaCl dissolution is endothermic). Then, a dynamic process takes
place where the air RH is drawn down by the contaminant solution towards a value that
gradually increases as a result of the dilution, and corresponding increase of the RHeq, of the
contaminant solution.
Equilibrium is reached only after a certain period of time. That period is probably longer
when: (i) the materials contain a high amount of salt; (ii) the RHeqsat of the contaminant and
conditioning salts are very different, hence, the contaminant solution tends to a high dilution.
In practice, most problems arise perhaps with dry salt-loaded materials that are stored, as
described above, at an RH higher than the RHeqsat of the contaminant salts. But problems
can be foreseen also with wet materials, for instance, with samples collected from damp

38 Chapter 3
salt-loaded walls, as well as within wet/dry-cycle tests on salt-loaded materials when RH
control by salt solutions is used somewhere along the test. The following situations might
theoretically occur:
a) If the RH is lower than the RHeqsat of the contaminant salt: (i) while the contaminant salt is
in solution the RH is drawn to a higher value; (ii) the contaminant salt eventually
crystallizes which may induce additional disturbance of the environmental conditions due
to enthalpy change (NaCl crystallization, for instance, is exothermic).
b) If the RH is higher than the RHeqsat of the contaminant salt: (i) the RH is drawn towards
lower or higher values when it is initially higher or lower, respectively, than the RHeq of
the contaminant solution; (ii) RH deviation decreases progressively as the contaminant
solution attracts or loses moisture and ultimately becomes more dilute or more
concentrated, respectively; (iii) temperature disturbance could in principle arise from the
dilution or concentration process, though its significance is probably low.
Relevance and duration of the environmental disturbance is expected to depend on multiple
and interrelated factors such as the nature of the involved salts, exposed area of the
conditioning solution, volume of the container, salt content in the stored materials,
temperature, etc. Further, salt dissolution and crystallization are complex processes where
kinetic factors depending on the type of salt, physical characteristics of the loaded material,
environmental conditions, etc. are also possibly relevant. Moreover, multiple situations may
occur as regards both the nature of contaminant salt, which can even be a mixture of several
salts, and the type of loaded materials.
Nevertheless, it is reasonable to assume that RH disturbance will be less significant when:
(i) the salt content in the material is lower; (ii) the difference between the RHeq of the
conditioning solution and the RHeq of the contaminant solution (or RHeqsat of the contaminant
salt, in the case of dry materials) is smaller; (iii) the exposed area of the conditioning solution
is higher; (iv) the storage period of the materials in the container is longer.
3.4 Fundamentals, scope and accuracy of the HMC method
3.4.1 - Introduction
The HMC method of evaluating the salt content in porous building materials is expected to be
a quick and inexpensive alternative or complementary method to chemical analysis, namely,
ion chromatography (IC) or even conductivity-based methods (UNI 2003, for instance).
Indeed, the study of salt-damaged buildings and the evaluation of specimens from laboratory
crystallization tests often involve an evaluation of the salt content of large numbers of
samples. This was the case, for instance, during the work presented in Chapters 4 and 5 of
this thesis. Yet, chemical analyses are time consuming, require specifically trained personnel
and, thus, are often too expensive or too slow to be performed systematically on large sets
of samples.
General Laboratory Techniques 39
The HMC method, by contrast, requires only a small amount of laboratory work of a trivial
nature: introducing the samples into and removing them from a climatic chamber where they
are subjected to certain environmental conditions until hygroscopic equilibrium is reached,
plus two or three weighing sequences. The HMC method permits, therefore, the
simultaneous testing of a very large number of samples, from several dozen to as many as
several hundred, without the need to carry out any special preparation of those samples (salt
extraction or even grinding) and involving only an insignificant investment of time.
The HMC method of salt content evaluation is primarily based on two main facts:
i) Soluble salts are generally very hygroscopic. Hence, they are able to attract and hold
much higher amounts of moisture from the air than ordinary building materials such
as mortars, stone or brick. Hence, the HMC method can be used to detect the
presence of salts (BRE 1989).
ii) In equilibrium under specific environmental conditions the hygroscopic moisture
content of a given salt or salt mixture takes a precise value (Price and Brimblecombe
1994, for instance). Thus, the method is expected to allow quantifying the salt
content, at least in relative terms among different samples contaminated with the
same salt or salt mixture.
A related test method was three decades ago presented by Rodrigues (1976) to estimate the
clay content of natural stone, by measuring the HMC after 72 hours of exposure to an
atmosphere with controlled RH. But the origins of the HMC method are founded mostly on
BRE Digest 245 (1989), which derived from BRE TIL 29 (1977), even though salt content
determination is not the objective of this BRE’s method. Here, the HMC, measured at room
temperature and 75% RH, is used to evaluate to what extent the actual moisture content in
samples collected from damp buildings could be due to hygroscopicity rather than to rising
damp.
Wijfels et al. (1997) used the HMC method, carried out under controlled temperature and
RH, for a relative evaluation of the salt content in NaCl-loaded samples collected from
specimens used in crystallization tests. More recently, Lubelli et al. (2004) reported an
extensive set of HMC experiments performed under controlled temperature and RH on brick
samples with known contents of NaCl, Na2SO4, NaNO3 or mixtures of the three salts. These
experiments tested the use of the HMC method for a quantitative determination of the salt
content. Good results were obtained for all salts.
The research presented in this section (Gonçalves and Rodrigues 2006) gives continuation
to these works, particularly to that of Lubelli et al. The use of a climatic chamber instead of
RH control by aqueous solutions, unlike in these previous works, is justified by the results
presented in section 3.3. Moreover, it was verified (Vergès-Belmin 2003) that HMC
measurements can take a long time (in the order of months) when performed in closed
containers with no air movement.
In practice, climatic chambers do not generate absolutely constant T and RH. Therefore,
because the HMC of soluble salts depends on the environmental conditions, there is a
hypothesis of an uncertainty being associated to the measured HMC values. If the
environmental parameters have a strong fluctuation, it may even be impossible to reach an
equilibrium condition, i.e., to obtain stable HMC values.

40 Chapter 3
The present research was aimed at clarifying the possibilities and limitations of the HMC
method by means of a theoretical study. It had four main objectives:
- systematizing the HMC method;
- investigating its stabilization conditions;
- assessing its accuracy;
- discussing its scope.
This section presents that theoretical research. The method is systematized in section 3.4.2
and its stabilization conditions, accuracy and scope are discussed in section 3.4.3.
3.4.2 - Systematization of the HMC method
3.4.2.1 - Measurement of the HMC
In order to measure their HMC, the samples are first oven-dried and then weighed.
Afterwards, they are stored at the selected environmental conditions for a period sufficiently
long for hygroscopic equilibrium to be achieved, that is, until their mass remains constant
over time.
Where mdry (g) is the dry mass of a given sample, ms (g) its mass at hygroscopic equilibrium
and Q=ms-mdry the quantity of hygroscopic moisture in the sample, the HMC (%) of that
sample is given by Eq. 3.2:
drym
QHMC .100= (Eq. 3.2)
3.4.2.2 - Determination of the salt content
Soluble salts hold, in equilibrium conditions under given environmental conditions, a precise
amount of hygroscopic moisture. The same happens to common building materials such as
mortar, stone or brick. Therefore, for samples composed of a single material, the amount of
hygroscopic moisture Q is directly proportional to the dry mass mdry of the sample, that is,
Q/mdry is constant. Hence, at given temperature and RH, the HMC is a constant
characteristic of each material, either a salt or a building material, as emerges from Eq. 3.2.
This is shown in Fig. 3.6.
If the sample is composed of a base-material loaded with salt, a different situation occurs.
The dry mass of the sample is the sum of the dry masses of the two materials:
mdry = msalt + mmat. The salt content in the sample is x=100.msalt/mdry (%). Disregarding any
chemical interaction between the two materials, the amount Q of hygroscopic moisture in the
sample can be assumed as the sum of the hygroscopic moisture in either material:
Q=Qsalt+Qmat. Therefore, from Eq. 3.2, the HMC (%) of the composite sample is expressed
by:
bxbaHMC 100)( +−= (Eq. 3.3)

General Laboratory Techniques 41
In this equation, a and b (g/g) represent the weight amount (g) of hygroscopic moisture in
samples with unitary mass (1g) of the salt and of the base-material, respectively. This
implies that the HMC of a salt-loaded sample is a linear increasing function of its salt
content, as depicted in Fig. 3.7.
mdry (g)
HM
C (%
)
0
Salt content (%)
HM
C (%
)
0
100.b
100.a
100
A
B
Fig. 3.6 - HMC of single material samples Fig. 3.7 - HMC of salt-loaded samples
In practice, parameter b in Eq. 3.3 and Fig. 3.7 can be disregarded because the
hygroscopicity of building materials is not normally significant when compared to that of
soluble salts. Hence, b can be assumed as zero and the HMC linear function in
Fig. 3.7 assumed to cross the origin instead of point B. Therefore, where x (%) is the salt
content in the sample and HMCsalt the HMC (%) of the salt which is a constant, as seen in
Fig. 3.6, the HMC of the salt-loaded sample can be assumed as:
axHMC ≈ <=> xHMC
HMC salt
100≈ (Eq. 3.4)
Eq. 3.4 shows that the HMC of a salt-loaded sample depends essentially on: (i) the nature of
the salt; (ii) the salt content in the sample.
Parameter a may be calculated by one of the following methods:
i) By means of tables of thermodynamic data of the salt at the given temperature. Indeed,
the actual RH in the chamber corresponds to the water activity of the salt solution that
forms at hygroscopic equilibrium. If that actual RH is assumed to correspond to the
set-point RH, the molality of this solution can be obtained, by interpolation, from the
water activity values in such tables. Both water activity/molality or, by means of
Robinson-Stokes equation (Eq. 3.1), osmotic coefficient/molality tables can be used.
Where m (mol/kg) is the molality of the solution and Msalt (g/mol) the molar mass of the
salt, parameter a is then given by:
saltMma
.
103
= (Eq. 3.5)
ii) By performing HMC tests on control-samples with known salt content. This allows
obtaining an experimental line that correlates the HMC to the salt content. That
correlation line corresponds to Eq. 3.4 when only control-samples of the pure salt are
used. If control-samples of the base-material are also used, the correlation line
corresponds to Eq. 3.3.

42 Chapter 3
3.4.3 Discussion
3.4.3.1 - Accuracy of HMC measurements
For soluble salts, the slope of the curve HMC-versus-RH increases sharply as the values of
the RH rise above the RHeqsat. This was qualitatively shown in Fig. 3.1. Fig. 3.8 illustrates that
sort of behaviour for six common soluble salts within an RH range of 93% to 97% at 25ºC.
0
500
1000
1500
2000
93 94 95 96 97
RH (%)
HM
C (%
)
NaCl
KCl
NaNO3
KNO3
Na2CO3
K2CO3
25ºC
Fig. 3.8 – HMC of six soluble salts
as a function of the RH. Obtained
from equilibrium thermodynamic
data for NaCl, KCl, NaNO3 and
KNO3 (Robinson and Stokes 2002),
Na2CO3 (Robinson and Macaskill
1979) and K2CO3 (Roy et al. 1984).
That behaviour implies that: (i) at high RH, small RH deviations may result in significant HMC
deviations; (ii) the higher the RH, the larger the HMC variations induced by small fluctuations
of the RH. Fig. 3.8 shows that, for instance, a deviation of ± 1% around 94% RH would cause
the HMC of pure NaCl samples to diverge by +19% or -13%, respectively, as a percentage of
the HMC at the central RH of 94%. However, a variation of the same magnitude around 96%
RH would cause the HMC to vary by +32% or -19%, respectively. Therefore, since climatic
chambers do not generate completely accurate environmental conditions, particularly of RH,
the measured HMC values can be affected by a considerable uncertainty, especially at high
RH.
In this chapter, only RH rather than also temperature deviations will be considered. This
simplification is expected to be reasonable because, at high RH, which is the case here,
soluble salts are typically more sensitive to RH than to temperature variations. Moreover, in
climatic chambers, RH is more easily destabilized than temperature. But, strictly speaking,
HMC deviations may also arise from temperature fluctuations.
Consider a salt-loaded sample kept inside a climatic chamber where the temperature is
constant but the actual RH may diverge from a minimum value RH– to a maximum value RH+
below and above the set-point value RHe, respectively. As a consequence of this RH
variation, the actual HMC of the sample will fall within the interval [HMC–(x), HMC+(x)].
HMC–(x) and HMC+(x) are the linear HMC functions (Eq. 3.4) for the maximum and the
minimum RH, respectively. That behaviour is depicted in Fig. 3.9 where HMCe(x) is the linear
HMC function for the set-point RH.

General Laboratory Techniques 43
Salt content (%)
HM
C (%
)
HMC+(x) HMCe(x) HMC-(x)
∆∆∆∆HMC
∆∆∆∆x
Ε+
Ε−
Ε
HMC+
HMC
HMC-
x+xx
-
1000
Fig. 3.9 - HMC variation due to deviation of the RH
In Fig. 3.9, E–, E and E+ (%) represent the HMC of the pure salt at the minimum, the set-point
and the maximum RH, respectively. From Eq. 3.4, the amplitude ∆HMC(x) of the interval for
the possible HMC values is also an increasing linear function of the salt content x:
xEE
HMC100
−+ −=∆ (Eq. 3.6)
The uncertainty ∆x that arises when the salt content x is estimated by means of the actual
HMC is also an increasing linear function of x:
xE
EEHMC
Ex
−+ −=∆=∆
100 (Eq. 3.7)
The significance of ∆HMC or of ∆x in relation to HMCe or x, respectively, is expressed by
parameter α (%):
x
x
)x(HMC
)x(HMCe
∆=
∆= 100100α (Eq. 3.8)
Parameter α is a constant, as it elapses when Eq. 3.4, 3.6 and 3.7 or 3.8 are merged:
E
EE −+ −= 100α (Eq. 3.9)
Eq. 3.9 shows that α depends essentially on the following factors: (i) type of salt; (ii) set-point
values of the environmental parameters; (iii) possible deviation of the environmental
parameters from the set-point values, hence, capability of the climatic chamber to generate
homogeneous and accurate environmental conditions.
The acceptability of α depends on the specific purposes of the HMC test and, thus, requires
a case-by-case evaluation. Consider the example depicted in Fig. 3.10 where the HMC of
NaCl-loaded samples is measured in a climatic chamber at 25ºC and 95.0±0.2% RH or

44 Chapter 3
95.0±1.0% RH. In the first case, from water activity/molality tables (Robinson and Stokes
2002), E+=1196.4%, E=1153.4% and E–=1110.4%, thus, α≈7.5%. This value is probably
acceptable in many practical cases, for instance, when evaluating the deposition of salt
across the thickness of specimens from crystallization tests. However, for an RH of
95.0±1.0%, E+=1423.0%, E=1153.4% and E–=968.8% which gives α≈39.4%, hardly an
acceptable value in most situations.
0
50
100
150
200
250
0 5 10 15 20
Salt content (%)
HM
C (%
)
HMC 96.0%RH HMC 95.2%RH
HMC 95.0%RH HMC 94.8%RH
HMC 94.0%RH
Fig. 3.10 – Possible divergence in the HMC
of NaCl-loaded samples due to deviation of
the RH from the value of 95.0%
An accurate prediction of α for a certain climatic chamber is only possible for salts with
known thermodynamic properties. For other salts or salt mixtures, an approximate evaluation
of α can, though, be made by means of, for example, the properties of NaCl. Since NaCl is
one of the common soluble salts with higher hygroscopic absorption (Fig. 3.8), this
evaluation will most likely err on the side of safety.
However, as it emerges from the considerations above, it is probable that most climatic
chambers presently available in research laboratories may induce significant error in the
HMC measurements.
3.4.3.2 - Mass stabilization
When measuring the HMC, samples should remain under the chosen environmental
conditions until their mass is constant over time. Yet, the environmental fluctuations in the
chamber can cause variations in the mass of the sample. Therefore, if the environmental
fluctuations are too strong, it may be impossible to obtain a stable HMC.
Consider a sample with dry mass mdry (g) and salt content x (%). The mass variation
between consecutive weighing i-1 and i is ∆m=mi-mi-1. Hence, the mass variation ∆m (%)
that corresponds to a maximum HMC variation ∆HMC (Eq. 3.6) is given by Eq. 3.10 which
derives from Eq. 3.2 and 3.6:
xEEm
mdry
)(104
−+ −=∆ (Eq. 3.10)

General Laboratory Techniques 45
This equation shows that ∆m is an increasing function of the salt content x. This means that,
the higher the salt content in the sample, the more significant are the possible mass
variations caused by fluctuation of the environmental parameters.
Therefore, it is extremely difficult to establish a reasonable mass stabilization criterion.
Indeed, the usual criterion of considering that equilibrium is achieved when ∆m is lower than
a certain percentage β of the dry mass mdry (in drying procedures, normally β=0.1 for a
24-hour weighing interval) is not often applicable. This criterion is expressed by Eq. 3.11:
100
drymm β≤∆ (Eq. 3.11)
However, since ∆m is a function of x (Eq. 3.10), for each value of β there is a critical salt
content xcrit above which mass variations greater than ∆m can arise simply due to
environmental fluctuation. In that case, the criterion in Eq. 3.11 may never be fulfilled. By
replacing Eq. 3.10 in Eq. 3.11, xcrit is obtained:
--
100EE
xcrit +=
β (Eq. 3.12)
The problem is that, in practice, samples with salt content x>xcrit can easily occur. For
instance, β is taken as 1 (already much higher than the value of 0.1 usual in drying tests).
If, for instance, NaCl-loaded samples are tested in a climatic chamber at 95.0±0.2% RH and
25ºC, the maximum critical salt content in Eq. 3.12 is given by xcrit =100*1/(1196.4-1110.4) ≈
1.2% which is an extremely low value. Indeed, in most practical situations, samples with a
higher salt content may exist, as it will be seen along this thesis.
Therefore, in practice, it is preferable to qualitatively assess mass stabilization of the
samples by direct observation of the mass-versus-time or HMC-versus-time graphs.
3.4.3.3 - Scope of the HMC method
Lubelli et al. (2004) concluded that the HMC method may allow quantifying or roughly
evaluating the salt content in samples loaded with known or unknown salts, respectively. The
present thesis supports, overall, these conclusions.
The scope of the HMC method can be summarized as follows:
(i) If we are dealing with a salt of well-known thermodynamic properties or if we are able to
replicate the salt in the laboratory, the HMC method may be used for a quantitative
evaluation of the salt content, as explained in section 3.4.2.2:
- For salts whose thermodynamic properties are known, correlation parameter a in
Eq. 3.4 can be obtained from tables of thermodynamic data;
- For replicable salts, either their thermodynamic properties are or not known, Eq. 3.4
can be directly obtained by using control-samples of the salt. This equation is
usually sufficient because the HMC of most base-materials is negligible in
comparison to the HMC of soluble salts. If control-samples of the base-material are
also used Eq. 3.3 can be obtained.

46 Chapter 3
(ii) If the thermodynamic properties of the salt are not known and that salt is not replicable in
the laboratory, since the HMC is proportional to the salt content, the HMC method may
still be used, but only for comparing the salt content in different samples. This application
rests, however, on the assumption that the type of salt is identical in all the samples. If
the type of salt shows a significant variation from sample to sample, the method can still
be used but it will only provide more or less rough estimates of the salt content. The
homogeneity of the type of salt within a group of samples may be evaluated by
performing IC analyses on some selected samples.
Salts of known thermodynamic properties are normally present, for instance, in laboratory
samples. On the contrary, samples from buildings are commonly loaded with salts whose
thermodynamic behaviour is not known. Sometimes the nature of the salt itself is unknown
but what normally happens is that a complex mixture of different salts exists. These complex
salt mixtures are not easy to reproduce in the laboratory, adequate thermodynamic data is
not normally available for them and the relative proportions of the different salts may show
differences from sample to sample.
3.5 HMC experiments on salt-loaded materials
3.5.1 - Introduction
Complementarily to the theoretical research presented in the previous section, the
possibilities and limitations of the HMC method were investigated by means of experimental
research.
The HMC method is expected to be effective if an RH above the RHeqsat of the contaminant
salt is used. In principle, the HMC of the base-materials can be disregarded as it is expected
to be insignificant when compared to the HMC of soluble salts. Accordingly, the state of
cohesion of the samples is not expected to have a relevant influence on the results.
Nevertheless, stable HMC values can only be obtained if the fluctuation of the environmental
parameters is low enough to allow stabilization of the mass of the sample. As discussed in
the previous section, there is a strong risk that RH fluctuation in common climatic chambers
is not sufficiently low to allow such stabilization. Yet, it is possible that the hygroscopic
response of the salts is not immediate and, hence, HMC fluctuation is smoothed in practice.
For instance, the shape of the receptacle where the sample is placed is likely to influence the
dissolution kinetics.
If stable actual HMC values are eventually obtained, there is still a possibility that they will
not correspond to those expected from equilibrium thermodynamic data. Indeed, some
soluble salts often present metastable behaviour. That is the case of, for instance, sodium
sulfate which was used in several of the experiments in this thesis. Crystallization of the
heptahydrate or situations of metastable equilibrium of thenardite have been reported, for
example, by Rijniers (2004) or Tsui et al. (2003), respectively. HMC values different from the
expected ones may also arise due to permanent or erratic deviations of the RH or
temperature in the chamber, as discussed in section 3.4. Anyway, regardless of the cause,
when the actual HMC deviates from the value that corresponds to the set-point conditions of
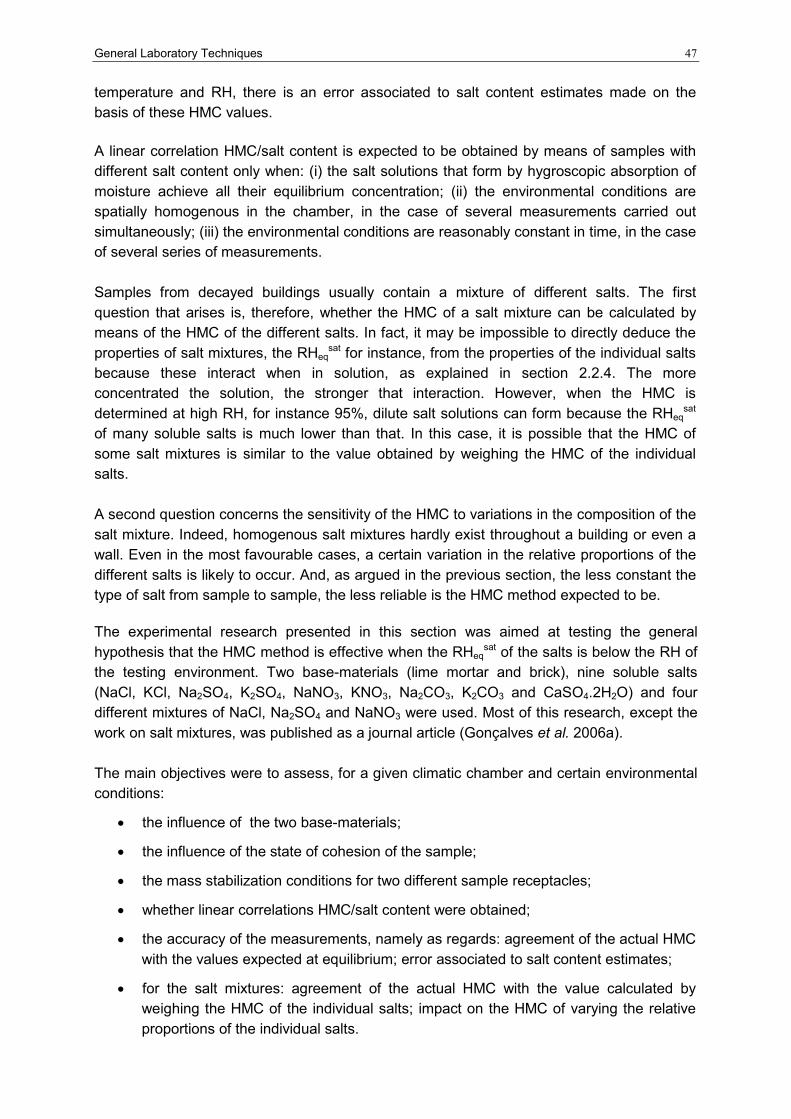
General Laboratory Techniques 47
temperature and RH, there is an error associated to salt content estimates made on the
basis of these HMC values.
A linear correlation HMC/salt content is expected to be obtained by means of samples with
different salt content only when: (i) the salt solutions that form by hygroscopic absorption of
moisture achieve all their equilibrium concentration; (ii) the environmental conditions are
spatially homogenous in the chamber, in the case of several measurements carried out
simultaneously; (iii) the environmental conditions are reasonably constant in time, in the case
of several series of measurements.
Samples from decayed buildings usually contain a mixture of different salts. The first
question that arises is, therefore, whether the HMC of a salt mixture can be calculated by
means of the HMC of the different salts. In fact, it may be impossible to directly deduce the
properties of salt mixtures, the RHeqsat for instance, from the properties of the individual salts
because these interact when in solution, as explained in section 2.2.4. The more
concentrated the solution, the stronger that interaction. However, when the HMC is
determined at high RH, for instance 95%, dilute salt solutions can form because the RHeqsat
of many soluble salts is much lower than that. In this case, it is possible that the HMC of
some salt mixtures is similar to the value obtained by weighing the HMC of the individual
salts.
A second question concerns the sensitivity of the HMC to variations in the composition of the
salt mixture. Indeed, homogenous salt mixtures hardly exist throughout a building or even a
wall. Even in the most favourable cases, a certain variation in the relative proportions of the
different salts is likely to occur. And, as argued in the previous section, the less constant the
type of salt from sample to sample, the less reliable is the HMC method expected to be.
The experimental research presented in this section was aimed at testing the general
hypothesis that the HMC method is effective when the RHeqsat of the salts is below the RH of
the testing environment. Two base-materials (lime mortar and brick), nine soluble salts
(NaCl, KCl, Na2SO4, K2SO4, NaNO3, KNO3, Na2CO3, K2CO3 and CaSO4.2H2O) and four
different mixtures of NaCl, Na2SO4 and NaNO3 were used. Most of this research, except the
work on salt mixtures, was published as a journal article (Gonçalves et al. 2006a).
The main objectives were to assess, for a given climatic chamber and certain environmental
conditions:
• the influence of the two base-materials;
• the influence of the state of cohesion of the sample;
• the mass stabilization conditions for two different sample receptacles;
• whether linear correlations HMC/salt content were obtained;
• the accuracy of the measurements, namely as regards: agreement of the actual HMC
with the values expected at equilibrium; error associated to salt content estimates;
• for the salt mixtures: agreement of the actual HMC with the value calculated by
weighing the HMC of the individual salts; impact on the HMC of varying the relative
proportions of the individual salts.

48 Chapter 3
The experiments carried out are described in section 3.5.2 and their results presented in
section 3.5.3. These results are afterwards discussed, as regards: influence of the
base-materials and state of cohesion (section 3.5.4.1), mass-stabilization (section 3.5.4.2)
correlation HMC/salt content (section 3.5.4.3), accuracy of the method (section 3.5.4.4) and
behaviour of the salt mixtures (section 3.5.4.6). Sodium sulfate, which behaved differently
from the other salts, is more carefully discussed in section 3.5.4.5.
3.5.2 - Materials and methods
Two sets of HMC experiments were carried out, as indicated in Table 3.1, on the following
types of samples:
i) base-materials: red ceramic brick or lime mortar;
ii) individual salts: NaCl, KCl, Na2SO4, K2SO4, NaNO3, KNO3, Na2CO3, K2CO3 or
CaSO4.2H2O; their RHeqsat at 20ºC is indicated in Table 3.2;
iii) each of the base-materials with increasing content of each of the nine salts;
iv) lime mortar with increasing content of each of four different mixtures of NaCl, Na2SO4
and NaNO3; composition of these mixtures is presented in Table 3.3.
Table 3.1 - HMC experiments
Set Contaminating salts Sample type Dry
mass
Receptacle
type
Environmental conditions and
duration of the test
none i) lime mortar or brick
1st
NaCl or Na2SO4
iii) lime mortar or brick with
increasing content of
either salt
2 g deep-narrow - 2 weeks at 20ºC / 80% RH
- 13 weeks at 20ºC / 95% RH
none
i) lime mortar (powder,
granular and entire) and
brick (only powder)
2 g deep-narrow
deep-narrow ii) pure salt samples 0.5 g
shallow-wide
NaCl, KCl, Na2SO4,
K2SO4, NaNO3,
KNO3, Na2CO3,
K2CO3 or
CaSO4.2H2O
iii) lime mortar with
increasing content of each
of the nine salts
2nd
Four different
mixtures of NaCl,
Na2SO4 and NaNO3
iv) lime mortar with
increasing content of each
of the four salt mixtures
2 g deep-narrow
20ºC / 95% RH
- Samples (ii): 64 days
- Samples (iii) and (iv):
during the first 29 days
The lime mortar was obtained from prismatic specimens with volumetric composition of
1:1.5:1.5 (dry hydrated lime LUSICAL : sand from the Tagus river : yellow pit sand from
Corroios) prepared at LNEC one year before testing. The brick was obtained from solid red
Dutch ceramic bricks. Both the lime mortar and the brick are the same materials used in the
drying and crystallization experiments presented in Chapters 4 and 5. The salts were
commercial products of “for analysis” quality.

General Laboratory Techniques 49
Table 3.2 - Relative equilibrium humidity of the salts
Salt RHeqsat
at 20 ºC (%)
NaCl 75.47 (1)
KCl 85.11 (1)
NaNO3 75.36 (1)
KNO3 94.62 (1)
K2SO4 97.59 (1)
K2CO3 43.16 (1)
Na2SO4 95.6* (2)
Na2CO3 91.6 (3)
CaSO4.2H2O 99.6 (4)
* deliquescence RH for Na2SO4.10H2O
(1) Greenspan (1977)
(2) Linnow et al. (1989)
(3) Apelblat and Manzurola (2003)
(4) Zehnder (1996)
Table 3.3 – Composition
of the salt mixtures
Relative amount of salt
in the mixture (%W) Mixture
NaCl Na2SO4 NaNO3
A 100/3 100/3 100/3
B 50 25 25
C 50 - 50
D 50 50 -
The samples were prepared in the laboratory after grinding in an agate mortar and then oven
drying (at 60ºC) both the base-materials and the salts. The composite samples were
obtained by simply mixing the powders in the testing receptacles. The entire or granular lime
mortar samples were obtained by breaking or disintegrating the mortar prisms, respectively.
Brick or mortar samples with salt contents up to 10% were tested in all except the following
two cases: (i) in the second set, mortar samples with Na2SO4 content up to 100% were also
tested to allow understanding better the behaviour of this salt; (ii) in the case of the salt
mixtures, samples with total salt content up to 5% were used because they were intended to
represent salt mixtures found in real walls where 5% is already a very high salt content.
The deep narrow receptacles are small cylindrical plastic boxes with dimensions of about
5 cm in height by 3 cm in diameter. The shallow-wide receptacles are common glass Petri
dishes of 10 cm in diameter.
A FITOCLIMA 500 EDTU® climatic chamber (by Aralab, Portugal) and an analytical
weighing device with resolution of 10-4 g and accurate to 10-3 g were used. The technical
specifications for the climatic chamber indicate a maximum RH fluctuation of ± 2% within the
range of 10% to 98% RH. But in practice, over the period of the present experiments,
maximum fluctuation of ±0.2% (±0.1% during around 70% of the time) was registered by the
chamber sensor about the value of 95.0% RH.

50 Chapter 3
3.5.3 - Results
3.5.3.1 - General
The results of the HMC experiments are presented in sections 3.5.4.2 to 3.5.4.9. In section
3.4.2.10 the error that would arise if the obtained HMC values were used to estimate the salt
content in the samples is evaluated. When nothing is specified, the results refer to tests
carried out on samples in deep narrow receptacles.
For most groups of samples (samples with different content of the same salt) regression lines
are calculated that fit the obtained HMC values. The coefficient of determination (R2) is a
measure of how well the regression line represents the data and, therefore, allows evaluating
whether a good linear correlation HMC / salt content exists.
The experiments were carried out with the climatic chamber set-pointed at 20ºC and 80% or
95% RH. The HMC expected in equilibrium conditions at either RH is calculated by means of
tables of thermodynamic data (Robinson and Stokes 2002, Robinson and Macaskill 1979,
Roy et al. 1984). Such tables indicate the water activity aw or the osmotic coefficient φ, by
which aw can be calculated through Eq. 3.1, for different molal concentrations of a given salt
solution at a certain temperature. The molality m of the salt solution in equilibrium at 80.0%
RH or 95.0% RH corresponds to water activity values of 0.80 or 0.95, respectively. The HMC
expected for a sample with 100% salt content is calculated by merging equations 3.4 and 3.5
and then inserting the obtained value of m. The HMC of the base-materials is, hence,
assumed to be zero.
Since thermodynamic data at 20ºC, temperature at which the experiments were carried out,
were only available for NaCl, data at 25ºC were used: water activities for NaCl and KCl,
osmotic coefficients for the other salts (Robinson and Stokes 2002, Robinson and Macaskill
1979, Roy et al. 1984).
For NaCl, water activities up to around 0.92 were available both for 20ºC and 25ºC by Olynyk
and Gordon (1943). These values indicate that no HMC differences arise from that
temperature difference, as seen in Fig. 3.11. However, this is not necessarily true for other
soluble salts.
200
400
600
800
75 80 85 90 95
HR (%)
HM
C (%
)
20ºC
25ºC
Fig. 3.11 - HMC of NaCl at 20ºC or 25ºC. Obtained from
thermodynamic data by Olynyk and Gordon (1943).

General Laboratory Techniques 51
The actual RH in the chamber is estimated using either:
• HMC of the pure salt samples;
• Regression equations of the contaminated brick or mortar samples. In this case, the
HMC that corresponds to 100% salt content is considered.
These HMC values correspond to the concentration of the salt solution in equilibrium at the
actual RH and temperature (Eq. 3.4 and 3.5). So, by linear interpolation on the tables of
thermodynamic data, the water activity aw of that solution can be determined. That water
activity represents the actual RH in the chamber. Due to the lack of thermodynamic data at
20ºC, data at 25ºC is used
3.5.3.2 - Mass stabilization
In the experiments performed with deep narrow receptacles, mass stabilization of the
samples could indeed be detected simply by visual assessment of the HMC versus time
graphs. An example is presented in Fig. 3.12. The situation was different in the case of the
shallow-wide receptacles as shown in the next section.
0
20
40
60
80
0 10 20 30 40
Time (days)
HM
C 9
5%
RH
(%
)
M 0.1% NaCl M 0.6% NaCl M 1.1% NaCl
M 2.1% NaCl M 5.0% NaCl
Fig. 3.12 - Evolution over time of the actual HMC of NaCl-loaded mortar
samples in the deep narrow receptacles (second set of tests)
3.5.3.3 - Pure salts
Fig. 3.13 allows comparing the behaviour of the pure-salt samples in the two types of
receptacles. This figure depicts the evolution over time of the HMC for the six salts whose
RHeqsat is lower than 95% and for sodium sulfate. The experiments were performed at set-
point conditions of 95% RH and 20ºC. Fig. 3.14 allows evaluating agreement of the actual
HMC values to the values expected in equilibrium conditions at 95.0% RH and 25ºC (dotted
lines).
T=20ºC

52 Chapter 3
0
200
400
600
800
1000
1200
1400
0 10 20 30 40 50 60 70
Time (days)
HM
C 9
5%
RH
(%
)
0.5g KCl 0.5g KCl-petri
0.5g KNO3 0.5g KNO3-petri
0.5g Na2CO3 0.5g Na2CO3-petri
0.5g K2CO3 0.5g K2CO3-petri
0
200
400
600
800
1000
1200
1400
0 10 20 30 40 50 60 70
Time (days)
HM
C 9
5%
RH
(%
)
0.5g NaCl 0.5g NaCl-petri
0.5g Na2SO4 0.5g Na2SO4 petri
0.5g NaNO3 0.5g NaNO3-petri
Fig. 3.13 – Actual HMC of the pure salts in different receptacles: chlorides and nitrates (left);
sodium sulfate and carbonates (right)
0
200
400
600
800
1000
1200
0 10 20 30 40 50 60 70
Time (days)
HM
C 9
5%
RH
(%
)
0.5g NaCl 0.5g KNO3
0.5g NaNO3 0.5g KCl
theoretical HMC 95% RH
0
200
400
600
800
1000
1200
0 10 20 30 40 50 60 70
Time (days)
HM
C 9
5%
RH
(%
)
0.5g Na2CO3 0.5g K2CO3
theoretical HMC 95% RH 0.5g Na2SO4
Fig. 3.14 – Comparison of the actual HMC of the pure salts in deep-narrow receptacles to the
HMC expected at 95.0% RH and 25ºC: chlorides and nitrates (left); sodium sulfate and
carbonates (right).
These experiments on pure-salt samples were carried out in the second set of tests, as
indicated in Table 3.1. Table 3.4 depicts the actual RH in the chamber during this second set,
as estimated by means of the actual HMC of the salts. Two different moments were
considered:
• the 29th day of testing which corresponds to the end of the tests on brick and mortar
samples presented in sections 3.5.4.6 to 3.5.4.8; in this case, the HMC of the
samples in shallow-wide receptacles was used because the samples in deep-narrow
receptacles were still far from mass stabilization;
HMC expected at 95.0% RH and 25ºC expected
T=20ºC T=20ºC
20ºC
20ºC
HMC expected at 95.0% RH and 25ºC

General Laboratory Techniques 53
• the 64th day of testing which corresponds to the end of the tests on all pure salt
samples; the HMC of the samples in deep-narrow receptacles was used in this case
because it was in general more stable than that of the shallow-wide receptacles.
Table 3.4 - Actual RH during the second set: at the end of the tests on loaded brick or mortar
(29 days) and on pure salt samples (64 days)
Actual RH in the climatic chamber (%)
(estimated by means of the HMC of the pure salt samples)
Moment at which the actual RH
was estimated and samples used
for that estimate NaCl KCl Na2SO4 NaNO3 KNO3 Na2CO3 K2CO3
29 days (shallow-wide receptacles) 95.6 95.9 95.2 95.2 95.1 95.4 95.7
64 days (deep-narrow receptacles) 94.9 95.0 95.0 95.1 94.9 95.3 95.2
3.5.3.4 - Base-materials (mortar and brick)
The HMC of the samples composed only of brick (powder) or only of mortar (powder,
granular or entire) is depicted in Fig. 3.15.
0.20.3 0.3
0.5
1.11.0
1.1
0.3
1.11.0
0.9
1.3
0.0
0.5
1.0
1.5
2.0
g
1.8
g
1.4
g
1.0
g
2.0
g
1.8
g
1.4
g
1.0
g
2.0
g
2.0
g
1.8
g
1.8
g
HM
C 9
5%
HR
(%
)
1st set 2nd set
T = 20ºC
1Brick powder Mortar powder
Mortar granular Mortar entire
Fig. 3.15 - HMC of the base-materials
3.5.3.5 - Sodium chloride or sodium sulfate loaded materials: HMC at 80% RH
Fig. 3.16 depicts the HMC at set-point conditions of 80% RH and 20ºC of brick and mortar
samples with increasing contents of NaCl or Na2SO4. In the figure, the dotted line
corresponds to the HMC expected for NaCl in equilibrium conditions at 80.0% RH and 25ºC.
Table 3.5 presents, for NaCl, the equations of the regression lines that fit the experimental
values and the estimates for the actual RH in the chamber. Since Na2SO4 attracted no
moisture, no reference values are presented for this salt.

54 Chapter 3
0
10
20
30
40
0 2 4 6 8 10 12
Salt content (%)
HM
C 8
0%
RH
(%
)Mortar-NaCl Brick-NaCl
Mortar-Na2SO4 Brick-Na2SO4
20ºC
- - - - - Expected HMC 80.0%RH 25ºC
Fig. 3.16 - HMC of NaCl or Na2SO4 loaded
mortar or brick samples at 80% RH
Table 3.5 - HMC at 80%RH and 20ºC: actual RH
and correlation equations for NaCl-loaded brick
or mortar samples
Base-
material
Line equation
y - HMC (%)
x - salt content (%)
Coefficient of
determination
(R2)
Actual
RH (%)
at 25ºC
mortar y=3.4x+0.3 1.0000 80.5
brick y=3.4x+0.1 1.0000 80.5
3.5.3.6 - Sodium chloride loaded materials
Fig. 3.17 depicts the HMC of NaCl-loaded brick or mortar samples at set-point conditions of
95% RH and 20ºC in either set of tests. The dotted line represents the HMC expected at
95.0% RH and 25ºC. Table 3.6 presents the linear regression equations that fit the
experimental data and the corresponding estimates of the actual RH in the chamber.
0
50
100
150
0 5 10
Salt content (%)
HM
C 9
5%
RH
(%
)
Mort-NaCl 2nd set
Mort-NaCl 1st set
Brick-NaCl 1st set
Expected HMC 95.0% RH 25ºC
20ºC
Fig. 3.17- HMC of NaCl-loaded brick or mortar
samples at 95% RH
Table 3.6 - HMC at 95%RH and 20ºC: actual RH and
correlation equations for NaCl-loaded brick or mortar samples
Set Base-
material
Line equation
y - HMC (%)
x - salt content (%)
Coefficient of
determination
(R2)
Actual
RH
(%)
at
25ºC
mortar y=12.6x+1.1 0.9998 95.4 1
st
brick y=12.7x+0.3 0.9998 95.5
2nd
mortar y=13.1x+1.1 1.0000 95.6
3.5.3.7 Sodium sulfate loaded materials
Fig. 3.18 depicts the HMC of Na2SO4-loaded brick or mortar samples obtained at set-point
conditions of 95% RH and 20ºC in either set of tests. Two different graphs are presented for
reasons of legibility because a much larger range of salt contents was used for Na2SO4 than
for the other salts. The dotted lines in this figure correspond to: (i) HMC values expected at

General Laboratory Techniques 55
95.0% RH and 25ºC; (ii) water (%W) that would be held by the samples if the thenardite
initially present in these samples totally hydrated into mirabilite; (iii) MC corresponding to the
maximum solubility of the metastable heptahydrate, obtained from solubility data at 20ºC
(Lurie 1975).
0
50
100
150
200
250
0 10 20 30 40 50 60
Salt content (%)
HM
C 9
5%
RH
(%
)
Mort-Na2SO4 1st set
Brick-Na2SO4 1st set
Mort-Na2SO4 2nd set
Expect HMC 95.0%RH 25ºC
Mirabilite
Max sol heptahydrate
20ºC
0
10
20
30
40
50
0 5 10 15
Salt content (%)
HM
C 9
5%
RH
(%
)
Mort-Na2SO4 1st set
Brick-Na2SO4 1st set
Mort-Na2SO4 2nd set
Expect HMC 95.0%RH 25ºC
Mirabilite
Max sol heptahydrate
20ºC
Fig. 3.18 - HMC of Na2SO4-loaded brick or mortar samples at 95% RH:
higher (left) and lower (right) salt contents.
Table 3.7 presents the equations of the regression lines that fit the experimental data and the
corresponding estimates of the actual RH in the chamber. Both the equations and the actual
RH were calculated only for salt contents below 2% because, as seen in Fig. 3.18, the HMC
obtained at higher salt contents is too erratic to fit a linear regression.
Table 3.7 - HMC at 95%RH and 20ºC: actual RH and correlation equations
for mortar or brick samples with Na2SO4-content below 2%
Set Base-material
Line equation
y - HMC (%)
x - salt cont. (%)
Coefficient of
determination
(R2)
Actual RH (%)
at 25ºC
mortar y=4.0x+1.1 0.9992 94.3 1
st
brick y=4.9x+0.3 0.9994 95.3
2nd
mortar y=5.1x+1.1 0.9933 95.4
Aiming at a better understanding of the apparently random behaviour of the samples with
Na2SO4 content above 2%, a more detailed analysis of the results obtained in the second set
of experiments is presented bellow. That was possible because, after the unexpected
behaviour of Na2SO4 in the first set, more frequent (weekly) weighting and visual observation
of the samples were carried out in the second set.

56 Chapter 3
Fig. 3.19 depicts the absorption dynamics of the Na2SO4-loaded samples during the
second-set experiments. Two samples with salt content above 50%, which were not
presented in Fig. 3.18 because they had not achieved equilibrium at the end of the test, are
also included here.
0
20
40
60
80
0 5 10 15
Salt content (%)
HM
C 9
5%
RH
(%
)
20ºC
020406080100
0 5 10 15
1 week 2 weeks 1 month 1.5 month 2 month
0
100
200
300
400
500
0 50 100
Salt content (%)
HM
C 9
5%
RH
(%
)
20ºC
020406080100Mirabilite Exp HMC 95.0%RH 25ºC Max sol heptahydrate
Fig. 3.19 – Evolution over time of the HMC of mortar samples of the second set of tests
with Na2SO4 content up to 100%
Visual observation of the samples at the end of the second set experiments allowed the
observation of the following alterations:
• all the samples with salt content above 10%, except the sample with 75% salt
content, were covered with liquid;
• a solid crust of salt was present on the surface of the sample with 75% salt content;
• a large crystal immerse in the solution was seen for the 100% salt sample.
The samples with less than 10% of salt showed no significant changes.
3.5.3.8 - Mortar loaded with other soluble salts
Fig. 3.20 depicts the HMC of mortar samples with increasing content of NaCl, KCl, K2SO4,
NaNO3, Na2CO3 or K2CO3. These experiments were performed at set-point conditions of
95% RH and 20ºC in the second set. The results of NaCl were previously presented in
Fig. 3.17 and Table 3.6 but are repeated here to permit a comparison. Na2SO4 was not
included due to its random behaviour. CaSO4.2H2O and KNO3 are also not included because
they had no significant absorption of moisture (HMC of around 1.2% was obtained in both
cases). Table 3.8 presents the linear regression equations that fit the experimental data, as
well as the corresponding estimates of the actual RH in the chamber.

General Laboratory Techniques 57
0
10
20
30
40
50
60
70
0 1 2 3 4 5 6 7
Salt content (%)
HM
C 9
5%
RH
(%
)NaCl
KCl
NaNO3
Na2CO3
K2CO3
KNO3
Fig. 3.20 - HMC at 95% RH of mortar samples
loaded with each of six distinct salts
Table 3.8 - HMC at 95%RH and 20ºC: actual RH
and correlation equations for mortar samples
loaded with six distinct salts
Salt
Line equation
y - HMC (%)
x - salt content (%)
Coefficient of
determination
(R2)
Actual
RH (%)
at 25ºC
NaCl y = 13.1x + 1.1 0.9999 95.6
KCl y = 9.9x + 1.1 0.9997 95.8
NaNO3 y = 8.1x + 1.1 0.9998 95.8
KNO3 y = 5.3x + 1.1 0.9993 95.5
Na2CO3 y = 7.7x + 1.1 0.9978 95.5
K2CO3 y = 6.6x + 1.1 0.9966 95.3
3.5.3.9 - Salt mixtures
Fig. 3.21 presents the HMC values obtained for mortar samples with increasing content of
each of the four mixtures of NaCl, NaNO3 and Na2SO4 whose composition is depicted in
Table 3.3. The experiments were carried out at set-point conditions of 95% RH and 20ºC in
the second set. Table 3.9 presents the equations of the corresponding regression lines.
0
10
20
30
40
50
60
0 2 4 6
Total salt content (%)
HM
C 9
5%
RH
(%
)
Mix A
Mix B
Mix C
Mix D
20ºC
Fig. 3.21 - HMC at 95% RH of mortar loaded with
four different salt mixtures
Table 3.9 - HMC at 95%RH and 20ºC:
correlation equations for mortar
samples loaded with four salt mixtures
HMC of salt mixture loaded
mortar (%)
Mixture
Line equation
Coefficient of
determination
(R2)
A y = 8,0 x + 1,1 0,9998
B y = 9,6 x + 1,1 0,9992
C y = 9,8 x + 1,1 0,9995
D y = 8,8 x + 1,1 0,9993
Fig. 3.22 allows comparing the actual HMC of the mixtures to the values calculated by
weighing the HMC of the individual salts, either in the case of their actual HMC (Tables 3.7
and 3.8) or of the HMC expected at 95.0% RH and 25ºC. Table 3.10 quantifies the
agreement of the actual HMC of the mixtures to these weighted values.
20ºC

58 Chapter 3
0
20
40
60
0 1 2 3 4 5 6
Salt content (%)
HM
C (%
)
A (95%RH 20ºC)
A (single salts 95%RH 20ºC)
A (theor 95%RH 25ºC)
0
20
40
60
0 1 2 3 4 5 6
Salt content (%)
HM
C (%
)
B (95%RH 20ºC)
B (single salts 95%RH 20ºC)
B (theor 95%RH 25ºC)
0
20
40
60
0 1 2 3 4 5 6
Salt content (%)
HM
C (%
)
C (95%RH 20ºC)
C (single salts 95%RH 20ºC)
C (theor 95%RH 25ºC)
0
20
40
60
0 1 2 3 4 5 6
Salt content (%)
HM
C (%
)
D (95%RH 20ºC)
D (single salts 95%RH 20ºC)
D (theor 95%RH 25ºC)
Fig. 3.22 - Actual HMC for the salt mixtures and theoretical HMC calculated by weighing
either the actual HMC or the HMC expected at 95.0% RH and 25ºC of the individual salts
Table 3.10 - Agreement of the actual HMC of the mixture with the value obtained by weighting
the HMC of the individual salts
Mixture A Mixture B Mixture C Mixture D
Actual HMC of the mixture
at 95% 20ºC (%) HMCact ≈8.0 x HMCact ≈ 9.6 x HMCact ≈ 9.8 x HMCact ≈ 8.8 x
HMC of the mixture (%) estimated by
weighing the actual HMC of the salts
at 95% and 20ºC
HMCest≈8.8x HMCest ≈9.8x HMCest ≈10.6x HMCest ≈9.1x
Lin
ear re
gre
ssio
n
equations
HMC of the mixture (%) estimated by
weighing the HMC of the salts expected
at 95.0% and 25ºC
HMCest ≈7.7x HMCest ≈8.6x HMCest ≈9.2x HMCest ≈8.1x
When the HMC of the
mixture is estimated
by means of the
actual HMC of the
individual salts
-9.1 -2.0 -7.5 -3.3 Significance of the difference
between the actual and the
estimated HMC of the mixture:
est
estact
HMC
HMCHMC -100 (%)
When the HMC of the
mixture is estimated
by means of the HMC
expected for the
individual salts
3.9 11.6 6.5 8.6
* For sodium sulfate, the linear equation corresponding to salt content of less than 2% (Table 3.7) was used
20ºC 20ºC
20ºC 20ºC
HM
C 9
5%
RH
(%
)
Salt content (%) Salt content (%)
Salt content (%) Salt content (%)
HM
C 9
5%
RH
(%
)
HM
C 9
5%
RH
(%
)
HM
C 9
5%
RH
(%
)
B (95% RH 20ºC)
B (salts 95%RH 20ºC)
B (salts expect 95.0%RH 25ºC)
A (95% RH 20ºC)
A (salts 95%RH 20ºC)
A (salts expect 95.0%RH 25ºC)
C (95% RH 20ºC)
C (salts 95%RH 20ºC)
C (salts expect 95.0%RH 25ºC)
D (95% RH 20ºC)
D (salts 95%RH 20ºC)
D (salts expect 95.0%RH 25ºC)

General Laboratory Techniques 59
Table 3.11 allows evaluating the maximum dispersion of the HMC between the four mixtures.
This is done by considering the maximum HMC difference, which is between mixture C and
mixture A (Fig. 3.21), and then accessing its significance in relation to the average HMC of
the four mixtures.
Table 3.11 – Significance of the maximum HMC variation among the salt mixtures
Mixture C : HMCmax
≈ 9.8 x
Mixture A: HMCmin
≈ 8.0 x
Average of the four mixtures: HMCav
≈ 9.1x avHMC
HMCHMC minmax -100 =19.9 (%)
3.5.3.10 - Error in salt content estimates
Table 3.12 presents the error α (Eq. 3.9) that arises when the salt content in the samples is
estimated, by means of the actual HMC values obtained at set-point conditions of 95% RH
and 20ºC, using as reference the HMC values expected at 95.0% and 25ºC.
Table 3.12 - Error in salt content estimates
Actual HMC at 95% RH and 20ºC
Set Samples RH
(%) Equation
y=HMC (%)
x=salt content (%)
y(x=100%)
concerns
parameter
E+ in Eq. 3.9
HMC expected at
95.0% and 25ºC for
samples with 100%
salt content (concerns
parameters E– ≡ E in
Eq. 3.9)
(%)-
100E
EE +
=α
(from Eq. 3.9)
1 mortar + NaCl 80 y=3.4x+0.3 340.3 332.5 2.3
1 brick + NaCl 80 y=3.4x+0.1 340.1 332.5 2.3
1 mortar + NaCl 95 y=12.6x+1.1 1270.3 1153.4 10.1
1 brick + NaCl 95 y=12.7x+0.3 1261.1 1153.4 9.3
2 mortar + NaCl 95 y=13.1x+1.1 1310.3 1153.4 13.6
1 mortar + Na2SO4
(<2%) 95 y=4.0x+1.1 400.3 463.6 -13.6
1 brick + Na2SO4
(<2%) 95 y=4.9x+0.3 490.3 463.6 5.8
2 mortar +
Na2SO4 (<2%) 95 y=5.1x+1.1 511.1 463.6 10.3
2 mortar + KCl 95 y = 9.9x + 1.1 991.1 853.1 16.2
2 mortar + NaNO3 95 y = 8.1x + 1.1 811.1 692.0 17.2
2 mortar + KNO3 95 y = 5.3x + 1.1 531.1 459.1 15.7
2 mortar +
Na2CO3 95 y = 7.7x + 1.1 771.1 671.2 14.9
2 mortar + K2CO3 95 y = 6.6x + 1.1 661.1 616.3 7.3

60 Chapter 3
3.5.4 - Discussion
3.5.4.1 - Influence of the base-materials and their state of cohesion
As expected, the HMC of the base-materials (mortar and brick) is extremely low (Fig. 3.15)
when compared to the HMC of the soluble salts (Fig. 3.13). Accordingly, the base-material
does not have a relevant influence on the HMC of the salt-loaded materials: materials with
the same salt content result in similar HMC values, regardless of whether they are brick or
mortar. This happens both for NaCl (Figs. 3.16 and 3.17) and for Na2SO4 (Figs. 3.16 and
3.18) whose HMC deviations are clearly not related to the nature of the base-material.
Further, no significant differences are found (Fig. 3.15) between the results obtained for the
three cohesion states of the mortar samples (powder, granular and entire pieces). This
corroborates the conclusions of other authors (Lubelli et al. 2004).
3.5.4.2 - Mass stabilization
The shape of the receptacle can significantly influence the mass stabilization of the samples.
Fig 3.13 depicts the results obtained with the two types of receptacles and shows that:
• The absorption/dissolution process of the salts is slower when deep narrow receptacles
are used. This is probably due to: (i) the low velocity of the air, thus, to the low moisture
transfer rate between the sample and the adjacent air in these receptacles which are
deeper than the Petri dishes; (ii) the smaller exposed area of the material/solution in these
receptacles which are narrower than the Petri dishes. Accordingly, hygroscopic
equilibrium takes longer to be reached in the deep-narrow receptacles than in the
shallow-wide Petri dishes.
• In general, the HMC is more stable for the deep-narrow than for the shallow-wide
receptacles. With the deep-narrow receptacles all the samples ultimately achieve a
constant mass. But with the shallow-wide Petri dishes this does not occur for all the salts.
Apparently, the deep-narrow receptacles, by slowing the moisture transfer rate, also
“smooth” the effects of the environmental oscillation on the HMC.
• The HMC is more stable for some salts (KNO3, NaNO3 and even Na2SO4) than others
(NaCl, KCl, Na2CO3 and K2CO3) particularly when shallow-wide receptacles are used.
Perhaps a fast dissolution kinetics and high HMC is what determines the tendency of
some salts for generating unstable HMC values. KNO3, for example, which has the slower
hygroscopic reaction and one of the lowest HMC, shows stable HMC values in both types
of receptacles. By contrast, NaCl, which has a very fast hygroscopic reaction and the
highest HMC, shows less stable HMC when shallow-wide receptacles are used. However,
some situations are not totally clear. For example, the HMC and hygroscopic reaction of
NaNO3 and K2CO3 are quite similar. Yet, in the shallow-wide receptacles, the HMC of
NaNO3 is very stable, while the HMC of K2CO3 oscillates.

General Laboratory Techniques 61
3.5.4.3 - Correlation HMC/salt content
Good linear correlations HMC / salt content are obtained, either in or among the two sets of
experiments, for the salts whose RHeqsat is below the actual RH in the chamber. Figs. 3.17
and 3.20 and Tables 3.6 and 3.8 show good linear correlations HMC / salt content at 95%
RH for NaCl, KCl, K2SO4, NaNO3, Na2CO3 and K2CO3. The same occurs for NaCl at 80%
RH, as shown in Fig. 3.16 and Table 3.5.
Sodium sulfate is a special case. Although the pure Na2SO4 samples achieve the equilibrium
concentration (Fig. 3.14), the salt-loaded brick or mortar samples do not provide sound linear
correlations. At 95% RH, a reasonable linear correlation is found only for Na2SO4 contents of
2% or less (Fig. 3.18). Further, at 80% RH, the Na2SO4-loaded samples do not attract any
moisture (Fig 3.16) despite the air RH being higher than that (77% RH) corresponding to the
hydration of thenardite (Fig. 2.9).
With the four salt mixtures, good linear correlations are found (Fig. 3.21 and Table 3.9),
nonetheless sodium sulfate is present in three of them.
Gypsum and potassium sulfate showed no significant absorption of moisture because their
RHeqsat is of 97.6 % and 99.6 %, respectively (Table 3.2). Therefore, hygroscopic absorption
is not expected to occur at 95% RH.
The good linear correlations HMC / salt content obtained for all salts (but Na2SO4) and salt
mixtures suggest that the environmental conditions in the chamber were quite homogenous
in space (Tables 3.5, 3.6 and 3.8). The fact that very similar correlations were obtained for
NaCl among the two sets (Fig. 3.17 and Table 3.6) indicates that these conditions were also
reasonably constant in time (from set to set).
3.5.4.4 - Accuracy
HMC values quite similar to those expected at thermodynamic equilibrium are obtained,
either at 80% or 95% RH, for all the pure salt samples and nearly all salt-loaded brick or
mortar samples (Fig. 3.14, 3.16 and 3.17). Na2SO4 is the only exception and, hence, will be
discussed in more detail in the next section.
Because the HMC of NaCl is not relevantly affected by temperature (Fig. 3.11), the use of
reference data at 25ºC instead of 20ºC is not in this case relevant. Therefore, the RH values
estimated by means of NaCl (Tables 3.4, 3.5 and 3.6) are likely to correspond to the actual
RH in the chamber:
- 80.5% or 95.4% to 95.5% at the end of the first set experiments
- 95.6% in the first month of the second set (at the end of the tests on salt-loaded
mortar samples)
- 94.9% at the end of the second set (end of tests on pure salt samples)

62 Chapter 3
These values indicate that:
- the RH in the chamber was a few decimals above 95.0% in the first set;
- the same happened probably during the first month of the second set; the other salts
tested in this period also indicate a actual RH a fraction above 95.0%
(Table 3.8); this suggests that the HMC of these other salts was not relevantly
affected by, nevertheless unlikely, temperature deviations;
- in the second set, a RH drop of around 0.5% probably occurred between the 29th and
the 64th days.
As seen in Table 3.12, the error that would arise if the salt content in the samples was
estimated by means of the actual HMC values is low at the set-point RH of 80% (2.3% for
NaCl) but higher at the set-point RH of 95% (from 7.3% to 17.2% for all salts but Na2SO4). In
the case of Na2SO4, the error is very uneven (from -13.6% to 10.3% at 95% RH) even
though it was calculated considering only the samples with less than 2% salt content.
3.5.4.5 - Sodium sulfate
Sodium sulfate is an exception among all the tested salts, as pointed in the previous
sections. Despite the pure salt samples achieved equilibrium (Fig. 3.14) many of the salt-
loaded brick or mortar samples had an apparently erratic behaviour.
At the set-point RH of 80%, the NaCl-loaded samples achieved concentrations that
correspond to an actual RH of 80.5% (Table 3.5). This demonstrates the soundness of the
environmental conditions in the chamber. Yet, the Na2SO4-loaded samples did not attract
any moisture (Fig. 3.16) despite the hydration RH of Na2SO4 (77%, as seen in Fig. 2.9) being
clearly below that actual RH.
This behaviour of sodium sulfate is not in agreement with the results of Lubelli et al. (2004)
who reported hydration of thenardite into mirabilite at 80% RH and 20ºC. But it may be in
agreement with theories arguing that the hydration mechanism of thenardite to mirabilite is in
practice “through-solution hydration”, that is, dissolution of thenardite followed by
precipitation of mirabilite from a supersaturated solution (Charola and Weber 1992,
MacMahon et al. 1992, Rodriguez-Navarro et al. 2000). Since dissolution of thenardite at
20ºC happens only at 87% RH (Fig. 2.9), direct hydration of thenardite to mirabilite cannot
probably occur at 80% RH.
At set-point conditions of 95% RH, reasonable agreement with the values expected in
equilibrium at 95.0% RH was obtained for all the samples with salt content of 2% or less
(Fig. 3.18 and Table 3.7). Yet, for salt contents above 2%, apparently random results arose:
• In the first set, the HMC of the samples with 5%, 10%, 30% or 50% salt content is far
from agreeing with the values expected at 95.0% RH (Fig. 3.18). Particularly, the
samples with 30% or 50% salt content crystallized as mirabilite and remained
(undissolved) in that condition.
• In the second set, most of the samples follow approximately the 95.0% RH
equilibrium line (Figs. 3.18 and 3.19). However, the samples with 5%, 75% or 100%
salt content have lower HMC, though the 100% sample would possibly attain the
95.0% RH equilibrium line if the test had not ended before its mass was stabilized.

General Laboratory Techniques 63
The HMC of the 75% sample in the second set and 5% samples in either set agrees
approximately to the maximum solubility of the metastable heptahydrate (Figs. 3.18 and
3.19). In particular, the 75% sample attained a maximum HMC value at the 1.5 months,
which afterwards started decreasing. This indicates that crystallization started at the
maximum solubility of the heptahydrate and was still occurring at the end of the test.
Therefore, it is probable that the phase observed at the surface of the 75% sample was the
heptahydrate.
This random behaviour of Na2SO4 at the set-point of 95% RH arises probably from the actual
RH in the chamber being, most of the time, practically coincident to the RHeqsat of mirabilite
(Table 3.6, for instance). Indeed, the set-point RH of 95% was chosen based on the former
assumption that the RHeqsat of mirabilite was of 93.6% at 20ºC (Price and Brimblecombe
1994, for instance). But further theoretical work (Linnow et al. 2006) indicated a RHeqsat of
95.6% at 20º (Fig. 2.9). The present experimental results corroborate, therefore, this new
value.
3.5.4.6 - Salt mixtures
All salt mixtures provided good linear correlation HMC / salt content, as seen in Fig. 3.21 and
Table 3.9, despite sodium sulfate being present in three of them (Table 3.3).
The agreement with the HMC estimated by weighing the (actual or equilibrium) HMC of the
individual salts is also very reasonable (Fig. 3.22 and Table 3.10). Indeed, the difference is
always less than 12% of the estimated HMC. This suggests that, at 95% RH, the solutions
become dilute enough for the salts in the mixtures not to have a very significant interaction.
On the contrary, in strong aqueous solutions these interactions are very strong, hence, the
behaviour of the mixture cannot be predicted on the basis of the behaviour of the individual
salts (Price and Brimblecomb 1994).
In a previous study (Lubelli et al., 2004) on a mixture of 50% Na2SO4, 25% NaCl and 25%
NaNO3 a reasonably good agreement was also found between the actual HMC of the mixture
at 96% RH and 20ºC and the HMC estimated by weighing the actual HMC of the three salts
in similar environmental conditions. However, a significant difference was found between the
actual HMC of the mixture and the HMC estimated by weighing the individual HMC values
expected at equilibrium. Further, at 93% RH and 20ºC, significant difference between the
three HMC values was obtained. One of the possible causes that the authors indicate for
these discrepancies is the actual RH being lower than expected. This seems probable, in
accordance to what was argued in section 3.3, because the experiments were performed in
closed containers where the RH was controlled by means of aqueous salt solutions.
The dispersion of the actual HMC values among the four mixtures is reasonably low: the
maximum HMC difference is between mixtures A and C and represents around 20% of the
average HMC of the four mixtures (Table 3.11). Though higher differences may exist for
different salt mixtures, this suggests that estimates of the salt content sufficiently accurate for
some practical purposes are perhaps possible by means of the HMC method, even if the salt
mixture has some variation from sample to sample.

64 Chapter 3
3.6 Conclusions
The overall conclusions of the work carried out to assess the possibilities and limitations of
the two laboratory techniques, for RH control by salt solutions and salt content evaluation by
the HMC method, are that:
- The use of aqueous solutions for RH control is not in general a safe method when
salt-loaded materials are present.
- The HMC method can allow, although not in all situations, sufficiently accurate
estimation of the salt content.
Use of aqueous solutions for control of the relative humidity
Aqueous solutions may not allow a stable control of the environmental conditions when
salt-loaded materials are present. As demonstrated by the experimental research presented
in section 3.3, both the RH and temperature may be disturbed during significant periods by
secondary solutions that: (i) exist on wet materials; (ii) may form on dry materials when the
RH in the containers is higher that the RHeqsat of the contaminant salt. Temperature
disturbance is expected to be, in general, less significant over time because it arises
predominantly from dissolution or crystallization processes. In contrast, RH disturbance may
persist for longer periods following (slower) solution concentration changes.
Given the number and complexity of the possible influencing factors it is unfeasible to set
general threshold values. Furthermore, the acceptable magnitude for the variation of the
environmental parameters depends on the type of test. For instance, within HMC
experiments, RH variability of only a few decimals may be already unacceptable. Indeed, as
shown in section 3.4, the HMC of salt-loaded materials may suffer high magnitude deviations
as a result of small RH variations. In contrast, in other tests, such as some crystallization
tests, an RH range of several units may be acceptable. Therefore, case-by-case decisions
should be made. Nonetheless, except for dry materials stored at an RH below the RHeqsat of
the contaminant salt:
• Methods of controlling the RH by means of aqueous solutions should be avoided in
the case of salt-loaded materials. The use of climatic chambers is preferable.
• If methods of controlling the RH by means of pure water or salt solutions are used on
salt-loaded materials, the environmental conditions inside the testing containers
should be monitored.
Evaluation of the salt content by means of the HMC method
The HMC method for salt content evaluation was systematized and discussed on the basis
of theoretical and experimental work presented in sections 3.4 and 3.5, respectively. This
research suggested that the method can be effective for most soluble salts when a RH
above the RHeqsat of the salts is used.

General Laboratory Techniques 65
Good linear correlations HMC / salt content and agreement with the values expected from
equilibrium thermodynamic data were obtained for NaCl at 20ºC and 80%RH or 95%RH, as
well as, at 95%RH and 20ºC, for KCl, K2SO4, NaNO3, Na2CO3, K2CO3 and the four mixtures
of NaCl, Na2SO4 and NaNO3.
Only for Na2SO4 a coherent linear correlation HMC / salt content could not be found:
• At 80% RH (20ºC) that happened probably because the hydration of thenardite into
mirabilite proceeds via dissolution of thenardite and further crystallization of mirabilite
from a supersaturated solution. Therefore, since thenardite only dissolves at 87% RH,
such process could not occur at 80% RH.
• At 95% RH (20ºC), the random behaviour of sodium sulfate was most likely due to the
actual RH in the chamber being practically coincident to the newly proposed RHeqsat of
mirabilite which is of 95.6% (Linnow et al. 2006). In fact, the present experimental
results could not be fully explained in a recent article (Gonçalves et al. 2006a) where
the previous value of 93.6% RH was still considered. But they fit with and, hence,
support this new value.
It is, therefore, recommendable to perform preliminary HMC experiments whenever possible,
particularly when the behaviour of the involved salts at the chosen RH and temperature is
poorly known. Nonetheless, in general, the HMC method is expected to allow either an
absolute or at least a relative evaluation of the salt content.
Absolute determination of the salt content is possible:
• For salts of well-known thermodynamic properties, by comparing the actual HMC with the
HMC expected at equilibrium (obtained from tables of thermodynamic data).
• For salts available/replicable at the laboratory, either their thermodynamic properties are
known or unknown, by using an experimental correlation line obtained by means of
control-samples.
• For some salt mixtures. At high RH such as 95%, very dilute solutions can form and,
hence, the salts in the mixture do not have a significant interaction. This is suggested by
the experimental results obtained here with NaCl, Na2SO4 and NaNO3. For many
practical applications, the HMC of mixtures with similar behaviour is sufficiently similar to
the value calculated by weighing the (actual or equilibrium) HMC of the individual salts.
Relative evaluation of the salt content in several samples is theoretically possible, because
the HMC is directly proportional to the salt content, for salts of unknown thermodynamic
properties that are neither available nor are possible to replicate in the laboratory. That is the
case of, for instance, samples collected from buildings which are normally loaded with
complex salt mixtures. An estimate of the salt content sufficiently accurate for some practical
purposes is still expected to be possible, even if the salt mixture is not totally homogeneous
from sample to sample. Indeed, a maximum HMC variation of around 20% in relation to the
average HMC of the four mixtures of NaCl, Na2SO4 and NaNO3 was obtained, despite the
significant variation of the relative contents of the three salts (Table 3.3).

66 Chapter 3
When performing HMC measurements, it must be considered that minor RH deviations may
induce significant HMC variations. The higher the actual RH in the chamber, the higher HMC
variations can arise from small RH deviations because the HMC of soluble salts increases
exponentially with the RH (at 100% RH, the HMC tends to infinity). Therefore, the accuracy
of the method depends largely on the capability of the climatic chamber to generate accurate
and homogeneous environmental conditions in space and in time.
The following methods are proposed to reduce the uncertainty associated to salt content
estimation by the HMC method:
a) Experimental correlation lines obtained by means of control-samples of the same salt,
rather than theoretical values obtained from thermodynamic data in the literature, may be
used as reference to calculate the salt content in the contaminated samples. So,
permanent or erratic deviations from the set-point RH or temperature will not be a
problem (unless the magnitude of those deviations is such that the RHeqsat of the salt is
not reached). This method can be used in the case of salts available or replicable in the
laboratory, regardless of whether their thermodynamic behaviour is known or unknown.
Only pure salt samples are required to obtain the correlation line because the HMC is
directly proportional to the salt content. Control-samples of the base-material can be used
as well but, in most cases, it is perfectly acceptable to assume the HMC of the base-
material as zero. Indeed, the HMC of common building materials is insignificant when
compared to the HMC of soluble salts, regardless of the state of cohesion of the sample.
b) Control-samples of a known salt may be used to evaluate the agreement of the actual RH
to the set-point RH, by comparing the actual HMC of these samples to the HMC expected
at thermodynamic equilibrium. For this, the actual temperature in the chamber needs to
be sufficiently accurate and constant, which is not normally a difficulty because
temperature control in climatic chambers is relatively simple when compared to RH
control. Furthermore, the sensitivity of soluble salts to temperature changes is in general
much lower than to RH changes, particularly at high RH. For some salts, such as NaCl,
the temperature is not at all relevant in the ordinary range of temperatures used in HMC
experiments.
c) When HMC values obtained by means of equilibrium thermodynamic data in the literature
are to be used as a reference, either to estimate the salt content in the contaminated
samples or to assess the actual RH, it is perhaps preferable to perform the experiments
at a temperature for which such data is available, for instance 25ºC rather than 20ºC.
Though, this is not necessary for salts like NaCl which are not sensitive to temperature.
d) Several control-samples should always be used, spread throughout the chamber. The
variability of their HMC allows evaluating the spatial homogeneity of the environmental
conditions in the chamber. If that variability is significant, it may be necessary to place all
the samples in a limited area of the chamber. If very different HMC values are still
obtained, the climatic chamber is inappropriate for HMC determination.
e) The control-samples should always be placed next to the loaded samples.
Non-despicable mass variations, which moreover increase linearly with the salt content in the
sample, can arise also from small oscillations of the RH that ordinarily occur in climatic
chambers. For that reason, the usual criterion of considering that equilibrium was achieved
when the mass variation is lower than a certain percentage of the dry mass of the sample is

General Laboratory Techniques 67
hardly applicable. In practice, hygroscopic equilibrium can be appropriately detected simply
by observation of the HMC-versus-time graph.
Further, when deep narrow recipients are used instead of usual Petri dishes, hygroscopic
equilibrium takes longer to be reached but the HMC fluctuation is smoothed. In the HMC
measurements performed in this thesis, current Petri dishes were used in several cases
(Chapter 4 and 5) and no major stabilization problems arouse. But, because the sensitivity of
soluble salts to variations of the environmental conditions can be different, that will not
necessarily happen for all climatic chambers, types of salt and salt contents.
Deep-narrow receptacles were used in this thesis to measure the HMC of samples collected
from buildings (Chapter 6). One of the main reasons was the very large number of samples
involved, which was of the order of several hundreds. The use of these small sized
receptacles allowed testing many dozens of samples simultaneously and, hence,
accomplishing the HMC measurements within an acceptable period.


Chapter 4 – Drying of salt-loaded materials
4.1 Introduction
Salt decay processes and features are very closely related to masonry drying. In fact, it is
typically during drying that salts crystallize. Moreover, evidence exists that the so-called
“salt-induced dampness” may arise from an alteration of the drying process that happens
under the influence of soluble salts. But how does salt-loaded masonry dry?
The depth at which salts crystallize in porous materials depends on the balance between the
liquid flux to the drying front and evaporation flux (Lewin 1982). Yet, some salts have a high
tendency to form efflorescence while others, under similar environmental conditions, tend to
deposit within the pores of building materials. For instance, in laboratory crystallization tests,
which can be defined as drying experiments performed under particular conditions, sodium
sulfate tends to form subflorescence, while sodium chloride typically produces abundant
efflorescence (Goudie and Viles 1997, for instance). The reasons for this distinct behaviour
require further explanation.
In buildings, some salts tend to crystallize higher on the walls, while others tend to be
deposited closer to the ground. Arnold and Zehnder analysed the distribution of salt
efflorescence on many monuments affected by rising damp (Arnold 1982, Arnold and
Zehnder 1989) and observed that different types of salts appeared generally at distinct
heights. The authors attributed this feature to the fractional crystallization of the salts from a
mixed solution, a process that occurs sequentially according to the solubility of the individual
salts. But a question arises whether in the (theoretical) case of similar walls contaminated
with a single salt, the height of deposition would be similar for different salts.
In this approach, the materials are analysed on a large scale. However, masonry is a
heterogeneous system. They are composed of distinct elements: plaster, bedding mortar and
stone or brick. Furthermore, masonry materials may vary from building to building. Hence, it
is also important to understand drying and deposition processes in more detail.
Indeed, the movement of liquids within heterogeneous system depends, to a large extent, on
the suction properties of the individual materials in contact. For instance, pointing mortars
should favour liquid transport towards the surface during drying in order to accomplishing
their sacrificial role and, hence, protect the masonry elements. It is common knowledge that
when, for example, water repellent or very dense pointing mortars are used, salt solutions
are diverted towards the adjacent stone or brick elements which eventually decay. In old

70 Chapter 4
plastered/rendered masonry that sacrificial role is traditionally attributed to the plaster/render.
Lime plasters and renders were normally used because they favour salt crystallization on the
surface or in their own mass, thereby preventing the underlying masonry from decaying.
However, evidence of in-depth loss of cohesion of lime bedding mortars in old masonry,
where only traditional lime plasters/renders exist, is often found in practice. Therefore, a
question arises as to whether crystallization in old masonry can always and completely be
prevented by using very absorbent plasters and renders that favour liquid migration to the
surface.
Salt-loaded walls recurrently present moist surfaces. The height of capillary rise, namely, is
typically higher when soluble salts are present (Massari and Massari 1993). However, as
recently stated by an experienced building pathologist concerning the common case of rising
damp, “… the examination of two closely affiliated phenomena, salt damage and rising
damp, leaves us with far less in the way of definitive intervention strategies than we might
wish, primarily because our understanding of the phenomena is limited” (Harris 2001). It is
therefore crucial to understand the mechanisms of salt-induced dampness.
Hygroscopicity of soluble salts is a frequent cause of salt-damp in old buildings, as verified
for instance by Henriques (2006). However, many of the salts currently present in walls have
reasonably high relative equilibrium humidity (Table 3.2) and, hence, hygroscopicity can not
probably explain all cases of salt-induced dampness.
Hygroscopic absorption occurs, as explained in section 3.2.3, when the air RH is higher than
the RHeq of the contaminant solution. From a thermodynamic point of view, a negative
vapour pressure gradient exists in this case between the salt-loaded material and the
surrounding air. Thus, water vapour diffuses from the environment to the surface and the
material absorbs moisture. Differently, when the air RH is lower than the RHeq of the salt
solution, the vapour pressure gradient is positive. Therefore, water vapour diffuses in the
opposite direction and the salt-loaded material dries.
By comparison to pure water, the driving vapour pressure gradient for vapour transport
between a wet material and the environment is lower when soluble salts are present because
non-volatile solutes depress the RHeq of the solution. This is why porous materials dry more
slowly if soluble salts are present. In consequence of that slower drying, the evaporation front
tends to be located closer to the outer surface, as indicated by theoretical considerations of
Hall and Hoff (2002). This suggests that salt-induced dampness may arise, in general, from
changes in the drying process of porous building materials.
Aiming at a better understanding of these processes, drying experiments were carried out on
specimens composed of stone, bedding mortar and plaster (Gonçalves et al. 2006c). The
distribution of moisture during drying was monitored by means of the two-dimensional (2D)
magnetic resonance imaging (MRI) technique presented in Annexe I. The technique provides
sequences of images which map the concentration of liquid water in the specimens at given
time intervals. MRI techniques are powerful tools whose use on building materials is still very
restricted. In fact, to the best of this author's knowledge, this was the first time that a 2D MRI
technique was used to investigate soluble salts in building materials. This initial study was
restricted to pure water and NaCl contamination, as well as to isothermal drying conditions.

Drying of salt-loaded materials 71
The main objectives of this research were then:
- To understand the influence of soluble salts on the drying of porous building materials;
- To explain the general mechanism of salt-induced dampness;
- To discuss the distribution of salt during drying in walls contaminated with a single salt,
both at the (larger) scale of the wall and at the (smaller) scale of the masonry elements.
The work carried out is presented in this chapter. Fundamentals of moisture transport and
drying of porous materials are introduced in section 4.2. The materials and methods used in
the experiments are described in section 4.3. The experimental results are presented and
discussed in sections 4.4 and 4.5, respectively.
4.2 Drying of porous materials
4.2.1 - Porosity and hygroscopicity
Building materials such as stone, brick, mortars or concrete contain small voids that are
called “pores”. For this reason, these materials are currently called “porous building
materials”. A percentage, usually significant, of these pores is interconnected, hence forming
an internal network through which water migrates either as liquid or vapour. The open
porosity of a material, often simply named “porosity”, expresses the ratio of the total volume
of interconnected pores to the total volume of the material. These interconnected pores are
ordinarily classified into three main types, according to their size and resulting influence on
the moisture transport properties of the material:
- The micropores are the smallest pores. They have no influence on moisture transport
because the water they contain is not free water. Due to their very small size, the
capillary forces are so high that, in current conditions, the water cannot move.
- The mesopores are pores of intermediate size. They are also called “capillary pores”
or simply “capillaries”. It is through them that liquid water migrates under the influence
of capillary forces. Vapour transport also occurs in these pores.
- The macropores are the largest pores. They are very relevant for vapour transport. In
contrast, liquid capillary transport is not normally significant in the macropores
because the capillary forces are weak.
The size attributed to each type of pore is roughly similar among different authors.
Hilbert et al. (1992), for instance, adopted the following classification during research on
restoration plasters:
- micropores: radius less than 0.1µm;
- capillary pores: radius in the range of 0.1µm to 30µm (a sub-class of “highly capillary”
pores with radius from 0.1µm to 15µm was also considered);
- macropores: radius larger than 30µm.

72 Chapter 4
Most porous building materials such as stone, concrete, mortars or brick are hygroscopic
materials. “Hygroscopic” is a general term that refers to substances that are able to attract
water vapour from the environment. The hygroscopic behaviour of soluble salts was
discussed in detail in section 3.2.3. In the case of building materials, hygroscopicity concerns
adsorption of water from the air. Adsorption is the process by which water molecules bond
with the pore surfaces and thereby forms thin films, composed of one or several layers of
molecules. Adsorption arises from weak intermolecular (Van der Waals) forces that act
between the material surface and water. The thickness of the adsorbed water films increases
with the air RH. This is why, at a given temperature, the equilibrium HMC of porous building
materials depends on the RH.
4.2.2 - Liquid water transport
In porous building materials, liquid water migrates mostly by capillarity. The mechanism of
capillarity takes place when the attractive forces between the liquid and the solid material are
stronger than the cohesive forces in the liquid.
The driving pressure for capillary suction, also called capillary pressure or suction stress
(Künzel 1995), is given by Jurin’s law which concerns an idealized cylindrical capillary
(Eq. 4.1 and Fig. 4.1). In this equation, pc (Pa) is the capillary pressure, σ (N/m) the surface
tension of the liquid, r (m) the radius of the capillary and φ the contact angle.
ϕ
r
pc
Fig. 4.1 – Capillary pressure in a
cylindrical capillary
r
. 2 = p
c
ϕσ cos. (Eq. 4.1)
The contact angle is the angle at which the liquid surface meets the solid surface. It results
from the equilibrium of the tensions at the solid-vapour, solid-liquid and liquid-vapour
interfaces. The contact angle between water and a hydrophobic surface is greater than 90º.
The contact angle between water and a hydrophilic surface, for instance the pore walls of
ordinary building materials, is less than 90º, which corresponds to a concave meniscus and
to a negative capillary pressure, hence, to capillary movement of water into the material.
In a cylindrical capillary where the contact angle φ is less than 90º (Fig. 4.1), water rises up
to where the capillary pressure is equilibrated by the weight of the water column. Where p

Drying of salt-loaded materials 73
(N/m2) is the pressure generated by the water column, ρ (kg/m3) the density of water, g
(m/s2) the gravitational constant and H0 (m) the height of capillary rise in equilibrium
conditions:
p = - H . g . 0ρ (Eq. 4.2)
Combining Eq. 4.1 and Eq. 4.2, the height of capillary H0 rise is obtained as a function of the
pore radius (Eq. 4.3):
cos0 . g . . r
. 2 = H
ρσ
φ (Eq. 4.3)
This means that both the suction stress (Eq. 4.1) and the height of capillary rise (Eq. 4.3)
vary in inverse proportion to the capillary radius.
The displacement of the water in a capillary is given, as a function of time, by Eq. 4.4 which
derives from Poiseuille’s experimental law (Washburn 1921):
t . . r .
= ) t ( dη
ϕσ2
cos (Eq. 4.4)
In this equation d (m) is the distance which the meniscus travels in the capillary during time
t (s), η (kg.m-1.s-1) the dynamic viscosity of water, σ (N/m) the surface tension of water, r (m)
the capillary radius and φ the contact angle. It shows that water travels more quickly through
larger capillary pores which, hence, are filled first during soaking.
When a porous material is in free contact with water it soaks liquid up to certain critical
moisture content, the so-called “capillary saturation moisture content”. Total saturation, which
corresponds to total filling of the open porosity, cannot usually be reached under normal
suction conditions within a reasonable period of time because a certain volume of air is
generally trapped in the pore network, as well as because capillary suction by the
macropores may be insignificant. In this thesis, the broad-sense term “saturation” refers to
capillary saturation.
The capillary movement of water in porous materials cannot be predicted by means of the
previous equations. In such materials, the capillary network is so complex that an individual
analysis of the capillaries is not possible. A macroscopic approach is necessary. Indeed,
liquid transport in porous materials is well described by means of an extended form of
Darcy’s equation. Unlike the original law which concerns saturated flow -in porous media,
this extended law (Eq. 4.5) is applicable to unsaturated flow, the common case in buildings.
cpKu ∇= .-1
(Eq. 4.5)
In this equation, u (kg.m-2.s-1) is the density of the liquid flux, pc (Pa) the capillary suction and
K1 (kg.m-1.s-1.Pa-1) the unsaturated permeability coefficient or simply liquid conductivity which
is a function of the moisture content.

74 Chapter 4
The capillary transport properties of porous building materials are, consequently, also
evaluated at the material scale. Appropriate experimental parameters are used to express
the tendency of the material to, under specific conditions, absorb a certain amount of water
or transport that water up to a certain height.
In a semi-infinite volume of a porous material in free absorption (Fig. 4.2), both the total
amount of absorbed water and the height of capillary rise are direct functions of the square
root of time. This is expressed by Eq. 4.6 and Eq. 4.7, respectively, which derive from
Washburn's equation (Eq. 4.4).
t . A = (t W ) (Eq. 4.6)
t . B = ) (t H (Eq. 4.7)
In these equations, W (kg/m2) is the amount of absorbed water and H (m) the height of
capillary rise after the period of immersion t (s). A (kg.m-2.s-1/2) and B (m/s1/2) are the so-
called “water absorption coefficient” (WAC) and “capillary penetration coefficient”,
respectively. These coefficients are complementary. A material can quickly absorb a high
amount of moisture while presenting a low height of capillary rise and vice-versa. In fact, as
seen before, smaller pores absorb the water more slowly but present higher heights of
capillary rise at equilibrium (Eq. 4.3). In current language, the term “highly absorbent
material” corresponds normally to a high WAC.
Coefficients A and B depend on the initial moisture content in the material, even though in
practice they are typically measured on oven-dried materials. Indeed, in equilibrium
conditions at given moisture content, all the pores below a certain diameter are filled with
water. Capillary pressure varies in inverse proportion to the square root of the capillary radius
(Eq. 4.1) and porous building materials contain pores of various sizes. Therefore, the
sorptivity of a porous material, that is, its tendency to absorb and transmit liquids by
capillarity (Hal and Hoff 2002), varies with its moisture content. This is compatible with the
trivial observation that building materials absorb less water when they contain a higher
amount of moisture.
In practice, the WAC is used much more than the penetration coefficient. One of the reasons
is that direct measurement of coefficient B is often difficult and not very accurate. The
boundary between wet and dry areas may not be easy to distinguish, particularly in micro- or
macro-porous materials, or may be very irregular in composite or non-homogeneous
materials. Sometimes, the penetration coefficient is estimated by dividing the WAC by the
capillary saturation moisture content (Künzel 1995). This estimate is based on the
assumption that the moisture content in the wet volume of the material is homogenous and
identical to the capillary saturation moisture content. But this is not normally true and, so, the
estimated heights of capillary rise are smaller than the actual ones.
In capillary absorption tests, specimens of regular dimensions and constant section, usually
4 x 4 x 16 cm prisms, are allowed to freely absorb water through their bottom face (Fig. 4.2).
The WAC is measured by weighing the specimens periodically, normally at increasing time
intervals. Fig. 4.3 depicts two types of curves typically obtained, where the amount of
absorbed water is plotted against the square root of time. The WAC corresponds to the
inclination of the initial straight part of either curve.

Drying of salt-loaded materials 75
Fig. 4.2 - Porous material in free
absorption
a) unimodal material b) plurimodal material
Absobed w
ate
r
(kg/m
2)
Time (√s)
Fig. 4.3 – Typical water absorption curves for
porous building materials
Curve (a) in Fig. 4.3 is typical of materials whose pores have a limited range of dimensions,
are well interconnected and homogenously distributed. A sharp transition between the wet
and dry zones, that is, a well-defined dry-wet boundary exists in such materials during
capillary absorption. The absorption curve is typically composed of two straight-line
segments: (i) the first has a higher slope and corresponds to the filling of most of the
interconnected porosity; (ii) the second has a lower slope and represents the further filling of
the remaining pores by diffusion in water of the air trapped in the pore network. The inflection
point corresponds to the moment when the capillary fringe reaches the top surface of the
specimen. The ratio between the slopes of the two lines is generally within the range of 10 to
103 (Mertz 1991).
Curve (b) is typical of materials that contain several families of interconnected pores with
clearly distinct dimensions. The different slopes reveal the existence of pores with different
absorption kinetics (Mertz 1991, for instance). This behaviour corresponds, in the case of
homogenous materials, to a diffuse dry-wet boundary during capillary absorption. In that
case, the first inflexion point corresponds to the moment when the edge of that diffuse
boundary reaches the top face of the specimen. The other inflexion points represent the
moment when a given family of pores becomes saturated. Curve (b) can also occur for
heterogeneous materials, for instance, composed by several horizontal layers of different
(homogenous) materials. In this case, the inflexion points correspond to the moments when
the capillary fringe reaches each of the interfaces between different materials.
Absorption curves with shapes different from those in Fig. 4.3 are sometimes obtained but
they normally correspond to intermediate or even similar absorption behaviours. For
example, a round-shaped absorption curve corresponds to a type (b) curve composed of
many short segments.
The considerations above refer to ordinary hydrophilic materials. For materials that contain
water repellent additives, such as most industrial plasters and renders, capillary absorption
curves are interpreted in a similar way but in terms of capillary suction rather than pore
dimension.

76 Chapter 4
Experimental absorption curves usually intersect the ordinate axis somewhat above the
origin, as shown in Fig. 4.3. Indeed, for a more accurate description of the absorption
behaviour up to the first inflexion point, Eq. 4.6 could be written as Eq. 4.8 (Eq. 4.7 would
undergo a similar change).
0w t . A = ) (t W + (Eq. 4.8)
Positive intercept w0 in Eq. 4.8 arises because hydrostatic pressure adds to capillary
pressure in the first mm of the specimen (below water level). A second possible cause is
some water being absorbed through the lateral faces in the case of non-sealed specimens
(Wilson et al. 1999, for instance)
In porous hygroscopic materials, liquid transport may occur even when there is no external
contact with liquid water, particularly, when the material is exposed to an RH gradient.
Indeed, the thickness of the water molecule layer adsorbed by the pore walls increases with
the RH, hence, it may vary across a material exposed to an RH gradient. As a consequence,
a (liquid) diffusion process takes place by which the water migrates from the thicker to the
thinner adsorbed water layers. This process is called “surface diffusion” and is further
illustrated in Fig. 4.4 d. Capillary transport of moisture may also arise in consequence of
capillary condensation. Capillary condensation happens when the thickness of the adsorbed
water layer increases to the point where the smaller capillaries are filled with liquid. Because
of the RH gradient, the moisture content due to capillary condensation varies across the
material and, hence, capillary transport may take place.
The pathways of water within systems composed of different materials are not easy to
predict, even if hygroscopicity is not considered. This was well explained 70 years ago by
Schaffer (1932 pp 51-53):
When different materials are placed in contact, a uniformly fine-pored material will draw
water from a uniformly large-pored material, because the capillary suction is greater in
small pores than in large ones. But building materials contain pores of various sizes,
and in consequence the suction force developed will vary with the moisture content. In
fact, the relative pore structures may even be such that the direction of the movement
of water between two materials alters with change in the degree of saturation. (…)
Since the capillary suction of a material varies with its moisture content, and the rate of
change of moisture content under wetting or drying conditions varies with different
materials, the problem of predicting the direction of transfer of water between any two
materials is extremely complex.
Moreover, the interface between different materials in contact often introduces a resistance
to moisture transport that is not easy to predict or quantify (Freitas 1992). The interface
between two mortar layers, when one was directly applied to the other, represents perhaps
the most favourable continuity condition as regards masonry materials. However, even this
type of interface may not correspond to a situation of hydraulic continuity. This was, for
instance, observed in previous work (Gonçalves 1997) where a significant hydric resistance
was detected between two mortar layers due to the incomplete interpenetration of the two
porous structures.

Drying of salt-loaded materials 77
4.2.3 - Water vapour transport
Water vapour transport in porous building materials can be described as a diffusion process,
hence, caused by a water vapour concentration gradient. In steady state isobaric and
isothermal conditions, Fick’s first law is applicable:
c . D- =j v ∇ (Eq. 4.9)
In this equation, j (kg.m-2.s-1) is the diffusion flux, c (kg/m3) the concentration of water vapour
and Dv (m2/s) the diffusion coefficient or diffusivity.
Assuming that air behaves as an ideal gas, which is expressed by Eq. 4.10, the diffusion flux
may be expressed as a function of water vapour pressure (Eq. 4.11).
w
v
vM
T . R . c = p (Eq. 4.10)
Here, pv (Pa) is the water vapour pressure, T (K) the temperature, R (J.K-1.mol-1) the ideal
gas constant, cv (kg/m3) the vapour concentration and Mw (kg/mol) the molar mass of water.
p . - = jv
∇Π (Eq. 4.11)
In this equation, Π (kg.m-1.s-1.Pa-1) is the water vapour permeability of the material.
Π expresses the quantity of water vapour crossing, in equilibrium isothermal conditions, a
material of unitary thickness (m), per unit time (s), unit surface (m2) and unit difference of
vapour pressure (Pa). Π depends on the temperature and water content of the material.
Eq. 4.12 relates Π to the water vapour resistance µ.
= µδ
Π (Eq. 4.12)
Here, δ (kg.m-1.s-1.Pa-1) is the coefficient of water vapour diffusion in air. Water vapour
resistance µ (dimensionless) is a parameter that does not depend either on temperature or
even, at low moisture contents, on the moisture content. Indeed, at higher moisture contents,
the presence of liquid water in the pores may accelerate vapour transport because the liquid
shortens the effective path length for vapour diffusion. This process is named “liquid-assisted
vapour transfer” (Rose 1963a, 1963b) and is further depicted in Fig. 4.4 d.
Building materials are generally characterized, as regards vapour transport, by means of the
well-known cup test methods. In these tests, an isothermal steady state of unidirectional
vapour transport is induced by placing a specimen with certain thickness above a cup where
a selected salt solution is used to generate a constant RH. The assemblage is placed in a
room or chamber at constant RH and temperature. When steady state conditions are
reached, the weight loss of the assemblage, which corresponds to the vapour flux through
the specimen, is constant over time.

78 Chapter 4
“Dry cup” or “wet cup” methods can be used where the RH in the cup is, respectively, lower
or higher than the RH at the exterior. These methods are based on Eq. 4.13, which derives
from Eq. 4.11 and expresses one-directional diffusion flux j (kg.m-2.s-1) that crosses a porous
material when a given vapour pressure difference pvi-pve (Pa) is maintained and assumed to
vary linearly across a specimen with thickness e (m).
e
)p - p( . =j veviΠ (Eq. 4.13)
Besides Π (Eq. 4.13) and µ (Eq. 4.12) other quantities often used in practice are water
vapour permeance Π/e (kg.m-2.s-1.Pa-1) and diffusion-equivalent air layer thickness s (m).
The latter is given by Eq. 4.14 and corresponds to the thickness of an air layer with the same
permeance as the tested specimen.
s- j
p -p . s
veviair 'Π= (Eq. 4.14)
In this equation, Πair (1,95 x 10⁻¹⁰ kg.m-1.s-1.Pa-1) is the diffusion coefficient of vapour in air at
atmospheric pressure and s’ (m) is the thickness of the air layer in the cup (between the salt
solution and the specimen).
Eq. 4.13 is used to characterize building materials in general. However, this equation is not
strictly valid for hygroscopic materials because: (i) adsorbed water films can reduce the
effective capillary radius; (ii) liquid transport by “surface diffusion” (Fig. 4.4 d) may arise
simultaneously due to the vapour pressure gradient; (iii) capillary condensation may occur;
(iv) liquid diffusive transport of that condensed water may take place due to the moisture
concentration gradient; (v) vapour transport can be accelerated across water-filled pores
(Fig. 4.4 d).
4.2.4 - Drying of porous materials
Wetting of porous materials from complete dryness is currently described, at the pore scale,
by the six-phase process depicted in Fig. 4.4 (Rose 1963b). Each phase corresponds to
different moisture content. Drying corresponds to the inverse process, nonetheless possible
hysteretic effects that may arise in hygroscopic materials from a reduction of the effective
capillary radius by adsorbed water layers.
At a macroscopic scale, drying of porous materials can be described as the three-phase
process depicted in Fig. 4.5. The three drying stages, among which stages I and II are
usually considered the most relevant (Sherwood 1929, Scherer 1990), occur as follows:
Stage I - Initially, the material is saturated and, hence, a continuous liquid phase exists in
the pore network. Liquid water is transported towards the outer surface mostly by
capillarity (Fig. 4.4e or 4.5f), though surface diffusion may also take place at the
lower moisture contents (Fig. 4.4 d). A sharp capillary pressure gradient in the
pores at the surface is the driving potential for capillary transport. Evaporation
occurs at this surface and the moisture content in the material decreases at a
constant rate. It is currently accepted that Stage I drying rate depends only on
external factors such as the air RH, temperature and air velocity. Homogeneous
moisture distribution is expected to exist throughout the material during this stage.

Drying of salt-loaded materials 79
Stage II - When the unsaturated capillary flow is no longer able to supply water at a rate
high enough to compensate evaporation, the drying front recedes into the material
and drying Stage II starts. Liquid capillary transfer or vapour transport prevail
beneath or ahead of the drying front, respectively. Receding of the drying front
corresponds to the breaking of the liquid continuity in the pores close to the
surface, which was argued to happen somewhere between phases (c) and (e) in
Fig. 4.4 (Rose 1963b). The drying front goes on receding as evaporation
proceeds and, hence, the moisture content in the wet zone decreases further. The
drying rate of the material decreases over time with the lower availability of liquid
at the drying front and with increase of the path length for vapour diffusion across
the material. The drying front is sharp for materials with pores within a limited size
range. When pores of significantly different size exist, the drying front is more
diffuse. Nevertheless, reasonably homogenous moisture distribution is also
expected to exist beneath the drying front during Stage II.
Stage III - The moisture content in the wet zone of the material decreases progressively
during Stage II. Hence, at a certain moment, liquid continuity is broken in the
capillaries beneath the drying front and drying Stage III begins. From this moment
on, vapour diffusion controls the transport of moisture all over the material.
Therefore, the drying rate becomes much lower. In this stage, although the
material may be technically dry, clusters of liquid persist for some time in the
smaller pores (Fig. 4.4 c). The drying rate is expected to decrease slowly, while
the material approaches hygroscopic equilibrium (Figs. 4.4c to 4.4a).
Fig. 4.4 – Moisture transport at the pore scale
during wetting of a porous material. After Rose (1963b).
Fig. 4.5 - Drying of a porous material
at a macroscopic scale
Vapour transport
Liquid transport
Absence liquid continuity
Sealant
Liquid continuity
Phase I
Phase II
Phase III
a) Adsorption
b) Vapour transfer
c) Liquid-assisted vapour transfer
d) Surface difusion
e) Liquid flow (unsaturated)
f) Liquid flow (saturated)

80 Chapter 4
The drying behaviour of porous building materials is normally accessed by means of the
so-called “drying tests” or “evaporation tests” (RILEM 1980, for instance). In such tests,
specimens of regular dimensions, typically prisms or cubes, are led to standard saturation
conditions (capillary or even total vacuum saturation) with pure water. Afterwards, the lateral
and bottom faces of the specimen are sealed in order to induce one-dimensional migration of
moisture towards the top surface during drying. The specimens are allowed to dry under
specific environmental conditions. By periodical weighing, a drying curve is obtained where
either the actual moisture content in the material (Fig. 4.6) or the total amount of evaporated
water is plotted against time. The drying rate of the material corresponds to the slope of the
drying curve.
Time
Mois
ture
conte
nt -
MC Stage I
Stage II
Stage IIIcritical MC
Fig. 4.6 – Typical drying curve of a porous building material
The transition between Stage II and Stage III is often indistinct in drying curves. In contrast,
the transition between Stage I and Stage II is normally clear (Fig.4.6). It corresponds to the
inflexion point between the straight (constant drying rate) and the round-shaped (decreasing
drying rate) segments. The moisture content that corresponds to this inflexion point is named
the “critical moisture content”. That critical moisture content is typically higher for materials
with less homogeneous pore size distributions (Snethlage and Wendler 1997). That happens
because, when liquid continuity is interrupted in the larger pores, the smaller pores still
contain a significant amount of moisture.
It is widely accepted that the drying rate of a material during Stage I depends on the external
conditions. Yet, the inclination of the straight part of the drying curve may vary among
different porous materials under similar evaporation conditions. This happens because
different porosities may lead to different effective surfaces of evaporation in specimens of
similar dimensions, hence, to different drying rates. Further, it has recently been suggested
that also the pore size could influence the effective surface of evaporation. Rousset-Tournier
(2001) observed that the drying rate of building stones during Stage I was systematically
higher than the drying rate of a flat surface of water under identical environmental conditions
with no air velocity. This suggested that the curvature of the menisci at the drying front could
increase the effective surface of evaporation.
Drying curves are normally obtained by gravimetric methods, as explained above. But it is
also possible to use other methods of monitoring the moisture content during drying.
In this chapter, drying curves obtained by means of MRI measurements will be presented.

Drying of salt-loaded materials 81
4.3 Materials and methods
4.3.1 - Materials
Aiming at a better understanding of the drying process of salt-loaded masonry,
MRI-monitored drying experiments were performed on specimens composed of three
materials representing the three main elements of old stone masonry: stone, bedding mortar
and plaster (Fig. 4.7).
Fig. 4.7 – Pictures of one specimen: (a) top view; (b) lateral view
Two different specimens were used. Each specimen included a different type of stone: stone
D (specimen DL1) and stone M (specimen ML1). Both are very common stones in Portugal
so they are expected to be representative of old ordinary masonry in this country, normally
built from locally available materials (Segurado 1908). In both specimens, plaster and
bedding mortar were made from the same lime mortar L. Table 4.1 and Fig. 4.8 show the
composition and properties of the three materials in the specimens.
Prior to making the specimens, the cut surfaces of the stone elements were sandpapered in
order to improve mortar/stone adherence. Next, bases composed of mortar and stone were
made by applying lime mortar L on either stone D or M. The bases were kept in a
conditioned room at 20ºC and 65% RH for two weeks. Afterwards, the plaster was made by
applying lime mortar L on these bases. In both cases, the mortar was applied: (a) after pre-
wetting the surfaces; (b) with the help of acrylic plaques placed laterally during application
and removed around 15 minutes later. The specimens were maintained in the same
conditioned room during the following five months before testing. At the two months of age,
they were laterally sealed with epoxy resin.
1cm
(a) (b)
plaster
bedding mortar stone
plaster

82 Chapter 4
Table 4.1 – Composition, porosity and capillary coefficient of the materials
Porosity accessible to water
(% V) Material Volumetric composition / nature
capillary
saturation
total (vacuum)
saturation
Capillarity
coefficient
(kg.m-2
.h-1/2
)
Lime mortar L 1:1.5:1.5 (dry hydrated lime: sand from the
Tagus river: yellow pit sand from Corroios) 17.6 28.7 11.9
Stone D Calcitic calcareous stone with fossil fragments
(medium porosity) 11.2 15.4 3.9
Stone M Calcitic calcareous stone
(high porosity) 26.6 32.4 11.6
0.0
0.1
0.2
0.3
0.4
0.001 0.01 0.1 1 10
r (µm)
dV
Mortar L Stone D Stone M
Fig. 4.8 – Pore size distribution (MIP)
The porosity accessible to water was measured on specimens of irregular shape (around
2 cm x 2 cm x 2 cm). The measurements were carried out both at total saturation and at
capillary saturation. In the first case, the tests were performed according to RILEM procedure
I.1 (RILEM 1980) by means of vacuum saturation. In the second case, a similar procedure
was followed but saturation was obtained by simply immersing the specimens in pure water
during an overnight period.
Unidirectional capillary absorption tests were carried out on 50 mm x 50 mm x 20 mm
specimens whose lateral faces were sealed with an epoxy resin. First, the specimens were
oven-dried at 60ºC. Afterwards, they were allowed to freely absorb pure water through their
50 mm x 50 mm bottom face. That bottom face corresponds, in the case of the mortar
specimens, to the contact surface with a brick substrate onto which the mortar had been
applied and hardened. The specimens were weighed periodically, the excess water being
removed by means of quick touches with a soft paper. During the absorption periods the
specimens were kept inside a closed acrylic box and the free water level was maintained 5
mm above the bottom face of the specimen. Three specimens of each material were used.
The pore size distribution was measured by mercury intrusion porosimetry (MIP) according to
LNEC’s procedure LERO PE15, which is based on ASTM D 4404-84 (ASTM 2004). In MIP
techniques the pore sizes are estimated by means of Jurin’s law (Eq. 4.1), hence, the pores
are assumed to have a cylindrical shape.

Drying of salt-loaded materials 83
4.3.2 - Drying experiments
Either specimen was subjected to two MRI-monitored drying experiments, the first with pure
water and the second with a 3 molal NaCl solution. The specimens were led to capillary
saturation by total immersion for around two hours. This period was enough to reach
constant mass at a precision of 0.01g. Afterwards, the bottom face of the specimens was
sealed with Parafilm M® plastic film (the lateral faces were already sealed with epoxy resin).
The 2D MRI technique used is presented in section I.3 (Annex I). MRI images that map the
concentration of liquid water in the specimens were collected every 30 min during drying.
Drying was induced by air flow at 0% RH (temperature ≈ 18ºC), which was turned on after
the initial image was obtained. For pure water, drying was monitored for 20 hours. For the
NaCl solution, drying was monitored for 60 hours (specimen DL1) or 35 hours (specimen
ML1).
Evaporation experiments were performed also with free liquid surfaces in order to obtain
complementary background information. The evaporation rates of free surfaces of pure water
and NaCl saturated solution were measured under environmental conditions of either
20ºC and 50% RH or 20ºC and 15% RH. Identical Petri dishes of 77 mm internal diameter
and 18 mm depth were used. Two dishes of each liquid were tested in both cases. Drying
took place in a climatic chamber with a low air velocity, the FITOCLIMA 500 EDTU®
chamber by Aralab (Portugal) used in the HMC experiments presented in Chapter 3. The
evaporation area of the liquids was possibly smaller than the internal area of the Petri dish
due to hindering of air movement by the lateral walls of the dishes. However, comparative
analysis is possible because an identical height of liquid (13 mm) was used in all cases.
4.3.3 - Salt distribution
The final distribution of salt in the specimens was determined by means of the HMC method
described in Chapter 3 using common Petri-dishes.
After oven drying at 40ºC and further removal of loose efflorescence, the specimens were cut
longitudinally into two halves. Afterwards, by progressively disaggregating them on
sandpaper, one half was divided in the vertical direction and the other in the horizontal
direction. Hence, salt distribution could be evaluated along two perpendicular directions.
The samples thereby obtained were oven dried at 40ºC. Then, they were kept inside a
climatic chamber set-pointed at 20ºC and 95% RH until hygroscopic equilibrium was
achieved, that is, until their mass remained constant over time. The same FITOCLIMA 500
EDTU® climatic chamber was used.
Ten control samples of pure NaCl, as well as two non-contaminated samples of each base
material (mortar and stones) were simultaneously tested. Since the HMC varies linearly with
the salt content, the salt content in the samples could be calculated in relation to an actual

84 Chapter 4
calibration line defined by the HMC of the base materials (0% of salt) and of the control
samples (100% of salt). Average values of the HMC of each type of control-sample were
used for this purpose.
As argued in Chapter 3, when discussing the scope and precision of the HMC method, minor
variations of the environmental conditions (in particular of RH) may cause the concentration
of salt solutions to vary. In the present HMC measurements, this uncertainty was evaluated
by means of the ten NaCl control samples which were distributed throughout the chamber.
Average, minimum and maximum HMC of respectively 732.2%, 688.3% and 756.4% were
obtained among these samples. This values correspond to a possible deviation of the salt
content values (Figs. 4.15 and 4.16), which were estimated by means of the average HMC of
the control-samples, of +6.4% or -3.2% (as a percentage of the estimated salt content
values). This means that the climatic conditions in the chamber were quite homogenous.
The average HMC of the pure NaCl samples corresponds to an actual RH of 91.9%. This
value was obtained, by linear interpolation, from tables expressing the water activity of NaCl
solutions at 20ºC as a function of their molality (Robinson and Stokes, 2002). As later
confirmed, the climatic chamber was actually working around 3% below the set-point of 95%
RH. But this fact had no influence on the results because the salt content of the samples was
calculated, according to the method proposed in section 3.6, by reference to the actual HMC
of the pure NaCl samples and not by reference to thermodynamic data in the literature.
4.4 Results
4.4.1 - Drying of water-filled specimens
The results of the drying experiments performed on specimens DL1 and ML1 with pure water
are depicted bellow. Fig. 4.9 presents selected MRI snapshots obtained during each drying
experiment. Fig. 4.10 shows the corresponding 1D moisture profiles at cross-sections CS1
and CS2 (Fig. I.10 in Annex I). This type of 1D profile is only presented for pure water.
The two specimens show a similar drying process with pure water, nonetheless a certain
time shift between them (Fig. 4.9 and 4.10): (i) the exposed top surfaces remain wet during
the first hours; (ii) after around 4 hours these surfaces begin drying faster
than the underlying material; (iii) complete drying of the surface seems to occur after around
5 to 10 hours for specimen DL1 and 8 to 18 hours for specimen ML1, as seen in Fig. 4.10.
In spite of this overall similarity, some differences are observed between the two specimens:
(i) stone M contains a higher initial amount of moisture than stone D; (ii) drying of stone M is
faster than drying of stone D; (iii) at the end of the experiments, stone M is clearly drier than
stone D.
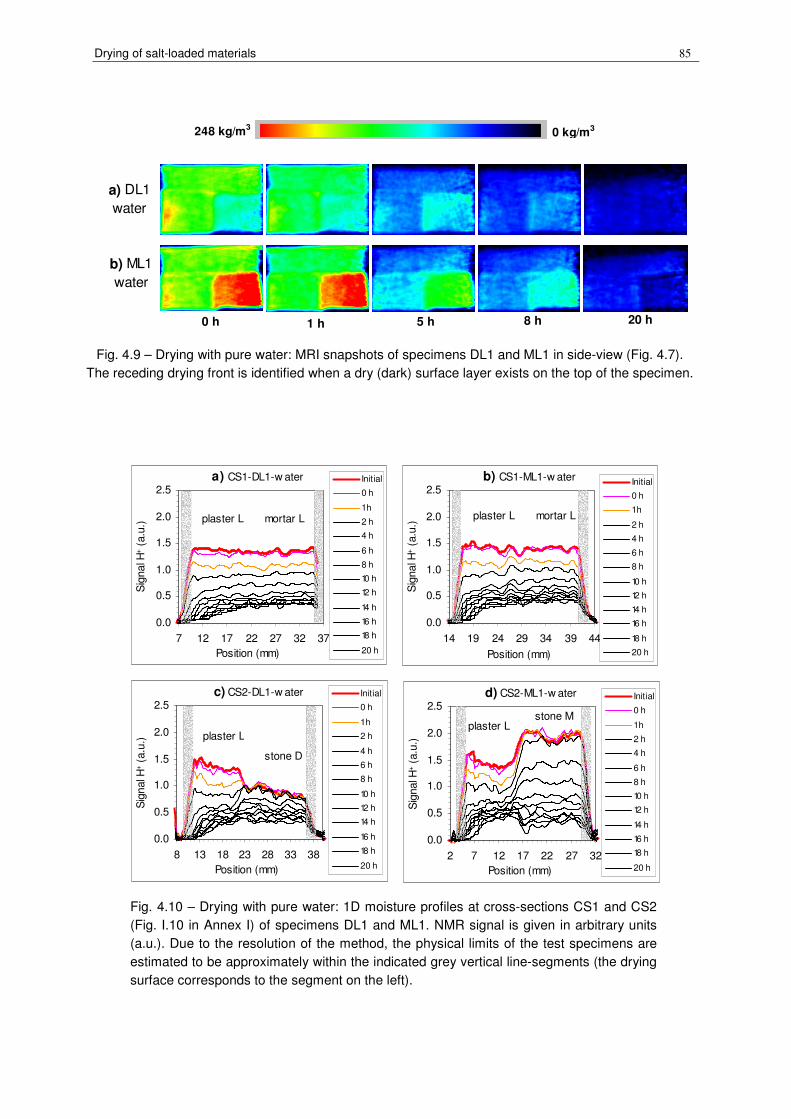
Drying of salt-loaded materials 85
0 kg/m3248 kg/m3
a) DL1
water
5 h0 h 1 h 8 h 20 h
b) ML1
water
Fig. 4.9 – Drying with pure water: MRI snapshots of specimens DL1 and ML1 in side-view (Fig. 4.7).
The receding drying front is identified when a dry (dark) surface layer exists on the top of the specimen.
a) CS1-DL1-w ater
0.0
0.5
1.0
1.5
2.0
2.5
7 12 17 22 27 32 37
Position (mm)
Sig
nal H
+ (
a.u
.)
Initial
0 h
1 h
2 h
4 h
6 h
8 h
10 h
12 h
14 h
16 h
18 h
20 h
plaster L mortar L
b) CS1-ML1-w ater
0.0
0.5
1.0
1.5
2.0
2.5
14 19 24 29 34 39 44
Position (mm)
Sig
nal H
+ (
a.u
.)
Initial
0 h
1 h
2 h
4 h
6 h
8 h
10 h
12 h
14 h
16 h
18 h
20 h
plaster L mortar L
c) CS2-DL1-w ater
0.0
0.5
1.0
1.5
2.0
2.5
8 13 18 23 28 33 38
Position (mm)
Sig
nal H
+ (
a.u
.)
Initial
0 h
1 h
2 h
4 h
6 h
8 h
10 h
12 h
14 h
16 h
18 h
20 h
plaster L
stone D
d) CS2-ML1-w ater
0.0
0.5
1.0
1.5
2.0
2.5
2 7 12 17 22 27 32
Position (mm)
Sig
nal H
+ (
a.u
.)
Initial
0 h
1 h
2 h
4 h
6 h
8 h
10 h
12 h
14 h
16 h
18 h
20 h
stone Mplaster L
Fig. 4.10 – Drying with pure water: 1D moisture profiles at cross-sections CS1 and CS2
(Fig. I.10 in Annex I) of specimens DL1 and ML1. NMR signal is given in arbitrary units
(a.u.). Due to the resolution of the method, the physical limits of the test specimens are
estimated to be approximately within the indicated grey vertical line-segments (the drying
surface corresponds to the segment on the left).

86 Chapter 4
4.4.2 - Drying in the presence of NaCl
Selected MRI snapshots of the two drying experiments performed with NaCl are depicted in
Figs. 4.11 and 4.12. Snapshots of the experiments carried out with pure water on either
specimen are also included in these figures to allow accessing the influence of the salt.
As seen in these figures, NaCl does not qualitatively modify the distribution of moisture in the
specimens during drying. Indeed, for both specimens, similar image sequences are obtained
with pure water and with NaCl solution. Nonetheless, the figures also reveal that:
(i) drying is much slower when NaCl is present, as shown by the fact that the images
correspond to later moments of drying in the case of NaCl; (ii) contrary to what occurs for
pure water, no receding drying front is observed in neither of the NaCl-loaded specimens
until the end of the experiments.
0 kg/m3248 kg/m3
17 h
a) DL1
water
0 h
0 h
2 h 5 h 8 h
60 h
b) DL1
NaCl
40 h
Fig. 4.11 – MRI snapshots of specimen DL1 in side-view (Fig. 4.7) during drying with: (a) pure
water; (b) 3 molal NaCl solution. For pure water, receding of the drying front is visible already after
five hours (the dark area on the top of the specimen DL1 corresponds to the dry surface layer).
Similar MRI images are presented for either solution, which correspond, however, to distinct
moments of the drying.
0 kg/m3248 kg/m3
a) ML1
water
35 h
0 h
0 h
3 h
19 h
4 h
b) ML1
NaCl
Fig. 4.12 – MRI snapshots of specimen ML1 in side-view (Fig. 4.7) during
drying with: (a) pure water; (b) 3 molal NaCl solution. Notice that similar MRI
images correspond to distinct moments of the drying in the two experiments.

Drying of salt-loaded materials 87
4.4.3 - Overall drying curves
The drying curves presented in Fig. 4.13 were obtained by means of 1D profiles of the type
presented in Fig. 4.10. Each point of a drying curve is calculated by adding all the NMR
signal values in the two corresponding profiles of the specimen.
0
200
400
600
800
0 12 24 36 48 60
Time (hours)
Sig
nal H
+ (
a.u
.)
DL1-w ater
DL1-NaCl
ML1-w ater
ML1-NaCl
Fig. 4.13 – Drying curves
4.4.4 - Evaporation from free liquid surfaces
The results of the evaporation experiments carried out on free surfaces of pure water or
saturated NaCl solution are depicted in Fig. 4.14. In this figure, it is seen that:
(i) in both environmental conditions the evaporation rate is higher for pure water than for the
salt solution; (ii) the faster the evaporation, the lower the ratio between the drying rates of the
two liquids; (iii) in neither of the environmental conditions is the evaporation rate of pure
water higher than twice the evaporation rate from the NaCl solution.
0
20
40
60
80
0 60 120 180
Time (min)
Ev
apora
ted w
ate
r (g
/m2)
Water (20ºC 15%RH)
NaCl sat (20ºC 15%RH)
Water (20ºC 50%RH)
NaCl sat (20ºC 50%RH)
Fig. 4.14 – Evaporation from free surfaces of pure
water and saturated NaCl solution

88 Chapter 4
4.4.5 - Salt deposition
The final salt distribution in specimens DL1 and ML1 is shown in Figs. 4.15 and 4.16 where
the grey scale represents the salt content in each layer. It can be seen that in both
specimens: (i) a higher concentration of salt occurs in the outer layer of the plaster; (ii) a
certain amount of salt is dispersed throughout the entire specimen.
In spite of this, relevant differences are also observed between the two salt distributions:
(i) concentration of salt in the surface layer is higher for specimen ML1; (ii) stone M contains
less salt than stone D; (iii) in specimen DL1, a salt accumulation peak exists in stone D next
to the plaster; (iv) in specimen ML1, a salt accumulation peak is observed in the bedding
mortar next to stone M.
DL1
23
23
15
25
20
15
11
22
37
63
195
25
105
109
23
15
40
14
Fig. 4.15 - Final salt distribution in specimen DL1. The salt content
values are expressed in kg of NaCl by m3 of open porosity in the
material. Both halves of the specimen are in side-view, as depicted
in Fig. 4.7.
34
155
153
56
16
4
5
7
ML1
28
29
26
45
3
5
4
9
37
51
286
Fig. 4.16 - Final salt distribution in specimen ML1. The salt content
values are expressed in kg of NaCl by m3 of open porosity in the
material. Both halves of the specimen are in side-view, as depicted
in Fig. 4.7.
Drying of salt-loaded materials 89
4.5 Discussion
4.5.1 - Salt-induced dampness
The results of the MRI-monitored experiments show that, with pure water (Figs. 4.9 and
4.10), specimens DL1 and ML1 clearly go through a two-stage drying process, despite of
their non-homogenous composition. During Stage I, the moisture content in the specimens
decreases over time but the moisture distribution remains homogeneous. After around 2h,
the exposed surfaces start drying faster. This is a period of transition between Stage I and
Stage II, in which a decreasingly significant part of the porosity is involved in transporting the
liquid to the surface (Scherer 1990, Rousset-Tournier 2001, for instance). Stage II begins at
the total receding of the drying into the material, which occurs at around 6h in specimen DL1
and somewhat latter in specimen ML1 (Fig. 4.10).
With NaCl solution, the distribution of moisture during drying is similar to the case of pure
water, as shown by Figs. 4.11 and 4.12. However, because evaporation was slower due to
the presence of salt, the liquid inside the specimens has more time to flow towards the
surface. As a consequence, Stage I is longer. Indeed, no receding of the drying front is
observed until the end of the experiments with NaCl, which lasted 60 hours for specimen
DL1 and 35 hours for specimen ML1. These results agree with:
(a) Theoretical considerations of Hall and Hoff (2002) that argue that an advancement of
the evaporation front towards the outer surface is expected to arise from the presence
of soluble salts, in comparison to the case of pure water, due to lowering of the
vapour pressure gradient.
(b) Common gravimetric drying experiments performed under different environmental
conditions on water-filled materials. These experiments show that a slower
evaporation leads to a longer drying Stage I and to the elimination of a higher amount
of moisture during Stage I (Rousset-Tournier 2001, for instance).
(c) Drying experiments carried out at TUE on porous building materials and monitored by
a 1D MRI technique (Pel et al. 2003, Petković 2005) where slower drying and no
receding of the drying front were observed when NaCl was present instead of pure
water only.
The present experiments support, therefore, the hypothesis put forward in section 4.1 that
salt-induced dampness is a general feature that arises due to lowering of the evaporation
rate by the presence of soluble salts, hygroscopicity being a particular case of that general
feature.
As explained, hygroscopic absorption occurs when the environmental RH is higher than the
RHeq of the contaminant solution. The negative vapour pressure gradient that exists, in this
case, between the salt-loaded surface and the environment is what gives rise to water
vapour diffusing from the environment to the masonry and, thereby, increasing its moisture
content.

90 Chapter 4
This vapour pressure gradient is positive when, oppositely, the environmental RH is lower
than the RHeq of the salt solution. No hygroscopic absorption takes place in this case
because water vapour diffuses to the environment and, hence, the salt-loaded masonry
dries. However, because salts are present, the drying process is slower than it would be for
pure water. In drying tests, this effect induces a longer presence of moisture at the surface,
as shown by the present MRI-monitored experiments. In building walls, where the liquid
supply flux is often reasonably constant over time, this effect corresponds to the drying front
being located at the surface for lower liquid supply fluxes. That implies an increase of the
damp surface area by comparison to what would happen if only pure water was present.
Indeed, it is known that a slower evaporation causes an increase of capillary rise in walls.
This indicates that masonry dampness may be aggravated by the presence of soluble salts
even when the RH is lower than the RHeq of the contaminant solution, hence, even if no
hygroscopic absorption takes place.
This conclusion is consistent with many practical observations that larger moist areas are
recurrently found in salt-loaded masonry (Massari and Massari 1993, Burkinshaw and Parret
2004, for example). However, it contradicts the conclusions of Benavente et al. (2003).
These authors performed gravimetric drying experiments on stone specimens either
saturated with pure water or with a 3 molal NaCl solution. Further, they considered that, for
both pure water and the salt solutions, the beginning of drying Stage II corresponded to the
inflexion point (Fig. 4.6) where the slope of the drying curve sharply decreased. This
assumption lead to the conclusion that the presence of salt reduces both the duration of
drying Stage I and the total amount of moisture eliminated by (Stage I) surface evaporation,
which opposes the results of the present MRI-monitored experiments.
For pure water, the drying rate is indeed approximately constant during Stage I, abruptly
drops when Stage II begins and continues to decrease progressively during Stage II
(Sherwood 1929, Scherer 1990). This was observed in the experiments performed here with
pure water, whose drying curves (Fig. 4.13) resemble ordinary gravimetric drying curves
(Fig. 4.6). Yet, for NaCl a different situation occurred. In this case, the drying curves (Fig.
4.13) show slope variations during Stage I, which was still going on at the end of the
experiments (Figs. 4.11 and 4.12). This suggests that the drying rate is not necessarily
constant during Stage I when salts are present, a hypothesis put forward also by other
authors (Hall and Hoff 2002, Huinink and Pel 2003, for instance). Therefore, gravimetric
drying curves of salt-loaded materials cannot be interpreted in the same way as for pure
water. That explains the discrepancy in the conclusions of Benavente et al.
Decrease of the drying rate of salt-loaded materials during Stage I has been attributed to two
different causes (Hall and Hoff 2002, Huinink and Pel 2003): (i) as evaporation proceeds,
solutions become more and more concentrated at the drying front, hence, their RHeq and
thereby the evaporation rate decrease further; (ii) once saturation is attained, the deposition
of salt crystals may hinder evaporation.
The results of the present evaporation experiments on free liquid surfaces of pure water or
NaCl solution (Fig. 4.14) suggest that the low drying rates of the NaCl-loaded specimens
were probably due to reduction of the specific surface of evaporation. Indeed, the faster the
evaporation, the closer the evaporation rates of the two liquids. But even for the faster drying

Drying of salt-loaded materials 91
conditions (20ºC-15%RH) the ratio between the evaporation rates of pure water and NaCl
solution is only of around 1.4. Therefore, the lower evaporation rate of the masonry
specimens in the presence of salt (Fig. 4.13) was not only due to the RHeq of the salt solution
being lower than that of pure water. Indeed, these drying experiments were performed under
environmental conditions (0%RH and 18ºC) that are expected to generate a faster
evaporation than the two experiments on free liquid surfaces. Hence, the ratio between the
(Stage I) evaporation rates of the contaminated and non-contaminated specimens should be
even lower than 1.4. Yet, the evaporation rate was always at least 6 times (specimen DL1)
and 3 times (specimen ML1) higher for pure water than for the NaCl solution (Fig. 4.14).
Therefore, it is clear that some factor other than the lower RHeq of the salt solution made a
major contribution towards decreasing evaporation.
Deposition of salt crystals with a blocking effect was possibly a major cause. But further
research, namely at the pore scale, is required to confirm this hypothesis. The suggestion of
Rousset-Tournier (2001) that the curvature of the menisci at the drying front could influence
the effective surface of evaporation in pure water-filled materials also deserves attention.
Indeed, the contact angle of salt solutions with porous building materials is higher than that of
pure water and, hence, a lower effective surface of evaporation can arise. It would also be
interesting to know if and how the presence of solid crystals can affect that contact angle.
4.5.2 - Salt distribution
The final NaCl distribution in specimens DL1 and ML1 was evaluated by means of HMC
measurements which provided estimates of the salt content in distinct layers of the
specimens (Figs. 4.15 and 4.16).
The salt distributions depicted in Figs. 4.15 and 4.16 show that overall similarities exist
between the two specimens:
i) A higher concentration of salt always occurred at the outer layer of the plaster, clearly
because the moisture was eliminated mostly by (Stage I) surface evaporation.
ii) The second most superficial layer of plaster always presented a high salt content too.
This probably means that the drying front progressed inwards into the specimens
during the final oven drying at 40ºC.
iii) The deposition of a certain residual amount of salt throughout the whole specimen
can be explained by the decrease in the moisture content at the pore level (Rose
1963b) during the final oven drying. Critical moisture content is attained at a certain
moment, at which liquid continuity is interrupted in the capillaries. Isolated clusters of
liquid remain thus dispersed in the porous system, trapped in the finer pores. Further
drying occurs by local evaporation, hence, in the case of a salt solution, a certain
amount of salt will crystallize at each cluster.
Nonetheless of these overall similarities, the final salt distribution is not completely identical
in the two specimens due to differences in the pore system of stone D and stone M. Table
4.1 and Fig. 4.8 depict the porosity and porometry, respectively, of the three materials in
these specimens. It is seen that:

92 Chapter 4
• Porosity and, thus, the moisture storage capability of stone M is higher than that of
mortar L, which is higher than that of stone D.
• Mortar L has less medium-dimension pores (between 0.1 and 0.6 µm) but more
coarse pores (larger than 0.6 µm) and significantly more fine pores (smaller than 0.1
µm) than stone D.
• Mortar L has less medium-dimension and coarse pores (between 0.2 and 5 µm) but
more fine pores (less than 0.2 µm) and also more coarse pores (larger than 5 µm)
than stone M.
The main differences between the two salt distributions are the following:
i) The concentration of salt in the plaster, especially in the surface layer, is higher for
specimen ML1. This is most likely due to the fact that specimen ML1 has a higher
porosity and, hence, contains a higher initial amount of salt solution.
ii) Stone M, despite its higher initial solution content, accumulates less salt than stone D.
In fact, a pore can only remove water from another pore if it has higher capillary
pressure, that is, if it is smaller. Stone M has a larger amount of coarse pores than
stone D (Fig. 4.8) and, thus, mortar L is able to drain stone M faster and more
completely. This was clearly observed in the drying experiments with pure water
(Figs. 4.9 and 4.10).
iii) In specimen ML1, a particularly high concentration of salt exists in the bedding mortar
in the contact layer with the stone (Fig. 4.16). This is most likely due to the following.
Stone M dries probably before the bedding mortar dries, as it happened in the
experiments with pure water (Figs. 4.9 and 4.10). Hence, when the stone is already
dry, the mortar may still contain enough moisture to ensure liquid continuity in the
capillaries. In that case, a transverse drying front develops at the mortar/stone interface
and some salt accumulates in the first contiguous mortar layer.
iv) In specimen DL1, a higher accumulation of salt occurred in the stone, close to where it
came into contact with the plaster (Fig. 4.15). This is probably due to the fact that the
critical moisture content of porous materials is higher for less homogeneous pore size
distributions (Snethlage and Wendler 1997). This is the case with mortar L when
compared to either of the stones (Fig. 4.8). Thus, although with pure water stone D is
slightly dryer than the adjacent plaster layer at the end of the experiment (Fig. 4.10),
liquid continuity may be interrupted first in the plaster. In this case, a drying front
develops at the plaster/stone interface. The drying experiments with salt solution ended
before this type of behaviour could be observed, therefore, further confirmation is
needed.
This conclusion agrees with previous 1D drying experiments on plaster substrate
specimens (Petković 2005). It was found that a fine-pored plaster applied over
coarse-pored substrate leads to crystallization only at the surface of the plaster. This
could be the case here of plaster L and stone M. Differently, a coarse-pored plaster
applied over a fine-pored substrate leads to crystallization both at the surface and at
the interface plaster/substrate, as it happens here with plaster L and stone D.
Drying of salt-loaded materials 93
These differences between the salt distributions in the two specimens suggest that, in
buildings, distinct local distribution patterns may arise for different masonry materials.
However, it is not easy to directly extrapolate the present results and conclusions for porous
materials in real constructions. In fact, salt deposition patterns depend on multiple and
interrelated factors as it will be shown on Chapter 5.
The environmental conditions, for instance, strongly condition the speed of the drying
process. The relative drying speed of the different masonry materials conditions the
occurrence of internal drying fronts, either at the pore or at the material scale. It is
reasonable to expect that, under slower evaporation conditions, all pores and materials in the
masonry will have more time to drain the liquid solutions. Hence, less salt will be deposited in
the interior of the masonry, either dispersed throughout the materials (particularly, those of
less homogenous pore size distribution) or concentrated close to interfaces between distinct
materials.
4.5.3 - Other soluble salts
Only NaCl was studied here. Other salts may have different RHeqsat and crystallization
properties and, so, distinct influences on drying. The different drying rates, and consequent
tendency for a longer or shorter drying Stage I, may be one of the reasons why some salts
tend to form efflorescence and others to be deposited deeper inside porous materials. This
could account for the higher tendency of sodium chloride, which has a lower RHeqsat than
namely sodium sulfate, to form harmless efflorescence.
In buildings subjected to rising damp, moisture rises up in walls until a steady state is
eventually established, so that the ground liquid supply is balanced by evaporation (Arnold
and Zehnder 1990, for instance). Hence, the evaporation rate conditions the height of
capillary rise, thus, the height at which salts crystallize (Arnold 1989). When evaporation is
lowered by whatever factor, for instance, use of coverings with low vapour permeability, rise
of RH, lowering of temperature or reduction of air (wind) velocity, the height of capillary rise
and salt deposition increases. As shown in this chapter, the salts themselves influence the
evaporation rate. More work is needed to understand what exactly the influencing factors
are. Nevertheless, it is clear that properties of the soluble salts, and perhaps of their
crystallization process, that influence drying need to be considered in order to understand
why some salts tend to crystallize higher on walls, while others tend to be deposited closer to
the ground.
The concentration of salt solutions can be a relevant factor. This hypothesis is consistent
with Lewin’s observations (1982). A 60 cm-high stone column was subjected to in-continuum
partial immersion in NaCl solutions with different concentrations. Lewin reports that the
height at which damage occurs increases with the concentration of the salt solution, a
behaviour that is compatible with the results of this thesis. Also in the experiment performed
by Van Hees and Lubelli (2002) on three brick masonry walls, the higher the concentration of
the NaCl solution the higher the obtained level of capillary rise. The minimum level was
achieved with pure water.

94 Chapter 4
In fact, the RHeq of salt solutions varies (decreases) with their concentration. Therefore,
concentration influences the evaporation rate, at least, before saturation is attained.
Concentration conditions also the rate of crystallization in porous materials. This may be
relevant, as far as evaporation is concerned, if it is true that salt crystals hinder evaporation.
Therefore, the concentration of salt solutions may condition masonry drying and salt
distribution although the possible relevance of this influence requires further evaluation.
Nevertheless, it is reasonable to expect that the lower the concentration, the more similar to
the case of pure water is the drying process, i.e., the deeper and higher in walls the drying
front is positioned. This would explain why weak salt solutions are able to cause significant
damage in old constructions.
NaCl did not seem to significantly affect the interaction between the different materials during
the present drying experiments (Figs. 4.11 and 4.12). Although the duration of these
experiments was insufficient for a complete comparison of the two drying processes, the final
salt distributions are compatible with this hypothesis, as discussed in the previous section. It
is necessary to verify, in future work, if the same happens with other soluble salts. Different
interaction between the various masonry materials during drying may lead to distinct local
salt distribution patterns.

Chapter 5 – Behaviour of plasters and renders
5.1 Introduction
The behaviour of porous building materials in relation to salt crystallization can be influenced
by several factors. The environmental conditions, for example, are a major influencing factor.
They condition, for instance, the evaporation and crystallization rates, the nature and habits
of the crystalline phases that arise or the occurrence of temperature-induced crystallization,
as discussed in Chapter 2.
The type of salt is another important factor. It is known that different salts are effective under
different environmental conditions (Goudie and Viles 1997). Yet, some salts tend to be more
harmful than others. In laboratory tests, for instance, sodium sulfate typically causes
extensive damage to porous building materials, while sodium chloride is often much less
damaging or even completely innocuous. Since these are the two salts normally used in
laboratory crystallization tests, it is important to understand the reasons for such different
behaviour.
One plausible cause was put forward in Chapter 4: sodium chloride induces a slower drying,
namely because of its lower RHeqsat, which could account for a higher tendency to form
harmless efflorescence than sodium sulfate.
Despite this apparently low destructive capability, sodium chloride is often found to be
involved in salt decay processes in real constructions. This inconsistency between the in-lab
ineffectiveness and on-field effectiveness of sodium chloride was pointed out by authors
such as Honeyborne (Evans 1969-1970) or Goudie and Viles (1997) and requires further
explanation.
Plasters and renders with different working principles are used today on salt-loaded walls.
Some are industrial products aimed specifically at being salt-accumulating or
salt-transporting. But real buildings present a wide range of possibilities as regards not only
the environmental conditions and type of salt but also, for instance, the nature of the
substrate, the moistness conditions or the presence of a final paint layer. Therefore, a
question arises as to whether and how the behaviour of plasters and renders in relation to
salt crystallization can be influenced by such conditions.

96 Chapter 5
In Portugal, traditional (site-made) plasters and renders are widely used on salt-loaded walls.
Water-repellent mass additives are often used in such plasters and renders aiming at
minimizing salt dampness and surface damage by salt crystallization.
It is known that fully hydrophobic surface layers can worsen salt decay because
crystallization takes place at the interface between the hydrophobic layer and the non-
hydrophobic material. This was verified by the author within a set of NaCl crystallization tests
on brick specimens, either non-treated or treated with a surface hydrophobic product
(Gonçalves 2003b). After several cycles of partial immersion in a saturated solution of NaCl
and oven drying at 60ºC, the treated specimen cracked due to subflorescence formation at
the interface between hydrophobic and non-hydrophobic material, as seen in Fig. 5.1.
But the non-treated specimen presented only efflorescence.
(a) (b) (c)
Fig. 5.1 - Crystallization test on brick treated with hydrophobic surface treatment on all faces
except the bottom (specimen I) and on non-treated brick (specimen II): (a) damage at the end of
the test; (b) damage after removal of efflorescence; (c) subflorescence in the treated specimen,
after removal of the fractured surface layer.
Fully hydrophobic plasters and renders, either traditional or industrial, are sometimes used
on salt-loaded walls. Their behaviour is expected to be equivalent to that of specimen I in
Fig. 5.1, that is, occurrence of subflorescence at the plaster/substrate interface (Fig. 2.10)
and ultimate detachment from the substrate. But partially hydrophobic plasters and renders,
where low amounts of mass water-repellent additives are used to reduce the capillarity
coefficient, are probably the most common situation. Also in this case, there is field evidence
that salt decay may be worsened, as observed by the author on test panels applied on an old
church near Lisbon (Fig. 5.2). The reasons for salt damage increasing when partially
hydrophobic plasters and renders are used required clarification.
Dampness and decay problems are in fact often aggravated by restoration interventions.
This is a general complaint from many end-users, as reported in Chapter 2. Such problems
are perhaps related to the use of non-traditional products, as in the case presented in
Fig. 5.2 which concerns the use of hydrophobic additives. Failures of industrial salt-
accumulating plasters have been also reported, for instance, in the case of Leiderdorp
Farmhouse in the Netherlands (TNO 2004). It is, therefore, critical to identify what factors can
worsen dampness and decay in recently restored buildings.
I I I II II

Behaviour of plasters and renders 97
Fig. 5.2 – Test panels on the interior of S.
Sebastião church, Almada, one year after
their application. Each panel is made of two
similar plaster coats composed by a mortar
with volumetric composition of 1:1.5:1.5 (dry-
hydrated lime: sand from Tagus river : yellow
pit sand from Corroios). In the panel on the
right a commercial air-lime with hydrophobic
properties was used. In contrast to the panel
on the left, where ordinary air-lime was used,
more severe dampness and sanding of the
mortar at the base of the panel were
observed here.
Laboratory tests were considered the best means of answering the previous questions.
Because of their operational advantages, laboratory tests are, in contrast to field tests, a
feasible means of evaluating many types of materials under different conditions. Further,
laboratory tests can be performed under controlled conditions, hence, allowing sustainable
comparisons. Laboratory tests may also be designed in such a way as to isolate possible
influencing factors.
Laboratory salt crystallization tests are currently used to assess or predict the performance of
building materials. For plasters and renders, though, there are no standard crystallization
tests available. In fact, there were no available methods of whatever kind allowing an
adequate evaluation of the performance of plasters and renders on salt-loaded walls. Yet,
the influence of plasters and renders on moisture transport and salt crystallization processes
throughout an entire building can be huge, as sustained in this thesis. Further, more and
more industrial products, of varied nature and often considerably expensive, which are
claimed to prevent salt-induced dampness or salt decay problems, are available on the
market. Hence, there is an urgent need for methods that will allow a preliminary evaluation of
the behaviour of plasters and renders for salt-loaded walls.
For all these reasons, a laboratory research was carried out in order to investigate the
behaviour of plasters and renders in relation to salt crystallization. The main objectives were:
• To assess the behaviour of three different plasters, either painted or unpainted, with
different salts and substrate materials. Two commercial plasters, intended to work as
salt-accumulating, and a traditional lime-cement plaster were used.
• To evaluate the possible influence of the following main factors:
- moistness condition;
- type of salt;
- substrate material;
- presence of a paint layer;
- use of water-repellent additives in traditional plasters and renders.
• To identify chief factors that can account for the worsening of dampness and salt decay
after restoration interventions.
• To assess the possibilities and limitations of a given crystallization test as a
performance test for plasters and renders.
• To discuss the adequacy of plasters and renders with different working principles to
different practical situations.

98 Chapter 5
The research was performed by means of salt crystallization tests or MRI-monitored drying
experiments. Five sets of tests were performed in total. The work was done within different
research programmes in which the author was involved over recent years. For this reason,
the choice of the testing procedures and materials was to a large extent conditioned by the
specific requirements of each programme.
In this chapter, the overall research is presented. Salt crystallization tests are reviewed in
section 5.2. Background information on the sorption behaviour of porous building materials is
introduced in section 5.3. The materials used in the five sets of tests are described and
characterized in section 5.4. Then, the results of each set of tests are individually presented
and discussed in sections 5.5 to 5.9. An overall discussion focusing on the objectives of the
research is presented in section 5.10.
5.2 Salt crystallization tests
5.2.1 - Introduction
Salt crystallization tests are ultimately drying tests performed on specimens filled with a salt
solution. Still, there are important differences between salt crystallization tests and ordinary
drying tests such as those described in Chapter 4. One is that salt crystallization tests are not
normally performed under constant conditions. They often involve periodic wetting and drying
under changeable environmental conditions. But the fundamental difference is that salt
crystallization tests are aimed at evaluating salt damage and not only moisture transport
during drying. Salt crystallization tests are in fact artificial ageing tests. Very concentrated
salt solutions, repeated contaminations and severe or changeable environmental conditions
are used in order to enhance damage by inducing fast drying and crystallization rates,
increased crystallization pressures, temperature-induced crystallization, hydration, etc.
Typically, in salt crystallization tests the specimens absorb the chosen salt solution under a
predefined contamination procedure. Afterwards they are allowed to dry under certain
environmental conditions. Often, several wet/dry cycles are carried out. Differently, some
crystallization tests are performed on specimens in continuous partial immersion. In this
case, absorption and drying occur simultaneously throughout the entire testing period. In
both types of test, damage is evaluated, either periodically during the test or at the end, by
visual observation or by measuring certain material properties.
The first crystallization tests were carried out in the 19th century by civil engineers for
simulating the disruptive action of icing. In his early article, Thury (1828) reports the method
proposed by M. Brard: small cubes of stone were boiled for 30 minutes in a sodium sulfate
solution saturated when cold; the cubes were then hung above dishes containing the same
salt solution and were periodically sprinkled with water for around five to six days; the
resistance of the stones to icing was evaluated by considering the loss of material.
Salt crystallization itself was later recognized as an important deterioration mechanism of
porous materials. So, crystallization experiments began being performed to specifically
assess damage by salt crystallization. Schaffer (1932), for instance, states that crystallization
tests: (i) allow correlating significant factors, namely environmental conditions and material
structural properties; (ii) tend to reproduce that type of weathering which the material suffers
under actual exposure to the weather.

Behaviour of plasters and renders 99
Eventually, some crystallization tests were included in official standards, for example, CEN
test for natural stone (CEN 1999) or ASTM test for aggregates (ASTM 2005). But, no
crystallization tests specific for plasters/renders neither exist as standard methods nor are
mentioned in article or book reviews on the subject (Evans 1969-1970, Alonso et al. 1987,
Goudie and Villes 1997).
In the late nineties, Wijfels et al. (1997) proposed a crystallization test for plasters/renders.
This test is similar to a crystallization test for masonry wallets by RILEM, latter published as
RILEM (1998), with the following main alterations: (i) it was performed on specimens
composed of a plaster on brick substrate; (ii) at the end of the test, the salt distribution across
the specimens was measured.
More recently, efforts have been made (Vergès-Belmin et al. 2005) within the research
project COMPASS to develop an effective crystallization test for plasters and renders by
improving the method used by Wijfels et al. Some of the experimental work presented in this
Chapter (section 5.5) was part of that common effort.
5.2.2 - Test variables
Alonso et al. (1987) identified some of the main variables of crystallization tests by
wet/dry cycles which are the most common case:
- specimens: size, shape and number;
- salt: nature of the salt and solution concentration;
- contamination phase: type of immersion (total or partial), duration and temperature of
the solution;
- drying phase: environmental conditions and duration;
- cooling phase: existence and duration;
- number of absorption/drying cycles;
- damage assessment: by visual observation, by considering the number of cycles the
material resists, by mass loss evaluation or by accessing changes in physical
properties such as, for instance, porosity.
Other test variables, relevant for crystallization tests in general and not only for those by
wet/dry cycles, are:
- type of specimens: single-material or composite specimens;
- general procedure: wet/dry cycles, single initial contamination or continuous
immersion of the specimens;
- contamination procedure: in the case of wet/dry cycles or single initial contamination,
the specimens are contaminated by allowing them to absorb the solution during a
given period; this period is either equal for different types of materials or
predetermined in order to correspond to the introduction of similar amounts of salt or
salt solution in these materials; in the case of wet/dry cycles, further rewettings can
be carried out with the same salt solution or with pure water only.

100 Chapter 5
- drying procedure: unidirectional migration of moisture (by sealing the lateral faces of
the specimens) or not;
- assessment of damage: periodicity; measurement or not of the final salt distribution;
- stopping criterion: accomplishment of a certain number of cycles or occurrence of
damage.
The most significant of these test variables will be discussed in the following sub-sections in
the light of an adequate design of crystallization tests for plasters and renders.
5.2.3 - Type of specimens
Most crystallization tests reported in the literature are meant to assess the
resistance/durability of certain material(s) to salt crystallization. Accordingly, they are
performed on specimens made of a single material (concrete, mortar, brick, stone, etc.).
However, for plasters and renders, an evaluation of the material itself is clearly insufficient:
a) Firstly, because the physical properties of plasters and renders may be influenced, during
hardening, by those of the substrate material.
b) Secondly, because solution transport, hence, salt crystallization and salt distribution
processes depend on the interaction between all masonry materials (Huinink et al. 2005,
for instance).
c) Thirdly, because plasters and renders do not work independently of the substrate: their
detachment is already damage, even if no other deterioration occurs in the plaster/render
or in the substrate materials. Fully hydrophobic plasters, for instance, will certainly
perform very well if single-material specimens are used because they do not absorb
liquids. However, in reality, fully hydrophobic plasters and renders often cause problems,
namely, when they detach from the masonry.
d) Finally, because plasters and renders have a fundamental sacrificial role in ancient
buildings: they are meant to protect the structural masonry from destructive actions,
namely, salt crystallization. Although in some cases other requirements, such as
providing good health conditions inside buildings, may superimpose on substrate
protection requirements, it is therefore important to verify to what extent plasters and
renders prevent or, conversely, encourage salt crystallization in the substrate.
RILEM test MS-A.1 (RILEM 1998) is one of the few crystallization tests that use composite
specimens. These are the so-called wallets which are composed of a number of masonry
elements and mortar joints. The large size of these wallets (minimum flat dimensions of
200 mm x 200 mm) seems, however, to be a significant operational disadvantage.
Although the use of plaster/render is not foreseen in RILEM recommendations, nothing in the
test method itself prevents its use. Wijfels et al. (1997) in fact performed RILEM test MS-A.1
on specimens composed of plaster applied on brick substrate (apparently, entire bricks of
unspecified dimensions were used).
A recent NaCl crystallization test proposed by Lubelli (2006) and the MRI-monitored drying
experiments carried out by Petković (2005) also used plaster/substrate specimens. These
works were, to a large extent, related to the COMPASS project under which framework this
thesis was partially carried out.

Behaviour of plasters and renders 101
5.2.4 - Contamination conditions
In crystallization tests by wet/dry cycles, the specimens are filled with the salt solution
generally by one of the following type of protocols: (i) capillary saturation by total immersion;
(ii) introduction of a fixed amount of salt, by keeping the specimens in partial immersion
during a predetermined period, which can vary for different materials; (ii) partial immersion of
all types of specimens during a fixed period.
Capillary saturation can perhaps be representative of reality for very absorbent materials or,
ultimately, materials in walls where a moisture supply rate higher than the evaporation rate
exists during very long periods. But it may be unsuitable for simulating the condition of
plasters applied on walls where wetting and drying periods alternate. In this case, plasters
with high vapour permeability and low capillary absorption will probably never attain capillary
saturation, while very absorbent plasters may do so. Therefore, capillary saturation can be
an erroneous condition when these two kinds of plasters are compared.
RILEM test MS-A.1 (RILEM 1998) uses a multi-stage contamination regime. The wallets are
immersed in the solution up to 20 mm from their bottom face. Four hours later that level is
restored. After another four-hour period, the solution level is brought up to 5 mm below the
top surface of the wallets. The specimens are removed from the solution when 24 h have
passed since the start of contamination. This multi-staged contamination procedure is mostly
aimed at avoiding air-trapping but, excepting that, it is practically equivalent to capillary
saturation by total immersion.
Representativeness of the second condition (fixed amount of salt) is also questionable, either
when it corresponds to similar amounts of salt or to similar salt contents in different
specimens, because different building materials in similar field conditions are likely to absorb
distinct amounts of solution. Indeed, introducing a given amount of salt can be impossible, for
example, in the case of hydrophobic materials.
The use of a fixed amount of salt may, nevertheless, be appropriate in certain cases. For
example, Lubelli (2006) used identical NaCl contents of 2% (by weight) in traditional plasters
in order to reproduce the salt content in certain masonry.
The third possibility, partial immersion during a fixed period, may not bring about these non-
representativeness disadvantages. In that case, different plasters are subjected to an action
of similar intensity. Like in reality, the more absorbent plasters will absorb a higher amount of
solution. However, evaluating the behaviour of specimens that contain very different amounts
of salt may be difficult, particularly when salt distribution profiles are to be compared.
In some cases, an initial contamination with salt solution and further re-wettings with only
pure water are carried out. This is expected to be a less damaging condition than when
successive contaminations with the same salt solution are carried out. This procedure was
used on the preliminary crystallization tests in Fig. 5.3, although it is hardly sustainable as
representing reality.
Perhaps more interesting are the procedures where a single contamination is carried out at
the beginning of the test, typically by total immersion in the salt solution (Faria Rodrigues
2003, for instance). It has been argued that these so-called non-immersion techniques are
probably more representative of reality (Goudie 1997).

102 Chapter 5
Procedures based on continuous (partial) immersion of the specimens are sometimes used
instead of wet/dry cycling, although they are less common. This type of procedure was
evaluated in the preliminary crystallization tests in set 1, as described in section 5.5.2.1 and
depicted in Fig. 5.9.
5.2.5 - Drying procedure
In real walls, salt solutions typically migrate from the interior of the masonry towards the
outer surface of the plaster/render. This situation is normally represented in laboratory tests
by sealing all the faces of the specimens, except that representing the outer surface of the
wall. This prevents lateral evaporation during drying, thereby enabling predominantly
unidirectional migration of moisture to the surface.
The situation is not so straightforward as regards the environmental conditions during drying.
Enhanced damage is ordinarily achieved in crystallization tests by means of high
temperatures or low RH. But a large range of conditions is used in practice.
Drying is sometimes performed under constant environmental conditions of temperature and
RH. This happens, for instance, in RILEM test MS-A.1 (RILEM 1998) which is carried out at
20ºC and 50%RH. In other cases, oven drying at high temperatures is performed cyclically
between contaminations. This is the case of ASTM C88 test (ASTM 2005), which uses
110±5ºC or RILEM test V.1.a (RILEM 1980) where a temperature of 105±5ºC is to be
reached after 10 to 15 hours. Oven drying at a lower temperature of 60ºC is used, for
example in RILEM tests V.1.b or V.2 (RILEM 1980), to prevent alteration of surface
treatments.
Drying, particularly in non-standard salt crystallization tests, often includes RH or
temperature cycles. The aim is sometimes to represent specific environmental conditions as,
for instance, in Goudie’s climatic simulations (Goudie and Viles 1997). More often,
environmental cycling is intended to cause cycles of hydration/dehydration,
deliquescence/crystallization or temperature-induced crystallization.
In some non-immersion techniques the specimens are oven dried after being contaminated
and before being exposed to the testing conditions. This happens, for instance, in the
crystallization tests reported by Faria Rodrigues (2003), which use cycles of 12 h at 90%RH
and 20ºC and 12h at 40%RH and 20ºC.
When both hygroscopic moistening and drying occur during the exposure period of the
specimen, typically in alternating phases of high and low RH, it is not totally adequate to
designate that period as “drying phase”. This happens in non-immersion tests, which are
ordinarily based on hygroscopic moistening, but also in some wet/dry cycle tests that include
RH cycling.
5.2.6 - Salt solutions
Very concentrated or even saturated solutions, typically of sodium sulfate or sodium chloride,
are generally used in crystallization tests. Since sodium sulfate and sodium chloride are also
amongst the most common salts in decayed buildings and, moreover, were the ones used in
the experiments of this thesis, the following discussion will focus on them.

Behaviour of plasters and renders 103
Different salts are effective under different environmental conditions (Goudie and Viles
1997). Severe damage is normally achieved with sodium sulfate in crystallization
experiments, which is probably why this is the salt most often used in official standard
methods (Alonso et al. 1987). In contrast, sodium chloride, although frequently involved in
salt decay processes in buildings, is often found to be one of the least damaging or even a
totally innocuous salt in laboratory tests.
Sodium sulfate was already chosen by Brard for his early crystallization test on stone (Thury
1828) for being more destructive than sodium chloride, potassium nitrate, magnesium sulfate
and sodium carbonate. The environmental simulations with varying temperature and RH
carried out by Goudie on concrete specimens (Goudie and Viles 1997) are a more recent
example. Sodium sulfate was the most effective of five salts in one of the six conditions
(although it was ineffective under the five other conditions), while sodium chloride was the
only salt that had no effect under any of the conditions.
Within a preliminary set of crystallization tests in this thesis, more severe damage was also
achieved with sodium sulfate than with sodium chloride, except in one of the tested
environmental conditions (Fig. 5.3).
20ºC - 50% HR
(conditioned room,
low air velocity)
50ºC - 50% HR
(climatic chamber,
low air velocity)
20ºC - 35% HR
(climatic chamber,
low air velocity)
1 week: 20ºC-50% RH
(conditioned room,
low air velocity)
1 week: 20ºC-≈90% RH
(container, over water)
≈22ºC - 70 to 75% RH
(non-conditioned
room, despicable air
velocity)
Efflorescence+sanding
Efflorescence+sanding
Only efflorescence
developed very
tight to the
surface of the
plaster.
Only efflorescence
(whitened surface)
during the low RH
periods
Only powdery
efflorescence
NaCl
1.9 molal
(10%W)
55 days (2 rewet) 42 days (6 rewet) 45 days (4 rewet) 38 days (no rewet) 30 days (no rewet)
Exfoliation
Neither efflorescence
nor any other visible
type of damage
Scaling
Bulging
Efflorescence+sanding
Na2SO4
0.39 molal
(5%W)
14 days (1 rewet) 55 days (7 rewet) 16 days (2 rewet) 28 days (1 rewet) 2 days (no rewet)
Fig. 5.3 – Preliminary crystallization tests by wet-dry cycles. The specimens are composed of a
15 mm thick air-lime plaster applied on 2 0mm thick brick substrate and have flat dimensions of 20
mm x 20 mm. They are contaminated with NaCl or Na2SO4 by absorbing the solutions through their
bottom faces during 20 min, which corresponds approximately to reaching 80% of the maximum
capillary moisture content. Then, the specimens are subjected to the reported environmental
conditions. They are rewetted with pure water only at the end of each drying period, whenever their
mass is approximately constant. The test carried out in a non-conditioned room (column on the right)
is an additional test performed on saturated (undamaged) specimens at the end of the continuous
immersion tests presented in section 5.5.2.1. These preliminary crystallization tests ended at the
observation of damage other than efflorescence or when damage was no more expected to occur
within a reasonable period.

104 Chapter 5
Rodriguez-Navarro and Doehne (1999) also obtained less damage from sodium chloride
than from sodium sulfate. Their crystallization experiments on stone blocks were performed
by continuous partial immersion under constant environmental conditions at a low (35%) or
medium-high (60%) RH. Though both salts induced more damage under low RH conditions,
sodium sulfate formed mostly subflorescence in highly localized areas, while sodium chloride
predominantly formed efflorescence or filled the smallest pores homogeneously.
5.2.7 - Damage assessment
The performance of plasters and renders in relation to salt crystallization can be evaluated as
regards the damage patterns that occur, the durability or the salt accumulation behaviour of
the plaster/render.
Damage patterns are normally evaluated by visual observation. In some cases visual
observation is complemented, for instance, with microscopy (Alonso et al. 1987).
Durability is typically assessed by using quantitative parameters such as the number of
cycles accomplished (or time passed) before damage is observed or the mass loss at the
end of the test or at the end of each cycle.
The salt accumulation behaviour can be disclosed by the final salt distribution across the
plaster/render. Though it is not measured in ordinary salt crystallization tests, the salt
distribution was evaluated, for instance, at the end of the tests performed by Wijfels et al.
(1997) on brick/plaster specimens. First, the specimens were sliced. Afterwards, the 3 mm
slices obtained were dried, weighed and stored at 20ºC and 93% RH (for an unspecified
period) over a saturated sodium sulfate solution. Relative evaluation of the salt content in the
slices was made by means of their HMC. Ion chromatography is sometimes used instead of
the HMC method to obtain distribution profiles, for instance, in the experiments carried out by
Petković (2005).
5.3 Sorption of porous building materials
The sorptivity of porous building materials varies with their moisture content. This happens
because, when a material is wet, a certain part of its porosity is saturated and, hence, does
not contribute to the overall suction capability.
It is a common assumption that, at given moisture content in a material, all the pores below
certain dimensions are saturated. However, in reality, the distribution of water in the complex
pore networks of porous building materials can be significantly different when it is reached by
absorption or desorption. Several factors have been argued to contribute to this difference,
namely, pore shape, pore wall surface roughness or air-trapping during absorption
(Bachmann and van der Ploeg 2002). Nevertheless of the cause, when pores of different
dimensions are saturated, the capillary suction of the material is different. Therefore, the
material sorptivity can depend on whether the moisture content was achieved by wetting or
drying the material, which configures a hysteretic effect.

Behaviour of plasters and renders 105
Water characteristic curves (Fig. 5.4) express the correlation between the moisture content in
a material and its matric potential which represents the energy necessary to remove a unit
weight of water from the porous solid to a free state at the same level. Since in porous
building materials capillary forces are predominant (except at very low water contents where
adsorption is relevant) the matric potential can be, for practical purposes, assumed to be
equal to the capillary potential.
Moisture content
Capillary potential ψ
(m)
Wetting Drying
1.00
Fig. 5.4 – Water characteristic curve
of a porous building material
The capillary potential ψ (m) is given by Eq. 5.1, where pc (Pa) is the capillary pressure,
ρ (kg.m-3) the bulk density of water and g (m.s-2) the gravitational constant.
g
pc
.ρ=Ψ Eq. 5.1
Due to the hysteretic nature of the capillary potential, water characteristic curves (Fig. 5.4)
have two branches: one corresponding to absorption (wetting branch) and the other to
desorption processes (drying branch).
The equilibrium condition for two different wet materials in contact is the equality of capillary
potential. This does not normally correspond to an equality of moisture content because of
the differences between the two pore networks.
The liquid flux in porous building materials can be expressed in terms of capillary potential,
as shown by Eq. 5.2. that concerns unidirectional migration of moisture.
l
Ku∂
Ψ∂= )(1 θ Eq. 5.2
In this equation, u (m3.m-2.s-1) is the liquid flux, K1 (m.s-1) the liquid conductivity of the plaster
which is a very strong function of the moisture content and l (m) the distance.

106 Chapter 5
5.4 Material characterization
Table 5.1 presents the materials on which all the experiments presented in this chapter were
carried out.
The mortars, brick and stones indicated in Table 5.1 were characterized by means of the
following tests:
- capillary absorption tests were performed (Fig. 5.5) on all mortars, brick and stones
used in the five sets of tests;
- drying tests were carried out (Fig. 5.6) on the mortars used in sets 1 and 2;
- porosity and pore size distribution measurements (Fig. 5.7) by mercury intrusion
porosimetry (MIP) were performed on the mortars, brick and stones of sets 2 to 5;
- water vapour permeability tests (Fig. 5.8) were carried out on the three plastering
mortars used in set 1; these tests were performed by IET within the COMPASS
project and kindly made available for this thesis.
Table 5.1 - Materials used in the specimens
Designation Composition / description Set of tests
Mortar L Traditional mortar with volumetric composition of 1:1.5:1.5 (dry hydrated lime
LUSICAL : sand from the Tagus river : yellow pit sand from Corroios) 1 and 4
Mortar H Similar to mortar L but including a mass hydrophobic agent that was added
during batching in the proportion of 1/50 (by weight) to the lime 4
MEP-SP® Industrial trass-(air)lime-based plastering/rendering mortar by Strasserville
(France), which includes mass water-repellent additives 1 and 2
Parlumière® Industrial cement-based plastering/rendering mortar by Lafarge Mortiers
(France), which includes mass water-repellent additives 1
LNEC-plaster
Traditional (air)lime-cement-based plaster/render composed of an
adherence coat and a base coat with volumetric composition of,
respectively, 1:1:6 and 1:3:12 (type IV cement : dry-hydrated lime LUSICAL :
river Tagus sand)
1
Brick Dutch red ceramic brick (solid bricks) 1 and 2
Stone D Portuguese medium-porosity calcitic calcareous stone with fossil fragments
(currently named “vidraço”) 3, 4 and 5
Stone M Portuguese high-porosity calcitic calcareous stone 4
Silicone paint Funcosil® LA silicone-based emulsion paint (ochre) by Remmers 1
Acrylic paint DIOPLASTE® average-quality acrylic emulsion paint (white) by Barbot
(Portugal) 3 and 5
Mass hydrophobic
additive
SUPER SIKALITE® mass hydrophobic additive (powder) for mortar and
concrete by Sika (Portugal) 4

Behaviour of plasters and renders 107
The unidirectional capillary absorption tests (Fig. 5.5) were carried out on specimens with
dimensions of around 45mm x 45mm x 20mm whose lateral faces were sealed with an epoxy
resin. Only in the case of lime mortars L and H was the test carried out according to CEN’s
procedure (CEN 2002) on six half-prisms, laterally sealed with wax, obtained by breaking
three 40 mm x 40 mm x 160 mm prisms. In both cases, the specimens were first oven dried
at 60ºC. Then, they were allowed to freely absorb pure water through their bottom face and
were weighed periodically. During absorption the specimens were kept inside a closed
acrylic box and the level of the free water surface was maintained 5 mm above the bottom
face of the specimen. The test was performed on two or three specimens of each material.
The water absorption coefficient (WAC) is calculated as the inclination of the straight (initial)
section of the absorption curve which expresses the average weight amount of water
absorbed per unit area as a function of the square root of time.
0
1
2
3
4
5
6
0 1 2 3Time (h1/2)
Absorbed w
ater (kg/m
2)
LNEC base LNEC adher
Stone D Stone M
Brick
WAC=14.4
WAC=7.3
WAC=3.6 WAC=3.6
WAC=11.6 WAC=11.6
0
5
10
15
20
0 1 2 3
Time (h1/2)
Absorbed w
ater (kg/m
2)
Mortar L
Mortar H
WAC=13.3
WAC=7.3
0
1
2
3
4
5
6
0 10 20
Time (h1/2)
Absorbed w
ater (kg/m
2)
MEP-SP Parlumière
WAC=2.0
WAC=0.2
Fig. 5.5 - Capillary absorption tests (WAC in kg.m
-2.h
-1/2).
The drying tests were carried out in a conditioned room with a low air velocity at
approximately 20ºC and 65% RH. Plaster slabs of around 45 mm x 45 mm x 20 mm, laterally
sealed with an epoxy resin, were used. The slabs were detached from plaster/brick
specimens similar to those in Fig. 5.10 but where filter paper was interposed between the
plaster and the substrate. They were previously saturated by total immersion in pure water
until constant weight. During drying, their bottom face was sealed with polyethylene film.
Three specimens of each kind were used.
0
5
10
15
0 5 10 15 20 25 30
Time (days)
Moisture content (%
W)
Parlumière
MEP-SP
LNEC base
LNEC adher
Fig. 5.6 - Drying curves

108 Chapter 5
The pore size distribution was measured by mercury intrusion porosimetry (MIP) according to
LNEC’s procedure LERO PE01, which is based on NP EN 1936 (CEN-IPQ 2001).
0.00
0.10
0.20
0.30
0.001 0.01 0.1 1 10
dV/dlogr
Mortar L
Mortar H
Mortar MP
Brick
Stone D
Stone M
r (m m)
Fig. 5.7 – Pore size distribution (MIP)
The material vapour transport capability was characterized by means of RILEM test II.2
(RILEM 1980). The tests were performed on plaster slabs detached from plaster/brick
specimens, as in the case of the drying tests presented in Fig. 5.6.
0.0
0.5
1.0
1.5
0 20 40 60 80 100 120
Time (h)
Vapour flux (g/m
2)
LNEC MEP Parl
Room: T ≈ 20ºC, RH ≈ 50%
Specimens kept over water
Fig. 5.8 - Water vapour transport.
Results obtained and kindly made available by IET.
MEP

Behaviour of plasters and renders 109
5.5 Crystallization tests on plaster/substrate specimens (set 1)
5.5.1 - Introduction
Salt crystallization tests were performed on three different plasters applied on brick or on
lime mortar substrate. Two commercial plasters claimed to work as salt-accumulating
plasters and a traditional lime-cement plaster were used. Tests with either sodium chloride or
sodium sulfate were carried out on painted and unpainted specimens.
The main objectives of these tests were the following:
• Assessment and comparison of the behaviour of the plasters, particularly as regards
their salt-accumulation behaviour, under different conditions;
• Evaluation of the influence of the following main factors:
- type of salt, by comparing the results obtained with NaCl or Na2SO4;
- substrate material, by comparing the performance of the traditional plaster on
brick or on lime mortar substrate;
- presence of a paint layer, by comparing the results obtained with painted and
unpainted specimens;
• Discussion of the testing protocol.
The tests presented in this section were carried out at LNEC within the COMPASS project
(Vergés-Belmin et al. 2005).
5.5.2 - Experimental conditions
5.5.2.1 - Definition of the main testing protocol
The COMPASS salt crystallization test derives from the test reported by Wijfels et al. (1997)
which is carried out on plaster/brick specimens. The test of Wijfels et al. is based on RILEM
test for masonry wallets (RILEM 1998) as regards, namely, the contamination protocol and
environmental conditions during drying. The COMPASS test, however, includes changes
which are mostly aimed at increasing its effectiveness. Indeed, the conditions of RILEM test
can lead to a very slow damage velocity. For instance, in previous tests carried out according
to this protocol on brick wallets with different surface treatments (van Hees and Brocken
2004), most damage occurred approximately between 12 and 48 months, which is hardly an
acceptable period for most purposes.
For the present experiments, two methods were initially considered: (i) wet-dry cycles
including an initial contamination with the salt solution and further rewettings with pure water
only; (ii) continuous partial immersion of the specimens in the salt solution. The possibilities
of these methods were evaluated by means of preliminary tests performed on plaster/brick
specimens under different environmental conditions. A pure lime plaster was used at LNEC.
An industrial restoration plaster was tested in two other laboratories (TNO and LRMH). The
final salt distribution was obtained, in the case of the industrial plaster, by slicing the
specimens and measuring the HMC of each sample. The different environmental conditions
used in these preliminary tests are shown in Table 5.2 where those used in LNEC tests are
marked.

110 Chapter 5
Table 5.2 – Environmental conditions used in the preliminary crystallization tests
Test by Reference
20ºC - 50% HR
High T
50ºC - 50% HR
Low RH
20ºC - 35% HR
Cycles of RH
1 week cycles
20ºC - 50% RH
20ºC - ≈90% RH
Cycles of T
1 week cycles
20ºC - 50% RH
50ºC - 50% RH
Cycles of
T and HR
Wet-dry
cycles X X X X - -
Continuous
immersion X X X - X -
20ºC/50% RH - conditioned room, low air velocity; 50ºC/50% RH - climatic chamber, low air velocity;
20ºC/35% RH - climatic chamber, low air velocity; 20ºC/≈90% RH - over water in a closed container at a conditioned room
The results of the preliminary crystallization tests carried out at LNEC by wet-dry cycles or
continuous-immersion are shown in Figs. 5.3 and 5.9, respectively. Fig. 5.3 provides also
details on the testing conditions. As seen, an additional test was performed at LNEC with no
rewettings and drying in a non-conditioned room.
Fig. 5.9 - Preliminary crystallization tests by continuous immersion on
lime-plaster/brick specimens. Abundant efflorescence occurred under all
environmental conditions both for the 1.9 molal sodium chloride (on the left) and the
0.39 molal sodium sulfate (on the centre) solutions. Its removal systematically
revealed wet undamaged plaster surfaces. The only exception were the tests with
high temperature periods (constant or cycles) on sodium sulfate, where cracking of
the specimens was observed (on the right).
The preliminary tests performed at TNO and LRMH on the industrial plaster allowed
concluding that wet-dry cycles induced higher salt contents in the plaster than continuous
immersion (TNO 2003). The tests performed at LNEC on the traditional plaster showed that
that continuous immersion was in general a much less harmful or even totally ineffective
method (Fig. 5.9) in comparison to wet-dry cycling (Fig. 5.3). Therefore, wet-dry cycles were
the method chosen for further tests.
Another conclusion was that high temperature originated faster drying, hence, more
rewettings in the case of wet-dry cycles. For this reason, it was decided to use a drying
period at a high temperature. In order to accelerate drying without using a very high, thus
perhaps too unrealistic, temperature, it was decided to combine this high temperature with a
low RH. The chosen conditions were 40ºC and 20% RH. A period at ordinary room
conditions was also desirable so that the specimens could be periodically observed and
manipulated with minimum disturbance of the testing conditions. Therefore, daily cycles of
16 hours at 40ºC and 20% RH followed by 8 hours at 20ºC and 50% RH were finally
adopted.

Behaviour of plasters and renders 111
In the preliminary tests, no significant damage to the industrial plaster arose in none of the
conditions (TNO 2003). For this reason, it was decided to harsh the testing conditions by
performing rewetting with the same salt solution instead of pure water only.
Small size specimens with flat dimensions of around 5 cm x 5 cm composed of a plaster
applied on a homogenous brick substrate were used in the preliminary crystallization tests
rather than the large size wallets (25 cm x 20 cm) of RILEM test (RILEM 1998). These small
sized specimens showed to be sufficiently representative and, hence, were adopted for the
subsequent tests. Indeed, the use of small specimens provides enormous operational
advantages: a much higher number of specimens can be tested simultaneously in a climatic
chamber, they can be handled faster and more easily and ordinary high precision weighing
devices can be used.
A contamination procedure different from that of the preliminary tests (Fig. 5.3) was,
however, used in the subsequent tests. This new procedure was aimed at overcoming the
disadvantages of common contamination procedures (section 5.2.5), that is, introducing
either very different amounts of salt in different specimens or forcing the specimens to
absorb equal quantities of solution which can be unrealistic for some materials. In the
present case, it was decided to introduce a fixed amount of solution but only in the substrate.
Therefore, different plasters could be suitably compared because:
• the substrate contained in all cases the same amount of salt solution, which is
representative of a situation where all plasters are subjected to an action of similar
intensity;
• identical amounts of salt could be introduced in the specimens regardless of the
physical properties of the plaster.
5.5.2.2 - Materials and methods
The present crystallization tests were carried out on industrial plasters MEP-SP and
Parlumière and traditional plaster LNEC (Table 5.1). MEP-SP and Parlumière were applied
only on brick substrate. LNEC was applied either on brick or lime mortar (mortar L) substrate.
The plasters on brick substrate were tested either not painted or painted with silicone paint
Funcosil.
Fig. 5.10 - Specimens (side view) used in set 1 tests: LNEC on brick (specimen 7LS), Parlumière
on brick (specimen P8) and LNEC on lime mortar (specimen 11) without or with protective tissue
The plaster/substrate specimens (Fig. 5.10) have flat dimensions of 40 mm x 40 mm to
50 mm x 50 mm. MEP and Parlumière plasters are composed of a single mortar coat with a
thickness of 20 mm. LNEC plaster is composed of a 5 mm adherence coat and a 20 mm
base coat. Brick or lime mortar bases with a thickness of 20 mm or 30 mm, respectively,

112 Chapter 5
were used as substrate. Preparation of the specimens is described in Annex II. At around the
two months of age they were laterally sealed with an epoxy resin. The bottom face of the
lime mortar substrate was protected with cotton tissue (Fig. 5.10) to avoid material loss
during absorption or while handling the specimens.
NaCl or Na2SO4 crystallization tests were performed as reported in Table 5.3. During drying,
the bottom faces of the specimens were sealed with polyethylene film.
Table 5.3 - Set 1 crystallization tests
Salt solution and number of specimens used
Materials Paint NaCl 1.9 molal
(10%W)
Na2SO4 0.8 molal
(10%W) Pure water
Unpainted 3 2 3 MEP-SP® on brick
Silicone paint 3 2 3
Unpainted 3 2 3 Parlumière® on brick
Silicone paint 3 - 3
Unpainted 2 2 2 LNEC on brick
Silicone paint 2 2 2
LNEC on lime mortar Unpainted 3 3 2
The crystallization tests were carried out according to the following procedure (Vergès-
Belmin et al. 2005):
1) The specimens are dried at 60ºC in a ventilated oven and then allowed to cool in a
conditioned room at around 20ºC and 50% RH.
2) Wet-dry cycles are performed as follows:
2.1) The specimens are partially immersed in the solution for 5 minutes, the liquid
surface being around 5 mm above their bottom face. The 5 minute period was
chosen so that:
• the wet front nearly reached the plaster/brick interface;
• the lime-mortar substrate absorbed a similar amount of solution.
2.2) The specimens are subjected to daily cycles of 16 hours at 40ºC and 20% RH
plus 8 hours at 20ºC and 50% RH in a climatic chamber with a low air velocity
(the same FITOCLIMA 500 EDTU® chamber by Aralab used in the experiments
of Chapters 3 and 4).
2.3) The specimens are weighed, using a weighing device accurate to 0.001g, and
the damage evaluated every week.
2.4) The wet/dry cycle ends when at least 80% of the water that the specimens
contained immediately after being contaminated has evaporated.
To prevent distortion of the results and since the drying behaviour of the two or
three specimens in each group was always very coherent, it was decided to end
each cycle only when all the specimens in the group had met this criterion.
Indeed, since the specimens were weighed only once a week, minimal
dephasement in their drying process would be magnified if the wet/dry cycle
ended in different weeks.

Behaviour of plasters and renders 113
Differently, the last cycle was prolonged until the mass of the specimens was
reasonably constant in time. There were two main reasons for this. Firstly, to
minimize the amount of moisture present in the materials when they were
sliced, not only because wet materials have a lower mechanical resistance but
also because slicing induces always a certain increase in temperature which
could cause migration of the liquid in the porous networks. Secondly, because,
due to operational limitations, some specimens could not be immediately sliced
and constant mass was a condition which allowed more flexibility as to the
moment when the specimens are removed from the climatic chamber.
3) Each specimen is typically subjected to five wet/dry cycles, though, as will be seen, more
than five cycles had to be carried out in some cases.
4) The salt distribution across the specimens is measured, at the end of the test, as follows:
4.1) the specimens are sliced in a sawing machine at indents of typically 5 mm (the
loss of material corresponds to a thickness of around 2 to 3 mm per cut);
4.2) the cut samples are then crushed into powder in an agate mortar;
4.3) the upper coat of the traditional plaster, however, could not be sawed due to its
low cohesion and relatively large grain size; this mortar was split by progressive
disagregation on sandpaper;
4.4) the salt content in each sample is measured by means of the HMC method (at
20ºC and 95% RH) using shallow-wide Petri dishes which, in this case, provided
a sufficient accuracy;
4.5) salt distribution profiles are obtained typically for one specimen of each type and
each testing condition; in these profiles the HMC is plotted against the distance
to the top surface of the specimen; each point in a profile represents the
average HMC in that particular slice of the specimen.
5.5.3 - Results
5.5.3.1 - Salt crystallization tests
The results of the crystallization tests are presented in Tables 5.4 to 5.7. The behaviour of
the two or three specimens in each group was quite similar as regards the amounts of salt
introduced, drying rates and damage patterns. Hence, unless otherwise specified:
- damage description refers to all the specimens in the group;
- the damage patterns, normally illustrated by pictures of one specimen, are
representative of the entire group of specimens;
- the salt distribution profile, which was typically measured for one specimen per group,
is assumed to represent the salt-accumulation behaviour of the entire group;
- the total amount of salt reported in each distribution profile refers to that particular
specimen but is similar for all the specimens in the group, as seen in Table 5.8.
Among these very coherent behaviours, LNEC plaster on lime mortar was an exception
when tested with Na2SO4 (Table 5.7). Despite the amount of salt absorbed and the drying
rate were, as further shown in Table 5.8 and Fig. 5.16, similar for the three specimens, only
specimen 14 showed damage. The two remaining specimens (15 and 16) were subjected to
additional wet-dry cycles but, even so, no visible damage occurred in neither of them.

114 Chapter 5
Table 5.4 – Crystallization test on MEP-SP / brick specimens
Salt Test Damage patterns and salt distribution profiles
Unpainted
5 cycles (2+2+3+7+10 weeks)
Cracks parallel to the surface, which
correspond to detachment of a 1-cm-thick
plaster layer, were observed on the 11th
week.
5 cycles - 2309 g NaCl / m2
0
100
200
300
0 10 20 30 40 50
Distance from top surface (mm)
HMC 95% (%)
S11 interface crack
NaCl
Silicone
paint
5 cycles (3-4-5-5-7 weeks)
Efflorescence was first observed on the 6th
week on all specimens. On specimen S5,
it was accompanied by peeling (scaling) of
the paint layer.
5 cycles - 2256 g NaCl / m2
0
100
200
300
0 10 20 30 40
Distance from top surface (mm)
HMC 95% (%)
S5 interface
Unpainted 5 cycles (2-2-3-5-8 weeks)
no damage
5 cycles - 2343 g Na2SO4 / m
2
0
20
40
60
0 10 20 30 40
Distance from top surface (mm)
HMC 95% (%)
S16 interface
Na2SO4
Silicone
paint
5 cycles (3-3-4-4-5 weeks)
no damage
5 cycles - 2399 g Na2SO4 / m
2
0
20
40
60
0 10 20 30 40
Distance from top surface (mm)
HMC 95% (%)
S18 interface
S5
S11

Behaviour of plasters and renders 115
Table 5.5 – Crystallization test on Parlumière / brick specimens
Salt Paint Major damage and salt distribution profiles
Unpainted
5 cycles (2-3-4-4-4 weeks)
Cracks parallel to the surface and
located in the plaster at 2 mm from
the plaster/substrate interface were
observed on the 11th week.
Previously, on the 6th week,
efflorescence had appeared on that
zone.
5 cycles - 2275 g NaCl / m2
0
100
200
300
0 10 20 30 40
Distance from top surface (mm)
HMC 95% (%)
P12 interface crack
NaCl
Silicone
paint
5 cycles (2-4-5-5-6 weeks)
Cracks parallel to the surface were
observed on the 13th week, in the
plaster, at 2mm from the interface
with the substrate. Previously, on the
4th week, efflorescence had
appeared on that zone.
5 cycles - 2295 g NaCl / m2
0
100
200
300
0 10 20 30 40
Distance from top surface (mm)
HMC 95% (%)
P5 interface crack
Na2SO4 Unpainted
5 cycles (1-2-4-5-7 weeks)
Cracks parallel to the surface were
observed between the 11th and the
13th week, in the plaster, at 1mm
from the interface with the substrate.
5 cycles - 2151 g Na2SO4 / m
2
0
20
40
60
0 10 20 30 40
Distance from top surface (mm)
HMC 95% (%)
P15 interface crack
P12
P5
P15

116 Chapter 5
Table 5.6 – Crystallization test on LNEC / brick specimens
Salt Paint Major damage and salt distribution profiles
Unpainted
5 cycles (2-5-10-8-5 weeks)
Surface whitening by efflorescence
was observed on the 4th week.
Peripheral cracks appeared on the
top surfaces between the 16th and
the 24th weeks. Surface sanding was
noticed on the 30th week.
5 cycles - 2249 g / m2
0
100
200
300
0 10 20 30 40 50
Distance from top surface (mm)
HMC 95% (%)
LS6 interfaces
NaCl
Silicone
paint
5 cycles (2-7-12-7-5 weeks)
Efflorescence was observed on the
4th week. It caused rupture of the
paint layer.
5 cycles - 2373 g NaCl / m2
0
100
200
300
0 10 20 30 40 50
Distance from top surface (mm)
HMC 95% (%)
LS19 interfaces
Unpainted
5 cycles (2-5-11-7-5 weeks)
Surface whitening caused by
efflorescence was observed on the
19th week.
5 cycles - 2351 g Na2SO4 / m
2
0
20
40
60
0 10 20 30 40 50
Distance from top surface (mm)
HMC 95% (%)
LS12 interfaces interface
Na2SO4
Silicone
paint
5 cycles (2-8-12-7-6 weeks)
Some efflorescence was observed
at the end of the test.
5 cycles - 1989 g Na2SO4 / m
2
0
20
40
60
0 10 20 30 40 50
Distance from top surface (mm)
HMC 95% (%)
LS17 interfaces
LS6
LS12
LS17
LS19

Behaviour of plasters and renders 117
Table 5.7 – Crystallization test on LNEC / lime-mortar specimens
Salt Paint Major damage and salt distribution profiles
NaCl Unpainted
5 cycles (2-4-6-5-5 weeks)
Larger peripheral cracks and thinner
diagonal cracks were observed on
the top surfaces on the 14th week.
5 cycles - 2112 g NaCl / m2
0
100
200
300
0 10 20 30 40 50
Distance from top surface (mm)
HMC 95% (%)
13 interfaces
Na2SO4 Unpainted
5 cycles (2-3-4-4-4 weeks)
Diagonal cracks were observed on
the top surface of specimen 14 on
the 15th week. These cracks were
prolonged as vertical cracks on the
lateral surfaces and as cracks
parallel to the top surface at the
interface between the base coat and
the adherence coat of the plaster.
5 cycles - 2236 g Na2SO
4 / m2
0
20
40
60
0 10 20 30 40 50
Distance from top surface (mm)
HMC 95% (%)
14 interfaces
7 cycles - 3429 g Na2SO
4 / m2
0
20
40
60
0 10 20 30 40 50
Distance from top surface (mm)
HMC 95% (%)
16 interfaces
More than 9 cycles - 5090 g Na2SO
4
/ m2
0
20
40
60
0 10 20 30 40 50Distance from top surface (mm)
HMC 95% (%)
15 interfaces
14
14
13

118 Chapter 5
5.5.3.2 - Tests with pure water
No damage was achieved in any of the tests with pure water. The distribution profiles of one
specimen per group are presented in Fig. 5.11 and show insignificant HMC values.
As seen, some of the specimens were subjected to more than five cycles with pure water.
The reason is that the tests with pure water served also to evaluate the stability of the
environmental conditions and, hence, additional cycles had to be performed in some cases in
order to accompany the tests with salt solutions which were, in general, much slower.
6 cycles - w ater
0
5
10
0 10 20 30 40
Distance from top surface (mm)
HMC 95% (%)
S8 interface
a) MEP-SP on brick
6 cycles - w ater
0
5
10
0 10 20 30 40
Distance from top surface (mm)
HMC 95% (%)
P7 interface
b) Parlumière on brick
14 cycles - w ater
0
5
10
0 10 20 30 40
Distance from top surface (mm)
HMC 95% (%)
LS3 interfaces
c) LNEC on brick
5 cycles - w ater
0
5
10
0 10 20 30 40 50
Distance from top surface (mm)
HMC 95% (%)
9 interfaces
c) LNEC on lime mortar
Fig. 5.11 - HMC profiles of some unpainted specimens tested with pure water
5.5.3.3 - Salt introduced in the specimens
Table 5.8 shows that quite similar amounts of salt were introduced in the tested specimens,
particularly within each group.
Table 5.8 - Salt introduced in the specimens
Salt introduced after 5 wet-dry cycles (g/m2)
MEP-SP® on brick Parlumière® on brick LNEC on brick LNEC on lime
mortar
Unpainted Silicone
paint Unpainted
Silicone
paint Unpainted
Silicone
paint Unpainted
NaCl
2416
2309
2356
2305
2256
2390
2373
2264
2275
2400
2295
2536
2249
2607
2373
2386
2182
2057
2112
Na2SO4 2020
2343
2091
2399
2151
2069 -
2351
1954
1989
2052
2236
2086
2264

Behaviour of plasters and renders 119
5.5.3.4 - Drying curves
The gravimetric drying curves obtained from weekly weighing the specimens are presented
in the figures bellow. Figs. 5.12 to 5.15 concern the average values achieved with the two or
three specimens of each type of material under each testing condition, which were similar to
the individual values in every group of specimens.
Fig. 5.16 shows the individual drying curves of the three LNEC / lime-mortar specimens
tested with Na2SO4. As shown in Table 5.7, this was the only group of specimens where
damage did not occur simultaneously in all the specimens. Fig. 5.16 shows that,
nevertheless, the drying behaviour of the three specimens is very similar.
The tests with pure water served also, as mentioned, to evaluate the stability of the
environmental conditions during the crystallization tests. That was done by checking whether
the drying rate of the water-filled specimens changed from cycle to cycle. As seen in Figs.
5.12 to 5.15 this did not happen which indicates a good stability of the environmental
conditions. Some minor changes observed between the first and the second cycles could be
due to hydration reactions occurring at the first contact of the hardened mortars with free
water.
0
5
10
15
0 5 10 15 20 25 30 35
Time (w eeks)
Water content (g)
MEP w ater MEP NaCl MEP Na2SO4
MEP paint w ater MEP paint NaCl MEP paint Na2SO4
Fig. 5.12 – MEP-on-brick drying curves
0
5
10
15
0 5 10 15 20 25 30
Time (w eeks)
Water content (g)
Par w ater Par NaCl Par Na2SO4
Par paint w ater Par paint NaCl
Fig. 5.13 – Parlumière-on-brick drying curves

120 Chapter 5
0
5
10
15
0 5 10 15 20 25 30 35
Time (w eeks)
Water content (g)
LNEC w ater LNEC NaCl LNEC Na2SO4
LNEC paint w ater LNEC paint NaCl LNEC paint Na2SO4
Fig. 5.14 – LNEC-on-brick drying curves
0
5
10
15
20
0 5 10 15 20 25 30 35
Time (w eeks)
Water content (g)
LNEC/lime w ater LNEC/lime NaCl LNEC/lime Na2SO4
Fig. 5.15 – LNEC-on-lime-mortar drying curves
0
5
10
15
20
0 5 10 15 20 25 30 35
Time (w eeks)
Water content (g)
LNEC/lime 14 LNEC/lime 15 LNEC/lime 16
Fig. 5.16 – Drying curves of the three LNEC-on-lime-mortar specimens with sodium sulfate

Behaviour of plasters and renders 121
5.5.3.5 - Summary of results
The results of the tests carried out with NaCl, Na2SO4 or pure water are summarized in
Tables 5.9 to 5.11, respectively.
Table 5.9 - NaCl crystallization tests (set 1): summary of results
Durability
Materials Paint Salt-accumulation
behaviour Alteration patterns
First
observation of
damage
(weeks)
Test duration
(weeks)
Unpainted
Accumulating
(accumulation at the
plaster mid-thickness)
Transverse cracks in the plaster
1cm from the surface 11 24
MEP-SP®
on brick
Silicone paint Transporting
Efflorescence on all specimens;
scaling of the paint layer on one
specimen
6 24
Unpainted
Accumulating
(accumulation close to
the interface with the
substrate)
Transverse cracks (preceded by
efflorescence) in the plaster at
2 mm from the interface
6 (efflor.)
11 (cracks) 17
Parlumière®
on brick
Silicone paint
Accumulating
(accumulation close to
the interface with the
substrate)
Transverse cracks (preceded by
efflorescence) in the plaster at
2 mm from the interface
4 (efflor.)
13 (cracks) 22
Unpainted Transporting Efflorescence, sanding and
peripheral cracks on the surface
4 (efflor.)
16 (cracks)
30 (sanding)
30 LNEC on
brick
Silicone paint Transporting Efflorescence with rupture of
paint 4 33
LNEC on
lime mortar Unpainted
Accumulating
(accumulation in the
plaster mid-thickness)
Peripheral and diagonal cracks
on the surface 14 22
Table 5.10 - Na2SO4 crystallization tests (set 1): summary of results
Durability
Materials Paint Salt-accumulation
behaviour Alteration patterns
First
observation of
damage
(weeks)
Test duration
(weeks)
Unpainted
Accumulating
(accumulation in the half
plaster next to the interface)
No alteration - 20
MEP-SP®
on brick Silicone
paint
Accumulating
(accumulation in the half
plaster next to the interface)
No alteration - 19
Parlumière®
on brick Unpainted
Accumulating
(accumulation close to the
interface)
Transverse cracks in the
plaster 1 mm from the
interface
11 to 13 19
Unpainted
Transporting
(slight accumulation in the
plaster)
Efflorescence 19 30
LNEC on
brick Silicone
paint
Transporting
(slight accumulation in the
plaster)
Efflorescence 35 35
LNEC on
lime mortar Unpainted
Accumulating
(accumulation in the plaster
mid-thickness + slight
accumulation up to the
interface with the substrate)
One specimen: longitudinal
cracks in the plaster and
transverse cracks at
plaster/substrate interface
15 17

122 Chapter 5
Table 5.11 - Tests with pure water (set 1): summary of results
Materials Paint Test duration for 5 cycles
(weeks)
Unpainted 9 MEP-SP® on brick
Silicone paint 14 *
Unpainted 9 Parlumière® on brick
Silicone paint 13
Unpainted 5 LNEC on brick
Silicone paint 9
LNEC on lime mortar Unpainted 7
* only 4 cycles were performed; the 14 weeks were estimated for a 5-cycle testing period due
to the constant cycle duration obtained in these 4 cycles (2, 3, 3 and 3 weeks)
5.5.4 - Discussion on set 1
5.5.4.1 - Main behaviour features
The behaviour of plasters and renders in relation to soluble salt crystallization can be
described according to three main features: salt-accumulation behaviour, damage patterns
and durability.
Salt-accumulation behaviour
The salt-accumulation behaviour of plasters and renders (Fig. 2.10) is perhaps the
fundamental discriminating feature. It determines the depth(s) at which salts precipitate and,
thus, the observance of major use requirements related, for instance, to the occurrence of
surface damage or salt deposition at the plaster/substrate interface.
In the present crystallization tests, all plasters behaved either as salt-accumulating or as
salt-transporting. Indeed, the salt-accumulation profiles in Tables 5.4 to 5.7 show that the salt
crystallizes always either in or on the plaster. Nonetheless, only Parlumière presented
constant salt-accumulation behaviour under different conditions:
- MEP and Parlumière both tended to behave like salt-accumulating plasters. Most salt
was concentrated either at the middle-thickness of the plaster (MEP) or close to the
plaster/substrate interface (Parlumière). The different penetration depth is probably
due to the fact that the two plasters have similar vapour transport properties (Fig. 5.8)
but Parlumière has lower capillarity suction (Fig. 5.5). Hence, the drying front, whose
depth depends on a balance between the liquid and vapour transport, tends to be
more deeply located in Parlumière.
- However, with NaCl, the painted MEP worked as a salt-transporting plaster.
- LNEC worked as salt-transporting or salt-accumulating plaster when applied on brick
or on lime mortar substrate, respectively.
Damage patterns
The damage patterns are also relevant. As stated by Schaffer (1932), the type of decay is
sometimes of even more significance than the decay rate. However, the damage patterns do
not have to be considered always because they are closely related to the accumulation
behaviour. Nonetheless, in some cases, they may allow a more detailed analysis of the
performance of plasters and renders. Indeed, although typical damage patterns exist for
each type of salt-accumulation behaviour, a given accumulation behaviour may give rise to

Behaviour of plasters and renders 123
different damage patterns. For example, salt-transporting plasters tend to develop surface
alterations (while salt-blocking plasters, for instance, are more likely to detach from their
substrate). But these surface alterations may be varied in nature: efflorescence may or may
not be accompanied by scaling, exfoliation, sanding or other.
The present crystallization experiments gave rise to different damage patterns, namely,
surface damage or cracking. There are two main types of cracks: (i) transversal cracks are
perpendicular to the central axis of the specimen; when they occur in the plaster, they
correspond to detachment of part or of the whole plaster layer; (ii) longitudinal cracks are
perpendicular to the plan of the plaster, that is, parallel to the central axis of the specimen;
they are usually visible on the surface of the plaster as peripheral or diagonal cracks.
Transversal cracking or surface damage (efflorescence, sanding of plaster or rupture of the
paint layer) are recurrently associated to salt-accumulating or salt-transporting behaviour,
respectively. Differently, longitudinal cracking seems to be associated with a specific type of
plaster (LNEC) rather than a certain salt-accumulation behaviour.
Durability
Durability is also a major feature, namely because of its economic significance. In fact, even
if the salt-accumulation behaviour and damage patterns are similar, damage may occur at
distinct rates. But, as stated by Knöfel et al. (1987), the test cycles in accelerated ageing
tests can not be correlated to a period of field exposure, hence, straightforward prediction of
the durability of building materials is not possible by means of these tests.
In the present experiments, the total amount of salt introduced after five wet/dry cycles is
quite similar in all cases (Table 5.8) and, therefore, it is not a distortion factor when the
durability of the various plasters is compared. However, comparing the durability of plasters
with different accumulation behaviour is not a straightforward purpose. It is not feasible to
base such a comparison on the intensity of damage because different damage patterns may
occur and, hence, it would be necessary to rank them in a, certainly controversial, order of
importance. It seems more reasonable to access the durability by considering the moment
when damage is first observed, the intensity of damage being regarded as a second order
factor. Still, two questions arise:
- Should surface alterations be considered as damage for salt-transporting plasters? To
answer this question, efflorescence has to be distinguished from material damage.
Indeed, it seems reasonable to disregard efflorescence as damage because transporting
plasters are expected to carry salt solutions to the surface and, moreover, efflorescence
can be removed. Yet, surface damage such as paint rupture or sanding has to be
considered because it represents irreversible material damage.
- What if a certain plaster, which was aimed at working as, for instance,
salt-accumulating, behaves as salt-transporting and, thus, shows efflorescence? In that
case, it is logical that efflorescence is regarded as damage. In fact,
salt-accumulating plasters are used mostly to avoid surface damage, for example, in
houses. Hence, efflorescence corresponds, in this case, to a corruption of the
fundamental working principle of the plaster.
Following this trend of thought, efflorescence was considered as damage for MEP and
Parlumière but not for LNEC plaster. In any case, a comparison of the absolute durability of
different plasters is hardly possible in the present experiments. Indeed, the durability of the
plasters changed significantly for different boundary conditions (salt, paint or substrate
material) as further discussed in sections 5.5.4.2 to 5.5.4.4.

124 Chapter 5
Total duration of the test
It is also interesting to compare the total duration of the test, that is, the period necessary to
achieve five complete wet/dry cycles (Tables 5.9 to 5.11).
Drying with pure water is, as expected, always faster than with the salt solutions. However,
different rankings arise for pure water and the salt solutions as regards the drying speed of
the different plaster/substrate systems. In fact, with pure water, the faster drying rate occurs
for transporting plaster LNEC on brick. In contrast, with the salt solutions, the test is shorter
for the plasters which tended to behave as salt-accumulating: MEP, Parlumière and LNEC
on lime mortar. This suggests that, although pure water may be used as (a rough) reference
for a certain material, it is not possible to compare the behaviour of different materials in
relation to salt crystallization by reference to pure water.
5.5.4.2 - Influence of the type of salt
The total amount of salt introduced after five contaminations is quite similar in all cases,
regardless of the type of salt (Table 5.8). This is in agreement with Hall and Hoff’s (2002)
statement that, in contrast to vapour transport, soluble salts do not significantly change liquid
transport in porous materials.
However, sodium sulfate crystallizes always at greater (or, at least, similar) depths than NaCl
(Tables 5.4 to 5.7). Even for the unpainted Parlumière, where both salts accumulated so
close to the plaster/substrate interface that no depth differences are noticed in the
salt-distribution profile, the transverse crack is closer to the substrate with Na2SO4 than NaCl
(Table 5.5). The lower vapour pressure of NaCl is a possible cause since, as discussed in
Chapter 4, it induces a more advanced position of the drying front. This difference can
probably account also for the change in salt-accumulation behaviour of painted MEP: it
worked as a transporting plaster with NaCl and as a salt-accumulating plaster with Na2SO4.
On the other hand, sodium chloride originates more localized (or, at least, similarly
concentrated) accumulation of salt than sodium sulfate. The detail provided by the slicing
technique is perhaps not great enough to allow, in some cases, for the observation of small
distribution differences. Indeed, no relevant differences are observed between the NaCl and
Na2SO4 distribution profiles of Parlumière (Table 5.5) or LNEC on lime mortar (Table 5.7).
For painted MEP (Table 5.4) a comparison is also not possible because the accumulation
behaviour was completely different with each salt. Nonetheless, a more localized deposition
of NaCl than of Na2SO4 visibly occurred for unpainted MEP (Table 5.4) and also, although
less clearly, for painted and unpainted LNEC on brick (Table 5.6). A more localized
accumulation of NaCl by comparison to Na2SO4 could explain why the maximum salt content
is, as seen in the distribution profiles (Tables 5.4 to 5.7), systematically higher for sodium
chloride (HMC=350%~30% NaCl by weight) than for sodium sulfate (HMC=60%~13%
Na2SO4 by weight).
It is not known whether the temperature cycles contribute for the more even distribution of
sodium sulfate. Indeed, the drying cycles have a 40ºC period (16 hours) and a 20ºC period (8
hours). Above 32.4ºC, thenardite is the only equilibrium phase of sodium sulfate. Therefore,
thenardite is the equilibrium phase at the end of each 40ºC period, when a new 20ºC period
starts. However, in contact with a sodium sulfate solution below 32.4ºC, mirabilite is always
the equilibrium phase (McMahon et al. 1992, for instance). This happens in the wet zones of

Behaviour of plasters and renders 125
the specimens during the 20ºC drying periods. Therefore at each transition from 40ºC to
20ºC, the equilibrium phase in solution varies from thenardite to mirabilite. Yet, the solubility
of thenardite is much higher than the solubility of mirabilite (Fig. 2.8). Therefore, temperature-
induced crystallization of mirabilite may readily follow each 40ºC-20ºC transition, regardless
of the position in the specimen, hence, not necessarily at the drying front.
Crystallization of mirabilite may also arise at the contact of the salt solution with pre-existing
crystals. Indeed, the stable equilibrium phase in the air at either of the drying conditions
(40ºC and 20% RH or 20ºC and 50%RH) is thenardite. Therefore, an increasingly significant
amount of crystalline thenardite is expected to be present in the pore system of the plaster
during each drying period, as the specimen becomes dryer. At the contact with the liquid
solution introduced by a new contamination, thenardite dissolves giving rise to a solution
which is highly supersaturated with respect to mirabilite. Hence, mirabilite can crystallize
readily. This sort of process was reported by Chatterji and Jensen (1989) and also, more
recently, by others (Tsui et al. 2003, for instance).
Unlike usual in crystallization tests, NaCl caused more severe damage than Na2SO4 in the
present experiments. This happened probably because NaCl tends to crystallize in a
narrower volume. Although higher crystallization pressures are often attributed to Na2SO4
(Rodriguez-Navarro and Doehne 1999 for instance), a higher pressure per unit volume may
thereby arise for NaCl. Indeed, as seen in Tables 5.4 to 5.7:
- In the case of salt-transporting behaviour, NaCl efflorescence is always accompanied
by material damage: rupture of paint layer for MEP and LNEC on brick; longitudinal
(peripheral) cracking and sanding of the plaster for unpainted LNEC on brick. In
contrast, Na2SO4 induced no surface damage other than efflorescence.
- In the case of salt-accumulating behaviour, cracking arises systematically with NaCl:
transverse cracks at the depth of major salt-accumulation occurred in MEP and
Parlumière; longitudinal (peripheral and diagonal) cracks arose on LNEC/lime-mortar.
Yet, with Na2SO4 damage was observed only in some of the salt-accumulating
plasters: Parlumière and one out of the three LNEC/lime-mortar specimens.
- Longitudinal (peripheral or diagonal) cracking occurred only for unpainted LNEC. But
also as regards this kind of damage NaCl was more harmful than Na2SO4. With NaCl,
all the specimens on both substrates cracked, that is, cracks occurred either in the
case of salt-transporting or salt-accumulating behaviour. With Na2SO4 only one of the
LNEC/lime-mortar specimens developed longitudinal cracks. None of the remaining
unpainted LNEC specimens, either on lime mortar or on brick substrate, cracked with
Na2SO4.
Another aspect of the higher damage capability that NaCl revealed in this set of tests is that
the overall durability of the plasters is lower or, at the best, similar with NaCl than with
Na2SO4. As seen in Tables 5.9 and 5.10, damage occurs always first with NaCl.
Yet, the difference between the two salts is not very significant when duration of the tests is
considered. A faster drying process was expected for Na2SO4 by comparison to NaCl
because the RHeqsat of Na2SO4 is higher than that of NaCl (Table 5.12). Yet, although in
some cases (MEP and LNEC on lime mortar) a somewhat shorter testing period indeed
arises for Na2SO4, in other cases (Parlumière and LNEC on brick) this period is similar for
both salts or slightly shorter for NaCl.

126 Chapter 5
Although salt deposition and cracking of the specimens can certainly influence the drying
rate, this unexpected drying behaviour is likely to arise also from the fact that, in these tests,
only the substrate was saturated. Hence, a slightly deeper location of the drying front for
Na2SO4 could, to some extent, compensate the influence of a higher vapour pressure on
vapour transport during drying.
Table 5.12 – Relative equilibrium humidity of aqueous NaCl or Na2SO4 solutions at 20ºC or 40ºC
Relative equilibrium humidity RHeq (%) Solution
At 20ºC At 40ºC
10%W (1.9 molal) 94.3 (1) 94.2
(6)
NaCl Saturated 75.5
(2) (6.1 m) 74.7
(2) (6.1 m)
10%W (0.8 molal) 97.5 (1) 97.4
(6)
Na2SO4 Saturated 95.6
(3) (5) (3.5 m) ≈ 86
(4) (3.3 m)
(1) at 25ºC, from Robinson and Stokes (2002)
(2) from Greenspan (1977)
(3) from Linnow et al. (2006)
(4) from Tsui et al. (2003); refers to thenardite
(5) refers to mirabilite
(6) from Reis (2006)
Indeed, as seen in the drying curves of Figs. 5.12 to 5.15, during the first cycles the drying
rate is in all cases very similar for pure water and for both salt solutions. The further
decrease in the drying rate probably arises more from the deposition of salt than from vapour
pressure differences. This agrees to the conclusion in Chapter 4 that the deposited salt
crystals play a major part in hindering drying. It is interesting that the drying rate of LNEC
plaster (on both substrates) decreases up to the 3rd cycle and then stabilizes or rises again.
In some cases this change clearly coincides with visible cracking of the specimens
(unpainted LNEC on brick and LNEC on lime mortar with NaCl). This does not happen for
LNEC on lime mortar with Na2SO4 where cracking is observed only in one specimen (Table
5.7) and, yet, the drying rate is similar for the three specimens. Therefore, the reasons for the
further rise or stabilization of the drying rate are not totally clear. One possibility is the
occurrence of micro-cracks in the two other LNEC/lime-mortar specimens, which were not
detected by visual observation.
5.5.4.3 - Influence of the paint
Tables 5.4 to 5.7 and Figs. 5.12 to 5.14 show that the drying rate in the first cycles, before
cracking was observed, is in general slightly lower for the painted specimens, both in the
case of pure water and the salt solutions.
It is interesting that for MEP and Parlumière, which have similar vapour permeability
(Fig. 5.8), the use of paint induces a similar increase in the duration of the tests with pure
water from 9 to 13 or 14 weeks (Table 5.11). LNEC’s vapour permeability is higher but the
drying rate decreased less in the presence of the paint (5 to 9 weeks). This could suggest
that the conclusion of Hern and Snethlage (1992) that the more vapour permeable a stone,
the higher the resistance to vapour transport induced by certain paint, was not verified here.

Behaviour of plasters and renders 127
However, such direct comparison can probably not be made because LNEC dries
fundamentally by surface evaporation while for Parlumière and MEP the drying front is
located inside the plaster.
With NaCl, the paint changed the salt-accumulating MEP into a salt-transporting plaster. In
contrast, no significant (Parlumière) or no visible (MEP with Na2SO4 and LNEC) alteration of
the accumulation behaviour arose for the other plasters through the use of paint. If for MEP
with Na2SO4 or LNEC it is not impossible that some minor differences were masked by an
insufficient detail provided by the slicing method, for Parlumière it is clear that the transverse
cracks occurred at similar depths with and without paint.
These differences are not easy to interpret without the help of a proper numerical model or of
an efficient monitoring technique such as MRI. Drying, especially in the presence of salt, is a
complex dynamic process where liquid transport also plays a role. Moreover, the cracks,
which may only be detected at advanced stages, may hinder liquid moisture transport or
enhance evaporation.
Nonetheless, a general conclusion is possible: a paint may in certain conditions transform a
salt-accumulating plaster into a salt-transporting plaster, although this will not necessarily
happen for all plasters or salts.
When damage arose for a certain plaster, the use of paint speeded up its occurrence. It
happened for MEP, Parlumière and LNEC on brick with NaCl. The paint caused a poorer
performance of the salt-accumulating plasters MEP (that changed into salt-transporting) and
Parlumière (whose transverse cracks probably arose earlier since efflorescence on that area
was first observed on the painted specimen). But salt-transporting plaster LNEC on brick
may be a different case. Indeed, although NaCl damage arose earlier on the painted
specimens, it was less severe (efflorescence and further rupture of the paint layer) than on
the unpainted specimens (longitudinal cracking).
5.5.4.4 - Influence of the substrate material
It is clear that the substrate material can greatly affect the behaviour of a plaster in relation to
salt crystallization. Indeed, despite the fact that five wet/dry cycles were performed and
similar amounts of salt were introduced in each case, LNEC behaved as a salt-transporting
plaster when applied on brick substrate (Table 5.6) and as a salt-accumulating plaster when
applied on lime mortar substrate (Table 5.7).
As regards durability and damage patterns, LNEC seems to have an overall tendency for
cracking, as discussed above. Nonetheless, cracking is more severe in the case of lime
mortar substrate: for NaCl, cracking arose first and was more intense on lime mortar
substrate; for Na2SO4, one of the specimens with lime mortar substrate cracked but none of
those with brick substrate did.
The reasons for this different behaviour will be discussed in section 5.10.2 considering also
results obtained in further sets of tests.

128 Chapter 5
5.5.4.5 - Test method
There is no doubt that the present crystallization tests were shorter than those reported by
van Hees and Brocken (2004). Here, a maximum duration of 17 to 35 weeks was achieved
for the different plasters in contrast to the 12 to 48 months in that research. However, even
17 weeks is not a short period. It can be acceptable perhaps for long-term research studies
but hardly when plasters are evaluated in support of consultancy or product development
studies.
A second important question that arises on the test method concerns the definition of its end
point. In the present experiments every specimen was subjected to five wet/dry cycles, which
allowed carrying out of sustained comparisons between materials with similar amounts of
salt. Yet, cracks arose in some specimens. Hence evaporation could have been enabled
(Vergès-Belmin et al. 2005), namely lateral evaporation through transverse cracks that
eventually broke the epoxy sealing, or liquid transport hindered by those cracks. The
significance of these effects as regards test representativity is difficult to evaluate. Yet,
although it is possible that cracks occur before being visible, it seems reasonable in future
tests to slice one specimen of each kind at the first observation of damage. Furthermore,
because damage represents a failure condition, it may be useful to know the associated salt
distribution.
Another relevant concerns the slicing technique. In most cases, a sawing machine was used
which originated a loss of material correspondent to a thickness of around 2 to 3 mm per cut.
Although a discrete salt distribution can be perfectly acceptable, it must be kept in mind that
a significant percentage of salt is lost by this technique. Therefore, quantitative comparisons
should be made cautiously especially because some salts, such as NaCl, may deposit in a
relatively narrow band. In extreme situations, which were not the case here as seen in the
distribution profiles in Tables 5.4 to 5.7, most salt may even be lost. Therefore, whenever
possible, sampling techniques that do not involve material loss should be used. Such a
technique was used here on the traditional mortars. These mortars were divided by manual
sandpapering which, however, is a technique that requires too much time and effort to be
practicable in large groups of specimens (here, the 50 specimens tested in total originated
almost 400 samples).
Finally, the HMC method by means of which the distribution profiles were obtained could
have provided inaccurate results in the case of sodium sulfate, as it happened in some of the
experiments described in Chapter 3. Indeed, the set-point RH was here also of 95%, hence,
below 95.6%, the newly proposed value for the deliquescence RH of mirabilite at 20ºC
(Linnow et al. 2006) which the experiments presented in section 3.5.4.5 corroborate.
Therefore, the HMC values obtained in the present set of tests were carefully considered. It
was found that the distribution profiles were very coherent among the various sulfate-loaded
specimens and between these and the chloride-loaded specimens, both in terms of
distribution and maximum HMC values. It is therefore likely that the actual RH in the chamber
was somewhat above 95.6% during these HMC measurements.
In this case no control-samples were used to monitor the environmental conditions in the
chamber because the conclusions of the HMC experiments presented in Chapter 3 had not
yet been achieved at the time these crystallization tests were performed.

Behaviour of plasters and renders 129
5.6 Drying of a salt-accumulating plaster (set 2)
5.6.1 - Introduction
This section presents several MRI-monitored drying experiments performed on MEP/brick
specimens loaded with NaCl or Na2SO4. Unpainted MEP on brick substrate was used
because it behaved as an accumulating plaster in set 1 crystallization tests. Indeed, salt-
accumulating plasters are of high practical interest. Hence, further insight into their behaviour
will hopefully contribute to enabling the development of increasingly effective products.
Parlumière also worked as a salt-accumulating plaster but the salt accumulated very close to
the plaster substrate interface, approaching somewhat the behaviour of a salt-blocking
plaster. In contrast, in MEP, the salt penetrated up to the middle-thickness of the plaster.
Moreover, very clear differences between the behaviour with NaCl and Na2SO4 were
observed in unpainted MEP: NaCl accumulated in a narrow band and caused transverse
cracking of the plaster; in contrast, Na2SO4 was more evenly distributed between the
plaster/substrate interface and the middle-thickness of the plaster and caused no visible
damage.
Drying experiments where only the substrate was contaminated, as well as experiments on
saturated specimens, were carried out. The main objectives of this research were the
following:
- understanding liquid migration features underlying the accumulation behaviour of
MEP plaster;
- comparing the behaviour of this plaster when only the substrate is contaminated to
that arising in the case of capillary saturation of the whole plaster/substrate specimen.
5.6.2 - Materials and methods
The drying experiments were performed on MEP/brick specimens filled with pure water,
1.9 molal (10%W) NaCl solution or 0.8 molal (10%W) Na2SO4 solution.
For pure water and NaCl two different contamination conditions were used: (i) capillary
saturation of the whole specimen by total immersion during an overnight; (ii) contamination of
the substrate only, by maintaining the bottom 5 mm of the brick immersed in the solution, for
some minutes, until the wet fringe attained the brick/plaster interface. For Na2SO4 only
contamination condition (ii) was used.
The 1D MRI technique used to monitor these experiments (Annex I) provides profiles that
express the concentration, in arbitrary units (a.u.), of the H+ ion over the length of the
specimen (Fig. I.4). Each profile corresponds to a different moment of drying, hence, the
different profiles obtained within one drying experiment represent the evolution over time of
the moisture content across the specimen.

130 Chapter 5
The experiments were carried out on cylindrical specimens (Fig. I.2) drilled from prismatic
specimens similar to those of set 1 crystallization tests (Fig. 5.10). The specimens were
bottom and laterally sealed during drying to ensure unidirectional migration of moisture.
Drying proceeded under airflow at 0%RH (temperature ≈ 18ºC). In all the experiments:
(i) a first profile was obtained before the airflow was turned on; (ii) the airflow was turned on
30 minutes before the second profile was obtained.
At the end of the experiments, the specimens were oven dried at 40ºC. The salt distribution
was then measured across specimens MEP 1 and MEP 2, the ones where only the substrate
was filled with sodium sulfate or sodium chloride solution, respectively. The salt distribution
profiles of MEP 2 have to be carefully considered because a second experiment, performed
under similar conditions but using a more concentrated (4 molal) NaCl solution, was carried
out on this specimen. This second experiment, which is not presented because it was very
short and not conclusive, was performed for figuring out whether an acceptable definition of
the Na+ ion could be achieved for MEP plaster (which did not occur).
In order to obtain the salt-distribution profiles, the specimens were divided at indents of
typically 5 mm by means of progressive sandpapering. Afterwards, the salt content in each of
the obtained samples was measured. First, HMC tests were performed in a climatic chamber
set pointed at 20ºC and 95% RH, using Petri-dishes. Coherent HMC profiles resulted for
NaCl but the samples contaminated with Na2SO4 achieved only the HMC of each base
material (around 5% or 3% for the mortar and the brick, respectively). Control samples of
pure NaCl, tested simultaneously, achieved a HMC of around 740% which corresponds to an
RH of 92% at 20ºC. This indicates that the actual RH in the chamber was far below the
RHeqsat of mirabilite (95.6%) which could not thus deliquesce. Yet, this actual RH was well
above the RHeqsat of thenardite (87%) and no hydration took place either, which indicates a
metastable behaviour of sodium sulfate in this case. The salt content in the same samples
was then measured (Esteves and Catarino 2006) by ion chromatography (IC). IC was
feasible in this case due to the reduced number of samples. It is interesting to see (Fig. 5.17)
that a very good correlation HMC / ion content resulted for NaCl, despite the slightly different
HMC of the two base materials involved.
sodium chloride
y = 13.3x + 1.7
R2 = 0.9979
0
20
40
60
80
0.0 1.0 2.0 3.0 4.0 5.0
Ion content: Cl- or SO42- (%)
HMC 20ºC
92%RH (%)
MEP2 - NaCl MEP1 - Na2SO4
Fig. 5.17 – Correlation HMC / ion content (the light and dark green
points correspond to brick and mortar samples, respectively)

Behaviour of plasters and renders 131
5.6.3 - Results
The results of the five drying experiments on saturated or partially saturated specimens are
shown in Figs. 5.18 and 5.20, respectively. Each profile in these graphs is assigned to a time
value that corresponds to the moment when the profile began being measured. The initial
profile (red dashed line) is that obtained before the airflow was turned on. The 0h profile (red
continuous line) is the first profile measured after the airflow being turned on. The first 20h of
drying are always represented by profiles (black lines) at intervals of 2h. The subsequent
drying period is illustrated with profiles (blue lines) at intervals of 10h. The last profile
obtained in each experiment is depicted in pink. The top face of the plaster, through which
drying took place, is located on the left part of the profiles.
The physical limits of the test specimens are not straightforward to identify in the NMR
profiles. First, there is an uncertainty associated to the resolution at which the measurements
were carried out (1 or 2 mm). Also, the bottom surface is not perfectly orthogonal, which may
explain the progressive lowering on the measured values towards the edge of the three
specimens in Fig. 5.20. Artifacts that consist in the further rise of the NMR signal values are
observed near the bottom surface of the specimens in Fig. 5.20 b and c. They probably
correspond to some water that was trapped in the Teflon sealing, which is consistent with the
fact that the signal peak remained constant throughout the experiments. A similar effect
could explain the signal peak visible in Fig. 5.18 a) at the 50 mm. Yet, in this case, the water
was probably trapped next to the substrate material.
The top edges of the three partially saturated specimens in Fig. 5.20 are indistinct because
the liquid penetrated only up to around the half thickness of the plaster and, hence, flat NMR
profiles are obtained for the top part of the plaster. Nevertheless, the physical limits of these
three specimens could be identified (they correspond to the grey vertical line segments) on
the basis of a careful measurement of their dimensions. This was not possible for MEP5
specimen in Fig. 5.18 due to operational limitations (the last NMR measurements with NaCl
solution were completed after the author’s stay at TUE had finished). The possible location of
the edges of this specimen is identified by the grey shadow areas in the figure.
The drying curves in Figs. 5.19 and 5.21 show the evolution over time of the total amount of
liquid in the specimens. The total amount of water present at each moment corresponds to
the area below the corresponding MRI profile. The drying rate is the slope of the drying
curve.
Figs. 5.22 to 5.24 concern the liquid flux and evaporation flux to and from the drying front,
respectively, during drying of the partially saturated specimens (Fig. 5.20). The liquid flux
was assumed to correspond to the decrease in the moisture content of the brick substrate.
Hence, it was calculated by considering the difference between the areas (within the brick)
below two consecutive MRI profiles and, then, dividing it by the corresponding time interval.
The evaporation flux was obtained in a similar way but considering the total area (within the
whole specimen) below two consecutive profiles.

132 Chapter 5
In the drying curves and flux graphs, time zero corresponds to the first profile obtained after
the air flow was turned on. The profile obtained before the airflow was turned on
corresponds, hence, to a negative time value.
In Figs. 5.25 and 5.26 the salt distribution profiles of the partially saturated specimens
obtained by IC are presented. Additional IC measurements carried out on the non-
contaminated materials indicate that MEP plaster contains a certain amount of sulfate. The
sulfate content in the non-contaminated materials is represented by the dashed line in Fig.
5.26.
0
0.2
0.4
0.6
0.8
1
0 10 20 30 40 50 60
Position (mm)
Concentration H
+ (a.u.)
initial 0h 40h
2h in 2h 20h 10h in 10h
Brick
Plaster
a) MEP5 - water (duration 40 hours)
0
0.2
0.4
0.6
0.8
1
0 10 20 30 40 50 60
Position (mm)
Concentratio
n H
+ (a.u.)
initial 0h 2h in 2h
20h 10h in 10h 160h
Brick
Plaster
b) MEP5 – NaCl solution (duration 160 hours)
Fig. 5.18 - Results of the MRI-monitored drying experiments on fully saturated specimens
y = -1.8x + 38.2
R2 = 0.9812
y = -0.5x + 41.8
R2 = 0.9666
0
10
20
30
40
50
-20 0 20 40 60 80 100 120 140 160
Time (h)
Total amount of water (a.u.)
water
NaCl
Fig. 5.19 - Drying curves: total amount of water in the saturated specimens

Behaviour of plasters and renders 133
0
0.2
0.4
0.6
0.8
1
0 10 20 30 40 50 60
Position (mm)
Concentration H
+ (a.u.)
initial 0h 2h in 2h 20h
Brick
Plaster
a) MEP6 - water (duration 20 hours)
0
0.2
0.4
0.6
0.8
1
0 10 20 30 40 50 60
Position (mm)
Concentratio
n H
+ (a.u.)
initial 0h 2h in 2h
20h 10h in 10h 60h
Brick
Plaster
b) MEP2 - NaCl solution (duration 60 hours)
0
0.2
0.4
0.6
0.8
1
0 10 20 30 40 50 60
Position (mm)
Concentratio
n H
+ (a.u.)
initial 0h 2h in 2h
20h 30h
Brick
Plaster
c) MEP1 - Na2SO4 solution (duration 30 hours)
Fig. 5.20 - Results of the MRI-monitored drying experiments on partially saturated specimens
y = -0.25x + 21.14
R2 = 0.9808
y = -0.15x + 15.44
R2 = 0.9861
y = -0.12x + 14.39
R2 = 0.997
0
5
10
15
20
25
-12 0 12 24 36 48 60
Time (h)
Total amount of water (a.u.) NaCl Na2SO4 water
Fig. 5.21 - Drying curves: total amount of water
in the partially saturated specimens
-0.2
0.0
0.2
0.4
0.6
0.8
1.0
1.2
1.4
1.6
-12 0 12 24 36 48 60
Time (h)
Liquid flux - evaporation flux (a.u. / h)
NaCl
Na2SO4
water
Fig. 5.22 - Difference between evaporation and
liquid fluxes in the partially saturated specimens
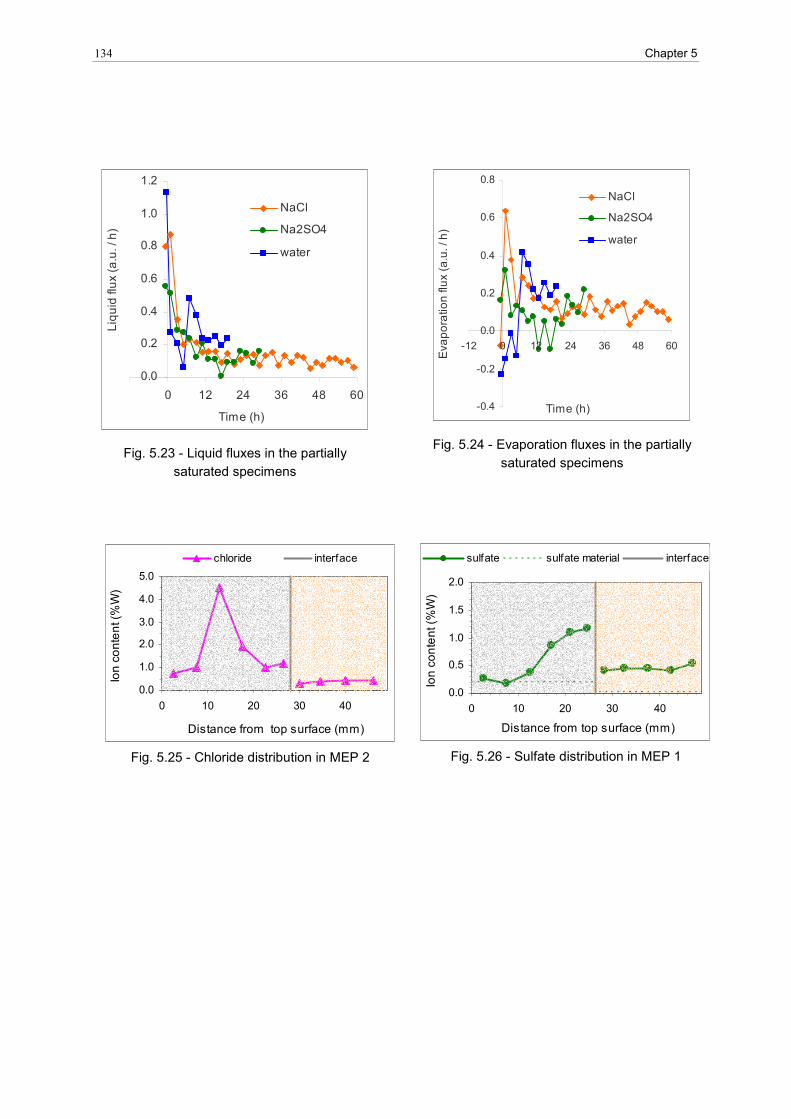
134 Chapter 5
0.0
0.2
0.4
0.6
0.8
1.0
1.2
-12 0 12 24 36 48 60
Time (h)
Liquid flux (a.u. / h)
NaCl
Na2SO4
water
Fig. 5.23 - Liquid fluxes in the partially
saturated specimens
-0.4
-0.2
0.0
0.2
0.4
0.6
0.8
-12 0 12 24 36 48 60
Time (h)
Evaporation flux (a.u. / h)
NaCl
Na2SO4
water
Fig. 5.24 - Evaporation fluxes in the partially
saturated specimens
0.0
1.0
2.0
3.0
4.0
5.0
0 10 20 30 40
Distance from top surface (mm)
Ion content (%
W)
chloride interface
Fig. 5.25 - Chloride distribution in MEP 2
0.0
0.5
1.0
1.5
2.0
0 10 20 30 40
Distance from top surface (mm)
Ion content (%
W)
sulfate sulfate material interface
Fig. 5.26 - Sulfate distribution in MEP 1

Behaviour of plasters and renders 135
5.6.4 - Discussion on set 2
5.6.4.1 - Totally saturated specimens
The results of the drying experiments on totally saturated specimens are shown in Fig. 5.18.
For both pure water and the NaCl solution, MEP behaved as a transporting plaster, most of
the water being eliminated by surface evaporation. The clear differences that arise between
drying in the presence of pure water or of the salt solution are similar to those observed in
the experiments of Chapter 4:
- Drying is much faster with pure water: approximately 70% of the water evaporates
after 40h of drying while, for the salt solution, around 65% evaporates after 160h.
- Stage I is shorter for pure water. In this case, the surface starts almost immediately
drying faster. The drying front recedes completely into the material after around 20h.
In contrast, for NaCl, evaporation is still proceeding at the surface after 160h and no
signs of a transition from Stage I to Stage II are visible yet, though the moisture
content in the plaster is already far bellow that at which stage II begins for pure water.
- For pure water, a lower amount of moisture is eliminated by surface evaporation. In
this case, approximately 60% of the water is eliminated at the surface, while for NaCl
about 65% had already evaporated at the surface when, after 160 h, stage I is still
apparently far from ending.
The moisture content decreases at a faster rate in the brick than in the plaster during almost
the whole experiments. This indicates that the capillary suction of a significant percentage of
the pores in the plaster is higher than the capillary suction of the pores in the brick (it is not
reasonable to correlate capillary suction and pore size because the plaster includes
hydrophobic additives). The drying rate of the brick becomes lower than that of the plaster in
the last hours of the experiments. Yet, at the end of these experiments, approximately 70%
(pure water) or 80% (NaCl) of the water initially present already left the brick. Hence, it is
possible that, over a longer period, practically all the solution in the brick would have
migrated to the plaster as liquid.
5.6.4.2 - Partially saturated specimens
The MRI profiles in Fig. 5.20 show that absorption and drying occur simultaneously during
the drying experiments where only the substrate was contaminated:
a) Initially, the solution is mostly in the substrate. In all specimens, high and reasonably
uniform moisture content exists in the brick at this moment. This initial moisture content is
lower for the salt solutions than for pure water, largely because part of a salt solution is
not water. Between the two salt solutions, the initial moisture content is lower for Na2SO4
than for NaCl, which is probably due to the contamination procedure being only roughly
accurate. Material heterogeneity among the several specimens could also account, to
some extent, for these differences. But the initial moisture content in the brick is lower in
the partially saturated specimens than in the totally saturated specimen (Fig. 5.18). This
suggests that not all the pores in the brick were filled when the wet front reached the
plaster/substrate interface of the partially saturated specimens.

136 Chapter 5
b) Evaporation takes place on the wet front which, in the beginning, is located more or less
at the plaster/brick interface as shown by the initial profiles (red dashed curves).
c) Immediately after the brick is contaminated, the plaster starts sucking the liquid. Hence,
the moisture content in the brick begins decreasing. It is interesting to note that the water
content in the plaster is, next to the interface, approximately constant in the course of the
experiments. This suggests that MEP pores involved in drawing water from the brick are
always the same.
d) The total moisture content in the specimens decreases as evaporation proceeds.
However, the MRI technique does not seem to provide acceptable quantitative values for
the early hours of the absorption/drying process. It can be seen, for instance in Fig. 5.21,
that very low or even negative drying rates are measured at the beginning of the
experiments. Yet, it is not likely that a very low evaporation rate exists precisely when the
moisture content at the drying front is higher. Furthermore, negative rates would mean
that the specimen was absorbing moisture which is not possible at 0% RH. In fact, those
occurrences correspond to an experimental error. The key point is that the measurement
of one profile takes 0.5 or 1.5 h (in the case of pure water or salt solutions, respectively).
This is acceptable when only vapour fluxes are involved, as seen in the previous
experiments on totally saturated specimens because the moisture content varies much
more slowly. However, in the partially saturated specimens there is a simultaneous
absorption process going on. A high amount of liquid is moving from the brick to the
plaster while profiles are being measured by indents in the reverse direction. Hence,
there is always a significant amount of moisture that is not detected: it has not reached
the upper part of the specimen when this part is being measured and has already left the
lower part when, later, measurements begin on this other part. Thus, total moisture
contents lower than the actual ones result. The error seems to be higher for pure water
than for NaCl and higher for NaCl than for Na2SO4. This is logical because the higher the
initial moisture content in the brick the higher the liquid flux, thus, the higher the error.
This error affects also the flux graphs in Figs. 5.22 to 5.24.
e) The wet front progresses in the plaster and eventually stabilizes several millimetres away
from the outer surface, as seen in Fig. 5.20. Up to the end of the experiments no further
movement of the front is observed, neither forwards or backwards.
At this point, a few questions arise. Why does the wet front stabilize? Why does it not recede
with decrease in the total moisture content in the specimen? For example, in the case of
NaCl which was the longer experiment, Fig. 5.20b shows that practically no movement arises
from the 15h to the 60h (when the test ended) despite 30% of the total amount of water
initially present having evaporated during that period.
What happens is probably the following. At the beginning of the drying experiments, the wet
front is coincident with the plaster-substrate interface. There is a very steep gradient of the
capillary potential because the plaster is dry immediately ahead of the interface. As indicated
by Eq. 5.2, a very high liquid flux u arises and, so, the wet front moves rapidly into the
plaster.
The wet front is not a sharp front but a diffuse front of width e, as seen in Fig. 5.20 and
represented in Fig. 5.27. This happens probably due to the large range of pore sizes in MEP
plaster (Fig. 5.7) and also to the presence of hydrophobic additives. It is likely that, for these

Behaviour of plasters and renders 137
reasons, MEP plaster possesses several families of pores through which water migrates at
different velocities. The capillary absorption tests are consistent with this hypothesis: in
contrast to a common material such as brick, the absorption curve of MEP (Fig. 5.5) includes
several line segments with distinct inclinations that indicate distinct water migration kinetics
(Mertz 1991).
e
Fig. 5.27 – Representation of liquid migration in MEP plaster
Evaporation occurs in the diffuse wet front. It is interesting that, probably because of the
combined effects of evaporation and differential liquid migration in the pores of MEP plaster,
there is not exactly an advancement of the wet front, but rather an extension. It is also
interesting that the moisture content in the plaster varies almost linearly across the diffuse
front (Fig. 5.20).
The liquid flux decreases (Fig. 5.23), as the width of the wet front increases, due to lowering
of the capillary potential gradient (Eq. 5.1). The vapour flux tends to increase as the wet front
approaches the surface and, oppositely, to decrease with the lower availability of liquid at the
wet front. It is not known how much the deposited salt crystals contribute to lowering the
evaporation rate. The result of these opposed tendencies is probably an overall reduction of
the vapour flux, as roughly suggested by Fig. 5.24. Yet, reduction of the vapour flux is lower
than that of the liquid flux (Fig. 5.22). Eventually, the two fluxes meet in value and, so, the
wet front stabilizes (Fig. 5.22). Up to the end of the three experiments, no further movement
of the front is observed.
This steady state would be broken only by a decrease in the capillary potential next to the
interface. This could occur if the moisture content in the brick decreased to a point where
some of the pores in the plaster were no longer able to draw water from the brick. In the case
of both pure water and Na2SO4 the test was too short for that. However, for NaCl, a very
small decrease in the moisture content in the plaster is observed at the interface from the
18h onwards (Fig. 5.20b). And, yet, not even a slight receding of the drying front was
observed.
This happens probably because advancement of the drying front corresponds to wetting of
the plaster, while receding of that front corresponds to drying. Due to the hysteretic nature of
absorption and drying processes (Fig. 5.4), at a given moisture content, the capillary
potential is higher for drying than for wetting. Hence, the moisture content at the interface
had to decrease further to account for that difference. Backwards movement of the drying
front in this kind of processes is probably also limited by reduction of the vapour flux, due
both to the further increase in the path length to the surface and to a decrease in the liquid
flux.

138 Chapter 5
None of the specimens in the present experiments ever attained the phase at which the
drying front recedes: constant liquid (Fig. 5.18) and vapour (Fig. 5.24) fluxes were measured
during the last period up to the end of the experiment.
Nevertheless, the considerations above suggest that a strong absorption/drying hysteresis
can account for a longer stability of the drying front, thus, for a lower risk of salt being
deposited on or in the substrate as a result of diminishment of the liquid flux.
It is interesting that stabilization of the drying front occurred at very similar depths in all the
partially saturated specimens, as suggested by the profiles in Fig. 5.20. This is consistent
with the low influence of soluble salts, at least up to the present concentrations, on liquid
transport (Hall and Hoff 2002). Indeed the liquid flux determines the progression of the front
during the early moments, as discussed above.
The drying rate (Fig. 5.21) is somewhat lower for NaCl than for Na2SO4 and for Na2SO4 than
for pure water. These differences are consistent with the slightly different RHeq of the three
liquids, when either the original (10%W) or saturated salt solutions are considered (Table
5.12).
What was not fully expected in these drying rates is that they were practically constant over
long periods in the experiments with salt solutions. Indeed, when the drying font is stable, if
both the increase in the concentration of salt solutions and salt deposition lower the
evaporation rate, the drying rate is expected to progressively decrease. Hence, there is not a
clear explanation for these constant drying rates which shows the need for further research
on the influence of salt crystals on porous material drying.
The final salt distribution profiles are shown in Figs. 5.25 and 5.26. These profiles have to be
carefully considered because several possible error factors exist:
- Firstly, the specimens still contained a significant amount of solution at the end of the
drying experiments. Therefore, part of the salt crystallized during the subsequent
oven drying at 60ºC. Such very fast drying is expected to cause a higher amount of
salt to be dispersed all over the pore network, as discussed in Chapter 4. This is
compatible with the fact that salt was deposited in the brick, despite the wet front
being always in the plaster during the drying experiments. Indeed, in both specimens,
the salt was quite evenly distributed in the brick, which agrees with the homogenous
moisture distribution that existed in this material at the end of the drying experiments.
- Secondly, the specimens were divided only after several months. Therefore, further
migration of salt might have arisen if some residual amount of moisture remained in
the specimens or was attracted by hygroscopicity. Liquid transport towards the outer
surface or diffusive (liquid or ion) homogenization processes might have occurred in
this case. That could explain why some salt was found in the surface layers of the two
specimens despite, in the drying experiments, the wet front never having reached
those advanced positions.

Behaviour of plasters and renders 139
- Thirdly, MEP 2 specimen was subjected, as explained in section 5.6.2, to a second
contamination with a more concentrated NaCl solution. The higher salt load accounts
therefore for the much higher ion content in the NaCl loaded specimen (Fig. 5.25).
- Finally, the sulfate content in MEP plaster may have influenced the salt distribution in
Fig 5.26.
Despite these interferences, clear differences arose between the distributions of the two
salts: NaCl deposited predominantly at the middle-thickness of the plaster while Na2SO4
precipitated mostly next to the interface with the substrate. These distinct deposition
patterns, which are similar to those achieved in set 1 crystallization tests, can be due to
solubility differences between NaCl and Na2SO4:
- At 20ºC, sodium chloride has only one crystal phase (halite), which readily crystallizes
from solution at 6 molal (Fig. 2.6). At the same temperature, sodium sulfate can
precipitate from solution in two different crystal phases, the decahydrate mirabilite or
the metastable heptahydrate, whose maximum solubility is 1.7 molal and 3.15 molal,
respectively (Fig. 2.8).
- At 40ºC, the solubility of the equilibrium crystal phase of sodium sulfate (thenardite) is
of around 3.5 molal, hence, lower than the solubility of halite which is approximately
6 molal also at this temperature.
Because evaporation occurs all over the (diffuse) drying front in the partially saturated
specimens, the solutions become more concentrated as they migrate across the width e of
this front (Fig. 5.27). Since, at 20ºC, the solubility of sodium sulfate is lower than that of
sodium chloride (Figs. 2.6 and 2.8), sodium sulfate can precipitate earlier in the drying front,
hence, deeper in the specimen, as it happened in the present experiments (Figs. 5.25 and
5.26).
It is likely that also in set 1 crystallization tests a diffuse rather than a sharp front arouse
during drying for MEP and possibly also for Parlumière and LNEC plasters. Hence, apart
from the hypothesis put forward in section 5.5.4.2 that concern crystallization due to
temperature changes or to contact between the salt solution and thenardite crystals,
solubility differences among NaCl and Na2SO4 can also account for the more even and
deeper deposition of the last:
- Sodium sulfate can, as stated, precipitate earlier in the wet front because the
solubility of any of its possible crystal phases is significantly lower than that of halite
both at 20ºC and at 40ºC.
- Sodium sulfate can crystallize from a wider range of concentrations than sodium
chloride because it has two possible crystal phases and can easily supersaturate.
Therefore, it may deposit at different points across the drying front. In contrast,
sodium chloride has only one crystal phase and a low tendency to supersaturate.
Hence, it will deposit in a more limited area.

140 Chapter 5
5.7 Influence of a paint on drying (set 3)
5.7.1 - Introduction
MRI-monitored drying experiments were performed on painted or unpainted stone
specimens. The main objective of those experiments was to evaluate the influence that
paints may have on drying and, thus, on evaporative salt deposition processes.
5.7.2 - Materials and methods
The drying experiments were performed on two stone D specimens, one of which was
painted with a commercial acrylic emulsion paint (Table 5.1). The experiments were
monitored by means of the 2D MRI technique described in Annex I.
The specimens had flat dimensions of 20 mm x 30 mm and a thickness of 20 mm. The
acrylic paint was composed of two coats which were applied with a 24 h interval.
Immediately before the experiments the specimens were lead to capillary saturation by total
immersion in pure water for one hour. Afterwards, their lateral and bottom faces were sealed
with Parafilm® plastic film. The specimens were then assembled together with Teflon tape
(Fig. 5.28). This allowed the drying experiments to be performed simultaneously in both
specimens.
Drying was carried out under airflow at 0%RH (temperature ≈ 18ºC). In all the experiments:
(i) an initial image was obtained before the airflow was turned on; (ii) the airflow was turned
on immediately before the second image started being measured.
Cross-section
NP
D1P
Cross-section
P
D2
Paint
Sealing
Fig. 5.28 - Representation of the specimen assemblage
(side-view) and cross-sections of interest
5.7.3 - Results
The results of the drying experiments are presented in the four figures below. They include a
selected series of MRI snapshots (Fig. 5.29), 1D profiles (Fig. 5.30) at the two cross-sections
indicated in Fig. 5.28 and the overall drying curves (Fig. 5.31). Each point on a drying curve
corresponds to the sum of all values obtained across the specimen in the respective 1D
profile.
D2

Behaviour of plasters and renders 141
D1P (painted)
0
0.2
0.4
0.6
0.8
1
2 6 10 14 18 22 26
Position (mm)
Concentr. H+ (a.u.)
initial 0h 1h in 1h
2h in 2h 20h
D2 (non-painted)
0
0.2
0.4
0.6
0.8
1
2 6 10 14 18 22 26
Position (mm)
Concentr. H+ (a.u.)
initial 0h 1h in 1h
2h in 2h 20h
Fig. 5.30 - One-dimensional profiles at cross-
sections NP (above) and P (below) indicated in
Fig. 5.28. The grey vertical lines represent the
physical limits of the specimens (the drying
surface corresponds to the segment on the left).
The green lines indicate the maximum
penetration of the drying front in the material.
0
kg/m3
110
kg/m 3
initial
0 h
1 h
2 h
4 h
8 h
20 h
D2 D1P
Fig. 5.29 - MRI snapshots of specimens
D2 and D1P during drying with pure water
0
50
100
150
200
250
-3 0 3 6 9 12 15 18 21 24
Time (h)
Total a
mount of water (a.u.)
D2: Non-painted
D1P: Painted
Fig. 5.31 - Drying curves. The shadow areas
indicate the instants when, as seen in Fig. 5.30,
the drying front could have receded totally into the
material.

142 Chapter 5
5.7.4 - Discussion on set 3
Both specimens go through a multistage drying process. During Stage I, the drying front is
located at the outer surface (Fig. 5.29), the distribution of moisture is reasonably
homogenous throughout the specimens (Fig. 5.30) and the drying rate is mostly constant
(Fig. 5.31). Transition to Stage II begins when the moisture content starts decreasing faster
at the outer surface than inside the specimens (Figs. 5.29 and 5.30). Stage II starts when the
surface layer is totally dry and, hence, the drying front begins receding into the specimen
(Figs. 5.29 and 5.30).
The main difference between the two specimens is that, as expected, the unpainted
specimen dries faster. The difference is particularly significant during drying stage I, when a
clearly lower drying rate occurs for the painted than for the unpainted specimen (Figs. 5.30
and 5.31). As a consequence, the drying front recedes earlier into the unpainted specimen
(Fig. 5.29) and, hence: (i) the surface of the painted specimen stays wet longer; (ii) a higher
amount of moisture is eliminated by surface evaporation on the painted specimen.
Reduction of the evaporation rate is likely to be due to the paint reducing the ESE (effective
surface of evaporation) on the specimen. This arises probably because the paint blocks part
of the surface pores of the stone. However, it is also possible that the water/paint contact
angle is lower than the water/mortar contact angle. Therefore, a lower curvature of the
menisci at the surface could have also contributed to reducing the ESE, as discussed in
section 4.5.4. This kind of effect was suggested by Rousset-Tournier (2001) to explain why
Stage I drying rate was higher for saturated stones than for a free water surface.
Another interesting observation is that, also here, the drying front is not a sharp front. Indeed,
Fig. 5.30 shows that the surface layer starts very early on loosing moisture faster than the
rest of the specimen, despite the drying front only receding completely into the material some
hours later. As seen in Figs. 5.29 and 5.30, the surface begins drying faster in less than 1h
(unpainted specimen) or after around 2h (painted specimen) but the front only recedes
completely into the material after 2h up to around 4h or after 8h to 10h, respectively.
This raises the question of whether, in the case of a diffuse drying front, the total retreat of
the front into the material corresponds exactly, as currently admitted (Mertz 1991, for
instance), to the critical point where the overall drying curve changes from linear into an
asymptotic curve (Fig. 4.6). Indeed, Fig. 5.31 suggests that this transition point may occur,
particularly in the case of the unpainted specimen which gave rise to a more diffuse front,
some time before the total retreat of the drying front into the material.
In both specimens, as soon as the moisture content begins decreasing at the surface, an
approximately linear variation of the moisture content arises between the surface and the
middle of the specimens, which corresponds to a markedly diffuse drying front. In the latter
moments of the experiment, a drying front width of around 13 mm or 9 mm (see green lines
in Fig. 5.30) is observed for the unpainted and painted specimens, respectively. This width
difference is coherent because the slower the drying, the sharper the drying front. Indeed, a
lower drying offset is expected to exist among pores of different sizes when evaporation is
slower, as it happens with the painted specimen, because the liquid has more time to flow to
the surface.

Behaviour of plasters and renders 143
5.8 Drying of hydrophobic agent containing plaster (set 4)
5.8.1 - Introduction
Hydrophobic agents are often added to plastering/rendering mortars aiming at preventing
dampness or salt damage. Typically, small amounts of such additives are used to reduce the
capillarity coefficient of these mortars without rendering them into fully hydrophobic mortars.
The current conviction is that a lower capillarity coefficient will make it more difficult for liquid
solutions to reach the outer surface of walls and, thereby, surface damage will be reduced.
However, there is field evidence that surface damage, dampness included, is in certain
cases enhanced rather than reduced when hydrophobic agent containing plasters or renders
are used (Fig. 5.2).
Drying experiments monitored by a 2D MRI technique were therefore performed on a
traditional lime plaster that contained a hydrophobic agent. The objective of these
experiments was to evaluate the influence of the additive on drying and salt deposition
processes.
5.8.2 - Materials and methods
The drying experiments were similar to those presented in Chapter 4 where the 2D MRI
technique described in Annex I was used on specimens composed of a lime plaster on a
composite substrate of lime mortar and stone. But here, lime plaster H was used instead of
plaster L.
The composition and execution technique of these two plasters is similar in all respects
except for the hydrophobic agent in plaster H, which was added during batching in the
proportion recommended by the producer (Table 5.1). Therefore, the influence of the additive
can be evaluated by comparing the behaviour of the two types of specimens. As seen in
Fig. 5.5, the additive induced a certain lowering of the capillarity coefficient of mortar H by
comparison to mortar L.
The experiments were performed on specimens filled with either pure water (specimens DH3
and MH3) or 3 molal NaCl solution (specimen DH1). Drying was monitored for 20 hours for
pure water and 50 hours for the NaCl solution.
Also gravimetric drying experiments, similar to those described in section 5.4, were
performed on several DL and DH specimens, as well as on similar specimens where stone M
was used instead of stone D (ML and MH specimens). A first series of gravimetric
experiments was carried out at around the two months of age of the specimens, that is,
approximately three months before the MRI-monitored experiments were performed. Three
specimens of each kind were tested, including those later subjected to the MRI-monitored
experiments. Approximately three months after these MRI-monitored drying experiments
were performed, a new series of gravimetric drying experiments was carried out on four
specimens, three of which (DL5, DH10 and MH10) had never been wetted.

144 Chapter 5
5.8.3 - Results
Selected MRI snapshots of specimen DH3 during drying with pure water are presented in
Fig. 5.32. Snapshots of specimen DL1 (Chapter 4) under similar drying conditions are also
included to make it easier a comparison between plasters with (DH3) and without (DL1)
hydrophobic additive. Snapshots that correspond to approximately similar moisture
distributions in the two specimens, though to different moments of drying, were chosen. In
Fig. 5.33 the 1D distribution profiles at cross-sections CS1 and CS2 (Fig. 4.10) of the two
specimens are presented.
0 kg/m3248 kg/m3
DL1
water
12 h
0 h
0 h
3 h
8 h
5 h 9 h
20 h
DH3
water
20 h
Fig. 5.32 – Drying with pure water: MRI snapshots of specimens DL1 and DH3 on side-view
a) CS1-DL1-w ater
0.0
0.5
1.0
1.5
2.0
7 12 17 22 27 32 37
Position (mm)
Signal H
+ (a.u.)
Initial
0 h
1 h
2 h
4 h
6 h
8 h
10 h
12 h
14 h
16 h
18 h
20 h
plaster L mortar L
c) CS2-DH3-w ater
0.0
0.5
1.0
1.5
2.0
6 11 16 21 26 31 36
Position (mm)
Signal H
+ (a.u.)
Initial
0 h
1 h
2 h
4 h
6 h
8 h
10 h
12 h
14 h
16 h
18 h
20 h
plaster H
stone D
c) CS2-DL1-w ater
0.0
0.5
1.0
1.5
2.0
8 13 18 23 28 33 38
Position (mm)
Signal H
+ (a.u.)
Initial
0 h
1 h
2 h
4 h
6 h
8 h
10 h
12 h
14 h
16 h
18 h
20 h
plaster L
stone D
a) CS1-DH3-w ater
0.0
0.5
1.0
1.5
2.0
15 20 25 30 35 40 45
Position (mm)
Signal H
+ (a.u.)
Initial
0 h
1 h
2 h
4 h
6 h
8 h
10 h
12 h
14 h
16 h
18 h
20 h
plaster H mortar L
Fig. 5.33 – Drying with pure water: 1D moisture profiles at cross-sections CS1 and
CS2 of specimens DH3 and DL1. MRI signal is given in arbitrary units (a.u.). The
grey shadow areas indicate the possible location of the physical limits of the test
specimens (the drying surface is always on the left).

Behaviour of plasters and renders 145
The overall drying curves are shown in Fig. 5.34. This figure includes not only the drying
curve of specimen DH3 that concerns the drying experiment presented in Figs. 5.32 and
5.33, but also the drying curves of two other specimens: MH3 (pure water) and DH1 (NaCl
solution). Drying curves of specimens with similar composition but where plaster L is used
instead of plaster H are also included.
Each point on a drying curve corresponds to the sum of all the values obtained across the
two corresponding 1D profiles (similar to those in Fig. 5.33). Normalized drying curves are
presented in this case to make it easier to compare the different specimens.
0
0.2
0.4
0.6
0.8
1
0 12 24 36 48 60
Time (hours)
Norm
alized amount of water (a.u.) DH3-w ater
DL1-w ater
MH3-w ater
ML1-w ater
DH1-NaCl
DL1-NaCl
Fig. 5.34 – Normalized drying curves
The results of the gravimetric drying experiments performed on various specimens at the two
or eight months of age are presented in Fig. 5.35.
4
6
8
10
12
0 2 4 6 8
Time (h)
Water content (%
W)
DL1,DL2,DL3 DH1, DH2, DH3
ML1, ML2, ML3 MH1,MH2,MH3
T ≈ 20ºC
HR ≈ 65%
Low air velocity
4
6
8
10
12
0 2 4 6 8
Time (h)
Water content (%
W)
DL5 DH10
ML3 MH10
T ≈ 20ºC
HR ≈ 65%
Low air velocity
Fig. 5.35 – Gravimetric drying experiments on water-filled specimens composed of
non-additivated plaster L or additivated plaster H. The experiments were performed at the two
(graph on the left) or eight (graph on the right) months of age.

146 Chapter 5
5.8.4 - Discussion on set 4
With pure water, Fig. 5.32 shows that the overall drying behaviour of specimens DH3 and
DL1 leads to equivalent situations which, nonetheless, correspond to different moments. In
fact, drying is slower for the hydrophobic plaster. Fig. 5.33 shows that the evaporation rate
during drying Stage I is indeed lower for specimen DH3 than for specimen DL1. As a result
of this slower drying process, the drying front receded at a later moment in specimen DH3.
This behaviour may account for the fact that in real walls dampness and surface decay are
sometimes worsened when hydrophobic additives are used in plastering or rendering
mortars (Fig. 5.2).
A higher offset seems to exist in specimen DH, particularly in the early moments, between
the moisture content in the plaster and in the substrate. This suggests that the hydrophobic
agent reduces the moisture content in the plaster. Indeed, Fig. 5.5 shows that not only is the
capillarity coefficient reduced by the use of this additive but also capillary saturation seems to
be attained at lower moisture content.
Hydrophobic products used on porous building materials are substances that possess a
polar and a non-polar end. The polar end is adsorbed into the polar surfaces of the pores
thereby giving non-polar characteristic to these surfaces. Thus, the contact angle between
water and such surfaces is higher than 90º. In pores, a convex meniscus forms and there is
no capillary suction. Mass hydrophobic additives used in mortars are liquid or powder
products. It is known that the higher the quantity of product added, the lower the capillarity
coefficient of the material. It is reasonable to assume that this arises from the hydrophobation
of an increasing part of the porosity.
Therefore, a part of the porosity in plaster H was probably unavailable for capillary transport.
This is consistent with the behaviour differences between specimens DH3 and DL1:
- Mortar L and mortar H have similar pore size distributions (Fig. 5.7). Yet, in contrast
to specimen DL1, the moisture content in the plaster in specimen DH3 is always
somewhat lower than that in the underlying mortar L (Figs. 5.32 and 5.33).
- The slower drying of specimen DH3 is likely to arise mostly from that lower effective
volume of capillary active pores through which a practically similar amount of water
has to be eliminated. A lower liquid flux is accompanied by a lower evaporation rate
because less liquid is available for evaporation at the wet front.
- It is not known if there is also a reduction of the vapour flux in hydrophobic pores.
Indeed, in non-hydrophobic pores, the presence of liquid water can enhance vapour
transport (Rose 1963) as the so-called “liquid assisted vapour transfer” (Fig. 4.5c).
The longer drying stage I of specimen DH3 in comparison to specimen DL1 is not very clear
in the overall drying curves in Fig. 5.34. This may occur because, since the specimens are
not homogenous, the drying front recedes unevenly throughout the surface, as roughly
suggested by Fig. 5.32. This is consistent with the fact that in the 1D profiles (Fig. 5.33) no
effective receding of the drying front into the material is observed. Indeed, the drying front
seems to recede somewhat later at the central parts to which these profiles correspond (Fig.
I.10) than at the edges of the specimen (Fig. 5.32). A second cause can arise from the drying
front being diffuse rather than sharp. Hence, the effective surface of evaporation and, thus,
the drying rate of the specimen, can start decreasing before the drying front recedes
completely into the material, as discussed in the previous section.

Behaviour of plasters and renders 147
Only one of the three MRI-monitored drying experiments performed on plaster H specimens
has been discussed up to now. Indeed, the two other drying experiments on specimens MH3
(pure water) or DH1 (NaCl solution) were not conclusive. In these experiments, the
additivated and non-additivated plaster showed similar drying behaviour, as seen in
Fig. 5.34. This occurred despite lower evaporation rates were measured for all the
specimens with plaster H in the first gravimetric experiments (Fig. 5.35, on the left). To clarify
these unexpected results, new gravimetric drying experiments were performed some months
later. As seen in Fig. 5.35 (on the right), the hydrophobic additive had completely lost its
effect, despite most of the specimens never having been wetted. Therefore, the similar
drying behaviour of specimens MH3 and ML1 with pure water or DH1 and DL1 with NaCl
solution was most likely due to an absence of hydrophobic effect. Further research on this
loss of hydrophobic effect could not be carried out within this thesis due to time limitations
and also because it was out of the scope of the original working plan.
5.9 Crystallization tests on painted stone (set 5)
5.9.1 - Introduction
Crystallization tests are typically performed on one-material specimens. Yet, in reality, walls
frequently include a final paint layer. Furthermore, salt decay problems in these walls often
consist essentially of surface damage due to paint peeling or blistering.
In this section, NaCl and Na2SO4 crystallization tests are presented, which were carried out
on painted and unpainted stone specimens with the main objectives of:
- comparing the damage caused by each type of salt;
- evaluating the performance of the painted and unpainted material.
5.9.2 - Materials and methods
Two distinct crystallization tests were performed on stone D specimens either unpainted or
painted with common acrylic emulsion paint.
Experiment 1
The specimens were similar to those in set 3, although of larger flat dimensions
(160 mm x 160 mm). The lateral faces of the specimens were sealed with silicon mastic.
Later, it was found that this type of silicon product can migrate into the pore network and
cause hydrophobization of stone, mortar or brick materials. Here, this type of effect indeed
arose in a peripheral band which attained a maximum width of 5 mm in some specimens.
Yet, due to the large size of these specimens, there were no major consequences.
Crystallization tests by wet/dry cycling were performed, using pure water, 0.4 molal NaCl
solution or 0.4 molal Na2SO4 solution. Two specimens of each kind were used with either salt
solution. For pure water, only one specimen of each kind was used. After oven drying the
specimens at 60ºC for 24 hours, four cycles were carried out as follows:

148 Chapter 5
- wetting – the specimens were immersed in the solution to a depth of around 5mm
from their bottom faces for 2 h;
- the bottom faces were sealed with polyethylene film;
- drying – the specimens were dried in a ventilated oven at 60ºC for 24 h;
- cooling – the specimens cooled for 22h in a conditioned room with a low air velocity
at 20ºC and 65% RH;
- the specimens were observed and any damage registered;
- the wet-dry cycle ended.
Experiment 2
A second test was performed only on painted stone. Smaller 100 mm x 100 mm specimens
laterally sealed with epoxy resin were used in this case.
Wet/dry cycles were performed, using 0.2 molal NaCl solution or 0.1 molal Na2SO4 solution.
Two specimens were used with each salt solution. Three cycles were carried out after oven
drying the specimens at 60ºC for 24 hours. The cycles were similar to those in the previous
experiment with the difference that the cooling and drying periods were reduced from
22 to 2 hours and from 24 to 22 hours, respectively. These changes allowed total cycle
duration of 24h. Also, observation and registration of damage was now carried out at the end
of each absorption, drying or cooling period.
5.9.3 - Results
Experiment 1
In the first experiment, extensive damage was observed on all painted specimens already at
the end of the second cycle. The paint blistered with both salt solutions, although the blisters
were slightly larger for Na2SO4 than for NaCl. At the end of the fourth cycle, large areas of
the paint had become completely detached from the substrate (Fig. 5.36), especially in the
case of Na2SO4.
Fig. 5.36 - Damage on the acrylic paint at the end of the first
crystallization experiment
NaCl Na2SO4

Behaviour of plasters and renders 149
The unpainted specimens developed efflorescence both for sodium sulfate and for sodium
chloride. As seen (Fig. 5.37, left), sodium chloride efflorescence was much more abundant,
forming a thick crust of salt that eventually blistered. Yet, after efflorescence removal, the
surface of the stone was eroded in the case of sodium sulfate but practically undamaged in
the case of sodium chloride (Fig. 5.37, right).
Fig. 5.37 - Damage on the unpainted stone specimens at the end of the first
crystallization experiment: efflorescence (left), cleaned stone surface (right)
With pure water no damage arose neither for the painted nor for the unpainted specimens.
Experiment 2
Extensive damage was also achieved in the second crystallization experiment with both
salts. Damage arose during the second or third cycle for sodium sulfate or sodium chloride,
respectively (Fig. 5.38). It is interesting to note that sodium sulfate damage occurred during
the wetting period, while sodium chloride damage arose during the drying period. By
perforating the blistered paint layer it could be seen that there was no salient efflorescence
that could have pushed the paint. The surface of the stone was almost clean in the case of
sodium sulfate and for sodium chloride only a thin layer of salt was visible.
Liquid water was systematically observed on the painted surfaces during wetting of the
specimens. This indicates that the specimens were able to saturate during the two-hour
immersion. That is consistent with the results of the capillary absorption test (Fig. 5.5) were
capillary saturation of stone D was attained after one hour.
Fig. 5.38 - Damage to the acrylic paint during the second crystallization
experiment: for sodium sulfate, after one hour soaking in the second
cycle (left); for sodium chloride, at the end of the third cycle drying (right).
The paint layers were intentionally perforated to allow observing the
stone surface.
NaCl NaCl Na2SO4 Na2SO4
Na2SO4 NaCl

150 Chapter 5
5.9.4 - Discussion on set 5
To the unpainted stone, sodium chloride caused much less material damage than sodium
sulfate, as seen by the results of the first experiment (Fig. 5.37). As in many other
crystallization tests (Goudie and Viles 1997, for instance), sodium chloride formed mostly
harmless efflorescence while sodium sulfate crystallized mainly within the pores thereby
eroding the stone.
Yet, both salts caused significant damage to the painted specimens, though the damage
mechanism is not completely clear. Indeed, there was no efflorescence beneath the paint
layer that could have pushed it, which contradicts the hypothesis put forward in a previous
article (Gonçalves 2003a). But, regardless of the actual damage mechanism, it is clear that
both sodium sulfate and sodium chloride can cause severe damage to painted specimens
even in current crystallization tests where only sodium sulfate is able to deteriorate
the unpainted material.
Because paint damage is one of the most frequent salt decay patterns in buildings, it will be
important to clarify the actual damage mechanisms in future work. The main hypotheses are
the following:
(i) Vapour pressure – Salt deposition at the paint/plaster interface can weaken the
adherence of the paint to the substrate or even create a thin air layer at the interface. The
paint hinders vapour transport, as seen in section 5.8. Hence, it is possible that, in
subsequent cycles, vapour pressure is able to push the poorly adherent paint layer which
then blisters and eventually detaches completely. Indeed, no damage arose with pure
water (experiment 1) and salt deposition was observed at the paint/plaster interface of
the damaged specimens (experiment 2).
(ii) Crystallization pressure – In the second experiment, the painted surfaces become wet
during the wetting periods. Hence, some salt probably crystallized in the paint layer itself.
Therefore, it is possible that crystallization pressure causing dilation of the thin, poorly
adherent and elastic coating. Indeed, in this experiment, sodium chloride damage arises
during the drying period, when halite is expected to crystallize mostly. In contrast,
damage by sodium sulfate arises during the wetting period, hence, it may be due to
mirabilite crystallization at the contact of the fresh salt solution with thenardite crystals
deposited in the previous drying phase.

Behaviour of plasters and renders 151
5.10 Discussion
5.10.1 - Salt distribution
In the case of evaporative crystallization, soluble salts crystallize at the drying front. The
depth and width of the layer at which they deposit in porous materials depends on the
position and width of the drying front. The distribution of salt is, therefore, controlled by all
factors that influence evaporation or liquid movement to the drying front, as early postulated
by Schaffer (1932).
The overall position of the drying front results, at each moment, from a global balance
between the incoming liquid flux and the outgoing evaporation flux. The lower the
liquid/evaporation flux ratio, the deeper in the wall is the drying front located and, thus,
soluble salts deposited.
The width of that front also conditions the distribution of salt, as argued in section 5.6.4.2.
When a diffuse front occurs, the solubility of the salts is relevant: (i) the lower this solubility,
the earlier the salts will crystallize as they travel across the front; (ii) for salts that tend to
supersaturate or possess several crystal phases with distinct solubility, such as Na2SO4, a
more even distribution of salt can arise across the drying front. Indeed, a very diffuse drying
front was observed in MEP plaster in set 2. And both in set 1 and 2 a deeper and more even
deposition of Na2SO4 than NaCl occurred, namely, in MEP plaster.
There are some differences between the distributions of Na2SO4 across MEP plaster in the
two sets: in set 1 more salt crystallized at the plaster middle-thickness (Table 5.4) while in set
2 the salt accumulated preferentially next to the plaster/substrate interface (Fig. 5.26).
Further, drying was globally slower in set 1 than in set 2 (Fig. 5.12 and 5.21). Yet, a more
advanced position of the drying front during set 1 is not probably the reason, because the
two NaCl distributions are reasonably similar (Table 5.4 and Fig. 5.25). These small
differences between the distributions of Na2SO4 in the two sets are not easy to explain. It
might be that the repeated contaminations or temperature cycles in set 1 had some
influence. Indeed, temperature-induced crystallization of mirabilite or crystallization of
mirabilite at the contact of the salt solution with pre-existing thenardite crystals may have
occurred in set 1. But a distinct metastable behaviour of sodium sulfate, as regards
supersaturation or heptahydrate precipitation, is equally possible.
The width of a drying front depends on the homogeneity of the pore network. In
heterogeneous pore networks (as regards both pore suction and size) the offset between the
positions of the local drying fronts in the different pore families can be significant. Hence, a
diffuse instead of a sharp front might arise.
Furthermore, all factors that influence the liquid flux or the evaporation rate can, in principle,
alter the width of the drying front. For instance, the slower drying of the painted specimen in
set 3 gave rise to a sharper drying front (Fig. 5.30). Indeed, a smaller drying offset exists
among pores of different sizes when evaporation is slower because the liquid has more time
to flow to the evaporation front.
Therefore, salt distribution in plasters and renders depends on the (vapour and liquid)
moisture transport properties of the material but may also be influenced by external factors
such as:

152 Chapter 5
i) Those that influence the evaporation rate for example: nature (and concentration) of
the contaminant solution, environmental conditions and presence and type of paint
layer.
ii) Those that condition liquid transport, for instance: moisture content in the materials
and suction properties of the substrate.
5.10.2 - Plasters and renders
In this chapter, the behaviour of plasters and renders in relation to soluble salt crystallization
was described in terms of their salt-accumulation behaviour, damage patterns and durability.
Efflorescence was considered as damage for the salt-accumulating but not for the salt-
transporting plasters.
As seen in set 1, a general comparison of the behaviour of different plasters in relation to salt
crystallization is not possible because it may change with distinct boundary conditions.
Indeed, only Parlumière presented reasonably constant (salt-accumulating) behaviour under
different testing conditions. Further, the durability of all plasters varied significantly with the
type of contaminant solution, presence of paint or type of substrate material.
Soluble salts slow down evaporation. This occurs because non-volatile solutes lower the
vapour pressure of liquids and also probably because of the hindering effect of salt crystals
(as seen in set 1, the drying rate of the salt-loaded specimens decreased from cycle to
cycle). Hence, the outer surface stays wet longer when salts are present. The lower the
vapour pressure of the salt solution, which depends on the type of salt and concentration of
the solution, the closer to this surface salts deposit during evaporative processes.
Yet, different plasters are affected differently by the presence of salts. In set 1, the decrease
in the drying rate from cycle to cycle was more severe in the case of salt-transporting (LNEC
on brick) than of salt-accumulating behaviour (LNEC on lime mortar, MEP and Parlumière on
brick). Further, some systems showed similar salt-accumulating behaviour with NaCl and
Na2SO4 while others did not. The most extreme change occurred with painted MEP which
worked as an accumulating or as a transporting plaster with Na2SO4 and NaCl, respectively.
Also, although all systems dried more slowly when salts were present, different drying speed
rankings arose for pure water and the salt solutions. Since pure water corresponds to an
infinitely dilute solution, this suggests that solution concentration differences may affect the
behaviour of distinct plasters differently.
Paints can also hinder evaporation, hence reducing the ratio evaporation flux / liquid flux and
causing a more superficial deposition of salt and a longer presence of moisture at the
surface. This was clearly shown by the MRI images in set 3 drying experiments. Also in set 1
drying tended to be slowed down by the presence of the paint layer both for pure water and
for the salt solutions. However, the influence of the paint varied for different plasters and
salts. For instance, with NaCl, the paint transformed MEP from an accumulating to a
transporting plaster. But this did not occur for MEP with Na2SO4 nor, with any of the salts, for
Parlumière or LNEC on lime mortar.
The influence of paints is expected to be different in the case of salt-accumulating or salt-
transporting plasters. For salt-accumulating plasters, serious damage may arise from the use

Behaviour of plasters and renders 153
of paints because, when drying is slowed down, salt solutions can reach the surface and,
hence, completely corrupt the fundamental working principle of the plaster. In contrast, for
salt-transporting plasters, paints that hinder drying may tend to increase salt-induced
dampness and efflorescence but they can, at the same time, reduce material damage by salt
crystallization. This was clearly observed in set 1 tests on LNEC/brick with NaCl: surface
damage arose earlier on the painted specimens but it was less severe (only efflorescence
and further rupture of the paint layer) than on the unpainted specimens (where longitudinal
cracking occurred).
Mass hydrophobic additives, when used in reasonably low amounts that do not render a
traditional plaster into a fully hydrophobic plaster, cause reduction of the liquid flux because a
part of the capillaries becomes unavailable for liquid transport. Hence, the evaporation rate is
also reduced because less liquid is available at the wet front per unit time. Therefore, drying
is prolonged. In the case of specimen DH in set 4, which was initially saturated, this led to a
longer drying Stage I.
The substrate material can strongly condition the liquid flux into the plaster, hence, the
evaporation/liquid flux ratio, thus, the behaviour of plasters and renders in relation to salt
crystallization. As seen in set 1, LNEC behaved as a transporting plaster on brick substrate
and as an accumulating plaster on lime mortar substrate. This indicates that LNEC is able to
draw a higher amount of moisture per unit time from the brick than from the lime mortar. This
probably occurs because the lime mortar possesses a higher amount of small pores than the
brick (Fig. 5.7). Hence, a higher percentage of the pores in LNEC plaster is able to draw
water from the brick than from the lime mortar substrate. Indeed, the liquid flux depends on
the relation between the capillary suction of the two materials at different moisture contents.
There is also a possibility that a poorer adherence existed to the lime mortar substrate
thereby inducing a higher resistance to liquid transport. Indeed, resistance to liquid transport
may vary at the interface between different materials.
The saturation condition is also relevant as regards the behaviour of porous materials to salt
crystallization. As seen in set 3, when MEP specimens were fully saturated, most of the
moisture was eliminated by surface evaporation and, hence, a markedly transporting
behaviour arose. In contrast, salt-accumulating behaviour occurred when only the substrate
was saturated. In any case, absorption/drying hysteresis prevents an immediate retreat of
the wet front at decrease of the moisture content in the material. This suggests that strong
hysteresis can be positive for plasters intended to be salt-transporting. For salt-accumulating
plasters it may also contribute to a longer stability of the drying front, thus, to a lower risk of
salt being deposited on or in the substrate as a result of diminishment of the liquid flux.
However, if the boundary conditions are such that the wet front is able to reach the surface, a
strong hysteresis will worsen surface damage in salt-accumulating plasters.
In real walls rising damp represents the general case and, unlike in laboratory unidirectional
drying tests on small specimens: (i) moisture transport is three-dimensional or can, at the
best, be considered bidirectional when sufficiently far from the lateral limits of the wall;
(ii) permanent liquid supply fluxes tipically exist during more or less prolonged periods;
(iii) the moisture content in the wall varies (decreases) with height. It is common knowledge
that lowering of the evaporation / liquid flux ratio, for instance due to temperature drop or RH
rise, increases the height of capillary rise in walls. Hence, all the above mentioned factors
that lower the ratio evaporation flux / liquid flux not only induce, as argued, a forward
displacement of the drying front at each height, but also an upward increase in the height of
capillary rise. Indeed, they tend to cause a general enlargement in the moist or salt decayed
area.

154 Chapter 5
In the MRI-monitored experiments noticeably diffuse drying fronts were often observed.
Indeed, a sharp front arose only, in set 2 and in Chapter 4 experiments, at the surface of the
specimens totally saturated with salt solution when the duration of the experiment was
perhaps too short to allow receding of the drying front. In the other cases, markedly diffuse
drying fronts arose. Although drying in these experiments was probably much faster than in
most real situations, it is probable that for low liquid supply fluxes or high evaporation rates
(for instance, due to wind) diffuse wet fronts will also arise in building masonry.
Drying curves, normally obtained by means of gravimetric drying experiments, are currently
used to characterize building materials. The critical moisture content in those curves
(Fig. 4.6) corresponds to the moment when the drying rate starts decreasing over time. This
point is expected to represent the transition from Stage I (when the drying front is located at
the surface) to Stage II (when the drying front is located in the material). However, if the
drying front is not sharp, transition from Stage I to Stage II is not immediate. The drying front
only recedes completely into the material after a transitional period where the porosity
involved in transporting the liquid to the surface decreases progressively. The more diffuse a
drying front, the longer that transitional period, as seen in set 3 (Fig. 5.31). This suggests that
drying curves, either gravimetric or obtained by other methods such as MRI, may not be
totally reliable for evaluating drying of porous building materials. Indeed, for a sharper front,
the critical moisture content may indeed correspond to the moment when the surface layer
becomes dry. But there is no guaranty that the same will happen for a more diffuse front,
where that point may simply correspond to a decrease in the water-filled surface porosity.
Moreover, the sharpness of the drying front does not depend solely on the material
properties. A slower drying rate, for instance due to differences in the environmental
conditions or presence of a paint layer, can give rise to a sharper front in the same material
and for the same liquid. This misleading effect is suggested, for instance, when comparing
the behaviour of the painted and unpainted specimens in set 3. While the critical point in the
overall drying curve of the painted specimen is close to that when the drying front totally
recedes into the material, it is not clear that the same happens for the unpainted specimen
(Fig. 5.31).
EN standard 998-1 (CEN, 2003) defines requirements for the so-called renovation mortars
that concern capillary absorption and vapour permeability (Table 2.1). Renovation mortars
are here defined as “plastering/rendering mortars to be used on moist salt-loaded walls”,
which is a rather insufficient specification. Indeed, nothing is said about the working principle
which, from the end-users’ point of view, is perhaps the most fundamental feature. Although
it was not an objective of this thesis to verify the fulfilment of standard requirements such as
these, the results obtained in the several sets of tests indicate that material properties are
insufficient for predicting the behaviour of plasters and renders in relation to salt
crystallization. Indeed, only in the case of salt-blocking (fully hydrophobic) or
moisture-sealing plasters can constant behaviour be expected for different boundary
conditions. Hence, for transporting or accumulating plasters a probabilistic approach based
on field data would perhaps be more adequate, even if not easy to achieve. Another possible
way is the use of numerical computational models that allow evaluating the performance
achieved under varied conditions. However, further knowledge of salt decay mechanisms is
still necessary, namely of the processes by which salt crystals hinder drying, in order to
develop adequate models, as also concluded by Huinink and Pel (2003).

Behaviour of plasters and renders 155
5.10.3 - Sodium chloride and sodium sulfate
Although there is field evidence of its frequent involvement in salt decay processes, sodium
chloride is often, in contrast to sodium sulfate, almost totally or totally harmless in laboratory
tests.
The different behaviour of sodium chloride and sodium sulfate probably lies, to a significant
extent, in differences between the crystallization processes of the two salts, namely, in the
capability of sodium sulfate for generating highly supersaturated solutions, hence, strong
crystallization pressures (Tsui et al. 2003) or in the faster crystallization kinetics of mirabilite
in comparison to halite (Rodriguez-Navarro and Doehne 1999). Further, in contrast to sodium
chloride, the solubility of sodium sulfate varies with temperature (Figs. 2.6 and 2.8), hence,
temperature-induced crystallization may take place. Indeed, laboratory crystallization tests
often include temperature cycling, frequently at very high temperatures. It is also possible
that the enthalpy change associated to the crystallization process itself (which is endothermic
in both cases) is, due to the sensitivity of this salt to temperature changes, relevant for
sodium sulfate. Mirabilite crystallization may also occur readily at the contact of a sodium
sulfate solution with pre-existing thenardite crystals (Chatterji and Jensen 1989).
Another point may be that mixtures of salts are usually present in buildings while in
laboratory tests single salts are normally used. And the properties of soluble salts may
change in the presence of other salts (Price and Brimblecombe 1994). In fact, a combination
of different salts can be more harmful than each of them in isolation (Charola 2000).
Further, specific damage patterns such as alveolization (Fig. 2.3) are not reproduced in
current crystallization tests.
The experimental work performed in this thesis indicates that other differences between the
properties of sodium chloride and sodium sulfate, as well as differences between ordinary
laboratory and field conditions may also contribute to these behaviour discrepancies.
Laboratory tests are normally carried out: (i) on specimens made of a single material; (ii) on
fully-saturated specimens; (iii) using very concentrated solutions. These features can
account for lower crystallization damage by sodium chloride than by sodium sulfate because:
(i) the vapour pressure of similarly concentrated salt solutions and, particularly, of saturated
solutions is lower for sodium chloride; (ii) at ordinary temperatures, the solubility of the
possible crystal phases of sodium sulfate (thenardite, heptahydrate and mirabilite) is lower
than the solubility of halite, the crystal phase of sodium chloride.
Faster drying typically arises for sodium sulfate than for sodium chloride, namely, because of
the higher vapour pressure of similarly concentrated and, particularly, of saturated solutions.
Accordingly, sodium sulfate tends to crystallize deeper in the material because: (i) the drying
front is more deeply located; (ii) the drying front is more diffuse; (iii) due to its lower solubility,
sodium sulfate tends to crystallize earlier in the drying front. In contrast, for sodium chloride,
a more superficial and sharper drying front will arise thereby inducing a more superficial
deposition of salt. This feature is stressed when very concentrated salt solutions are used, as
often happens in laboratory tests. For saturated solutions, for instance, the vapour pressure
difference is huge: at 20ºC, the RHeqsat is of 75% for sodium chloride and 95.6% for sodium
sulfate. Since fully saturated specimens are the rule in laboratory tests, drying stage I will be

156 Chapter 5
much longer for sodium chloride, as seen in Chapter 4. Hence, a much higher percentage of
sodium chloride than of sodium sulfate will crystallize as harmless efflorescence. That was
clearly observed in the crystallization experiments of set 5 on unpainted stone.
In contrast, when the testing conditions are such that the drying front is inside the material
during the entire drying process, sodium chloride can cause even more severe damage than
sodium sulfate, as seen in set 1. This is likely to result, to a significant extent, from a more
localized deposition of sodium chloride. As observed in sets 1 and 2, sodium sulfate tends to
be spread in a larger volume probably because of its ability for supersaturating, for
precipitating at different concentrations and, in some cases, for crystallizing due to
temperature changes or at the contact between the salt solution and pre-existing crystals.
Unpainted specimens are normally used in laboratory tests. In contrast, painted surfaces are
common in buildings. Further, salt decay patterns in those buildings often consist simply in
peeling of the paint layer and efflorescence. This difference can probably account for part of
the discrepancy between the in-lab ineffectiveness and on-field effectiveness of sodium
chloride. As seen in set 5, only sodium sulfate was able to deteriorate the unpainted stone.
Yet, both sodium sulfate and sodium chloride were able to cause severe damage to the
painted specimens.
In set 5 crystallization tests the paints blistered and peeled without having been pushed by
efflorescence. This sort of damage is often seen in buildings (Fig. 5.39). But paint damage
can also arise due to subflorescence pressure (Fig. 5.40). This second kind of damage is
normally associated to high liquid fluxes (for instance, at the base of walls) and low
evaporation rates (for instance, in poorly ventilated rooms). It is not known whether the two
damage mechanisms are predominantly related to particular types of salts. Nevertheless, it is
reasonable to suppose that sodium chloride is able to cause significant
subflorescence-induced damage, perhaps even more than sodium sulfate. Because of the
high tendency of sodium chloride to crystallize on the surface rather than on the pores of
building materials, a large amount of salt can probably crystallize beneath, for instance,
vapour permeable hydrophobic paint layers. Indeed, as seen in Fig. 5.1, halite crystals are
even able to pull off a 1 cm thick hydrophobic brick layer.
Fig. 5.39 – Paint damage arising without
the presence of efflorescence: interior of
Ajuda Palace, Lisbon (left) and exterior of
building in Almada, Portugal (right).
Fig. 5.40 – Paint damage by subflorescence
pressure: Alhos-Vedros tide-mill (left) and interior of
Despacho House, Pereira, Portugal (right).

Behaviour of plasters and renders 157
5.10.4 - Development of an accelerated-ageing test
It is not always easy to understand the criteria underlying salt crystallization protocols. This
was well expressed by Goudie and Viles (1997) when commenting on a certain
crystallization test:
We might ask questions about the basis for the concentration of sodium sulfate, why
sodium sulfate was used, why the humidity is not carefully controlled, why such an
extreme drying temperature is used, why the soaking phase has the length it has.
Similar questions might be asked of [other methods].
Ultimately, it is not simple to design crystallization tests. Test variables should represent, as
closely as possible, a complex, dynamic, changeable and multiple reality from which there is
often not enough field information available. And it is not straightforward to define these
variables to produce short-duration (stronger) action on small specimens than reasonably
simulates long-duration (weaker) action on buildings. As stated by Knöfel et al. (1987) about
weathering tests in general, intensified experimental conditions lead to more destructive
processes, which take place only under more severe conditions, rather than just to a time
lapse of weathering processes.
Indeed, there is a certain contradiction between two of the main aims of salt crystallization
tests: (i) simulating reality; (ii) speeding up damage by comparison to reality. The key points
are that:
i) Salt decay dynamics influences the type of decay. As seen in this thesis, all factors
that influence evaporation or liquid transport condition the position and width of the
drying front, hence, the type of decay. Therefore, when damage is accelerated, by
harshening the environmental conditions or by using very concentrated solutions or
high moisture contents, distinct decay process and features will most likely arise.
ii) This influence varies for different materials and boundary conditions. For example, in
set 1, different drying speed rankings arose for pure water and the salt solutions,
which suggest that the concentration of salt solutions has a different influence on the
behaviour of different materials.
Salt crystallization tests can be used to compare the influence of different factors on salt
decay processes, as seen in this thesis, or to investigate salt damage mechanisms in
different materials. Yet, for the above mentioned reasons, they can hardly be used as
general performance tests for building materials. This conclusion contradicts Schaffer’s
(1932) statement that “crystallization tests (…) tend to reproduce that type of weathering
which the material suffers under actual exposure to the weather”. Indeed, the influence of the
experimental conditions on the type of decay is such that simulating and, at the same time,
accelerating the process is probably impossible.

158 Chapter 5
5.10.5 - Restoration interventions
End-users complain that salt decay in buildings, particularly efflorescence and material
damage such as peeling of paints or surface sanding of plasters and renders, is often
worsened after restorations.
Reduction of the ratio evaporation/liquid flux by the use of new materials is one possible
cause. Indeed, when that ratio is lowered, a forward displacement of the wet front arises for a
given liquid flux. This occurs when materials of lower vapour permeability than the original
ones are used, for instance, emulsion paints instead of pure lime washes or cement-based
instead of lime-based plasters and renders.
In walls with rising damp, the moisture content decreases with height. The water rises up to
the height where the liquid supply flux from the ground is balanced by the evaporation flux
through the surface of the wall. Therefore, hindering of evaporation, for instance by the use
of paints, may have two consequences: (i) at each height, the drying front moves closer to
the surface; (ii) there is an increase in the overall height of capillary rise (this reasoning is
applicable also to the lateral enlargement of the area affected by salt solutions). Therefore,
enlargement of the moist or salt-damaged area or damage to adjacent elements can arise
from the use of materials with low vapour permeability. One typical situation is that when
moist salt-damaged walls in the interior of rooms are repeatedly painted. Each new paint
layer will further reduce the evaporation rate. Hence, the damaged surface area is
progressively extended.
Reduction of the evaporation flux and further worsening of damage might also arise from a
reduction in the liquid flux. This occurs when the lowering of liquid transport is not enough to,
under certain environmental conditions, prevent the liquid from reaching the surface of the
wall. In that case, (surface) evaporation occurs at a slower rate, hence, the damaged area
increases. This is typical of the so-called “slow-transporting” plasters and renders, for
example, traditional plasters with small amounts of hydrophobic additives. But a similar effect
may arise also with plasters and renders that generally work as fast-transporting if there is:
i) a deficient bond to the substrate: lower liquid flux into the plaster may occur as a
result of poor connectivity of the pores at the interface with the substrate;
ii) poor compatibility between the pore networks of the plaster and substrate: lower
liquid flux to the surface arises because only a reduced percentage of the (small)
pores in the plaster is able to draw moisture from the substrate.
Surface damage on salt-accumulating plasters may occur, as explained, from the use of
paints of low vapour permeability or from repaintings. Also, as seen in set 2, if solutions are
allowed to reach the surface, by whichever conditions that lower the evaporation rate,
surface evaporation can persist long after that event has ceased due to absorption/drying
hysteresis of the plaster. This can happen also when the plaster or render is externally
wetted, for instance, by dew point condensation or rain and, hence, liquid continuity up to the
surface is enabled. For this reason, the use of a hydrophobic surface layer on
salt-accumulating systems seems recommendable for accumulating plasters and
unavoidable for accumulating renders.

Behaviour of plasters and renders 159
Liquid continuity up to the surface can, theoretically, be established also by the water in fresh
plastering/rendering mortars. It is reasonable to suppose that surface evaporation may
afterwards persist, during or even after hardening, in plasters/renders with strong hysteretic
behaviour or under low evaporation conditions (for example, during cold or wet seasons, in
poorly ventilated rooms or when paints are applied before the plaster is completely dry).
Conversely, problems may arise in fast-transporting plasters and renders from an
acceleration of the evaporation rate. It is known that when, for instance, dehumidifiers are
used aiming at avoiding efflorescence and dampness on these materials, a somewhat
deeper or more diffuse drying front may occur. Hence, a higher amount of salt may
crystallize in the pores close to the surface and induce material damage instead of harmless
efflorescence.
5.10.6 - Adequacy of plasters and renders
In monuments conservation, avoiding surface damage is normally not the only (and often not
the main) objective. Preservation of the underlying masonry and adjacent elements is also
frequently necessary. Indeed, different requirements arise in distinct situations:
• Health requirements are very relevant for living spaces, museums or rooms where
perishable goods are stored, such as paper, food, etc. In this case, surface damage
(dampness, efflorescence or material damage) is hardly acceptable.
• Protection of the substrate is important for buildings of high historic value and for
weak masonry.
• Sometimes there are artistic elements in continuity to the plastered/rendered area. In
this case, it is necessary to avoid that salt solutions are diverted into them.
Therefore, different plasters and renders may be adequate for distinct situations.
Furthermore, a wide range of situations can account for an increase in damage after
restoration interventions, as seen in the previous section for the case of surface damage. In
order to avoid these situations, case-by-case approaches are necessary.
All plasters, renders or paints that lower the evaporation rate can induce an enlargement in
the area affected by the salt solutions. This reduced evaporation rate may be due to a low
vapour permeability but also to a low liquid transport capability, as previously discussed.
Many industrial plasters and renders present high vapour permeability. But that vapour
permeability will hardly surpass that of ancient lime plasters that, moreover, have a higher
liquid transport capability. Hence, it is unlikely that salt-accumulating plaster/renders will
show a better performance than lime plasters/renders in preventing an increase in the
masonry area reached by the salt solutions.
The smaller salt-affected area is obtained with vapour permeable plasters/renders, with high
capillary suction (in relation to a given substrate) in which the drying front is, therefore,
located as close as possible to the outer surface of the wall. These fast transporting
plasters/renders are probably the most adequate solution when protection of adjacent
elements is required. However, surface damage is more likely to arise with them.

160 Chapter 5
Only salt-accumulating, salt-blocking or moisture-sealing plasters can provide surfaces free
of damage. But for salt-accumulating and salt-blocking plasters, a significant increase in the
area attained by the salt solutions may occur. This increase is not necessarily a
disadvantage, because the salt load per unit surface is accordingly reduced. Moisture-
sealing plasters, on the other hand, can divert the total liquid flux to adjacent areas.
Therefore, they are probably only adequate for specific situations such as, for instance, semi-
buried walls where the whole surface is to be plastered/rendered. In this case, evaporative
crystallization will not take place unless the surface is damaged and escape points arise as
represented in Fig. 2.10d.
For salt-blocking plasters, crystallization occurs at the plaster/substrate interface or in the
masonry. Therefore, these should be avoided when protection of the masonry is required.
Further, they may ultimately induce severe damage patterns such as detachment of the
entire plaster/render.
Crystallization on or in the underlying masonry may also arise with plasters and renders
without water repellent additives when the suction capability from a certain substrate is not
sufficient. As seen in Chapter 4 (Figs. 4.18 and 4.19), with the same plaster L, salt-deposition
in the substrate stone arose for the (fine-pored) stone D but not for the (coarse-pored) stone
M. The enhanced drying process taking place in this laboratory experiment probably stressed
this effect. Indeed, when drying is slower, as it probably happens in buildings, the liquid in the
substrate has more time to flow to the plaster. Even so, such occurrence in buildings is
probably not impossible, especially in the case of masonry stones with very small capillary
pores.
Hence, when protection of the masonry is required, plasters with high suction capability in
relation to that substrate should be used. As seen in Chapter 4 (Fig. 4.19), crystallization
may also occur in the bedding mortar. Therefore, the plaster should be able to draw, as
much as possible, the moisture not only from the (brick or stone) masonry elements but also
from the bedding mortars.
In salt-transporting plasters, surface damage can perhaps be reduced when homogeneous
pore distribution exists because, in that case, the drying front tends to be sharper. So, if the
liquid flux is high enough to maintain the front at the surface, more salt will crystallize as
harmless efflorescence rather than in the pores. However, the opposite may happen under
conditions such that the drying front is inside the material and, particularly, very close to the
surface. In this case, a sharp drying front causes all salt to crystallize just beneath the
surface and, thus, detachment of the material surface layer can easily occur.
Slowing down evaporation, for example by the use of a paint layer, could sometimes be
positive for salt transporting plasters because surface evaporation and, thus, salt deposition
as efflorescence rather than as subflorescence is enhanced.
Plasters/renders may be used, for instance, as provisional sacrificial layers on walls where
rising damp was stopped by whichever processes (peripheral drains, damp proof courses,
etc.). In this case, a fast transporting plaster/render with strong absorption/drying hysteresis
may be appropriate because the drying front will recede later into the plaster with decrease in
the total moisture content in the wall. Hence, the masonry will dry faster.

Chapter 6 – Case studies
6.1 Introduction
Salt decay is a serious concern for end users involved in the conservation of monuments and
historic urban assemblages. One of the main problems is that salt damage is often worsened
after restorations, namely after interventions whose main objective was precisely to mitigate
salt decay features. Some possible causes have been put forward in Chapter 5 in the light of
the factors that influence the behaviour of plasters and renders in relation to salt
crystallization. But a question arises as to whether other factors, more related to practice,
could contribute to that worsening in damage. A wrong diagnosis, specific field conditions or
application problems could also play a role.
Diagnosis must focus on the two predisposing factors of salt decay: soluble salts and
moisture. Yet, as discussed in Chapter 2, preliminary inspections by experts and adequate
tests are not normally carried out in many countries, namely, Portugal. It is also possible that,
as also pointed in Chapter 2, insufficient background knowledge of the responsible
technicians, unclear responsibilities or poor interaction between the involved actors give rise
to a wrong approach of the problem, hence, to a poor diagnosis.
Knowledge of the types of salts involved allows their origin to be traced (Goudie and Viles
1997). Valuable information on possible or probable sources of soluble salts can be obtained
by study of the enclosure conditions and building history. For instance, in buildings located
on the coast there is a high possibility of salt decay due to marine salts deposited directly
from the sea, by fog or by contaminated soil water. Also, when a building has been used for
storing salty goods it is very likely that salt damage is caused by sodium chloride that
penetrated the masonry over time (Nasraoui and Mertz 2004, for example). But not all
situations are as straightforward as these and, moreover, different sources and various salts
may coexist. And visual observation does not allow distinguishing between different sorts of
salts even when efflorescence is visible, which is often not the case.
Moisture sources are also ordinarily identified by visual inspection. Yet, although the
experience and scientific background of the expert are a major added value, the physical
evidence of dampness is often misleading, as pointed out by Massari and Massari (1993).

162 Chapter 6
In Portugal, traditional plasters and renders are currently used on salt-loaded walls. Pure
cement plastering or rendering mortars are becoming less common as it is more and more
accepted that they may introduce excessive mechanical stresses or alkali salts in old
masonry. Often, a mixture of air-lime and cement is used as binder but, even so, failures
occur.
Industrial salt-accumulating plasters and renders are relatively new in Portugal. Hence, there
is not enough information from practice to allow assessing their field performance. Yet, due
to the practical interest of this working principle and to the high number of (very expensive)
products today available on the market, an effort should be made to understand their main
possibilities and limitations.
This chapter presents research which was aimed at giving an insight into the field
performance of plasters and renders applied on moist salt-loaded walls. Its main objectives
were to:
• understand the nature and causes of some serious salt decay problems in old
Portuguese buildings, specially as regards the type of salts and sources of moisture;
• identify factors that can account for the worsening of salt decay after restorations;
• compare the possibilities and limitations of diagnostic methodologies based on
expertise (namely, visual inspections) or on sampling/testing techniques;
• evaluate the application technique and performance of three industrial plasters for
salt-loaded walls available on the Portuguese market.
The research was performed on five old buildings in Portugal: Salvas Chapel (Sines), Alhos-
Vedros tide mill (Moita), Despacho House (Pereira), Cloister of Sta. Clara-a-Nova Monastery
(Coimbra) and São Sebastião Church (Almada). They were selected, as described in
Chapter 2, out of 120 buildings identified by means of a questionnaire sent to 154
Portuguese entities or technicians working in the conservation of old buildings. After
preliminary visits to 31 buildings all over the country, the present five cases were chosen.
The criteria underlying this selection were both the technical interest, namely intensity of
damage and diversity of situations among the five cases, as well as a reasonable proximity
to Lisbon which would allow carrying out several inspections at each building.
As with most old Portuguese buildings, these five cases include thick load-bearing ordinary
masonry walls. The masonry bedding mortar is, in all cases, weak air-lime mortar. The
masonry elements are, in four of the buildings, irregular stone elements of variable size and
variable nature. In Despacho House the masonry elements are solid red ceramic bricks.
Diagnosis of the several cases was based on site inspections and on a systematic
sampling/testing procedure. HMC and MC profiles were obtained at selected walls of each
building, by means of powder drilling, following roughly BRE’s protocol (BRE 1989). The salts
were investigated by means of X-ray diffraction (XRD) or ion chromatography (IC) analyses.
In São Sebastião Church, test panels of two traditional rendering systems and three
industrial systems specific for salt-loaded walls were made on one façade. The performance
of the systems was monitored during three years and evaluated by means of visual
observation and HMC measurements.

Case studies 163
This chapter concerns the research carried out on the five case studies. The buildings and
their decay features are described in section 6.2. The diagnosis methodology is explained in
section 6.3. The inspections and analyses performed on each building are presented and
discussed in section 6.4. The study on experimental test panels is described and discussed
in section 6.5. An overall discussion focusing on the objectives of the research is presented
in section 6.6.
6.2 Description of the buildings and main decay patterns
6.2.1 - Salvas Chapel
Salvas Chapel (Fig. 6.1) was originally built in the early 16th century, although the front
façade dates from the 18th century. It is located in the city of Sines, 150 km south of Lisbon,
and is adjacent to Sines harbour (Fig. 6.6). The lateral SE façade (Fig. 6.3) is the one facing
the harbour.
At the time of this research, a lime render existed on all façades. According to information
from a technician of the national authority responsible for this building, this render included
also a (unknown) small percentage of hydraulic cement (unspecified type). This render was
applied and lime washed in 1997, in order to replace a previous salt-damaged Portland-
cement-based render which dated from around 1986.
The external façades of the chapel showed large decayed spots which reached more than
4m in height from the ground (Figs. 6.1 to 6.4). Damage progressed quickly, as seen in Figs.
6.1 and 6.2.
In October 2003, around 50% of the total rendered area was damaged. The main decay
patterns were sanding of the render and further erosion of the render/paint system (Fig. 6.5).
No efflorescence was visible. Decayed spots were seen near the ground, but in general
degradation occurred mainly at the middle height of the walls (Fig. 6.1 to 6.4). Damage
apparently started at the cracks or other singular points of the render (Fig. 6.5).
Fig. 6.1 – Salvas Chapel, SW (front) façade: July 2002 (left), October 2003 (right)

164 Chapter 6
Fig. 6.2 - Salvas Chapel, NE (rear) façade: July 2002 (left),
November 2003 (right)
Fig. 6.3 –Salvas Chapel, SE façade, which
faces Sines harbour, October 2003
Fig. 6.4 - Salvas Chapel, NW façade
October 2003
Fig. 6.5 – Salvas Chapel, damage spots on the SE façade. On the left: cracking of paint/render system and start of
erosion, October 2003. On the centre; area in more advanced stage of degradation due to further sanding and crumbling
of the paint/render system, October 2003. On the right; detachment of paint and of superficial coat of render, June 2002
Fig. 6.6 - Dona Bataça (water fountain plus reservoir) faces Sines harbour (left) and is located very near to the
rear façade of the church (right). The picture on the right is an old photo by DGEMN.

Case studies 165
6.2.2 - Alhos-Vedros tide mill
The tide mill (Fig. 6.7) is located in the village of Alhos-Vedros, 10 km south of Lisbon, next
to a branch of the Tagus estuary, at less than 10 km from the open sea. The mill is situated
between the kettle, an artificial lake meant to accumulate water during the high tide, and the
river branch. It dates from the beginning of the 18th century but has been inactive since 1940.
It will be rehabilitated to be used as a museum.
In 1999, the existing plasters, apparently based on an (unknown) hydraulic binder, were
replaced up to the height of 2.6m on the NW wall, 1.4m on the SW wall and 1.0m on the SE
wall, as well as around the NW windows of the ground floor. A traditional
hydraulic-lime-based mortar was used, according to information from a technician of the local
authority responsible for the building. The whole surface of the walls was then painted with
common emulsion paint.
Salt decay was observed mostly in the interior of the mill, on the ground floor. The main
decay forms were salt efflorescence, peeling of the paint layer and further sanding of the
plaster (Figs. 6.8 and 6.9). Damage affected mainly the new hydraulic-lime plaster. Although
infiltration of rainwater was detected on the SE wall (Fig. 6.9), salt damage was more intense
and attained greater heights on the NW wall (Fig. 6.8). In general, damage was concentrated
close to the ground and around windows on the NW wall. On this wall, damage increased
towards the northern corner (Fig. 6.8).
Evidence of dew point condensation was observed on the ground floor of the mill during one
of the inspections, as seen and described in Fig. 6.10.
Fig. 6.7 – Tide-mill (N façade)

166 Chapter 6
Fig. 6.8 – Tide-mill, damage at the northern wall of the milling room (ground floor). Left: general view
showing that damage increases towards the N corner and appears mostly close to the ground or around
the windows. Centre: peeling of the plastic paint around window. Right: damage to paint occurs either
without (window frame in the top picture) or with (wall base in the bottom picture) efflorescence.
Fig. 6.9 – Tide-mill, damage on the southern wall. On the left: at the ground floor, salt damage appears mostly on
the new hydraulic plaster. On the centre: lack of water tightness of the ground floor windows does not give rise to
salt damage. On the right: infiltrations from the roof at the upper floor do not cause salt damage either.
Fig. 6.10 – Tide-mill: moisture stains,
probably due to dew point condensation, on
the stone pavement of the ground floor. On
a dark and rainy autumn day, rain stopped
and sun quickly appeared. A much higher
temperature was rapidly reached outside
the mill, due to the high solar radiation. The
temperature inside the mill became clearly
lower than outside. The RH inside the mill
increased rapidly and moisture spots
appeared on the floor.
(1)
(1) (1)
(2)
(2)

Case studies 167
6.2.3 - Despacho House
Despacho House (Fig. 6.11) is located in the village of Pereira, next to the River Mondego,
200 km north of Lisbon and 20 km from the Atlantic. It was built in the early 18th century,
adjacent to Pereira Misericórdia church. Nowadays, it is used as a sacristy and mortuary
chapel.
In 2001, the old plasters and renders (unknown type) were replaced by air-lime plasters and
renders. It is not clear whether a Portland-cement-based adherence coat was also applied.
The walls were painted with a commercial potassium-silicate-based paint that includes water-
repellent additives.
Despacho House is located on the flood plain of the Mondego River. It was frequently
flooded until the beginning of the 1980s when a system of dikes was finally built to control
these periodic floods. The last flood took place in January 2001, precisely during the above-
indicated restoration, due to a rupture in the dike system. The flood occurred when the new
plaster had already been applied. Despacho House was submerged up to a height of 2.5m
but the new plaster suffered no apparent damage. Hence, it was painted in March 2003.
Only a few months after this restoration, degradation in the interior was impressive
(Fig. 6.12), affecting around 50% of the plastered area. Damage seems to have the following
evolution: (i) efflorescence develops at the interface plaster/paint; (ii) the crystals push the
paint layer and eventually cause its rupture; (iii) long needle-like crystals appear on the
surface and sanding of the underlying plaster occurs progressively. The plaster shows
intense “craquelet” and these cracks are critical points where degradation first starts and
develops faster. Damage affects only the upper part of the walls, from a height of 0.7m to
1.5m up to the top of the walls at 2.7m from the pavement.
Fig. 6.11 - Pereira Misericórdia, West façade: tower (left), church (centre), Despacho House (right)

168 Chapter 6
Fig. 6.12 – Extensive damage at the interior of Despacho House. On the left: cracking
of the plaster/paint system and efflorescence is observed from around 70cm height
from the pavement up to the top of the wall. On the right: damage details showing that
salt crystallization at the plaster/paint interface causes rupture of the paint layer and
further sanding of the underlying plaster (top), that efflorescence develops
preferentially, though not only, on the cracks (centre) and that large areas are
eventually covered with efflorescence (bottom).
6.2.4 - Cloister of Sta Clara-a-Nova Monastery
Sta. Clara-a-Nova Monastery is located in the city of Coimbra. It is composed of three
independent buildings: monastery, church and cloister. The cloister was built in the first half
of the 18th century. It includes the cloister garden and the two-storey surrounding gallery
(Fig. 6.13).
The present work concerns the ground floor of the cloister gallery which is a tourist attraction
nowadays. Here, a cement-based render, finished with a common white “plastic” paint exists,
dating from 1985. This render/paint system shows many salt damaged areas (totalling
around 15% of the total rendered area), mostly concentrated close to the ground or located
higher on the walls, next to stone elements (Fig. 6.14). Biological growth occurs on the
sheltered areas of the walls and vaults (Fig. 6.19).
The damage is mainly sanding of the render and further crumbling of the render/paint system
(Figs. 6.15), often preceded by detachment of the paint layer or of a thin superficial render
layer which apparently corresponds to the paint penetration depth (Fig. 6.18). Sporadic
cracks in the render/paint system are visible (Fig. 6.17) but do not seem to be a general
damage enhancement factor. Damage appears to progress according to the sequences in
Figs. 6.16 and 6.18.

Case studies 169
The roof of the cloister gallery is in poor condition and allows rainwater infiltration. However,
no correlation was found between the damaged roof areas and salt damage at the ground
floor. The NW wall of the cloister is semi-buried. But salt damage, namely upper spots, also
appears on the other walls. The cloister garden has only a partially effective drainage system
(Fig. 6.20), which may perhaps lead to rainwater penetration in the upper soil layers beneath
the cloister building. Further, probable dew point condensation events were observed during
one of the inspections (Figs. 6.19 and 6.20).
Fig. 6.13 – Sta. Clara-a-Nova cloister gallery
Fig. 6.14 – Sta. Clara: damage appears either close to the ground (NE wall, on the left) or
higher on the walls, next to stone elements (NW wall, on the right).
Fig. 6.15 – Sta. Clara: details of lower (on the left) and upper (on the centre) damage spots.
Efflorescence agglomerations are observed on the upper spot (on the right)

170 Chapter 6
Fig. 6.16 – Sta. Clara: damage development. It is not known whether the borderlines between wet
(darker) and dry (lighter) areas and, eventually, between damaged and non-damaged areas
correspond to micro-cracks.
Fig. 6.17 – Sta. Clara: sporadic
cracks are observed
Fig. 6.18 – Sta. Clara: in some cases, damage starts by
the bulging and further detachment of a thin surface layer
of the render, accompanied by peeling of the paint, without
the presence of efflorescence
Fig. 6.19 – Sta. Clara: moisture spots on the stone (left), moisture spots and biological growth on
the render (centre and right, respectively). On February 2004, on a sunny day that followed several
cold rainy days, spots of liquid water were observed in the gallery, mainly on the surfaces of the
stone columns and arches (left) with further absorption by the render (centre), which suggested the
occurrence of dew point condensation. Biological growth is significant on the sheltered parts of the
walls and vaults (right), which corroborates this hypothesis.
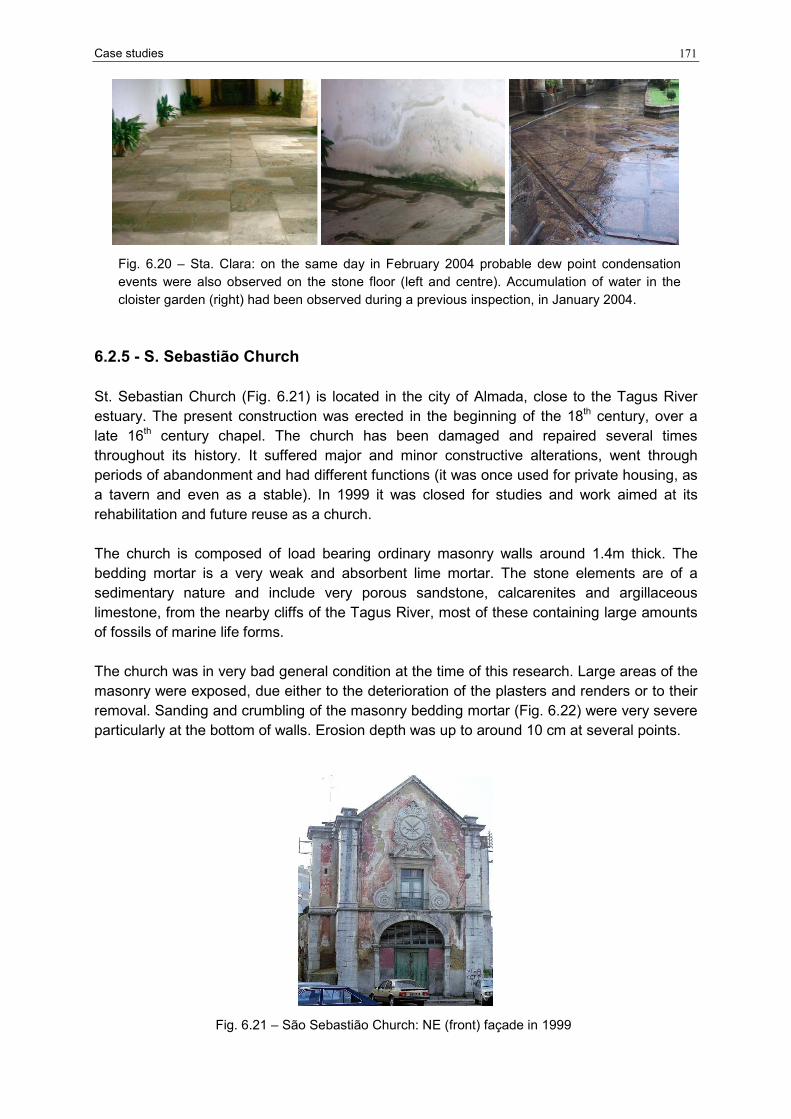
Case studies 171
Fig. 6.20 – Sta. Clara: on the same day in February 2004 probable dew point condensation
events were also observed on the stone floor (left and centre). Accumulation of water in the
cloister garden (right) had been observed during a previous inspection, in January 2004.
6.2.5 - S. Sebastião Church
St. Sebastian Church (Fig. 6.21) is located in the city of Almada, close to the Tagus River
estuary. The present construction was erected in the beginning of the 18th century, over a
late 16th century chapel. The church has been damaged and repaired several times
throughout its history. It suffered major and minor constructive alterations, went through
periods of abandonment and had different functions (it was once used for private housing, as
a tavern and even as a stable). In 1999 it was closed for studies and work aimed at its
rehabilitation and future reuse as a church.
The church is composed of load bearing ordinary masonry walls around 1.4m thick. The
bedding mortar is a very weak and absorbent lime mortar. The stone elements are of a
sedimentary nature and include very porous sandstone, calcarenites and argillaceous
limestone, from the nearby cliffs of the Tagus River, most of these containing large amounts
of fossils of marine life forms.
The church was in very bad general condition at the time of this research. Large areas of the
masonry were exposed, due either to the deterioration of the plasters and renders or to their
removal. Sanding and crumbling of the masonry bedding mortar (Fig. 6.22) were very severe
particularly at the bottom of walls. Erosion depth was up to around 10 cm at several points.
Fig. 6.21 – São Sebastião Church: NE (front) façade in 1999

172 Chapter 6
Fig. 6.22 – São Sebastião: masonry
damage progresses as follows:
(i) lime plasters and renders
disappear due to progressive
sanding and crumbling; cement
repairs, apparently undamaged,
detach; (ii) sanding and crumbling of
the bedding mortar progresses on
the exposed masonry, as seen in
these pictures; (iii) fall of the stone
elements eventually leads to
masonry disintegration, as seen in
the picture on the right.
6.3 Methods
Several inspections of the five buildings were carried out. The information was gathered in a
specific form (Annex III), drawn up within the COMPASS project. The sampling / testing
methodology used in the several case studies was the following:
• Collection of samples, by powder drilling with 16 or 20 mm rotary drills was done at
several heights and depths, in selected walls of each building. Typically, depth
indents of 2 cm close to the surface and of 5 cm inside the walls were used, up to a
final depth of around 25 to 35 cm.
• The samples were stored in polyetilene bags, carefully sealed to avoid evaporation of
the moisture in the samples.
• MC profiles were obtained by measuring the weight loss of these powder samples,
after oven drying at 105ºC.
• HMC profiles were obtained by exposing these same samples to an environment of
20ºC and 95% RH until constant weight was achieved. Narrow-deep receptacles
were used here, as mentioned in section 3.6, mostly due to the very large number of
sample involved. In this case only a rough and qualitative evaluation of the salt
content is possible, as explained in Chapter 3, because the samples are
contaminated with not totally known salt mixtures. Yet, here, the HMC values are
used mostly to check whether a source of liquid moisture existed in the wall or if the
actual moisture in the samples could be solely due to hygroscopicity (BRE 1989).
• IC analyses were performed on some of the most superficial samples (0 to 2 cm or
0 to 5 cm depth). The Na+, K+, Mg2+, Cl-, NO3- and SO4
2- content of these samples
was thereby measured.
• Where efflorescence was visible, pure salt samples were collected and subjected to
XRD analysis. Also some contaminated mortar samples were subjected to XRD
analysis after elimination of the coarse fraction retained in the 106 µm sieve. In this
last case, the technique was only expected to help identify the substances that are
present in reasonably high amounts (more than around 2% in weight).
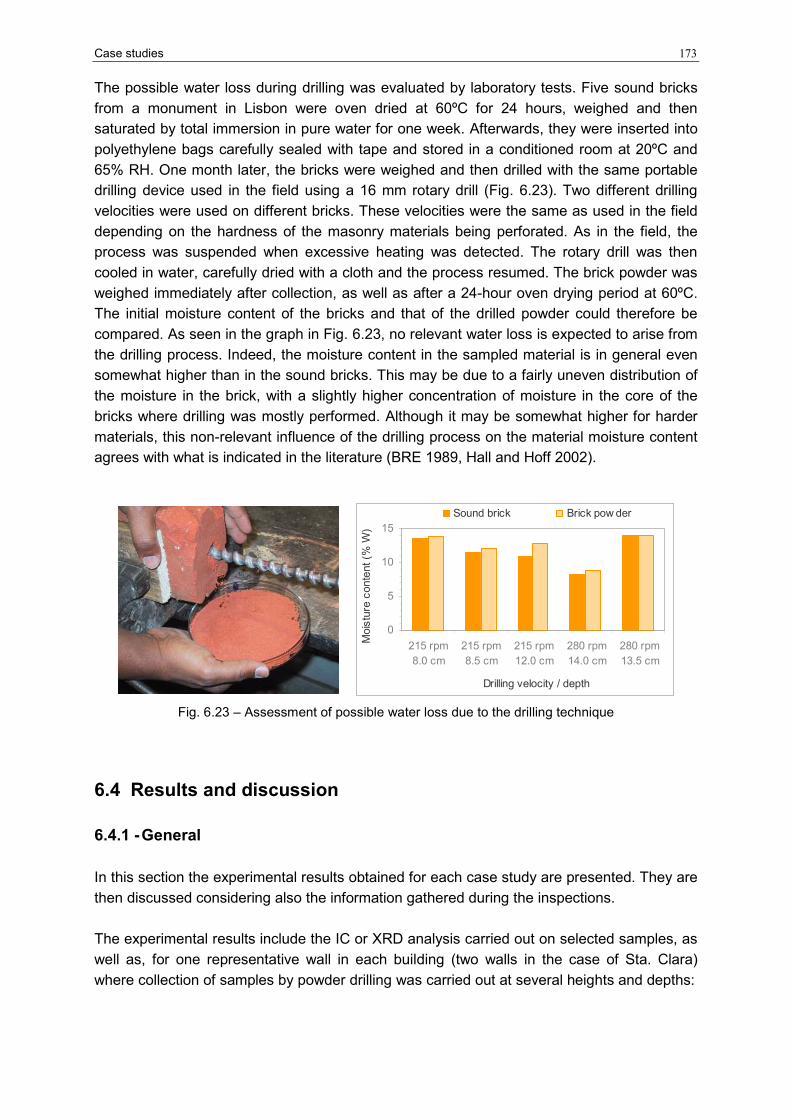
Case studies 173
The possible water loss during drilling was evaluated by laboratory tests. Five sound bricks
from a monument in Lisbon were oven dried at 60ºC for 24 hours, weighed and then
saturated by total immersion in pure water for one week. Afterwards, they were inserted into
polyethylene bags carefully sealed with tape and stored in a conditioned room at 20ºC and
65% RH. One month later, the bricks were weighed and then drilled with the same portable
drilling device used in the field using a 16 mm rotary drill (Fig. 6.23). Two different drilling
velocities were used on different bricks. These velocities were the same as used in the field
depending on the hardness of the masonry materials being perforated. As in the field, the
process was suspended when excessive heating was detected. The rotary drill was then
cooled in water, carefully dried with a cloth and the process resumed. The brick powder was
weighed immediately after collection, as well as after a 24-hour oven drying period at 60ºC.
The initial moisture content of the bricks and that of the drilled powder could therefore be
compared. As seen in the graph in Fig. 6.23, no relevant water loss is expected to arise from
the drilling process. Indeed, the moisture content in the sampled material is in general even
somewhat higher than in the sound bricks. This may be due to a fairly uneven distribution of
the moisture in the brick, with a slightly higher concentration of moisture in the core of the
bricks where drilling was mostly performed. Although it may be somewhat higher for harder
materials, this non-relevant influence of the drilling process on the material moisture content
agrees with what is indicated in the literature (BRE 1989, Hall and Hoff 2002).
0
5
10
15
215 rpm
8.0 cm
215 rpm
8.5 cm
215 rpm
12.0 cm
280 rpm
14.0 cm
280 rpm
13.5 cm
Drilling velocity / depth
Moisture content (%
W)
Sound brick Brick pow der
Fig. 6.23 – Assessment of possible water loss due to the drilling technique
6.4 Results and discussion
6.4.1 - General
In this section the experimental results obtained for each case study are presented. They are
then discussed considering also the information gathered during the inspections.
The experimental results include the IC or XRD analysis carried out on selected samples, as
well as, for one representative wall in each building (two walls in the case of Sta. Clara)
where collection of samples by powder drilling was carried out at several heights and depths:

174 Chapter 6
• a picture of the drilled wall with indication of the sampled heights;
• the type of materials found at the several heights and depths; these materials were
evaluated mostly by visual observation of the drilled powder which, then, indicates
only their probable nature;
• overall MC/HMC profile (for legibility reasons, only some depths are included);
• in-depth MC/HMC profile corresponding to the lower drilling hole, typically at 0.2m
from the ground; for one wall of Sta. Clara an in-depth profile at the height of 3.9 m is
also included.
6.4.2 - Salvas Chapel
Collection of samples was carried out in November 2003. The MC/HMC profiles (Fig. 6.24)
indicate that rising damp is very significant in Salvas Chapel. The damaging agents are
probably chloride and nitrate salts, as seen in Tables 6.2 and 6.3.
Table 6.1 - Salvas rear façade: sampled materials
Depth (cm) Height (m)
0-2 2-5 5-7.5 7.5-10 10-15 15-20 20-25 25-30
4.0 LM LM LM S S LM+S LM S+LM
3.0 LM S S S S S S+LM LM
2.0 - LM LM LM LM - ? LM
1.0 LM LM LM LM S S S S
0.5 LM B+LM B+LM B+LM LM+B LM+B LM+B LM+B
0.2 LM LM LM LM LM LM LM LM
LM – lime mortar; S – stone; B – brick
The grey shadows indicate the materials included in the MC/HMC profiles
4.0 m
3.0 m
2.0 m
1.0 m
0.5 m
0.2 m
Salvas - Back façade
0
1
2
3
4
0 5 10 15 20
Moisture content (%)
Heigth (m)
MC 0-2 cm HMC 0-2 cm
MC 2-5 cm HMC 2-5 cm
MC 25-30 cm HMC 25-30 cm
Salvas - Back façade
Drill at 0.2 m
0
5
10
15
20
0 10 20 30
Depth (cm)
Moisture content (%
)
MC HMC
Fig. 6.24 - Salvas rear façade: drilling location (left) and MC/HMC profiles (centre and right)
Rear Rear

Case studies 175
Table 6.2 - Salvas rear façade: IC on samples 0-2cm
Ion content (% W) Height
(m) Na
+ K+
Mg2+
Cl-
NO3-
SO42-
3.0 0.33 0.07 not detected 0.60 0.33 0.08
0.5 0.05 0.04 not detected 0.16 0.04 0.09
Low, medium and high anion content (WTA 1991)
Table 6.3 - Salvas rear façade:
XDR on fine fraction of render
sample collected at 2.1m height
and up to 3 mm depth
Halite (NaCl) +/++
Calcite, CaCO3 +++
Quartz, SiO2 ++
Feldspars vtg/+
Mica vtg
Fig. 6.24 (centre) shows that the actual moisture content at the base of the wall is very high,
much higher than the HMC, and that it decreases with the distance to the ground. This
suggests the existence of a source of liquid moisture at the base of the wall. In-depth
analysis of the MC/HMC variation in the lower drilling hole (Fig. 6.24, on the right) shows that
both the MC and the HMC are constant deep inside the wall, with the MC being much higher
(almost 10% higher) than the HMC. These patterns are characteristic of rising damp (BRE
1989, Henriques 1994). It is not known if there is a high groundwater level beneath the
church although the nearby presence of a fountain (Fig. 6.6) makes this a likely hypothesis. It
is also not impossible that the old reservoir or old fountain pipes are damaged and leak
considerable amounts of water.
The damaging salts deposit preferentially close to the maximum level(s) attained by the
moisture in a wall (Arnold 1982). The present MC/HMC profiles show that, in fact, the
stronger accumulation of salt occurs at around 2m from the ground.
IC (Table 6.2) indicates that chloride and nitrate (probably of sodium) are likely to be the
responsible salts. XRD analysis of a render sample collected at the height of maximum salt
content indicated halite as the main salt (Table 6.3). The nitrate is likely to originate from the
soil. The chloride may have the same origin (the groundwater may be contaminated by sea
water), be deposited by salt mist and further absorbed, either into the soil or directly by the
wall.
6.4.3 - Alhos-Vedros tide mill
Collection of samples was carried out in November 2003. In this case and despite the direct
contact of the mill foundations with the river water (Fig. 6.7), rising damp does not seem to
be the fundamental problem here (Fig. 6.25). The damaging salts are mostly sodium
carbonate and bicarbonate salts, together with some sodium chloride (Table 6.5).
Table 6.4 - Tide mill NW wall: sampled materials.
Depth (cm) Height (m)
0-2 2-5 5-7.5 7.5-10 10-15 15-20
2.7 HM HM LM+HM LM LM LM
2.0 HM HM LM+HM LM LM LM
1.5 HM HM LM+HM LM LM B
1.0 HM HM S S S S
0.5 HM HM LM+S LM+S LM+S LM+S
0.15 HM HM LM+HM LM LM+S LM+S
HM – hydraulic mortar, LM – lime mortar; S – stone; B – brick

176 Chapter 6
0.15 m
2.0 m
1.5 m
1.0 m
0.5 m
2.7 m
Alhos Vedros tide-mill - N w all
0
1
2
3
0 10 20 30 40
Moisture content (%)
Heigth (m)
MC 0-2 cm HMC 0-2 cm
MC 2-5 cm HMC 2-5 cm
MC 15-20 cm HMC 15-20 cm
Mill N w all - Drill at 0.15 m
0
10
20
30
40
0 5 10 15 20
Depth (cm)
Moisture content (%
)
MC
HMC 95%
HMC 80%
Fig. 6.25- Tide mill NW wall: drilling location (left) and MC/HMC profiles (centre and right)
Table 6.5 - Tide mill NW wall: XDR on efflorescence collected up to 0.5m in height from the pavement on the drilled area
Termonatrite - Na2CO3.H2O +
Gaylussite - Na2Ca(CO3)2.5H2O +
Trona - Na2H(CO3)2.2H2O +
Halite - NaCl +
Calcium hydroxide - Ca(OH)2 +
Calcite - CaCO3 +
Quartz - SiO2 ++
Feldspars +
Mica +
Caulinite +
Both the overall MC/HMC profiles and the in-depth MC/HMC profile at 0.15m height
(Fig. 6.25) show that, deep inside the wall, the MC is low and similar to the HMC at 95% RH.
Therefore, rising damp in the wall is probably low, part of the actual moisture being of
hygroscopic origin. Although detailed information on the mill foundations is not available,
visual observation from the exterior (Fig. 6.7) suggests that large stone blocks were used
with little or no significant presence of bedding mortars. Therefore, it is likely that the rise of
damp is drastically hindered by these open joints.
In Alhos-Vedros tide mill, decay is mostly confined to the new plaster (Figs. 6.8 and 6.9).
XRD analysis (Table 6.5) showed that, although sodium chloride is present (probably carried
by some capillary rising moisture or by salt mist), efflorescence is mainly composed of alkali-
carbonate salts. Alkali-carbonate salts are possibly derived from the hydraulic-lime used in
the plaster (Arnold 1982, Arnold and Zehnder 1989). This new plaster was used to repair the
bottom areas of the walls and those around the NW windows of the ground floor. The fact
that the repair involved much larger areas on the NW than on the SE wall suggests that salt
damage in the mill was also more intense at N before this restoration.

Case studies 177
The higher damage at the NW wall, around the windows and, particularly, at the North facing
corner, suggests a relation between the occurrence/evolution of damage and the fact that
these are colder areas, where evaporation is lower and the risk of dew point condensation is
higher. The hypothesis of dew point condensation being a key source of moisture
(Gonçalves et al 2005) in the mill was corroborated by direct observation during one of the
inspections, as seen and described in Fig. 6.10.
Dew point condensation may occur on or in cold walls. Particularly when the air is humid,
namely during or after rainy days, if the outside air temperature rises due to solar radiation,
the absolute humidity increases because hotter air can hold a higher amount of water
vapour. When this air comes in contact with colder surfaces its temperature drops. In
consequence, the relative humidity of the air increases. If the saturation humidity is
exceeded, dew point condensation occurs.
Posterior research (Cardoso 2006), to which the author contributed, was performed on a
similar tide mill, Corroios tide mill, also located in the Tagus estuary. This research included
environmental monitoring over a period of 14 months by means of a thermohygrometer. Very
high RH was systematically measured, namely in the milling room which is similar to that of
Alhos-Vedros tide mill. The maximum RH in this room was between 75% in July and more
than 90% in November and December. Although the time scale was probably not detailed
enough for sporadic condensation events to be detected, it is likely that such a high RH in
the middle of the room could give rise to surface condensation on the walls that were
probably often colder than the surrounding air.
6.4.4 - Despacho House
Collection of samples in Despacho House was carried out in April 2004. As in Alhos-Vedros
tide mill, the salts are mostly alkali (sodium) carbonate salts (Table 6.7). But here, differently,
the moisture content in the walls is rather high (Fig. 6.26).
Indeed, both the overall MC/HMC profiles (Fig. 6.26, centre) and, particularly, the in-depth
MC/HMC profile at 0.2m height from the pavement (Fig. 6.26, right) show that, deep inside
the wall, the MC is more than 7% higher than the HMC at 95% RH.
Table 6.6 - Despacho internal wall: Sampled materials
Depth (cm) Height (m)
0-2 2-5 5-10 10-15 15-20 20-25 25-30
2.6 M1 B+LM B B+LM LM+B LM+B LM+B
2.1 M1 B+LM B+LM B+LM B+LM LM LM
1.5 M1 LM LM+B LM+B - LM LM
0.7 M1 LM LM LM LM+B LM LM
0.2 M1 LM LM LM LM LM LM
M1 – (lime?) mortar, LM – lime mortar; B - brick

178 Chapter 6
0.2 m
2.6 m
2.1 m
1.5 m
0.7 m
Despacho - internal w all
0
1
2
3
0 10 20 30 40
Moisture content (%)
Heigth (m)
MC 0-2 cm HMC 0-2 cm
MC 2-5 cm HMC 2-5 cm
MC 25-30 cm HMC 25-30 cm
Despacho internal w all
Drill at 0.2 m
0
5
10
15
20
0 10 20 30
Depth (cm)
Moisture content (%
)
MC HMC
Fig. 6.26 - Despacho internal wall: drilling location (left) and MC/HMC profiles (centre and right).
Table 6.7 - Despacho internal wall: XDR on efflorescence collected on the same internal wall
Sampling height (m) Crystalline compounds
1.1 1.5 2.1 2.6
Hydrous sodium carbonate, Na2CO3.7H2O ++ + - -
Natron, Na2CO3.10H2O + ++ - -
Gaylussite, Na2Ca(CO3)2.5H2O - + + ++
Quartz, SiO2 - - vtg -
Cristobalite, SiO2 ? ? + +
Calcite, CaCO3 + + ++ +/++
Rutile, TiO2 + + ++ ++
It is not clear if this is a normal case of rising damp or if there was also a relevant
accumulation of water inside the walls during the 2001 flood. The latter is suggested by the
in-depth profile (Fig. 6.26, on the right) which shows that the MC clearly increases towards
the surface, nonetheless the HMC is overall constant from the 10-15 cm depth up to the
surface. In any case, the water repellent paint is possibly lowering the wall drying rate and,
therefore, inducing larger damaged areas: water repellent layers only permit vapour
migration and, hence, “push” the drying front into the material.
XRD shows (Table 6.7) that efflorescence is mainly composed of alkali (sodium)-carbonate
salts. Hence, as in Alhos-Vedros tide mill, the main source of salts is probably the
plaster/paint system, though it was not possible to know whether it is the plaster or the
silicate-based paint.
Similarly to Salvas Church where very high moisture content also exists in the masonry,
damage is concentrated on the upper and not on the lower part of the wall. In the case of
Salvas Church the salts originate (at least partially) from the ground. It is probable that the
ground solutions only reach saturation after considerable evaporation, that is, further on their
way up the wall. Here, in Despacho House, it is likely that the high moisture content at the
base of the walls is preventing crystallization of the carbonate salts.

Case studies 179
6.4.5 - Cloister of Sta Clara-a-Nova Monastery
Collection of samples was carried out in November 2003 (Fig. 6.27) and April 2004
(Fig. 6.28). On-site observations showed that damage systematically starts next to stone
elements (window frames, arches or pavement), as seen in Fig. 6.14, and that Sta. Clara
stones “exude” liquid water after cold days, when the air heats up (Figs. 6.19 and 6.20). Dew
point condensation on the stone elements or hygroscopic absorption by these elements were
therefore considered possible sources of moisture.
In the case of the upper damage spots, infiltration from the first floor was also a possibility,
since both the floor and roof on the first floor were in bad condition. For the lower damage
spots, infiltration of rainwater from the cloister garden, which has deficient drainage
conditions, into the upper soil layer was another hypothesis.
Table 6.8 – Sta. Clara NW wall: Sampled materials
Depth (cm) Height (m)
0-2 2-5 5-10 10-15 15-20 20-25 25-30 30-35
4.9 CM CM+LM LM LM LM LM LM LM
3.9 CM CM S S S S S S
3.4 CM CM+LM LM LM LM LM LM LM
2.4 CM CM S LM – LM LM LM
1.4 CM CM+S S S S – LM LM
0.5 CM CM S+CM S S S S S
CM – cement mortar; LM – lime mortar; S – stone
4.9 m
3.9 m
3.4 m
2.4 m
1.4 m
0.5 m
Sta. Clara - NW w all
0
1
2
3
4
5
0 5 10 15 20 25 30 35 40
Moisture content (%)
Heigth (m)
MC 0-2 cm HMC 0-2 cm
MC 2-5 cm HMC 2-5 cm
MC 30-35 cm HMC 30-35 cm
Sta. Clara NW w all
Drill at 0.2 m
0
5
10
15
20
0 10 20 30
Depth (cm)
Moisture content (%
)
MC HMC
Sta. Clara NW w all
Drill at 3.9 m
0
5
10
15
20
0 10 20 30
Depth (cm)
Moisture content (%
)
MC HMC
Fig. 6.27 - Sta Clara NW wall: drilling location (left) and MC/HMC profiles (centre and right)
In the case of the upper damage spot (Fig. 6.27), the overall MC/HMC profile and the
in-depth profile at 0.2m height from the ground suggest that rising damp is very limited in this
wall. As seen in the in-depth profile, the actual moisture content deep inside the wall is only

180 Chapter 6
around 2% higher than the HMC. Therefore, the occurrence of damage at such high
distances from the ground is hardly assignable to rising damp. Further, since this wall was
drilled during the rainy season, it is not likely (though certainly not impossible) that much
higher moisture contents exist in other periods.
The in-depth MC/HMC profile (Fig. 6.27, right) at the height of maximum damage (3.9m)
shows that moisture decreases towards the interior of the wall and that, at the deepest
points, the MC is similar to the HMC. A superficial source of liquid moisture is therefore likely
to exist.
Table 6.9 – Sta. Clara NE wall: Sampled materials
Depth (cm) Height (m)
0-2 2-5 5-10 10-15 15-20 20-25 25-30
4.0 CM LM RM RM RM RM RM
2.5 CM LM+S S S S S S
1.5 CM LM+S S S S S S
0.7 CM+S S S S+LM S+LM S+LM S
0.2 CM LM+S S+RM RM RM RM RM
CM – cement mortar; LM – lime mortar;
RM – coarse argilaceous mortar; S – stone; B – brick
4.0 m
1.5 m
2.5 m
0.7 m
0.2 m
Sta. Clara - NE w all
0
1
2
3
4
0 5 10 15 20 25
Moisture content (%)
Heigth (m)
MC 0-2 cm HMC 0-2 cm
MC 2-5 cm HMC 2-5 cm
MC 25-30 cm HMC 25-30 cm
Sta. Clara NE w all
Drill at 0.2 m
0
10
20
30
0 10 20 30
Depth (cm)
Moisture content (%
)
MC HMC
Fig. 6.28 - Sta Clara NE wall: drilling location (left) and MC/HMC profiles (centre and right)
In the case of the wall with damage close to the pavement (Fig. 6.28, centre), the overall
MC/HMC profile shows that the MC decreases with height. However, the in-depth MC/HMC
profile (Fig. 6.28, right) shows that the actual moisture content (MC) decreases inside the
wall towards its interior and that, at the deepest point, the MC is lower than the HMC. A
superficial source of liquid moisture is therefore likely to exist also in this case.
The similarity of the in-depth profiles of the two walls at the height of maximum damage is
interesting because they concern completely different heights: 3.9m (Fig. 6.27) or 0.2m
(Fig.6.27). Absorption of (hygroscopic or condensed) moisture from the stone elements

Case studies 181
(upper damage spots) or from the ground (lower spots) seems, thus, a strong hypothesis.
However, is possible that, for example, the water used for washing the stone pavement has
also a contribution in the case of the lower spots.
Dew point condensation can occur when hotter air comes into contact with colder walls
because the air RH increases and the saturation humidity may thereby be exceeded. This
mechanism can also account for hygroscopic absorption by salt contaminated walls. Indeed
when the air RH increases next to colder surfaces, the RHeq of the contaminant solutions can
be surpassed and hygroscopic absorption may therefore take place.
XRD (Table 6.10) indicates a strong presence of alkali-carbonate salts both in the upper and
in the lower damaged spot. In the lower spot some nitrate was also identified. It is likely that
the carbonate salts originate from the cement render itself. The nitrate probably comes from
the soil. This suggests that a (low) influx of moisture from the ground exists which is in line
with the slight decrease of the MC over height (Fig. 6.27 and 6.28) possibly due to bad
drainage of the cloister garden or to penetration of water during cleaning of the pavement.
High nitrate contents were also found in the lower spot by IC (Table 6.11). In the upper
damage spot the IC revealed somewhat lower nitrate content. The significance and origin of
the nitrate in this upper damage spot are unknown.
Table 6.10 – Sta. Clara: XDR on efflorescence or sanded surface material
Crystalline compounds
NW wall (upper spot)
Efflorescence
1.5 m from ground
NE wall (lower spot)
Sanded surface material
0.2 m from ground
Trona, Na3H(CO3)2.2H2O ++/+++ ?/vtg
Gaylussite, Na2Ca(CO3)2.5H2O - +
Niter,KNO3 - ?/vtg
Calcite, CaCO3 ++/+++ +++
Dolomite, CaMg(CO3)2 - +
Quartz, SiO2 vtg +
Table 6.11 – Sta. Clara: IC on samples 0-2cm
Ion content (% W) Façade Height (m)
Na+
K+
Mg2+
Cl-
NO3-
SO42-
2.5 0.05 0.11 not detected 0,03 0,02 0,07
0.7 0.31 0.26 0.04 0,32 0,71 0,16 NE
(lower spot)
0.2 0.35 0.25 not detected 0,43 1,71 0,17
4.2 0.72 0.60 not detected 0,37 0,22 0,11
3.0 0.38 0.25 not detected 0,46 0,42 0,18 SE
(upper spot)
0.2 0.47 1.27 not detected 0,10 0,16 1,47
Low, medium and high anion content (WTA 1991)

182 Chapter 6
6.4.6 - S. Sebastião Church
Sampling was carried out in November 2003. The walls were found to be practically dry (Fig.
6.29) and the salts seem to be mostly nitrate salts (Table 6.12).
Table 6.12 – S. Sebastião exterior: sampled materials
Depth (cm) Height (m)
0-5 5-10 10-15 15-20 20-25 25-30 30-35
3.5 LM LM LM+S LM+S S S+LM S+LM
2.5 LM LM+S LM+S LM LM LM S
1.5 LM LM LM+S S S S S
0.5 LM LM+S S S S S S
0.2 LM LM LM LM LM+S LM+S LM+S
LM – lime mortar; S – stone
3.5 m
2.5 m
1.7 m
0.2 m
0.5 m
São Sebastião - external w alll
0
1
2
3
4
0 5 10 15 20 25
Moisture content (%)
Heigth (m)
MC 0-5 cm HMC 0-5 cm
MC 5-10 cm HMC 5-10 cm
MC 20-25 cm HMC 20-25 cm
S. Sebastião - ext. w all
Drill at 0.2 m
0
5
10
15
20
25
0 10 20 30
Depth (cm)
Moisture content (%
)MC HMC
Fig. 6.29 - S. Sebastião: drilling location (left) and MC/HMC profiles (centre and right)
Table 6.13 – S. Sebastião exterior: IC on samples 0-2cm
Ion content (% W) Height (m)
Na+
K+
Mg2+
Cl-
NO3-
SO42-
1.5 0.06 0.01 nd 0.12 0.12 0.06
0.5 0.27 0.13 nd 0.48 0.71 0.49
0.2 0.34 0.19 nd 0.54 1.01 0.26
Low, medium and high anion content (WTA 1991)

Case studies 183
As seen in the MC/HMC profiles (Fig. 6.29), the HMC and the MC profiles have similar
shapes, but the HMC values are clearly higher. This indicates that the actual moisture
content in the wall is probably of hygroscopic origin. The decrease in the HMC with height
indicates that the salts come from the ground, although the rising damp mechanism was
probably not active at the time of sampling. The salts concentrate close to the ground, as
indicated by the decrease in the HMC with height, which suggests that the moisture contents
involved in salt transport and deposition are not, at least permanently, very high.
Nitrate seems to be the main ion involved (Table 6.13), which is consistent with the
hypothesis of capillary rise from the ground. It is interesting that, despite vestiges of marine
life forms exist in the masonry stone, this masonry does not seem to be a relevant source of
salts.
6.5 Research on experimental test panels
6.5.1 - Materials and methods
Test panels of two traditional rendering systems and three industrial systems specific for
salt-loaded walls were made (Fig. 6.30) on the NW façade of S. Sebastião Church.
Fig. 6.30 – Test panels: traditional renders A and C and industrial renders D, E and F
A and C are traditional rendering systems based on air-lime or air-lime and cement,
respectively. D, E and F are industrial systems currently commercialised in Portugal that are
claimed to be “dehumidifying” systems, that is, systems able to provide a final surface free of
moisture and salts. The stated working principle of systems D and E is salt accumulation.
The working principle of system F is not clear but its (stated) water repellent properties
suggest that it is probably a salt-blocking system.
The test panels had flat dimensions of around 2m x 2m. Their characteristics are described
in Table 6.14.
A C D E F

184 Chapter 6
Table 6.14 - Rendering systems in the test panels
Panel
(system)
Coat
application order Mortar Volumetric composition / expressed working principle
Coat
thickness
1st A 15 mm A
(traditional
air-lime render) 2nd A
1 : 1.5 : 1.5 (Lime : ST : SC) 15 mm
1st C1 1 : 1 : 6 (CII : Lime : ST) 5mm max*
2nd C2 15 mm
C
(traditional
lime-cement
render) 3rd C2
1 : 3 : 12 (CII : Lime : ST) 15 mm
1st D1
Adherence coat
Calcareous aggregates, hydraulic binders without C3A and
additives (for promoting adherence and for obtaining a high
porosity and hydro-repellence)
10 mm
2nd D2 25 mm
3rd D2
Accumulating coat
Based on white natural hydraulic lime and lightweight
aggregates (hydrated silicates of expanded aluminium) 25 mm
D
(industrial
salt-accumulating
system)
4th D3
Finishing coat
Fine white mortar based on natural hydraulic binders, air lime
and sand (does not include cement)
10 mm
1st E1
Adherence coat
Hydraulic lime, pozzolana, siliceous and calcareous aggregates 5 mm
2nd E2
Accumulating coat
Hydraulic lime, pozzolana, siliceous and calcareous aggregates 15 mm
E
(industrial
salt-accumulating
system) 3rd E3
Finishing hydro-repellent coat (grey)
Hydraulic lime, pozzolana, siliceous and calcareous aggregates 5 mm
1st F1
Adherence coat
Hydraulic lime, siliceous sand 5 mm
2nd F2 20 mm
F
(industrial system
with no clear
working principle) 3rd F2
Hydro-repellent coat (grey)
Hydraulic lime, siliceous sand 20 mm
Lime – Dry hydrated lime LUSICAL; CII – Portland cement (type II); ST – Sand from the Tagus River
SC – Yellow pit sand from Corroios; * Discontinuous coat
The mortars that composed the three industrial systems, as well as the air-lime mortar of
system A which served as a reference, were characterized by means of capillary
unidirectional absorption tests (CEN 2002). These results are presented in Fig. 6.31. D3
mortar was not tested, in the first place, because there was not enough product available
and, ultimately, because its capillarity coefficient was not necessary for interpreting the
behaviour of the systems, as it will be seen in section 6.5.3.
0
10
20
30
40
0 5 10 15
Time (sqrt(h))
Absorbed water (kg/m
2)
D1 D2 A (lime-mortar)
(13.3)
(16.3)
(30.4)
0
5
10
15
20
25
0 5 10 15 20
Time (sqrt(h))
Absorbed water (kg/m
2)
E1 E2 E3 A (lime-mortar)
(16.3)
(20.1)
(1.9)
(1.7)
0
5
10
15
20
0 5 10 15 20
Time (sqrt(h))
Absorbed water (kg/m
2)
F1 F2 A (lime-mortar)
(16.3)
(4.1)
(0.8)
Fig. 6.31 – Capillary water absorption of the three industrial systems and traditional mortar A.
The numbers in brackets correspond to the capillarity coefficient, in kg.m-2.h
-1/2.

Case studies 185
It is interesting to note that, for mortars D2 and E2 which correspond to the layer where salts
are supposed to accumulate in either system, the absorption curves show several distinct
slopes (Fig. 6.31). The same had been observed for salt-accumulating MEP and Parlumière
plasters (Fig. 5.5). These multi-slope absorption curves indicate the existence of distinct
migration kinetics in the same porous material, as explained in section 4.2.2 and depicted in
Fig. 4.3. Also water-repellent mortars E3 and F2 show different absorption slopes, albeit less
markedly. On the contrary, mortars D1, E1 and F1, similarly to traditional lime mortar A, only
show an initial dominant slope.
Performance of the rendering systems was monitored during three years, by visual
observation of the tests panels. At the end of this period, HMC measurements were carried
out:
• on bedding-mortar or stone pieces collected at the surface of the masonry, to allow
comparing the salt-content of the two types of material;
• on samples collected by powder-drilling across each rendering system, in order to
obtain in-dept HMC profiles that could disclose the salt-accumulating behaviour of the
systems.
Collection of samples by powder drilling and the HMC measurements were carried out as
described in section 6.3.
6.5.2 - Execution of the test panels
Before making the test panels, the masonry was cleaned, as illustrated and explained in
Fig. 6.30. These cleaning operations together with the application of the 15 layers that
compose the five rendering systems (Table 6.14) were carried out over a total of 10 working
days and over a period of two months.
Fig. 6.32 – Before making the panels,
the substrate was prepared as follows:
(i) the old lime render, in poor
condition and with many lacunas, was
removed; (ii) the old lime mortar in the
joints between masonry stones was
removed up to a depth of around
15mm; (iii) the masonry was brushed
to eliminate as much loose material as
possible; (iv) all recesses deeper than
30 mm were filled with lime mortar A
and small stones of the original
masonry stone type.

186 Chapter 6
All systems, except industrial system E, were applied by a mason with general experience in
plastering and rendering. The application of industrial systems D and F was carried out under
direct instructions of technicians from the supplying companies. Industrial system E was
mostly applied by a specialized mason who usually does practical demonstrations with this
particular product. The general mason collaborated with him and was able to learn the
technique through practice. After some time during the application of each coat, the general
mason was able to carry out the application on his own.
The application of both the traditional rendering systems and industrial system E were
successful. Only in the case of mortar E2 was the recommended amount of mixing water
found to be too high but the problem was promptly detected and corrected by the specialized
mason. In contrast, numerous problems also arose during the application of industrial
systems D and F:
• In some cases (D1 and D2), the recommended amount of mixing water was found to
be insufficient for achieving an acceptable workability. New mixings had to be done
and, for this reason, the available product was only sufficient for a 1.5 m wide panel.
• One mortar (D2) was initially applied in a thickness higher than the maximum
recommended in the written documentation (30 mm). The fresh layer detached
(Fig. 6.33 iv) and fell down. The application had to be repeated by using two coats of
25 mm applied with a one day interval.
• Mortar D3 cracked immediately after application (Fig. 6.33 vi).
• It was very difficult to finish the last layer of mortar F2 (smoothening with trowel). The
fresh mortar stuck to the trowel, even two hours after the application, and the
operation systematically led to a very irregular surface (Fig. 6.33 ii). The next day,
more mortar was prepared to try to fill in the numerous cavities on the surface. But
the operation was not fully successful and even after the completion of this procedure
the final surface was much more irregular than reasonable or expected.
Fig. 6.33 – Test panel execution: (i) application of the last coat of traditional lime render A; (ii) irregular
surface of industrial F2 layer; (iii) application of industrial E3 layer; (iv) detachment of fresh D2 layer;
(v) application of industrial D3 layer; (vi) crack on fresh D3 layer.
(i)
(ii)
(iii)
(iv)
(v)
(vi)

Case studies 187
6.5.3 - Evaluation of the systems after three years of natural exposure
Three years after the applications, there was apparently no damage by salt crystallization in
any of the test panels. However, cracking was observed on all systems except lime-cement
render C (Fig. 6.34):
• A and E showed some disperse and long cracks apparently caused by differential
movement of the masonry;
• F showed numerous micro-cracks;
• D3 showed intense “craquelet”, as well as very intense accumulation of dirt.
Fig. 6.34 – Cracking of the rendering systems three years after their application
The deposition of salt across the systems was evaluated by means of HMC profiles.
Sampling was performed in such a way as to always obtain the bedding mortar as substrate
material because salt deposition seems to be more significant in this bedding-mortar than in
the masonry stone (Fig. 6.35). Nonetheless, the HMC profiles (Fig. 6.36) show that the salt
content in the substrate varied significantly from panel to panel. Hence, only a rough
comparison of the different systems is possible.
These HMC profiles (Fig. 6.36) indicate that:
• The three industrial renders (D, E and F) and also the traditional lime-cement render
(C) seem to be able to prevent salts from reaching the surface. In contrast, the
traditional pure lime render (A) transported the salts to the surface.
• Lime-cement render C tends to accumulate the salts in the adherence coat.
• The systems with a very absorbing first coat (A and D) seem to be more able to
transport the salts from the substrate to the render: in both cases, the substrate and
the first render coat have similar HMC values.
• The systems with a low absorbing first coat (E and F) seem to induce a more
significant deposition of salt in the substrate: the HMC decreases from the substrate
to the first render coat.
A
E
F
D
1 cm 1 cm 1 cm 1 cm

188 Chapter 6
0
5
10
15
20
25
HMC 20ºC 95%RH (%)
mortar
stone
Fig. 6.35 - Comparison
between the salt content
of the masonry materials
in the NW façade, at
around 0.3m height from
the ground.
Sampling heigth = 0.4 m
0
2
4
6
8
10
0 1 2 3 4
Depth (cm)
HMC 20ºC 95% (%
)
C1 A
C2 Sub Mort
Sampling heigth = 0.4 m
0
10
20
30
40
50
0 2 4 6 8
Depth (cm)
HMC 20ºC 95% (%)
D1 D2 D3
E1 E2 E3
F1 F2 Sub Mort
Fig. 6.36 – In-depth HMC profiles at 0.4m height from the ground

Case studies 189
6.6 Discussion
6.6.1 - Main causes of decay
Table 6.15 summarizes the decay patterns and main diagnostic hypothesis for the five case
studies.
Table 6.15 - Summary of decay and diagnosis
Salts Case study
and location
of the decay
Type of
plaster/render Main degradation patterns
Nature Probable
origins
Probable origins
of moisture
Salvas
Chapel
Exterior
Traditional lime
render (with
some cement)
and lime wash
- Cracking of render/paint
system (damage develops
preferentially in the cracks)
- Sanding and erosion of the
render/paint system
- Most decayed spots are
located at the middle height
of the walls.
- Halite
- Nitrate
(probably
of sodium)
- From the soil
- The chloride
may also be
deposited by
salt mist
Rising damp
Alkali
(sodium)
carbonate
salts
Hydraulic
plaster Alhos-
Vedros
tide mill
Interior
Traditional
hydraulic-lime
mortar and
emulsion paint
- Efflorescence, peeling of
paint and sanding of plaster
- Damage close to the
pavement and around the NW
windows
- Damage more intense at N Halite River water
Dew point
condensation and
some rising damp
Despacho
House
Interior
Traditional
air-lime plaster
and potassium
silicate-based
paint with
water repellent
additives
- Cracking of render (damage
develops preferentially in the
cracks)
- Efflorescence, blistering and
rupture of paint, sanding of
render
- Degradation appears on the
upper part of the walls
Alkali
(sodium) -
carbonate
salts
Plaster / paint
system
Rising damp
(accumulation of
water during the
2001 flood is also
possible)
Alkali
carbonate
salts
Render
Sta. Clara
cloister
Exterior
Traditional
cement-based
render and
common
emulsion paint
- Detachment of the paint or of
a render layer corresponding
to the paint penetration depth
- Sanding of render, crumbling
of render/paint system
- Degradation close to the
ground or higher on walls,
next to stone elements
Nitrate and
chloride
Possibly
the soil
- Condensation or
hygroscopic
absorption by the
stone and further
migration to the
render
- Penetration of
ground water due
to bad drainage of
the garden
S.
Sebastião
Church
Interior
and
exterior
- Traditional
lime plasters
and renders.
- Cement-
based repairs
- Sanding and crumbling of lime
plaster and renders
- Detachment of cement repairs
- Sanding and crumbling of the
masonry bedding-mortar
Chloride and
nitrate From the soil Minor rising damp

190 Chapter 6
Four of the five case studies (Salvas, Alhos-Vedros, Despacho and Santa Clara) show
pathological decay situations with the following likely causes:
• Crystallization of alkali-carbonate salts was the fundamental cause of decay in three
out of the five case studies: Alhos-Vedros, Despacho house and Santa Clara. As
explained in section 2.2.4, carbonate salts originating from high alkali content materials
are often involved in salt decay processes (Schaffer 1932, Arnold 1981). It is likely that
the use of high alkali content materials is a recurrent cause of salt decay in Portugal.
This type of decay arises probably in many cases from the use of cement-based
mortars. However, in the case of Despacho House it is not know whether the silicate-
paint had any contribution. Two of the case studies (Alhos-Vedros and Despacho
House) concerned recent restoration interventions. This suggests that the use of high
alkali content materials can probably account for several of the cases where damage is
worsened after restoration.
• Significant rising damp was found in Salvas Church and Despacho House.
• Surface dampness was apparently the main source of moisture in Alhos-Vedros and
Santa Clara. The moisture arises probably from dew point condensation, as explained
in sections 6.4.3 and 6.4.5. However, as pointed in section 6.4.5, hygroscopicity is
another possible source of moisture. In both monuments, the damaging salts were
alkali carbonate salts. It is possible that surface moisture is a particularly effective
decay agent in cases such as these where the salts form mostly at the exposed surface
of the walls.
• Cracking of plastering or rendering systems seems to worsen surface decay. This was
observed in Despacho House and Salvas Church: the cracks seem to be critical points
where damage preferentially starts and progresses faster. Indeed, although large
cracks are mostly expected to enhance evaporation, capillary cracks may enhance
liquid transport to the surface and, hence, locally accelerate the decay rate. In both
buildings, crack networks (the so-called “craquelet” pattern) are observed (Figs. 6.5 and
6.12). This pattern is typical of plasters and renders with a strong drying shrinkage and
is usually attributed to an excess of binder or of fine aggregates in the mortar,
application of too thick plaster/render layers, too dry substrate, application carried out
during hot and dry weather or direct incidence of solar radiation on the fresh mortar
(Veiga 2004, for instance). It is not known whether in Salvas Church and Despacho
House any of these factors was significant. But one common feature of these two
buildings is the existence of very high moisture contents in the masonry. Whether this
factor could contribute to enhance the drying shrinkage, perhaps somewhat similarly to
an excess of mixing water, is a hypothesis that requires further research.
S. Sebastião Church is a different case. There is no evidence of this being a pathologic
situation as regards salt decay even though reasonable amounts of nitrate and chloride were
found at the base of the wall. These salts are likely to come from the soil. Nitrate, in
particular, may be related with the church having worked as a stable, as mentioned above.
This masonry is probably subjected to seasonal events of capillary rise of moisture from the
ground but nothing points at high amounts of moisture being involved. All things considered,
this is probably a normal situation for an old building with thick masonry walls built in direct
contact with the ground and not far from the sea. Damage seems to result mostly from the
absence of adequate (sacrificial) plasters and renders and, ultimately, from a total lack of
maintenance.

Case studies 191
6.6.2 - Diagnosis
The work presented in this chapter demonstrates that an adequate diagnostic methodology
includes both visual inspection and sampling/testing.
Indeed, “blind” sampling/testing will generally not be enough namely because sophisticated
techniques, for instance of environmental monitoring, are normally not available nor are they
feasible. Therefore, expertise can provide valuable complementary information on the
causes of damage.
For instance, in Sta. Clara and Alhos-Vedros the possible sources of moisture were identified
by observation and further interpretation of the visible damage patterns.
However, simple visual observation may sometimes lead to wrong conclusions. For example,
in Alhos-Vedros tide mill, whose foundations are in direct contact with water, rising damp
would be a straightforward hypothesis as regards the source of moisture. But the MC/HMC
profiles indicated that rising damp is limited and, hence, a different source of moisture had to
be sought. Indeed, as stated by Massari and Massari (1993), as far as dampness is
concerned, “reality often contradicts good sense and the obvious hypotheses are frequently
false”. Moreover, it is not possible to distinguish visually the type of salt involved in a decay
process. And, as seen in the cases of Alhos-Vedros, Despacho and Santa Clara, an
accurate diagnosis is often only possible when that information is available.
Diagnosis must focus on the two predisposing factors of salt decay: soluble salts and
moisture. However, in Portugal as in other European countries (Gonçalves 2002b,
TNO 2002), it is not common to perform preliminary inspections based on an oriented
methodology and with adequate auxiliary methods of diagnosis. Hence, it is likely that salt
and moisture sources are often not properly identified. For example, in Salvas Church and
Despacho House, no adequate measures to prevent rising damp were adopted in the recent
restorations because the situation was not properly diagnosed. Further, in none of the cases
where carbonate salts were present, the hypothesis of the plastering or rendering system
being the main source of salt had ever been put because the type of salt had not been
determined by adequate analyses.
6.6.3 - Test panels
Although the use of test panels may allow a more realistic evaluation of the behaviour of
plasters and renders in relation to salt crystallization, the work done in S. Sebastião Church
shows that these are not straightforward tests: (i) it takes considerable time and effort to
properly prepare the substrate and make the test panels; (ii) years of exposure may be
necessary to obtain visible damage; (iii) moisture and salts are often heterogeneously
distributed in walls and this may complicate the analysis of the results .

192 Chapter 6
Application of the industrial renders made it clear that, although well written or even oral
instructions are certainly important, they are not enough to ensure successful application.
Plasterers must also gain practical experience with the products. Indeed, it was not possible
to correctly apply two of the systems (D and F), even when the application was done by an
experienced mason under direct supervision of technicians from either supplying company.
The third system (E) was applied by a mason from the supplying company. This mason had
specific training and usually does practical demonstrations with his product. The application
was successful, either when carried out by him or when carried out by our mason, who was
able to learn the technique from his colleague.

Chapter 7 – Summary, conclusions, and future
perspectives
7.1 Summary
This thesis was aimed at understanding the behaviour of plasters and renders on
salt-loaded walls. The research was carried out through the following main steps:
• The current state-of-the-art and state-of-the-practice in salt decay features were
accessed focusing particularly on old plastered/rendered buildings and their
conservation practice in Portugal.
• Two general laboratory techniques, for RH control and salt content
measurement, were investigated in order to decide whether and under which
conditions they could be adequate experimental tools.
• Drying of salt-loaded materials was studied which allowed a better
understanding of the influence of soluble salts on the drying of porous
materials, mechanisms of salt-induced dampness and evaporation-induced salt
distribution in masonries.
• The behaviour of plasters and renders in relation to salt crystallization was,
afterwards, investigated. By this work, the influence of various factors (type of
salt, plaster properties, nature of the substrate material, presence of a paint
layer, use of water-repellent additives or the material saturation condition) was
assessed. Hypotheses were presented to explain why sodium chloride is
typically much less damaging than sodium sulfate in laboratory tests. It was also
possible to identify several factors that can account for the worsening of salt
decay problems after restoration interventions. Further, the possibilities and
limitations of salt crystallization tests as performance tests for plasters and
renders were discussed. Also, general guidelines for the choice of appropriate
plasters and renders for salt loaded walls were presented
• Finally, the study of five old buildings in Portugal provided an insight into the
field performance of plasters and renders applied on moist salt-loaded walls. It
was possible to understand the nature and probable causes of decay, to
compare expertise-based and sampling/testing-based diagnostic
methodologies, as well as to evaluate the application technique and
performance of different rendering systems applied as test panels in S.
Sebastião church. As these case studies are expected to represent many old
buildings in Portugal, further hypotheses could be made on factors that may
account for the worsening of salt damage after restoration interventions.

194 Chapter 7
This research was based on the tasks described in the next paragraphs.
A questionnaire asking for information on salt decayed plastered/rendered buildings
was sent to 154 entities and professionals in Portugal. Through this questionnaire and
some further personal contacts, 14 end-users were selected to be interviewed and 31
buildings out of the 120 indicated were identified as possible case studies.
These 14 end-users were interviewed (Gonçalves 2002b, Gonçalves et al 2003) to
provide an insight into how salt decay problems are approached in practice, as well as
into the types of plasters and renders used on salt-loaded walls.
A survey was carried out in the Portuguese market (Gonçalves 2002a) to identify
industrial plasters/renders or related products available for moist salt-loaded walls. This
survey also allowed selecting three industrial systems to use in the test panels of
S. Sebastião church.
Salt decay pathology was structured and discussed. Salt decay anomalies, signs,
physical medium, causes, mechanisms, predisposing and adjuvant factors were
addressed mostly by means of a review of state-of-the-art literature. The discussion
addressed also the main working principles of plasters and renders for salt-loaded
walls, as well as the subject of salt crystallization tests.
An overview of the state-of-the-practice on handling of salt decay problems in
plastered/rendered buildings was given. It was largely based on the above mentioned
interviews and market survey and focused mainly on the case of Portugal.
Background information was presented on specific topics such as hygroscopicity,
moisture transport and drying of porous materials, main variables in salt crystallization
tests and sorption behaviour of porous building materials.
The possibilities and limitations of using aqueous solutions to generate a constant RH
with salt-loaded materials were assessed by means of experimental research on NaCl
(Gonçalves and Abreu 2007).
The possibilities and limitations of the HMC method for salt content evaluation were
investigated, both on a theoretical basis (Gonçalves and Rodrigues 2006) and by
means of experimental research on nine different salts (Gonçalves et al. 2006a).
Drying of salt-loaded porous materials was investigated (Gonçalves et al. 2006c)
mostly by means of MRI-monitored drying experiments performed on specimens
composed of stone, bedding mortar and plaster.
The behaviour of plasters and renders in relation to salt crystallization was studied by
means of five different sets of crystallization or MRI-monitored drying tests on
plaster/substrate or painted stone specimens.

Summary, conclusions, and future perspectives 195
Preliminary inspections were carried out on 31 decayed buildings all over the country
and allowed the selection of the following five case studies: Salvas Chapel (Sines),
Alhos-Vedros tide mill (Moita), Despacho House (Pereira), Cloister of Sta.
Clara-a-Nova Monastery (Coimbra) and São Sebastião church (Almada).
The five case studies were investigated by means of site inspections and a systematic
sampling/testing procedure (Gonçalves et al. 2005, Gonçalves et al. 2006b). This
procedure included HMC/MC profiles obtained by means of samples collected by
powder drilling, as well as XRD or IC analyses on pure salt or salt-loaded samples.
Test panels of two traditional rendering systems and three industrial systems specific
for salt loaded walls were made in São Sebastião church. The performance of the
systems was monitored for three years (Gonçalves and Rodrigues 2005a).
The main conclusions achieved by this research are presented in the next section
7.2 Conclusions
7.2.1 - Test methods
Salt crystallization tests cannot serve as general performance tests for building
materials. The key-point is that the two main aims of these tests, simulating reality and
speeding up damage, are contradictory. Indeed, when damage is accelerated, distinct
decay features can arise. Further, the influence of the experimental conditions may
vary for different materials or boundary conditions.
Nonetheless, salt crystallization tests can be used to compare the influence of different
factors on salt decay processes or to investigate salt damage mechanisms. These
tests can be performed under controlled conditions and, hence, allow sound
comparisons between different materials. Further, they can be designed in such a way
as to isolate possible influencing factors.
Adequate crystallization tests for plasters and renders should in general use specimens
composed by the plaster or render and their substrate. This is necessary because
plaster/render properties depend on those of the substrate material onto which they are
applied, because moisture transport and salt crystallization processes depend on the
interaction between the two materials, as well as because plasters and renders do not
work independently from the substrate and have a chief role of protecting the masonry.
The COMPASS test presented in Chapter 5 showed to be a good alternative to
common crystallization tests. Its main limitation is that, although much faster than
previous test procedures on plaster/substrate specimens, it may take a long time (in
the order of six months) before five complete wet/dry cycles are achieved. However,
since the salt-accumulation behaviour is probably the most fundamental feature of
plaster and renders, it is always possible to reduce the number of cycles and carry out

196 Chapter 7
an evaluation based on salt-distribution profiles, even when no damage has occurred
yet. In any case, it is recommendable to measure the salt-distribution in, at least, one
specimen of each type at the first observation of damage. These distribution profiles
should be obtained, whenever possible, by means of slicing techniques involving a
minimum loss of material.
MRI provides a clear understanding of moisture migration in porous building materials,
and, hence, of fundamental salt decay features. It is the author’s conviction that a more
extensive use of MRI in this thesis would have allowed a better understanding of the
salt decay processes that took place, namely, in Chapter 5 crystallization tests.
The HMC method can allow sufficiently accurate estimation of the salt content.
• Absolute salt content values can only be obtained for salts of well-known
thermodynamic properties (using tables of thermodynamic data), salts
available/replicable in the laboratory (using experimental correlation lines obtained
with control samples) or salt mixtures of these types of salts (by either of the
methods, depending on the type of salt). Particularly in the case of salt mixtures,
the HMC measurements should be carried out at a high RH, so that dilute solutions
are obtained where there is little interaction between the dissolved ions.
• Relative evaluation of the salt content is possible for salts of unknown
thermodynamic properties, which are neither available nor are replicable in the
laboratory, because the HMC is directly proportional to the salt content. This is
typically the case of building samples which are normally contaminated with
complex salt mixtures. However, the less homogeneous the salt mixture from
sample to sample, the less reliable the HMC method.
• The accuracy of the HMC method depends on the capability of the climatic
chamber to generate accurate and homogeneous environmental conditions in
space and in time. Minor RH deviations may induce significant HMC variations
because the HMC of soluble salts increases exponentially with the RH. Hence, the
higher the actual RH of the testing environment, the higher the HMC variations
produced even by small RH deviations.
• This uncertainty can be reduced by the use of control samples. Pure salt samples
of the contaminant salt allow obtaining a correlation line in agreement with the
actual environmental conditions in the chamber (their HMC is that of a
contaminated sample with 100% salt content). Pure salt samples of a well known
salt such as NaCl, whose RHeq is not much affected by temperature changes, can
be used to evaluate the agreement of the actual RH to the set-point RH. This is
done by comparing the actual HMC of these control samples to the expected HMC.
Several control samples may be spread throughout the chamber in order to
evaluate the spatial homogeneity of the environmental conditions in the chamber.
• The effects of (small) RH oscillations can, if necessary, be minimized by using
deep-narrow recipients. Hygroscopic equilibrium takes longer to be reached with
these but the HMC fluctuation is smoothed.

Summary, conclusions, and future perspectives 197
• It is recommendable to perform preliminary HMC experiments, particularly in the
case of poorly known salts, to ensure that the measurements are effectively carried
out at an RH above the RHeqsat of the salt.
The use of aqueous solutions for generating constant RH inside closed containers
(ASTM 2002, for instance) is not a safe method when salt-loaded materials are
involved. Indeed, both RH and temperature may be disturbed during significant periods
by secondary solutions that exist on wet materials or, when the RH is above the RHeqsat
of the contaminant salt, form on dry materials. Therefore, these methods should in
general be avoided with salt-loaded materials. They are safe only in the case of dry
materials stored at RH bellow the RHeqsat of the contaminant salt.
7.2.2 - Salt decay processes
Soluble salts may significantly influence drying of porous building materials. The lower
RHeq of salt solutions, in comparison to pure water, induces a lower vapour pressure
gradient between the material and the environment. It is also probable that the effective
surface of evaporation is reduced, possibly, by deposited salt crystals. For all these
reasons, when salts are present, the evaporation rate is lower and, thus, the drying
front tends to be located closer to the surface. In drying tests performed on fully
saturated specimens, there are longer periods of surface evaporation and higher
amounts of moisture eliminated by surface evaporation.
Salt-induced dampness arises from the lower drying rate of salt-loaded materials.
Indeed, dampness problems can occur even when the air RH is lower than the RHeq of
the contaminant solution because, in comparison to pure water: (i) the drying front is
located on the outer surface for lower liquid supply fluxes; (ii) there is an increase in the
height of capillary rise.
Hygroscopicity is a particular case of this general feature and occurs when the air RH
is higher than the RHeq of the salt solution in the material. In this case, the vapour
pressure gradient is negative and, hence, water vapour diffuses from the environment
to the material. Two major factors can account for the frequent severity of hygroscopic
dampness: (i) the HMC of soluble salts can be very high, particularly when compared
to that of building materials; (ii) very small oscillations in the RH can induce significant
moisture content variations in salt-loaded masonry, particularly at a high RH.
Some salts tend to crystallize at the surface or higher on the walls, while others tend to
be deposited within the pores or closer to the ground because they have a distinct
influence on drying of porous materials. Indeed, the lower the evaporation rate, the
higher in walls or closer to the surface crystallization tends to occur.
Crystallization may take place in the masonry even when very absorbent plasters or
renders are used. Depending on the drying kinetics, local drying fronts may develop at
the interfaces between materials with distinct porosity/porometry or, particularly for
materials with a wide range of pore sizes, in the larger pores. The faster the drying rate

198 Chapter 7
of the masonry, the higher the risk of in-depth crystallization taking place. In slow
drying conditions, all the pores and materials will have more time to drain the liquid
solutions. Hence, less salt is expected to be deposited in the interior and more
efflorescence to arise. This can happen, for example, when air temperature is low, air
RH is high, wind velocity is low or when a paint layer of low vapour permeability exists.
The depth and thickness of the layer at which soluble salts accumulate in porous
materials depends on the position but also on the width of the drying front. Indeed, in
evaporative processes, soluble salts crystallize at the drying front. The lower the
liquid/evaporation flux ratio, the deeper in the wall the drying front is located. Hence,
the overall position of the front depends on the (vapour and liquid) moisture transport
properties of the material, as well as on all factors that influence evaporation (such as
the type of salt, solution concentration, environmental conditions, presence and type of
paint layer) or the transport of liquid (for example, the moisture content in the substrate
and the suction properties of the substrate material). The width of the drying front
depends on the homogeneity of the pore network and on the liquid/evaporation flux
ratio. The more heterogeneous the pore network (as regards both pore suction and
size) and the lower that ratio, the more diffuse (thicker) the drying front.
The distribution of salt across a diffuse drying front depends on the solubility and
supersaturation tendency of the salt, as well as on the concentration of the salt
solution. Indeed, evaporation occurs all across a diffuse drying front and, hence: (i) the
lower the solubility and the more concentrated the solution, the sooner salts will
crystallize on their way across the front; (ii) for salts that may supersaturate or possess
several crystal forms that precipitate at different concentrations, such as Na2SO4, a
more even distribution of salt can arise across the drying front.
7.2.3 - Sodium chloride and sodium sulfate
One of the main reasons for sodium chloride being typically much less damaging than
sodium sulfate in laboratory crystallization tests is probably the lower vapour pressure
of saturated or equally concentrated sodium chloride solutions. Due to the lower
evaporation rate, a more superficial and sharper drying front occurs for sodium
chloride. Since fully saturated specimens are the rule in these tests, drying Stage I will
certainly be much longer for sodium chloride. Hence, a higher percentage of sodium
chloride than of sodium sulfate will crystallize as harmless efflorescence. This feature is
stressed when very concentrated salt solutions are used, as often happens in
laboratory tests, because the vapour pressure difference between the two salt solutions
is higher.
When the conditions are such that the drying front is diffuse and tends to stay inside
the material, sodium chloride can cause even more severe damage than sodium
sulfate. A more localized crystallization of sodium chloride is likely to be a relevant
factor. Indeed, sodium sulfate tends to be distributed in a larger volume probably due to
its ability for supersaturating and for precipitating at different concentrations.

Summary, conclusions, and future perspectives 199
The discrepancy between sodium chloride’s in-lab ineffectiveness and field
effectiveness can be, to some extent, due to unpainted specimens being normally used
in laboratory tests while in buildings painted surfaces are the norm. In fact, material
damage by soluble salts in buildings often consists mostly of paint peeling, a situation
that is not reproduced in laboratory tests on unpainted specimens. As seen in Chapter
5, sodium chloride was harmless to an unpainted stone but caused severe damage
when that stone was painted.
The new value of 95.6% for the RHeqsat of mirabilite which was recently proposed by
Linnow et al. (2006) is supported by the results of the HMC experiments presented in
section 3.5. Indeed, the random behaviour of sodium sulfate at an actual RH of around
precisely 95.6% was hardly explainable in the light of a RHeqsat of 93.6%. But they fit
with and, hence, corroborate the newly proposed value.
7.2.4 - Factors that influence salt damage features
Paints can cause a more superficial deposition of salt and presence of moisture at the
surface for longer periods and lower liquid fluxes, as well as an increase in the affected
surface area, because they can hinder evaporation and, hence, reduce the
evaporation/liquid flux ratio.
Mass hydrophobic additives used in low quantity (that do not render the material a fully
hydrophobic one) can enhance surface damage. That happens when the
environmental conditions are such that the wet front is allowed to reach the outer
surface of the wall. Indeed, these additives reduce the liquid flux across the plaster
probably because a part of the capillaries becomes unavailable for liquid transport. The
evaporation rate is also reduced because less liquid is available at the wet front per
unit time. Hence, similar amounts of moisture can take longer to be eliminated when
such additives are used and larger moist areas can occur.
The salt-accumulation behaviour of a certain plaster/render may differ significantly for
distinct substrates. Indeed, the substrate material can strongly condition the liquid flux
into the plaster, hence, the evaporation/liquid flux ratio.
The saturation state of plasters/renders also conditions their salt-accumulation
behaviour. When these materials are allowed to saturate completely, evaporation takes
place on the outer surface and efflorescence may occur. The material
absorption/drying hysteresis will impede this front from readily receding with decrease
in the liquid/vapour flux ratio.
The salt-accumulation behaviour and related features of different plasters/renders can
be affected differently by soluble salts and paint layers. For instance, as seen in
Chapter 5, MEP plaster behaved as an accumulating plaster with Na2SO4 and, when
unpainted, also with NaCl. But, when painted, MEP behaved as a transporting plaster
with NaCl. However, that didn’t happen for Parlumière (which was always
accumulating) or for LNEC (which was always transporting). It is probable that any
other factors that influence the vapour or liquid fluxes can also affect differently the
behaviour of distinct plasters and renders to salt crystallization.

200 Chapter 7
7.2.5 - Factors that can contribute for the worsening of salt damage
Surface damage by soluble salts can become worse after restoration interventions
when the evaporation rate is reduced. This can happen due to: (i) lowering of vapour
permeability, for instance, by paints or cement-based plasters/renders; (ii) reduction of
the liquid flux to the drying front, for example, by partially hydrophobic plasters/renders,
poorly adherent coverings or plasters/renders with a reduced suction capability from
the substrate.
Indeed, in walls with rising damp: (i) the moisture content decreases with height; (ii) the
water rises up to the height where the liquid supply flux from the ground is balanced by
the evaporation flux through the surface of the wall. Hence, when the evaporation rate
is reduced: (i) at each height, the drying front moves closer to the surface; (ii) the moist
wall area is enlarged (upwards and laterally) and damage in adjacent elements may
occur.
Surface damage on salt-accumulating plasters may occur when low vapour
permeability paints are used. Because the evaporation rate is reduced, the drying front
can move outwards, hence, can reach the outer surface and thereby enable
salt-transporting behaviour.
Surface damage on salt-accumulating plasters can probably take place also when
liquid continuity to the surface is established. It is reasonable to suppose that this can
happen when:
• The plastering/rendering mortar is fresh. Surface evaporation can possibly persist
during or after hardening, particularly in plasters/renders with strong hysteretic
behaviour or under low evaporation conditions (for example, during winter, in poorly
ventilated rooms or when paints are applied before the plaster is dry).
• These plaster/renders are wetted, for instance, by rain or dew point condensation.
Such occurrence must, then, be prevented when salt-accumulation behaviour is to
be achieved. One possibility is the use of hydrophobic paintings which, in fact, are
included in most salt-accumulating systems available on the market.
Carbonate salts can probably account for many of the cases where damage increases
after restorations. In Portugal, carbonate salts originating from high alkali content
materials seem to be a recurrent cause of salt decay. They arise, for instance, in
cement-based mortars, by reaction of the alkali hydroxides in these materials with
carbonic acid formed by dissolution of air CO2 in the water present in damp walls.
7.2.6 - Other field conditions that favour salt damage
Cracking of plasters and renders can aggravate salt decay. Capillary cracks enhance
the transport of liquid, hence, speeding up the decay rate.
Rising damp is probably one of the main sources of moisture in old buildings. Dew
point condensation can be another relevant source of moisture. It is possible that

Summary, conclusions, and future perspectives 201
surface sources of moisture, namely dew point condensation, are particularly effective
decay agents within decay processes that take place mostly at the surface, such as
carbonate formation in high alkali content materials.
7.2.7 - Diagnostic methodology
Wrong or lacking diagnoses are likely to be responsible for the failure of many
restorations. Indeed, salt and moisture sources can be wrongly identified if adequate
inspections and analyses are not carried out, as seen in Chapter 6. As it emerged from
the interviews presented in Chapter 2, preliminary inspections or analyses by
independent experts are rarely carried out neither in Portugal nor in other countries.
Further, the generalized lack of scientific knowledge on salt damage processes, the
unclear responsibilities and poor exchange of information between the various actors
(contractors, authorities, suppliers, etc.) make it likely that ineffective diagnosis
methodologies are used in many cases.
Diagnoses, to be effective, must be based both on inspections carried out by experts
and on adequate sampling/testing procedures, such as those presented in Chapter 6.
Expertise can provide valuable information on the causes of damage, namely as
regards the sources of moisture and salt. But visual evidence is often misleading,
namely, as to the true sources of moisture. Further, the type of salt, which is essential
information for tracing its origin, is hardly identifiable without adequate chemical
analysis.
7.2.8 - Application technique of industrial plasters and renders
Plasterers must gain practical experience on applying industrial plasters and renders.
Well written or oral instructions are important but do not suffice to ensure a successful
application.
All measures needed to prevent cracking of these plasters and renders should be
taken, particularly in case of salt-accumulating or salt-blocking materials that are
expected to prevent surface damage, because cracking can enhance liquid transport to
the surface. It is necessary, for instance, to avoid the excess of mixing water or the
application of too thick layers.
7.2.9 - Selecting plasters and renders for moist salt-loaded walls
Plasters with different accumulation behaviour are adequate for different situations. For
instance, salt accumulating, salt blocking or moisture sealing plasters can provide
surfaces free of damage. However, salt-accumulating and salt-blocking plasters are
likely to reduce the evaporation rate and moisture-sealing plasters divert salt solutions
to adjacent areas. Further, salt-blocking plasters do not protect the masonry from salt
crystallization. Salt-transporting plasters minimize the affected area, hence providing
better protection to adjacent elements. However, surface damage is more likely to arise
with them.

202 Chapter 7
The salt-accumulation behaviour of a given plaster/render does not depend only on the
material properties. For this reason and also because crystallization tests can hardly
reproduce reality, there is no straightforward answer on how to choose adequate
plasters and renders for salt-loaded walls. Nonetheless, some strategies can be
outlined:
• First, it is necessary to have a good understanding of the situation, not only of the
physical parameters involved (type of substrate, environmental conditions, moisture
load, etc.) but also of the functional requirements for the new plaster or render. As
discussed above, the working principle must be appropriate to the function of the
building or room, its historic value and the presence of artistic elements whose
preservation is perhaps of prime concern.
• All the above discussed factors that can cause or worsen salt damage must be
considered, for instance:
- When using industrial plasters, preliminary trials should be carried out to
allow the plasterers to gain practical experience with the product.
- All measures needed to avoid plaster/render cracking and ensure a good
adherence to the substrate should be taken, for instance, adequate wetting
of the masonry and protection against solar radiation in the early days; see,
for instance, Veiga (2004) for more information on this subject.
- In the case of traditional (transporting) plasters, when dampness and
efflorescence are to be minimized, dense or partially hydrophobic plasters
or renders, as well as paints that hinder evaporation should be avoided.
- Repaintings may enhance salt damp and efflorescence rather than reducing
them because the evaporation rate is progressively lowered. Hence, if a
surface requires renewal, the old paint should be previously removed.
- Surface wetting of accumulating plasters and renders should be avoided, for
example by means of a hydrophobic paint, in order to prevent liquid
continuity from being established up to the outer surface.
- In the case of salt-transporting plasters and renders increase of the drying
rate or decrease of the liquid flux may cause receding of the drying front into
the material and, hence, material damage by subflorescence pressure. This
kind of behaviour is known to be particularly harmful in the case artistic
paintings are present. It may arise, for instance, when dehumidifiers are
used or capillary rise is prevented. In the last case, sacrificial layers may be
used until the wall has effectively dried.
- Though the use of hydraulic binders is typically unavoidable on moist walls,
where air-lime materials can not harden properly, high alkali-content
materials, such as Portland-cement mortars, should not be used because
they may give rise to carbonate salts.
• Preliminary crystallization or drying tests may be used to roughly evaluate or
compare the influence of different factors such as the type of substrate or the
presence of paint layers. It may be more important to use realistic conditions, as
regards, for example, the environmental conditions and the concentration of salt
solutions, than to achieve damage in a short period of time. Salt distribution profiles

Summary, conclusions, and future perspectives 203
such as those presented in this thesis allow evaluation of the salt-accumulation
behaviour even when damage was never achieved within the testing period. Using
salts with very different properties (namely, relative equilibrium humidity and
solubility) may give a better perspective of the range of possible behaviours.
Sodium chloride and sodium sulfate seem appropriate but other possibilities may
exist. Similarly, the use of different environmental conditions may allow the
assessment of extreme behaviour, for instance, during winter or summer.
• Site tests by means of test panels should be used whenever possible. They are the
best means of evaluating the true behaviour of a given plaster/render under certain
conditions because the boundary conditions are the real ones. Further, site tests
allow the consideration of factors related to the application technique which, as
seen, can be very relevant. However, it must be taken into account that:
- It takes considerable time and effort to properly prepare the substrate and
make the test panels.
- It is unlikely that, in most cases, significant results can be obtained after
only a few months. But, as for crystallization tests, the accumulation
behaviour may be accessed by means of salt distribution profiles.
- Moisture and salts are often heterogeneously distributed in masonry walls.
Hence, critical areas of the walls should be carefully chosen for the panels.
• A numerical computational model could be a powerful tool for simulating the
behaviour of plasters and renders under different conditions. It is probably the only
possible way of simultaneously considering the numerous complex and dynamically
interrelated factors involved. Three-dimensional transport at the wall scale rather
than only one-dimensional transport is necessary in order to evaluate possible
damage to adjacent elements, define the appropriate dimension of the area to be
plastered, as well as to allow consideration of the flux changes along the height of
the wall or those caused by the spreading of the moisture into a larger area.
7.3 Future perspectives
Generally speaking, salt decay pathology is still poorly understood, as discussed in
Chapter 2. There is an urgent need for research on several topics, for instance, salt
damage mechanisms and influencing factors. This thesis allowed identification of the
gaps in the several particular subjects which, hence, require further research.
The low evaporation rate of salt-loaded materials, for example, is not fully explainable
by the lower vapour pressure of salt solutions. There is an additional lowering, which is
probably due to a reduction of the effective surface of evaporation, but further research
is needed to understand its causes. Deposition of salt crystals with a blocking effect is
a straightforward hypothesis. Yet, there are other possibilities such as an increased
contact angle between salt solutions and the porous material. A smaller effective
surface of evaporation could possibly arise from a lower curvature of the menisci at the
drying front. It is, for instance, necessary to understand whether the presence of solid
crystals can affect that contact angle.

204 Chapter 7
It is extremely difficult to predict the performance of plasters and renders on salt-loaded
walls. The use of an adequate computational model seems to be the best means of
simultaneously considering the many (complex and interrelated) influencing factors.
Efforts should, therefore, be made in the future to develop such models.
Three-dimensional transport at the wall scale rather than only one-dimensional
transport is necessary, as argued in the previous section.
Crystallization of carbonate salts from high alkali content materials is a frequent cause
of damage in old buildings. It would be useful to develop a test or to establish threshold
values for the alkali-content of building materials that allow accessing (or, at least,
comparing) the tendency of plastering and rendering systems to give rise to alkali
carbonate salts on moist walls. Further, a better understanding of this process is
necessary, namely as regards the relevance of surface moisture sources such as dew
point condensation.
.
Evidence was found which suggests that dew point condensation is a frequent source
of moisture in old Portuguese buildings. More work needs to be carried out on selected
buildings to confirm this hypothesis, as well as to evaluate the relevance within salt
decay processes of dew point condensation and other surface sources of moisture
such as hygroscopicity.
Cracking of plasters and renders seems to aggravate salt decay processes. Such an
effect was observed in two case studies in this thesis where very high moisture
contents existed in the masonry. Further research is needed to understand if and how
shrinkage cracking of plasters and renders is enhanced by substrates wet in
permanence or during long periods.
Paint damage is sometimes due to direct pressure by salts that crystallize at the
interface with the underlying material. However, in other cases, paints peel off without
any (sub)efflorescence pushing them. More research is necessary to understand which
the effective damage mechanism is in this case. There are two main hypotheses:
(i) vapour pressure – if the adherence of the paint to the substrate is previously
weakened by salt deposition at the paint/plaster interface, detachment of paints that
hinder vapour transport could more easily arise due to vapour pressure;
(ii) crystallization pressure – if some salt is deposited in the porous system of the paint
layer, crystallization pressure could cause dilation of such thin and elastic layer,
particularly if its adherence to the substrate was already weakened by salt deposition at
the interface.
When accumulating plasters or renders are applied, liquid continuity may be
established up to the surface by the water in the fresh mortar. Further work is
necessary to understand the relevance of such an effect as a cause of surface damage
on accumulating plasters and renders. Indeed, it is possible that surface evaporation
persists, during or even after hardening, in plasters/renders with strong hysteretic
behaviour or under low evaporation conditions.
Further research is needed to confirm whether common drying curves provide
sufficiently accurate identification of the moment when the drying front totally recedes

Summary, conclusions, and future perspectives 205
into the specimen. That moment is usually assigned to the critical point where the slope
of the moisture-content-versus-time curve starts decreasing. Yet, when a diffuse rather
than a sharp drying front occurs, there is not an immediate transition from Stage I
(where evaporation takes place at the surface) to Stage II (where the evaporation front
is inside the material). A transitional period exists where a decreasingly significant part
of the pores close to the outer surface are involved in transporting the liquid to this
surface. Since there may be a decrease in the drying rate already during that
transitional period, a correct identification of the beginning of Stage II may not be
possible.


References
Alonso FJ, Ordaz J, Valdeon L, Esbert RM (1987) Revisión crítica del ensayo de cristalización de
sales (Critical review of salt crystallization tests), Materiales de Construcción 206, 53-59.
Apelblat A, Manzurola E (2003) Solubilities and vapour pressures of saturated aqueous solutions of
sodium tetraborate, sodium carbonate and magnesium sulphate and freezing-temperature lowerings of
sodium tetraborate and sodium carbonate solutions, Journal of Chemical Thermodynamics 35, 221-
238.
Arnold A (1981) Nature of reactions of saline minerals in walls. In Ross MR (ed.) Proc. Int. Symposium
Conservation of Stone II, Bologna: Centro per la Conservacione delle Sculpture all Aperto, 13-23.
Arnold A (1982): Rising damp and saline minerals. In Proc. 4th Int. Congress on the Deterioration and
Preservation of Stone Objects, Louisville, 11-28.
Arnold A, Zehnder K (1985a) Crystallization and habits of salt efflorescences on walls.
I - Methods of investigation and habits. In Félix G (ed.) Proc. 5th Int. Congress on the Deterioration and
Conservation of Stone, Lausanne, Presses Polytechniques Romandes, 255–67.
Arnold A, Zehnder K (1985b) Crystallization and habits of salt efflorescences on walls II. Conditions of
crystallization. In Félix G (ed.) Proc. 5th Int. Congress on the Deterioration and Conservation of Stone,
Lausanne, Presses Polytechniques Romandes, 269–77.
Arnold A, Zehnder K (1989) Salt weathering on monuments. In Zezza F (ed.) Proc. 1st Int. Symposium
on the Conservation of Monuments in the Mediterranean Basin, Bari, 31-58.
ASTM - American Society for Testing and Materials (2002) Standard practice for maintaining constant
Relative Humidity by means of aqueous solutions. ASTM E 104-02.
ASTM (2004) Standard test method for determination of pore volume and pore volume distribution of
soil and rock by mercury intrusion porosimetry. ASTM D 4404-84.
ASTM (2005) Standard test method for soundness of aggregates by use of sodium sulphate or
magnesium sulphate. ASTM C88-05.
Bachmann J, van der Ploeg RR (2002) A review on recent developments in soil water retention
theory: interfacial tension and temperature effects, Journal of Plant Nutrition and Soil Science 165,
468-478.
Benavente D, García del Cura MA, Ordóñez S (2003) Salt influence on evaporation from porous rocks,
Construction and Building Materials 17, 113-122.
Blandamer MJ, Engberts JBFN, Gleesonc PT, Reis JCR (2005) Activity of water in aqueous systems;
a frequently neglected property, Chemical Society Reviews 34, 440-458.
Bloss FD (1971) Crystallography and Crystal Chemistry. An Introduction. Holt, Rinehart, and Winston,
New York. ISBN 03-085155-6.
BRE - Building Research Establishment (1977) Diagnosis of rising damp. BRE, UK. BRE TIL 29.
BRE (1989) Rising damp in walls: diagnosis and treatment. BRE, UK. BRE Digest 245.

208 References
Burkinshaw R, Parret M (2004). Diagnosing Damp. RICS, Coventry, UK. ISBN 1-84219-097-0.
Cardoso IL (2006) Moinho de maré de Corroios. Diagnóstico do estado de conservação e estudo de
materiais para restauro dos revestimentos das paredes de alvenaria (Diagnosis and study of
restoration materials for plasters and renders). Relatório de Estágio. Licenciatura em Conservação e
Restauro da Universidade Nova de Lisboa.
CEN - European Committee for Standardization (1994) Methods of Testing Cement - Part 1:
Determination of strength. EN 196-1.
CEN (1998a) Methods of test for mortar for masonry - Part 2: Bulk sampling of mortars and
preparation of test mortars. EN 1015-2.
CEN (1998b) Methods of test for mortar for masonry - Part 19: Determination of water vapour
permeability of hardened rendering and plastering mortars. EN 1015-19.
CEN (1999a) Methods of test for mortar for masonry - Part 3: Determination of consistence of fresh
mortar (by flow table). EN 1015-3.
CEN (1999b) Natural stone test methods. Determination of resistance to salt crystallization. EN 12370.
CEN (2002) Methods of test for mortar for masonry - Part 18: Determination of water absorption
coefficient due to capillary action of hardened mortar. EN 1015-18.
CEN (2003) Specification for mortar for masonry - Part 1: Rendering and plastering mortar. EN 998-1.
CEN/IPQ (2001) Métodos de ensaio para pedra natural. Determinação das massas volúmicas real e
aparente e das porosidades total e aberta (Natural stone test method. Determination of real density
and apparent density, and of total and open porosity). NP EN 1936.
Correns CW (1949) Growth and dissolution of crystals under linear pressure, Discussions of the
Faraday Society 5, 267-271.
Charola AE (2000) Salts in the deterioration of porous materials: an overview, Journal of the American
Institute for Conservation 39, 327-343.
Charola AE, Weber J (1992) The hydration-dehydration mechanisms of sodium sulphate.
In Rodrigues JD et al. (ed.) Proc. 7th International Congress on Deterioration and Conservation of
Stone, Lisbon, LNEC, 581-590.
Chatterji S (2005) Aspects of generation of destructive crystal growth pressure, Journal of Crystal
Growth 277, 566-577.
Chatterji S, Jensen AD (1989) Efflorescence and breakdown of building materials, Nordic Concrete
Research 8, 56-61.
DIN - Deutsches Institut für Normung (1973) Bestimmung der Wasserdampfdurchlässigkeit von Bau-
und Dämmstoffen (Determination of water vapour permeability of construction and insulating
materials). DIN 52615.
DIN (1987) Bestimmung des Wasseraufnahmekoeffizienten von Baustoffen (Determination of water
absorption coefficients of building materials). DIN 52617.
Doehne E (2003) Salt weathering: a selective review. In Siegesmund GS et al. (ed.) Natural Stone,
Weathering Phenomena, Conservation Strategies and Case Studies. London, Geological Society.
Geological Society Special Publication No. 205.

References 209
Doehne E, Selwitz C, Carson DM (2002) The damage mechanism of sodium sulfate in porous stone.
In Proc. SALTeXPERT Meeting, Prague. Stefan Simon and Miloš Drdácký (ed.) European Research
on Cultural Heritage. State-of-the-Art Studies, Vol. 5, 2006, 127-160.
Esteves AM, Catarino J (2006) Determination of sulphates and chlorides on plaster and brick samples
by ion chromatography. Lisbon, LNEC. Report 374/2006-NB.
Evans IS (1969-1970) Salt crystallization and rock weathering: a review, Revue de Géomorphologie
Dynamique 4, 153-177.
Faria Rodrigues P (2003) Estudo comparativo de diferentes argamassas de cal aérea e areia. In Proc.
1º Encontro Nacional sobre Patologia e Reabilitação de Edifícios, Faculdade de Engenharia da
Universidade do Porto, 207-216.
Flatt RJ (2002) Salt damage in porous materials: how high supersaturations are generated, Journal of
Crystal Growth 242, 435-454.
Freitas VP (1992) Transferência de humidade em paredes de edifícios. Análise do fenómeno da
interface (Moisture transport in building walls. Analysis of the interface phenomenon). Tese de
doutoramento, Faculdade de Engenharia da Universidade do Porto (FEUP), Portugal.
Gonçalves TD (1997) Capacidade de impermeabilização de revestimentos de paredes com base em
ligantes minerais. Desenvolvimento de um método de ensaio baseado na resistência eléctrica (Water
absorption behaviour of plasters and renders. Development of a test method based on the electrical
resistance). Tese de Mestrado, Instituto Superior Técnico da Universidade Técnica de Lisboa,
Portugal. Colecção “Teses de Mestrado LNEC”, Lisboa, LNEC, 1998.
Gonçalves TD (2002a) Pesquisa de mercado sobre revestimentos para paredes sujeitas à acção de
sais solúveis (Market survey on industrial plasters and renders for salt loaded walls), Cadernos de
Edifícios 2. Lisboa, LNEC.
Gonçalves TD (2002b) Interviews of involved actors and collection of data (LNEC). Report for the
COMPASS project. Internal document LNEC2002c02.
Gonçalves TD (2003a) Degradation of wall paints due to sodium sulphate and sodium chloride
crystallization. Materiales de Construcción 269, 5-16.
Gonçalves TD (2003b) Colocação a descoberto de alvenarias antigas originalmente revestidas e
sujeitas à acção de sais solúveis. Utilização de hidrófugos de superfície (Uncovering of originally
plastered or rendered salt loaded masonry. Use of water repellent surface treatments). In Proc. 3º
ENCORE - Encontro sobre Conservação e Reabilitação de Edifícios, Lisboa, LNEC, Vol.1, 395-403.
Gonçalves TD, Rodrigues JD, Sanders M, Van Hees R, Luxan MP (2003) Rebocos para edifícios
históricos sujeitos à acção de sais solúveis. Apresentação do projecto COMPASS e principais
conclusões das entrevistas (Plasters and renders for old salt loaded buildings. Introduction of the
COMPASS project and main conclusions of the interviews). In Proc. 3º ENCORE - Encontro sobre
Conservação e Reabilitação de Edifícios, Lisboa, LNEC, Vol. 1, 675-680.
Gonçalves TD, de Rooij M, Rodrigues JD (2005) Alhos-vedros tide-mill: salt damage assessment,
diagnosis and repair. In Proc. Seminário Sais Solúveis em Argamassas de Edifícios Antigos. Danos,
Processos e Soluções, Lisboa, LNEC, 157-166. Publicação CS 32, LNEC, 2006.
Gonçalves TD, Rodrigues JD (2005a) Compatibility of rendering systems with salt loaded ordinary
masonry walls. In Preprints RILEM Workshop Repair Mortars for Historic Masonry, The Netherlands,
TU Delft.

210 References
Gonçalves TD, Rodrigues JD (2005b) Rebocos para paredes antigas afectadas por sais solúveis
(Plasters and renders for old salt loaded walls). In Proc. Seminário Sais Solúveis em Argamassas de
Edifícios Antigos. Danos, Processos e Soluções, Lisboa, LNEC, 35-47. Publicação CS 32, LNEC,
2006.
Gonçalves TD, Rodrigues JD (2006) Evaluating the salt content of salt-contaminated samples on the
basis of their hygroscopic behaviour. Part I: Fundamentals, scope and accuracy of the method,
Journal of Cultural Heritage 7, 79-84.
Gonçalves TD, Rodrigues JD, Abreu MM (2006a) Evaluating the salt content of salt-contaminated
samples on the basis of their hygroscopic behaviour. Part II: Experiments with nine common soluble
salts, Journal of Cultural Heritage 7, 193-200.
Gonçalves TD, Rodrigues JD, Abreu MM, Esteves AM, Santos Silva A (2006b) Causes of salt decay
and repair of plasters and renders of five historic buildings in Portugal. In Proc. Conference Heritage,
Weathering and Conservation, Madrid, Instituto de Geologia Económica (CSIC-UCM), 273-284.
Balkema, Madrid, Vol. 1.
Gonçalves TD, Pel L, Rodrigues JD (2006c) Drying of salt contaminated masonry: MRI laboratory
monitoring, Environmental Geology 52, 249-258.
Gonçalves TD, Abreu MM (2007) Testing of salt contaminated materials: use of selected salt solutions
for control of the relative humidity, Journal of Testing and Evaluation 35 (forthcoming). The article is
presently available in the First Look section of the journal, published online 23 May 2007,
DOI 10.1520/JTE100192.
Goretzi L, Karolewski U (1995). Gefüge und Beständigkeit von Sanier-Putzen bei starke Feuchte- und
Salzbelastung, Sanierputzsysteme (Structure and resistance of restoration plasters and renders to
high salt contents). WTA Schriftreihe Heft 7, 71-90.
Goudie A, Viles H (1997) Salt Weathering Hazard. John Wiley & Sons, Chichester, UK. ISBN 0-471-
95842-5.
Greenspan L (1977) Humidity fixed points of binary saturated aqueous solutions, Journal of Research
of the National Bureau of Standards - A. Physics and Chemistry 1, 89-96.
Hafezi M, Figgemeier M (1999) Differenziert vorgehen. Putztechnische Lösungen als Alternative zum
Sanierputz (A different approach. Alternatives to restoration plasters and renders), Bautenschutz &
Bausanierung 6, 31-36.
Hall C, Hoff WD (2002) Water Transport in Brick, Stone and Concrete. Spon Press, London and New
York. ISBN 0-419-22890-X.
Harris SY (2001) Building pathology. Deterioration, diagnostics, and Intervention. John Wiley & Sons,
New York. ISBN 0-471-33172-4.
Henriques FMA (1994) Humidade em Paredes (Dampness in building walls). Lisboa, LNEC. Série
Conservação e Reabilitação.
Henriques FMA (2006) The effects of hygroscopic soluble salts in masonries. In Proc. Seminário Sais
Solúveis em Argamassas de Edifícios Antigos. Danos, Processos e Soluções, Lisboa, LNEC, 179-188.
Publicação CS 32, LNEC, 2006.
Hern C, Snethlage R (1992) Water vapour permeability of painted stone. In Rodrigues JD
et al. (ed.) Proc. 7th International Congress on Deterioration and Conservation of Stone, Lisbon, LNEC,
677-686.

References 211
Hilbert G (1995) Der Einfluss von Bindemitteln auf die Eigenschaften von Opferputze (Influence of the
binder on the characteristics of sacrificial plasters and renders), Bautenschutz & Bausanierung 7, 71-
75.
Hilbert G, Müller-Rochholz J, Zinsmeister K (1992) Salzeinlagerung in Sanierputze. Teil 2:
Salzeinlagerungsverhalten - Schlussfolgerungen für die Praxis (Salt deposits in restoration plasters
and renders. Part 2: deposition of salt), Bautenschutz & Bausanierung 15, 78-80.
Holmström M (2000) Salt protective plasters. In Proc. International Workshop on Urban Heritage and
Building Maintenance VII, Switzerland, Zurich, 73-85. Aedificatio, Freiburg, Germany.
Huinink HP, Pel L (2003) Modelling simultaneous drying and salt crystallization. Report for the
COMPASS project. Internal document EUT-Report-20030916.
Huinink HP, Pel L, Petkovic J, Kopinga K (2005) Salt accumulating plaster systems based on pore size
differences. Report for the COMPASS project. Internal document EUT-Report-20050311.
ICATHM - International Congress of Architects and Technicians of Historical Monuments (1964)
International charter for the conservation and restoration of monuments and sites. In Proc. II
International Congress of Architects and Technicians of Historical Monuments, Venice. The “Venice
Charter”.
ICR - Istituto Centrale per il Restauro, CNR - Consiglio Nazionale delle Ricerche (1988) Alterazioni
macroscopiche dei materiali lapidei: Lessico. (Macroscopic alterations of stone materials. Lexicon).
Raccomandazioni Normal 1/88.
ISO - International Organization for Standardization (2005) Plastics - Small enclosures for conditioning
and testing using aqueous solutions to maintain the humidity at a constant value. ISO 483.
Jokilehto J (1999) A History of Architectural Conservation. Butterworth-Heinemann, Oxford. ISBN
07506-3793-5.
Knöfel DK, Hoffman D, Snethlage R (1987) Physico-chemical weathering reactions as a formulary for
time-lapsing ageing tests, Materials and Structures 20, 127-145.
Künzel HM (1995) Simultaneous heat and moisture transport in building components. PhD Thesis,
Fraunhofer Institute of Building Physics, Germany.
Leitão, LA (1896) Curso Elementar de Construções (Elementary Course on Construction). Lisboa,
Imprensa Nacional.
Lewin SZ (1982) The mechanism of masonry decay through crystallization. In Conservation of Historic
Stone Buildings & Monuments, National Academy Press, Washington, 120-144. ISBN 0-309-03275-X.
Lewin SZ (1990) The susceptibility of calcareous stones to salt decay. In Proc. 1st International
Symposium on the Conservation of Monuments in the Mediterranean Basin, Italy, Bari, 59-53.
Linnow K, Zeunert A, Steiger M (2006) Investigation of sodium sulphate phase transitions in a porous
material using humidity-and-temperature-controlled X-ray diffraction, Analytical Chemistry 78, 4683-
4689.
LNEC (2006) Proc. Seminário Sais Solúveis em Argamassas de Edifícios Antigos. Danos, Processos
e Soluções, Lisboa, LNEC, 157-166. Publicação CS 32, LNEC, 2006. ISBN 972-49-2063-1.
Lobo VMM (1989) Handbook of Electrolyte Solutions. Elsevier, Amsterdam. ISBN 0-444-98847-5.
212 References
Lubelli B (2006) Sodium chloride damage to porous building materials. PhD thesis, Technical
University of Delft, The Netherlands.
Lubelli B, Van Hees RPJ, Brocken HJP (2004) Experimental research on hygroscopic behaviour of
porous specimens contaminated with salts. Construction and Building Materials 18, 339-348.
Lurie J (1975) Handbook of Analytical Chemistry. Mir Publishers, Moscou.
MacMahon D, Sandberg P, Folliard K, Mehta P (1992) Deterioration mechanisms of sodium sulphate.
In Rodrigues JD et al. (ed.) Proc. 7th International Congress on Deterioration and Conservation of
Stone, Lisbon, LNEC, Vol 2, 705-714.
Massari G, Massari I (1993) Damp Buildings - Old and New. ICCROM, Rome. ISBN 92-9077-111-9.
Meier HG (1992) Ergänzende Anmerkungen zum Themenkreis “Salzeinlagerungen in Sanierputze”
(Comments on the article “Salt deposits in restoration plasters and renders”), Bautenschutz &
Bausanierung 15, 84-85.
Mertz JD (1991) Structures de porosité et propriétés de transport dans les grès (Pore structures and
transport properties of sandstone). PhD Thesis, University Louis Pasteur, Strasbourg, France.
Sciences Géologiques, Mémoire 90.
Nasraoui M, Mertz JD (2004) Les salines Royale de Dieuze: un site naturel de vieillissement accéléré
de mortiers résistants aux sels (Dieuze Royal saltworks: a natural accelerated ageing site for salt
resistant mortars). In Preprints Journée Thématique ICOMOS-LRMH Enduits Dégradés par les Sels:
Pathologie et Traitements, Laboratoire de Recherche des Monuments Historiques (LRMH), France,
Champs-sur-Marne.
Olynyk P, Gordon AR (1943) The vapour pressure of aqueous solutions of sodium chloride at 20, 25
and 30 ºC for concentrations from 2 M to saturation, Journal of the American Chemical Society 65,
224-226.
Paiva JV (1969) Humidade nas edificações (Dampness in buildings). Tese apresentada a concurso
para Especialista do LNEC. Lisboa, LNEC.
Pel L (1995) Moisture transport in porous building materials. PhD thesis, Technical University of
Eindhoven, The Netherlands.
Pel L, Huinink H, Kopinga K (2003) Salt transport and crystallization in porous building materials.
Magnetic Resonance Imaging 21, 317-320.
Petković J (2005) Moisture and ion transport in layered porous building materials: a Nuclear Magnetic
Resonance study. PhD thesis, Technical University of Eindhoven, The Netherlands.
Price C, Brimblecombe P (1994) Preventing salt damage in porous materials. In Roy A, Smith P (ed.)
Preprints of the Contributions to the Ottawa Congress Preventive Conservation: Practice, Theory and
Research. London, International Institute for Conservation of Historic and Artistic Works, 90-93.
Pühringer J (1983) Salt disintegration: salt migration and degradation by salt - a hypothesis.
Stockholm, Swedish Council for Building Research. Document D15:1983.
Reis, JCR (2006) Personal communication: The relative equilibrium humidity of sodium sulphate and
sodium chloride at 40ºC was calculated by means of Pitzer equations in Blandamer et al. (2005) using,
for an aqueous Na2SO4 at 25ºC and for its variation, assumed linear, with the temperature, the
parameters in: Pitzer KS (1991) in Pitzer KS (ed.) Activity Coefficients in Electrolyte Solutions, CRC
Press, Boca Raton, Florida, 75–153.

References 213
Rijniers LA (2004) Salt crystallization in porous materials: an NMR study. PhD thesis, Technical
University of Eindhoven, The Netherlands.
RILEM TC 25-PEM (1980) Recommended tests to measure the deterioration of stone and to assess
the effectiveness of treatment methods, Materials and Structures 13, 176-180 (test I.1 “Porosity
accessible to water”), 197-199 (test II.2 “Coefficient of water vapour conductivity”), 204-207 (test II.5
“Evaporation curve”), 233-235 (test V.1.a “Crystallization test by total immersion for untreated stone”),
235-237 (test V.1.b “Crystallization test by total immersion for treated stone”) and 237-239 (test V.2
“Crystallization test by partial immersion”).
RILEM TC 127-MS (1998) Determination of the resistance of wallettes against sulphates and
chlorides, Materials and Structures 31, 2-9 (RILEM test MS-A.1).
Robinson R, Stokes R (2002) Electrolyte Solutions: The Measurement and Interpretation of
Conductance, Chemical Potential and Diffusion in Solutions of Simple Electrolytes. London, Dover.
ISBN 0-486-42225-9. Republication of the second revised edition which was originally published in
1970 by Butterworth, London.
Robinson RA, Macaskill JB (1979) Osmotic coefficients of aqueous sodium carbonate solutions at 25ºC,
Journal of Solution Chemistry 1, 35-40.
Rodrigues JD (1976) Estimation of the content of clay minerals and its significance in stone decay. In
Proc. 2nd International Symposium on the Deterioration of Building Stones, Athens, 105-108.
Rodrigues JD (1991) Causes, mechanisms and measurement of damage in stone monuments.
In Baer NS et al. (ed.) Science, Technology and European Cultural Heritage, Butterworth-Heinemann,
Oxford, 124–137. Memória LNEC nº 744.
Rodrigues JD, Gonçalves TD (2005) Sais solúveis nas construções históricas. Introdução e relato
sumário (Soluble salts in historic constructions. Introduction and summary). In Proc. Seminário Sais
Solúveis em Argamassas de Edifícios Antigos. Danos, Processos e Soluções, Lisboa, LNEC, 1-13.
Publicação CS 32, LNEC, 2006.
Rodrigues JD, Gonçalves TD, Luxán MP, Vergès-Belmin V, Wijfels T, Lubelli B (2005) A proposal for
classification of salt crystallisation behaviour of plasters and renders. In COMPASS end-report.
Rodríguez-Navarro C, Doehne E (1999) Salt weathering: influence of evaporation rate, supersaturation
and crystallization pattern, Earth Surface Processes and Landforms 24, 191-209.
Rodríguez-Navarro C, Doehne E, Sebastian E (1999) Origins of honeycomb weathering: the role of
salts and wind, GSA Bulletin 111, 1250-1255.
Rodríguez-Navarro C, Doehne E, Sebastián E (2000) How does sodium sulfate crystallize? Implications
for the decay and testing of building materials, Cement and Concrete Research 30, 1527-1534.
Rojas IG (1987) Artes de la Cal (Air lime arts). Edições da Universidade de Alcalá de Hernares. ISBN 84-
7483-966-1.
Rose D A (1963a) Water movement in porous materials: Part 1 - Isothermal vapour transport,
British Journal of Applied Physics 14, 256-262.
Rose D A (1963b) Water movement in porous materials: Part 2 - The separation of the components of
water movement, British Journal of Applied Physics 14, 491-496.
Rossi-Manaresi R, Tucci A (1991) Pore structure and the disruptive or cementing effect of salt
crystallization in various types of stones, Studies in Conservation 36, 53-58.

214 References
Rousset-Tournier B (2001) Transferts par capillarité et évaporation dans des roches. Rôle des
structures de porosité (Capillary transport and evaporation in rocks. The role of pore structures). Thèse
de doctorat, University Louis Pasteur, Strasbourg, France.
Roy RN, Gibbons JJ, Williams R, Godwin L, Baker G, Simonson JM, Pitzer KS (1984)
The thermodynamics of aqueous carbonate solutions II. Mixtures of potassium carbonate, bicarbonate
and chloride, Journal of Chemical Thermodynamics 16, 303-315.
Schaffer R J (1932) The weathering of natural building stones. London, His Majesty’s Stationery
Office. Building Research Special Report 18. Reprinted, with slight amendments, 1933.
Scherer GW (1990) Theory of drying, Journal of the American Ceramics Society 73, 3-14.
Scherer GW (2004) Stress from crystallization of salt, Cement and Concrete Research 34, 1613-1624.
Scherer GW (2006a) Internal stress and cracking in stone and masonry. Retrieved on February 2007
from http://www.cee.princeton.edu/scherergroup/In%20Press_files/InternalStress.pdf. Paper presented
at the 16th European Conference Fracture, Alexandropoulis, Greece.
Scherer GW (2006b) Personal communication.
Segurado JES (1908) Alvenaria e Cantaria (Ordinary and ashlar masonry). Biblioteca de Instrução
Profissional, Livraria Bertrand, Lisboa.
Sherwood TK (1929) The drying of solids II, Industrial and Engineering Chemistry 21 (10), 976-980.
Snethlage R, Wendler E (1997) Moisture cycles and sandstone degradation. In Baer NS,
Snethlage R (ed.) Saving our Architectural Heritage: The Conservation of Historic Stone Structures,
Elsevier, Chichester, UK, 7-24.
Steiger M (2005a) Crystal growth in porous materials – I: The crystallization pressure of large crystals,
Journal of Crystal Growth 282, 455-469.
Steiger M (2005b) Crystal growth in porous materials – II: Influence of crystal size on the crystallization
pressure, Journal of Crystal Growth 282, 470-481.
Steiger M (2006) Personal communication.
Strege C (2004) On (pseudo-)polimorphic phase transformations. PhD thesis, Martin Luther University,
Germany.
Thury H (1828) Sur le procédé proposé par M. Brard pour reconnaître immédiatement les pierres qui
ne peuvent pas résister a la gelée (…) (On the procedure proposed by M. Brard for recognizing
immediately the stones that can not resist icing (…)) , Annales de Chimie et de Physique 38, 160-192.
TNO - The Netherlands Organisation for Applied Scientific Research (2001) Damage assessment and
diagnosis form. Report for the COMPASS project. Internal document TNO2001.c02-v2.
TNO (2002) Interviews of involved actors and collection of data. Report for the COMPASS project.
Internal document TNO2002.C09.
TNO (2003) Accelerated crystallisation test. Report for the COMPASS project. Internal document
TNO2003.c08v2.
TNO (2004) Case-study: Farmhouse Leiderdorp. Report for the COMPASS project. Internal document
TNO2004c05.

References 215
TNO (2005) Plaster Damage Atlas. In COMPASS end-report.
Tsui N, Flatt RJ, Scherer GW (2003) Crystallization damage by sodium sulphate, Journal of Cultural
Heritage 4, 109-115.
UNI - Ente Nazionale Italiano di Unificazione (2003) Materiali lapidei naturali ed artificiali -
Determinazione del contenuto di sali solubili (Natural and artificial stone materials. Determination of
the content of soluble salts). UNI 11087.
UNI (2006) Beni culturali. Materiali lapidei naturali ed artificiali. Descrizione della forma di alterazione.
Termini e definizioni (Natural and artificial stone materials. Description of alteration patterns. Terms
and definitions). UNI 11182.
Van Hees RPJ, Brocken HJP (2004) Damage development to treated brick masonry in a long-term salt
crystallization test, Construction and Building Materials 18, 331-338.
Van Hees RPJ, Lubelli B (2002) Analysis of transport and crystallization of salts in restoration plasters.
In Proc. SALTeXPERT Meeting, Prague. Stefan Simon and Miloš Drdácký (ed.) European Research
on Cultural Heritage. State-of-the-Art Studies, Vol. 5, 2006, 127-160.
Veiga MRS (2004) Comportamento à fendilhação de rebocos: avaliação e melhoria (Cracking
behaviour of plasters and renders: assessment and improvement), Cadernos Edifícios 3, 7-27. Lisboa,
LNEC.
Vergès-Belmin V (2003). Personal communication.
Vergès-Belmin V, Wijfels T, Gonçalves TD, Nasraoui M (2005) The COMPASS salt crystallization test
(COMPASS-TEST) as a way to figure out how salts migrate and accumulate in renovation plasters.
In COMPASS end-report.
Washburn EW (1921) The dynamics of capillary flow, Physical Review 17, 273-283.
Westbrook C (2002) MRI at a Glance. Blackwell Science, UK. ISBN 0-632-05619-3.
Wijffels TJ, Groot CJWP, Van Hees RPJ (1997) Performance of restoration plasters. In Proc. 11th Int.
Brick/Block Masonry Conference, Shanghai, Tongji University, Department of Structural Engineering,
1050-1062. Aedificatio Verlag.
Wilson MA, Carter MA, Hoff WD (1999) British standard and RILEM water absorption tests: a critical
evaluation, Materials and Structures 32, 571-578.
WTA - Wissenschaftlich-Technischen Arbeitsgemeinschaft für Bauwerks- erhaltung und Denkmalpflege
(1992) Sanierputzsystem (Restoration plastering and rendering systems). WTA Merkblatt 2-2-91/D.
WTA (2000) Ergänzungen zum Merkblatt 2-2-91/D “Sanierputzsysteme” (Amendments to the technical
specification 2-2-91/D “Restoration plastering and rendering systems”). WTA Merkblatt E-2-6-99.
Zehnder K (1996) Gypsum efflorescence in the zone of rising damp. Monitoring of slow decay
processes caused by crystallizing salts on wall paintings. In Riederer J (ed.) Proc. 8th Int. Congress on
Deterioration and Conservation of Stone, Berlim, 1669-1678.
Zehnder K, Arnold A (1989) Crystal growth in salt efflorescence, Journal of Crystal Growth 97, 513-21.


Annex I – Magnetic resonance imaging
I.1 Introduction
Magnetic Resonance Imaging (MRI) is a non-destructive imaging technique for quantitative
mapping of certain chemical elements in materials. In this thesis use is made of proton NMR
(Nuclear Magnetic Resonance) with the aim of monitoring the moisture content in porous
building materials during drying.
The immense possibilities of NMR and MRI have already justified the attribution of two Nobel
Prizes, in 1952 for Physics and in 2003 for Medicine, respectively. MRI has been used in
medical applications since the 1980s, merely one decade after the first images were
presented. More recently, MRI techniques have also proved to be suitable to study moisture
transport in porous building materials.
In these NMR techniques, the sample is magnetized by a strong static magnetic field. In
absence of a magnetic field, the nuclei in the molecules are randomly oriented due to thermal
energy. Hence, the net magnetizationM , i.e., the vector sum of the magnetic moments of the
individual protons, is null. The sample is then placed in a magnetic field B0, which causes the
individual magnetic moments to align and to produce a net magnetization ׀M In such .0< ׀
conditions, the individual magnetic moments, as well as their resultant M , precess in phase
around the direction of B0 at the so called Larmor frequency f (MHz):
2π
γ.Bf 0= (I.1)
In this equation, γ (MHz.T-1) is the gyromagnetic ratio of the nuclei of interest and B0 (T) the
strength of the magnetic field.
The nuclei in the sample are afterwards manipulated using radio frequency (RF) pulses by
which a secondary oscillating magnetic field B1 << B0 is applied perpendicularly to B0. These
RF pulses have to be at the Larmor frequency which is the resonance frequency of the
nuclei. Because of the condition in Eq 1.1, NMR methods can be made sensitive to one
specific type of nuclei. In most experiments on building materials, hydrogen protons (γ = 42.6 MHz.T-1) are measured and therefore water is detected.

AI.2 Annex I
B1 will cause M to rotate away from its equilibrium position. The intensity and duration of the
RF pulse determines the degree of rotation of M .
At the termination of the RF pulse, the nuclei return to equilibrium, in a process called
relaxation, by emitting electromagnetic radiation and by re-transferring the energy to the
surrounding molecules. This emission of energy is observed as a NMR signal. The signal
after a 90° RF pulse (a pulse which makes M to rotate 90º) is referred to as FID (Free
Induction Decay)
Here, as in general, use is made of a “spin echo sequence”. In this case, the 90° RF pulse is
followed by a 180° pulse resulting in a so-called spin-echo signal. The amplitude of the spin-
echo signal S (a.u.) is proportional to the number of nuclei excited by the RF pulse and is given by:
)1.(. 12 T
TR
T
TE
eeS−−
−= ρ (I.2)
In this expression, ρ is the density of the hydrogen nuclei in the sample, T1 (s) the spin-lattice relaxation time, TR (s) the repetition time, T2 (s) the spin-spin relaxation time and TE (s) the echo-time (Westbrook 2002, for example).
T1 characterizes the period of time necessary for restoring thermal equilibrium. It is a measure of the rate at which energy, which was transmitted to the system by the RF pulse,
can be re-transferred from the nuclei to the lattice by random collisions between molecules. T2 expresses how fast spin-spin interactions will cause dephasing of the protons after termination of the RF pulse. TR and TE are operational parameters. TR is the interval between two consecutive spin-echo sequences. A TR long in comparison to T1 (TR~4T1) is used so that thermal equilibrium has time to be re-established before each new pulse
sequence begins. In that case as can be seen from Eq. I.2, T1 has no significant influence on the intensity of the signal. TE is the time between the 90° excitation pulse and the echo signal acquisition. In building materials, due to the presence of magnetic impurities, T2 relaxation is short so a short TE is preferred.
If a sample is placed in a uniform static magnetic field, all the protons in the sample will have
the same value f of the Larmor frequency (Eq. I.1). The signal re-emitted by the relaxing nuclei will also comprise a single component, at frequency f. To allow spatial discrimination, a magnetic gradient is applied. Hence the protons in the sample will have a Larmor
frequency that depends on their position. RF pulses at the appropriate frequency can then be
used to measure the density of the nuclei at a given position in the sample.
In this thesis, MRI was used to monitor the drying process of specimens filled with pure-
water or salt solutions. Two experimental set-ups were used: one allowing one-dimensional
(1D) determination of hydrogen and sodium and the other allowing two-dimensional (2D)
determination of hydrogen. The experiments were performed during two stays with the group
Transport in Permeable Media at the department of Applied Physics of the Eindhoven
University of Technology in the Netherlands.

Magnetic resonance imaging AI.3
I.2 One-dimensional technique
The 1D MRI setup (Pel 1995) was used to monitor the drying experiments presented in
section 5.6. The NMR apparatus is depicted in Fig. I.1. In this, an iron-cored electromagnet is
used to produce a magnetic field of 0.78 T. Anderson gradient coils generate a constant
gradient of 0.3 T/m over this main field in the vertical direction. This allows a one-dimensional
resolution of the order of 1 mm in this direction. Each of the obtained NMR values
corresponds, therefore, to the number of ions in a transverse section of the sample with
thickness of 1 mm.
Fig. I.1 - NMR set-up for 1D measurements at TU/e composed by, from left to right:
power supplies and RF transmitter, electromagnet; RF receiver; data-acquisition system
Cylindrical specimens of 20 mm diameter are used. The drying experiments were performed
on plaster/brick specimens filled with pure water, NaCl solution or Na2SO4 solution. The
specimens are, after being contaminated, wrapped in Teflon tape (Fig. I.2) in order to prevent
bottom or lateral evaporation. Immediately afterwards they are inserted in the sample-holder,
which is located in the middle of the NMR coil (Fig. I.3), and allowed to dry under an airflow
at 0%RH (temperature ≈ 18ºC).
A step motor is used to move the cylindrical specimen in the vertical direction, that is, over
the length of the sample, at length indents of at least 1 mm. The NMR measurements are
carried out at each position. The length indents are conveniently pre-established. The
smaller they are the higher the resolution but also the longer the time needed to obtain one
entire profile. In these experiments, indents of 1 mm were used close to the plaster/substrate
interface (typically within a 1 cm band). In the rest of the sample indents of 2 mm were used.
The results of the drying experiments are given as profiles expressing the concentration, in
arbitrary units (a.u.), of the H+ or Na+ ion over the length of the specimen (Fig. I.4). Each
profile corresponds to a different moment of the drying process. The several profiles obtained
within one drying experiment give the evolution over time of the moisture content across the
specimen.

AI.4 Annex I
Fig. I.2 – Test-specimen Fig. I.3 – NMR RF set-up, with
specimen inside the central
sample-holder, and air-flow tube
.
Brick
Plaster
Sealing
Liquid transport
Vapour transport
Step-motor
movement direction
MEP5 - fully sat NaCl 2m
0
0.2
0.4
0.6
0.8
1
0 10 20 30 40 50 60
Position (mm)
Concentration H+ (a.u.)
initial
0h
10h
20h
30h
50h
70h
160h
Fig. I.4 – Moisture distribution profiles obtained during one drying experiment
and afterwards normalized (above). Representation of the measured specimen
(below). The dashed line in the graph corresponds to an initial profile obtained
in every experiment before the air flow was turned on.
RF pulses of 33 MHz and 8.9 MHz corresponding to the Larmor frequency at 0.8 T of H+ and
Na+, respectively, were used. Because of the echo times used in the experiments for Na+
(TE=800 µs) only dissolved nuclei are measured, that is, no signal is obtained from salt
crystals. The length of the samples was approximately 50 mm in all cases which resulted in
acquisition times for one entire profile of 0.5 hours for pure water, when only H+ was
measured, or 1.5 hours for the salt solutions, when both H+ and Na+ were measured. During
the drying experiments, profiles were collected every 1h for pure water and every 2h for the
salt solutions. However, due to the insufficient signal-to-noise ratio achieved for Na+ in these
samples, these profiles were not used. Therefore, only the H+ profiles are presented and
analysed in this thesis. The operational parameters (Eq. I.2) used for H+ were: TR= 1.5 sec,
TE =205 µs.

Magnetic resonance imaging AI.5
The NMR signal may be affected by magnetic impurities in the material, e.g., ferromagnetic
impurities. Therefore, it was necessary to verify if the proportionality constant ρ in Eq. 4.16 varied between the two materials in a single specimen. For that purpose, the water content
obtained after full immersion of brick or MEP samples in pure water during an overnight
(Table I.1) was divided by the mean normalized NMR signal value obtained in the initial
profile of the experiments performed with pure water on fully saturated specimens (that is,
the experiment on specimen MEP5 whose results are depicted in Fig. 5.18, as well as an
additional short experiment performed on MEP1 specimen). As seen in Fig. I.5, the obtained
correlation values have a limited dispersion: their maximum amplitude of variation
corresponds to around 10% of the average value. Hence, the NMR signal was assumed as
being proportional to moisture content regardless of the material involved.
Specimens fully saturated with pure water
MEP1MEP1MEP 5
MEP 5
0
0.001
0.002
0.003
0.004
0.005
MEP Brick
WCsat (kg/m
3) / NMR signal (a.u)
Fig. I.5 – Ratio between moisture content and NMR signal
for MEP plaster and brick
Table I.1 - Water content of MEP plaster and brick
after total immersion in pure water for an overnight
Water content (kg/m3)
MEP plaster 224
Brick 247
I.3 Two-dimensional technique
The 2D MRI set-up (Fig. I.6) was used to monitor the drying experiments presented in
Chapter 4 and in sections 5.7 and 5.8. In these experiments, only the H+ ion, hence water,
was measured. This set-up incorporates an iron-cored electromagnet operating at a field of
0.8 T.
Fig. I.6 – NMR set-up for 2D measurements at TUE composed by, from left to right:
computer; data acquisition and RF transmitter; RF receiver; electro magnet; power supplies.
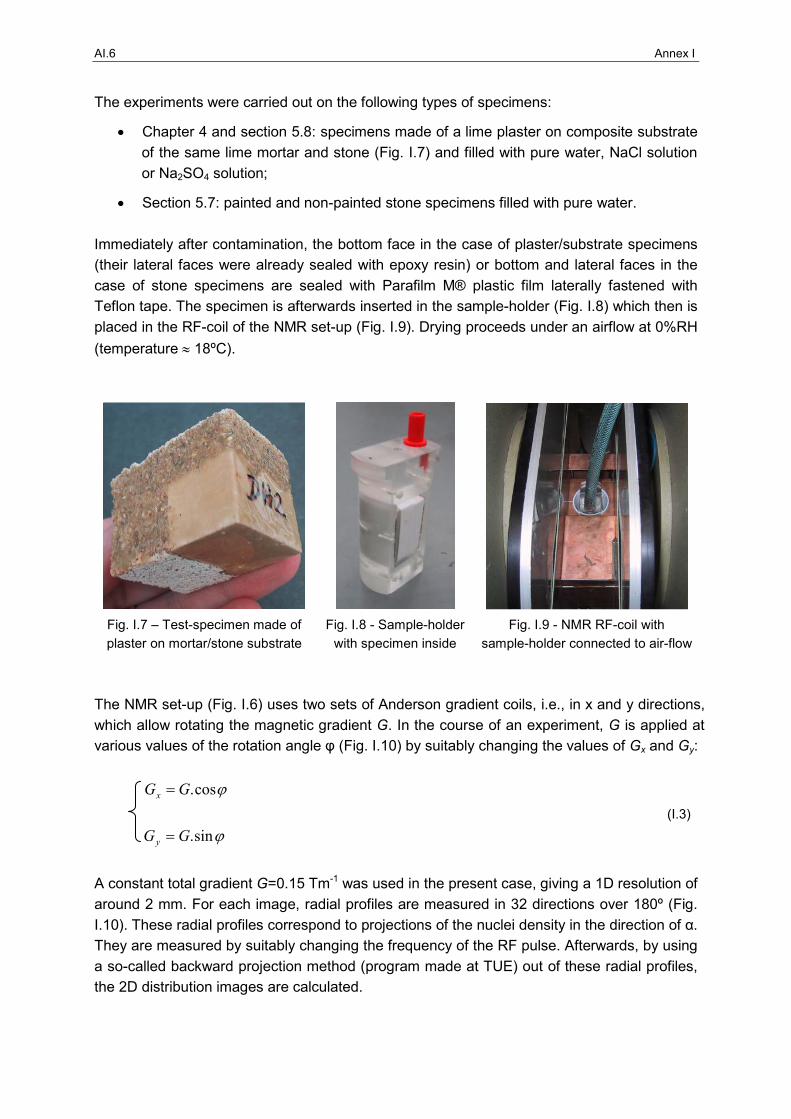
AI.6 Annex I
The experiments were carried out on the following types of specimens:
• Chapter 4 and section 5.8: specimens made of a lime plaster on composite substrate
of the same lime mortar and stone (Fig. I.7) and filled with pure water, NaCl solution
or Na2SO4 solution;
• Section 5.7: painted and non-painted stone specimens filled with pure water.
Immediately after contamination, the bottom face in the case of plaster/substrate specimens
(their lateral faces were already sealed with epoxy resin) or bottom and lateral faces in the
case of stone specimens are sealed with Parafilm M® plastic film laterally fastened with
Teflon tape. The specimen is afterwards inserted in the sample-holder (Fig. I.8) which then is
placed in the RF-coil of the NMR set-up (Fig. I.9). Drying proceeds under an airflow at 0%RH
(temperature ≈ 18ºC).
Fig. I.7 – Test-specimen made of
plaster on mortar/stone substrate
Fig. I.8 - Sample-holder
with specimen inside
Fig. I.9 - NMR RF-coil with
sample-holder connected to air-flow
The NMR set-up (Fig. I.6) uses two sets of Anderson gradient coils, i.e., in x and y directions,
which allow rotating the magnetic gradient G. In the course of an experiment, G is applied at various values of the rotation angle φ (Fig. I.10) by suitably changing the values of Gx and Gy:
ϕcos.GGx =
(I.3)
ϕsin.GGy =
A constant total gradient G=0.15 Tm-1 was used in the present case, giving a 1D resolution of
around 2 mm. For each image, radial profiles are measured in 32 directions over 180º (Fig.
I.10). These radial profiles correspond to projections of the nuclei density in the direction of α.
They are measured by suitably changing the frequency of the RF pulse. Afterwards, by using
a so-called backward projection method (program made at TUE) out of these radial profiles,
the 2D distribution images are calculated.

Magnetic resonance imaging AI.7
Fig. I.10 - Representation of 2D measurement on a sample. Using variable
Gx and Gy gradients, projections are measured in different α directions.
The measurement of single profile with m points (Fig. I.10) would take m*TR. Since TR is very long (1.3 sec) this would lead to unacceptable measurement times. Therefore the
profiles are measured using a so-called multiple slice spin-echo sequence. In multi-slice
techniques the waiting time between spin-echo measurements at a certain position (part of
TR is simply a waiting time) is used for doing measurements at a different position. By using
this sequence the measurement time was cut by a factor of 4.
The NMR signal had to be averaged in order in improve the signal/noise ratio (S/N). Indeed,
the signal adds linearly, while the noise, being random accumulates by a factor of the square
root of n (S/N~√n), n the number of measurements carried out and then averaged. Therefore, the higher n the better the S/N ratio. However, the higher n the longer the time needed for obtaining one image. In most cases, it is not feasible to have very long times for the image
acquisition and a compromise has to be found. In the present experiments, the image
acquisition time has to be reasonably short, when compared with the total time of the drying
experiment. Hence, each measurement was repeated three times, which resulted in a total
image acquisition time of 30 min with suitable S/N ratio.
During the drying experiments, images were collected every 30 min. The results are, thus,
given as a sequence of 2D images (Fig. I.11) where the concentration, in arbitrary units
(a.u.), of the H+ ion is expressed by a colour scale. Each image corresponds to a given
moment of drying. The backwards projection program made at TUE, by which the 2D images
are obtained, allows also calculating 1D profiles, similar to those in Fig. I.4, at chosen cross-
sections of the specimen. Cross-sections CS1 and CS2 (Fig. I.10) were measured for some
of the experiments in this thesis.
Fig. I.11 - Example of a 2D NMR image obtained during one
drying experiment on a plaster/mortar/stone specimen (Fig. I.6).
Gy
Gx
ϕ=180*i/32
α
mortar stone
plaster
CS1 CS2

AI.8 Annex I
Since the NMR signal may be affected by impurities, it was necessary to verify also in this
case if the proportionality constant ρ in equation 4.16 varied for the different materials in the composite specimens depicted in Fig. I.7. This procedure was not applied to the specimens
that included one specific type of plaster (plaster H) whose water-repellent properties
changed in the course of the experiments (Fig. 5.35).
For each material, the average NMR signal value obtained at the very beginning of the drying
experiments with pure water (Fig. 4.9) was correlated with the capillary saturation moisture
content (Table 4.1). As seen in Fig. I.12, the correlation values were found to have limited
dispersion, hence, the NMR signal could be assumed as being proportional to the moisture
content regardless of the material involved. Figure I.13 depicts the MRI colour scale
expressed in terms of volumetric moisture content.
0
50
100
150
200
WCsat (kg/m
3 ) / NMR Signal Plaster L Mortar L Stone D Stone M
DL1 ML1
CS1 CS1CS2 CS2
WCsat (kg/m
3) / NMR signal (a.u)
Fig. I.12 - Correlation moisture content / NMR signal
for plaster on mortar + stone specimens
Table I.2 - Water content of plaster L and
stones D and M at capillary saturation
Water content (kg/m3)
Plaster L 176
Stone D 112
Stone M 266
0 kg/m3248 kg/m3
Fig. I.13 - Colour scale for the 2D NMR measurements

Annex II – Making of the test specimens for set 1 tests
All test specimens used in set 1 crystallization tests (Chapter 5) were composed of a plaster
applied on brick or lime mortar substrate. Three different plasters were used: industrial
plasters MEP-SP® by Strasservil and Parlumière® by Lafarge Mortiers (both on brick
substrate) and traditional plaster LNEC (on each substrate). The plasters on brick substrate
were either non-painted or painted with silicone paint Funcosil® by Remmers.
The specimens had flat dimensions of 40 mm x 40 mm to 50 mm x 50 mm. The thickness of
the substrate was 20 mm (brick) or 30 mm (lime mortar). MEP-SP and Parlumière plasters
were composed of a single 20 mm thick mortar coat. LNEC plaster was composed of an
adherence coat and a base coat with thickness of 5 mm and 20 mm, respectively.
All the specimens were prepared by applying the fresh mortars on pre-wetted substrates.
MEP-SP and Parlumière specimens were prepared at LRMH within the scope of the
COMPASS project. The application was carried out on half-thickness (20 mm thick) bricks by
technicians from each supplier company. Specimens with flat dimensions of around 45 mm x
45 mm were later cut from the plastered bricks after removal of a 5 mm width border.
LNEC specimens were made at LNEC. The two traditional mortars that composed this
plaster were prepared according to the mixing procedure in EN standard 1015-2
(CEN 1998a) using a laboratory mixer according to EN standard 196-1 (CEN 1994):
(i) The water was introduced in the mixer. The amount of water was previously
determined by means of trial mixes as that needed to achieve a flow value of
175 ± 10 mm, measured according to EN standard 1015-3 (CEN 1999a).
(ii) The (previously mixed) dry materials were added over a period of 15 seconds with
the mixer working at low speed.
(iii) Mixing was continued for another 75 seconds at the same velocity.
Unlike MEP-SP and Parlumière, LNEC specimens had to be made individually because the
traditional mortars disaggregated when cut. Hence, brick and lime mortar bases were
prepared beforehand:
(i) Half-thickness (20 mm thick) bricks were cut into small blocks with flat dimensions of
around 45 mm x 45 mm.

AII.2 Annex II
(ii) Lime mortar bases were made with flat dimensions of 50 mm x 50 mm and a
thickness of 30 mm in metallic moulds. The above-described mixing procedure was
followed to prepare these mortar bases. The bases cured during one month in a
conditioned room at 20ºC and 65%RH (demoulding was carried out at the end of the
first week).
Both mortars that compose LNEC plaster were laid with the help of acrylic plaques. The
plaques were placed laterally during the application and removed after around 15 minutes.
After application of the adherence coat, the specimens cured during one week in the same
conditioned room. Then, the base coat was applied. The specimens were kept in the same
conditioned room during the following three months before testing.
Silicone paint Funcosil® was applied with a brush in a single hand when the specimens were
one month old.
Table II.1 - Tested specimens
Substrate
Dutch red brick Pure lime mortar
Contaminant solution Plaster Thickness Paint
NaCl Na2SO
4 Pure water
NaCl Na2SO
4 Pure water
Non-painted
S10 S11 S12
S15 S16
S7 S8 S9
- - -
MEP-SP® 20 mm
Silicone paint
S4 S5 S6
S17 S18
S1 S2 S3
- - -
Non-painted
P10 P11 P12
P15 P16
P7 P8 P9
- - -
Parlumière® 20 mm
Silicone paint
P4 P5 P6
- P1 P2 P3
- - -
Non-painted
LS6 LS7 LS10
LS12 LS13 LS14
LS1 LS3
LS11C LS12C LS13C
LS14C LS15C LS16C
LS9C
LNEC Adherence coat
+ Base coat
5 mm +
20 mm Silicone paint
LS19 LS20 LS21
LS16 LS17 LS18
LS4 LS11
- - -

Annex III - Damage assessment and diagnosis form
This damage assessment and diagnosis form was compiled within the European research
project COMPASS (TNO 2001). It was used for guiding the inspections carried out in the five
case studies presented in Chapter 6 and has the following structure:
1 - SUMMARY
• Name of the building – Location
• Type of damage – decay pattern
• Materials concerned
• Tests performed
• Diagnosis
• Advice
2 - INSPECTIONS
• Date of inspection + description
• Researcher / Institute in charge of the investigation
• Reference number
3 - GENERAL INFORMATION
• Name of the building
• Address
• Owner / Responsible authority of the building
• Construction phases + date (year)
• Relevant historical calamities
• Function(s) of the building over time
• Present function (use of installations)
• Pictures of the building
• Plan of the location of the building
• Building plan

AIII.2 Annex III
4 - STATE OF CONSERVATION OF THE BUILDING
• Type of damage and condition assessment (excellent, good, reasonable, inadequate,
poor, very poor):
- Roof
- Façades
- Structural elements
- Interior
- Floor
- Ceiling
• Restorations or maintenance interventions performed in the past (as far as relevant):
- Type of restorations or maintenance
- Building part
- Date
- Company performing the restorations
- Reason for restorations
- Further information
5 - DAMAGE
• Type of damage and architectural element affected
• Location of damaged area
• Extent of damaged area (%) and depth (mm)
• Evolution of the damage
• Type of damage and material(s) concerned:
- Wall as a whole
- Masonry elements (brick or stone)
- Mortar
- (Re)Pointing
- Render/plaster
- Other coverings
6 - ILLUSTRATIONS
• Building plan – location of the sampling
• Pictures of damaged areas
7 - ENVIRONMENT
• Climatological circumstances
• Exposition (rain, wind, etc)
• Surrounding environment (urban/rural/industrial, coastal/interior)
• Additional data
8 - DIAGNOSIS
• Hypothesis(es)
• Tests performed
• Result of tests
• Diagnosis
9 - ADVICE