a material and structural analysis of earthbag housingearthbagbuilding.com/pdf/vadgama.pdf ·...
TRANSCRIPT

A MATERIAL AND
STRUCTURAL ANALYSIS
OF EARTHBAG HOUSING
Student: Nikul Vadgama
Supervisor: Dr. Andrew Heath
MEng Dissertation
April 2010
Department of Architecture & Civil Engineering

i
Abstract
The use of earthbags as structural material for housing has grown in popularity over the past
decade; however, research into its structural behaviour is limited. Current design relies on
previous experience or trial and error. If the use of earthbags as building material is to develop,
an understanding into its material properties and structural behaviour is needed. By way of
empirical analysis this dissertation aims to investigate the material mechanics of sand filled
earthbags and establish a set of material parameters which will aid the design of earthbag
structures.
The dissertation is collaborative with Fielden Clegg Bradley Studios who plan to build earthbag
housing in Namibia. Test parameters for this dissertation have been chosen specifically to help
inform the project, which in turn provides a physical bearing to the experimental programme and
analysis.
The behaviour of earthbags under uniaxial compression was investigated. The effect of material
fill level, stack height, addition of stabiliser and bag material on the compressive strength were
explored. From testing it was concluded that earthbags are unlikely to fail due to compression
within a structure. Furthermore the current simplified theoretical model assuming a cross section
with lateral semi-circular profiles provides acceptably accurate estimations of the vertical load
capacity of earthbags.
Large scale direct shear box tests were performed to quantify the shear resistance between
earthbags. Variations in bag material and the inclusion of barbwire were examined. A hessian on
hessian interface provided the highest coefficient of friction. The inclusion of barbwire also
improved the coefficient of friction between the earthbags are provided an initial cohesion.
Load testing on earthbag arches were performed to gain an understanding how the material
parameters affect the structural performance. The addition of 4% cement to the earthbags was
found to increase the load capacity of the arch by 76% and alter the overall behaviour of the arch
to a linear elastic structure up to 6kN applied load. The behaviour of an unstabilised arch is non-
linear, owing to the flexible nature of the bags. Premature shear failure of the earthbags was not
experienced therefore the addition of barbwire between bags did not affect the load capacity of
the arch.
This dissertation provides an insight into the material and structural behaviour of earthbags. To
further establish a set of structural parameters for design, research into the behaviour of
earthbags in defined structural systems should be undertaken.

ii
Acknowledgements
The author would like to acknowledge the invaluable support and guidance provided by Dr.
Andrew Heath during the course of this dissertation, and throughout the author’s undergraduate
degree.
Gratitude also extends to Will Bazeley, Neil Price, Brian Purnell, and Sophie Hayward for their
time and expertise with laboratory experiments.
Also thanks extend to Nicola du Pisanie for her enthusiasm and advice throughout the
dissertation. For his assistance with laboratory experiments, organisation and motivational work
ethic the author thanks Ralph Pelly.
Finally, to my family and friends for their support throughout.

iii
Contents
Abstract .......................................................................................................................................................... i
Acknowledgements ....................................................................................................................................... ii
List of Figures ............................................................................................................................................... v
List of Tables .............................................................................................................................................. vii
List of Symbols and Abbreviations ............................................................................................................. vii
1 Introduction ........................................................................................................................................... 1
1.1 General Introduction ..................................................................................................................... 1
1.2 Objective of Dissertation .............................................................................................................. 2
1.3 Organisation of Dissertation ......................................................................................................... 2
2 Namibia Project .................................................................................................................................... 3
3 Literature Review .................................................................................................................................. 4
3.1 Introduction to Literature Review ................................................................................................. 4
3.2 Previous Research into Earthbags ................................................................................................. 4
3.3 Summary of Literature Review ..................................................................................................... 9
4 Theory ................................................................................................................................................. 11
4.1 Initial Conditions and Assumptions ............................................................................................ 11
4.2 Compressive Strength of Earthbags ............................................................................................ 11
4.2.1 Assuming earthbag cross section as rectangular ................................................................. 12
4.2.2 Assuming earthbag cross section with semi-circular lateral edges ..................................... 14
4.2.3 Summary of theoretical compressive strength of earthbag ................................................. 16
4.3 Shear Strength of Earthbags ........................................................................................................ 17
4.4 Theoretical Earthbag Arch Mechanism ...................................................................................... 18
5 Laboratory Testing .............................................................................................................................. 20
5.1 Soil Analysis ............................................................................................................................... 20
5.1.1 Sieve Test ............................................................................................................................ 20
5.1.2 Shear Box Tests .................................................................................................................. 20
5.2 Tensile Tests on Bag Material .................................................................................................... 20
5.3 Compression Tests ...................................................................................................................... 20
5.4 Shear Tests .................................................................................................................................. 22
5.5 Arch Test ..................................................................................................................................... 23
5.5.1 Stabilised Arch Tests .......................................................................................................... 24

iv
6 Results & Analysis .............................................................................................................................. 25
6.1 Soil Analysis ............................................................................................................................... 25
6.1.1 Sieve Tests .......................................................................................................................... 25
6.1.2 Shear Box Tests .................................................................................................................. 25
6.2 Tensile Test on Bag Material ...................................................................................................... 26
6.3 Compression Tests ...................................................................................................................... 27
6.3.1 Three earthbag stack ........................................................................................................... 27
6.3.2 Five earthbag stack.............................................................................................................. 30
6.3.3 Eight earthbag stack ............................................................................................................ 30
6.3.4 Comparison between experimental results with theoretical predictions ............................. 33
6.3.5 Sources of error in experimental and theoretical work ....................................................... 36
6.3.6 Summary and conclusion of compression tests .................................................................. 37
6.4 Shear Test of Earthbags .............................................................................................................. 38
6.4.1 Shear resistance in earthbag structures ............................................................................... 41
6.5 Arch Test ..................................................................................................................................... 44
6.5.1 Earthbag arches loaded at quarter span ............................................................................... 45
6.5.2 Summary and conclusion of earthbag arch tests ................................................................. 48
7 Conclusion .......................................................................................................................................... 49
7.1 Future Work ................................................................................................................................ 50
Bibliography ............................................................................................................................................... 51
Appendix A ................................................................................................................................................. 53
Appendix B ................................................................................................................................................. 54
Appendix C ................................................................................................................................................. 55
Appendix D ................................................................................................................................................. 59
Appendix E ................................................................................................................................................. 60
Appendices can be found in accompanying C.D.

v
List of Figures
Figure 1: Construction of earthbag domes by Cal-Earth ( Cal-Earth Inc. / Geltaftan, 2010). ...................... 1
Figure 2: Aluminium rods wrapped in Japanese paper under compression (Matsuoka & Liu, 2003). ......... 4
Figure 3: Variation in tensile stress in the bag material for an interlock interface with different vertical
displacements, found from finite element model (Tantono, 2007). .............................................................. 5
Figure 4: Apparatus for biaxial compression test on 2D model earthbags and variation of the apparent
cohesion of the inclined earthbags c(δ), where δ is angle of inclination (Matsuoka & Liu, 2003). ............. 6
Figure 5: Earthbag pile before and after compression test, showing global shear band (Lohani et al.,
2006). ............................................................................................................................................................ 7
Figure 6: Free body diagram a) vertically and b) horizontally through earthbag under uniform vertical
loading. ....................................................................................................................................................... 13
Figure 7: Mohr’s Circle showing failure envelope of the earthbag where σv > σh. ..................................... 13
Figure 8: Free body diagram a) vertically and b) horizontally through earthbag with lateral semi-circular
edges. .......................................................................................................................................................... 15
Figure 9: Mohr’s circle showing the affect of the application of cement on granular fill. ......................... 16
Figure 10: Theoretical failure mode of barbwire under direct shear a) overall view b) failure by bending c)
rigid body shear failure. .............................................................................................................................. 18
Figure 11: Force equilibrium about barbwire point showing lateral resistance of soil against applied lateral
force from the soil and bag material. .......................................................................................................... 18
Figure 12: Arrangement for eight earthbag stack compression tests .......................................................... 21
Figure 13: Earthbag shear test apparatus .................................................................................................... 22
Figure 14: Arch test apparatus .................................................................................................................... 24
Figure 15: Shear box test; shear stress at failure against effective stress normal to the failure plane. ....... 25
Figure 16: Stress strain relationship from tensile tests of all bag material samples. ................................... 26
Figure 17: Compression test results of three 100gsm polypropylene earthbags with varying amount of fill.
.................................................................................................................................................................... 28
Figure 18: Three earthbag 100gsm polypropylene stack compression test showing enlarged section of
load displacement graph. ............................................................................................................................ 29
Figure 19: Stress strain relationship of earthbags in compression, with variation in stack height ............. 30
Figure 20: Location of transducers, failure points in bag material and recover of earthbag stack after
unloading .................................................................................................................................................... 31
Figure 21: Load displacement graph for eight stabilised 100gsm polypropylene, unstabilised 100gsm
polypropylene and unstabilised 70gsm polypropylene earthbags. .............................................................. 31
Figure 22: Tearing of 70gsm polypropylene earthbags after compression test .......................................... 32
Figure 23: Ratio of measured volume of earthbag in 8 bag stack to initial volume of earthbag against
displacement of platen ................................................................................................................................ 35
Figure 24: Shear strength against normal compressive stress for large shear box experiment with variation
in interface between earthbags. ................................................................................................................... 38
Figure 25: Interface between hessian earthbags after large shear box test ................................................. 39
Figure 26: Image of earthbag showing points where bag material was torn during direct shear test. ........ 40
Figure 27: Predicted shear failure mode of earthbags in a dome structure subject to a line load. .............. 41

vi
Figure 28: Comparison between shear resistance due to friction between earthbags and due to barbwire
mechanism in a hemispherical dome. ......................................................................................................... 43
Figure 29: Picture of earthbag and abutment for first unstabilised earthbag arch test ................................ 45
Figure 30: Photos from stabilised arch test showing hinge mechanism failure of arch .............................. 47
Figure 31: Masonry arch analysis using Ring 2.0 ....................................................................................... 47
Figure 32: Load displacement graph for earthbag arches loaded at quarter span ....................................... 48
Figure 33: Dry sieve analysis of Kuiseb riverbed sand, near Gobabeb. ..................................................... 53
Figure 34: Dry sieve analysis builders sand - Bath ..................................................................................... 53
Figure 35: Diagram showing how earthbags were measured. .................................................................... 54
Figure 36: Large scale shear box test for 100gsm polypropylene earthbag no barbwire - 2.2kN applied
normal load ................................................................................................................................................. 55
Figure 37: Large scale shear box test for 100gsm polypropylene earthbag no barbwire - 7.1kN applied
normal load ................................................................................................................................................. 55
Figure 38: Large scale shear box test for 100gsm polypropylene earthbag no barbwire - 12.0kN applied
normal load ................................................................................................................................................. 56
Figure 39: Large scale shear box test for 100gsm polypropylene earthbag no barbwire - 17.0kN applied
normal load ................................................................................................................................................. 56
Figure 40: Large scale shear box test for 100gsm polypropylene earthbag with barbwire - 2.2kN applied
normal load ................................................................................................................................................. 57
Figure 41: Large scale shear box test for 100gsm polypropylene earthbag with barbwire - 7.1kN applied
normal load ................................................................................................................................................. 57
Figure 42: Large scale shear box test for 100gsm polypropylene earthbag with barbwire - 12.0kN applied
normal load ................................................................................................................................................. 58
Figure 43: Large scale shear box test – hessian earthbags .......................................................................... 58
Figure 44: Change in perimeter over initial perimeter of 70gsm polypropylene earthbag in 8bag
compression test against normalised displacement of loading platen ......................................................... 59
Figure 45: Single earthbag in hemisphere dome showing contact forces ................................................... 60

vii
List of Tables
Table 1: Tensile strengths of all bag material samples obtained from tensile tests……………………. 26
Table 2: Summary of earthbag compression test results 33
Table 3: Comparison between measured bag width with theoretical bag width at failure load……….. 34
Table 4: Comparison between theoretical vertical deformation and experimental vertical deformation
of an earthbag...........................................................................................................................................
35
Table 5: Comparison between theoretical and experimental failure loads of the earthbags under
vertical compression…………………………………………………………………………………….
36
Table 6: Horizontal displacement at which shear strength was mobilised…………………………….. 38
Table 7: Summary of results from earthbag arch tests…………………………………………………. 44
Table 8: Earthbag dimensions and densities for compression tests……………………………………. 54
Table 9: Moisture content of sand for barbwire and stabilised arch tests……………………………… 54
List of Symbols and Abbreviations
µ Coefficient of friction
φ Internal friction angle of material fill
σh Horizontal stress exerted by soil onto the bag material ���� Tensile stress in bag material ��������� Limit tensile stress in bag material
σv Vertical stress exerted by the soil onto the bag material
B0, B Initial width and current width of earthbag
E Elastic modulus of bag material
H0, H Initial height and current height of earthbag
K Stress ratio in the soil inside the earthbag
L0, L Initial perimeter and current perimeter of earthbag
Pa Axial force in barbwire point
Ps External direct shear force
PT Tension force in barbwire strand
pv External applied vertical pressure
Pv External applied vertical load
t Thickness of bag material
T Tension force in bag material
V0, V Initial volume and current volume of earthbag
x Vertical deformation of earthbag
FCBS Fielden Clegg Bradley Studios
LVDT Linear variable displacement transducer

1. Introduction
1
1 Introduction
1.1 General Introduction
The issue of sustainability in the built environment can be defined in a variety of ways; Kibbert
(1994) expresses it as: ‘The creation and management of a healthy built environment based on
resource efficient and ecological parameters.’ Sustainable design requires an efficient,
intelligent use and allocation of our natural resources, which must be balanced with social and
economic criteria. Often the economic criterion governs, leading to unsustainable design focused
primarily on short term needs. Much of the developing world live in poor housing due to a lack
of economic support, limited resources and/or a lack of construction knowledge. There is no
forthright solution, however in many cases; particularly rural areas where resources are limited,
earthbag construction offers many benefits.
Earthbags (also known as soilbags or sandbags) are polymer material or burlap (hessian) bags
filled with granular materials. The application of earthbags is long been used as temporary
construction. Its use as flood protection and military walls is well established; however, its use as
permanent structure has been growing in popularity. As well as material for housing, earthbags
have been used as facing for reinforced soil retaining walls and to increase the bearing capacity
of footings. Earthbag housing usually consists of earthbags stacked in a corbelled fashion to
create a catenary dome, with layers of barbwire between courses to provide shear resistance.
Figure 1: Construction of earthbag domes by Cal-Earth ( Cal-Earth Inc. / Geltaftan, 2010).
Exploration into earthbag housing can be dated back to the 1970’s and the work of Gernot
Minke. Minke’s research explored fabric bags filled with pumice used in corbelled shaped
domes. However, it was the work of Nader Khalili and his organisation Cal-Earth who
popularised the use of earthbags as structural material for housing. Khalili used barbwire
between courses to provide tensile strength to the structure and allows shear transfer between
courses.
1. Introduction
2
Earthbag construction is suited for developing countries given it is economic, does not require
any large processes or highly skilled construction labour, the materials required are easily
attainable and the construction process is relatively quick. These attributes also make earthbag
construction ideal for disaster relief housing. With earthbag housing the surrounding soil can be
used to fill the bags, hence making the construction technique efficient and sustainable.
1.2 Objective of Dissertation
Although the construction method for earthbag housing is well developed, the understanding and
research into the mechanical behaviour of earthbags and failure modes of earthbag structures is
not. If the application of earthbags for housing is to develop, then further structural and material
analysis of earthbag structures must take place to give confidence to construct with earthbags.
The aim of this dissertation is to investigate the material mechanics of earthbags to establish a set
of material properties needed for structural analysis of earthbag housing. This will be achieved
through a series of experiments and analysis into the soil properties, bag properties, earthbag
structural properties and effects from stabilisation of the earthbags. A full description of the
laboratory experiments undertaken is given in §5.
This research was undertaken in conjunction with Pelly (2010), whose dissertation explores
using the material properties to investigate the geometrical limitations of earthbag structures.
1.3 Organisation of Dissertation
Chapter 2: Outline of proposed project in Namibia, building sandbag structure housing for the
Topnaar community and how this project relates to the dissertation.
Chapter 3: A review of literature relevant to earthbag housing and the properties of earthbags
has been undertaken to establish current knowledge on the subject and areas that can be further
explored.
Chapter 4: Explanation of theoretical modelling of earthbag structures for compression, shear
and arch tests.
Chapter 5: Description of experimental procedure used for soil analysis, compression, shear and
arch tests.
Chapter 6: Presentation of results from experimental programme and analysis of the results with
respect to theoretical predictions.
Chapter 7: Conclusions from experiments and proposal for further investigation is outlined.
2. Namibia Project
3
2 Namibia Project
Earthbag structures are generally explicit to their surrounding conditions. The material fill is
often taken directly from the ground the structure is based and the bag material varies to
whatever is attainable. Hence, each project can only rely so much on previous experience; a
further fundamental understanding of material behaviour is required to aid design. Given the
variability of materials employed a defined scope was needed to narrow the potential research
areas of this dissertation.
The dissertation is collaborative with Fielden Clegg Bradley Studios who are working to
construct earthbag dome structures in Gobabeb, Namibia. This connection with the project has
helped direct test parameters and provide tangible relevance to the results from this dissertation.
The aim of the Namibia project is to introduce the earthbag construction technique to the local
Topnaar community through a prototype build, which the Topnaar can independently use for
their own homes if they wish.
Currently the majority of the Topnaar live in salvaged timber frame houses with corrugated
metal sheet cladding. The houses have no real thermal resistance, hence are very hot during
summer (recorded 5-7°C hotter internally than externally (du Pisanie, 2009) ) and extremely cold
during the colder spells. FBCS look to introduce a building technique which was more suited to
the desert climate. Earthbag housing was selected as it provides high thermally mass, thus is less
susceptible to diurnal temperature fluctuations. In addition all the materials can be easily
sourced; the fill itself can be taken from the nearby river plain. It is very quick to build and can
be built with mainly unskilled labour, with one or two experienced people co-ordinating. The
construction requires a large workforce, thus will require the whole community to participate.
FCBS hope this will bring the community together and implement the building technique across
the community.
To relate to the build in Namibia this paper has only considered fine sand with no clay content as
fill; hence replicated something similar to that found in Gobabeb, Namibia (see Appendix A).
Varying the clay content will affect the cohesion of the fill, and potentially provide a more rigid
block. However, each variation of clay content would need to be tested for the compression,
shear and arch tests. This quantity of testing is unrealistic in the time frame of this dissertation,
hence is not considered. A stabilised case has been considered for the arch and compression
tests, to improve the stiffness of the earthbag, as this is a viable option for the Gobabeb project.
Finally, no earthbags over 20kg will be tested as a weight over this amount becomes difficult to
manoeuvre in construction.

3. Literature Review
4
3 Literature Review
3.1 Introduction to Literature Review
A literature review was undertaken to establish current understanding of earthbag structures and
how previous research has approached the subject both experimentally and analytically. As
previously mentioned in §1.2 to establish a design practice for earthbag structures a greater
understanding of their material properties and structural failure modes is needed. From the
literature review it was found that previous material analysis on earthbags as building material is
limited, however, analysis in relation to their use as earth reinforcement has been investigated.
Experimental research into the compressive and shear strength of earthbags has been undertaken
and is discussed in the following chapter.
3.2 Previous Research into Earthbags
Matsuoka & Liu, 2003 investigated the application of earthbags as ‘reinforcement for ballast
foundations under railway sleeper, reinforcement for soft building foundations and construction
of retaining walls’. Early 2D models consisted of bearing tests on 50mm long aluminium rods,
which had a specific gravity Gs of 2.69 similar to that of soil particles (2.65) (Matsuoka & Liu,
2003). The aim of the experiments was to improve the bearing capacity of the rods by use of
Japanese paper as reinforcement. Load was applied to the rods via a footing (Figure 2). The
paper was used as tensile reinforcement and wrapped around the aluminium rods thereby
producing a stiff region within which relatively less deformation occurs, furthermore the region
underwent movement concurrent with the footing as shown in Figure 2. The vertical load applied
causes the aluminium rods to push outward which induces a tensile force into the paper; this in
turn exerts an equal and opposite stress to the rods. It was found that this model can be applied to
earthbags and analysed with a Mohr-Coulomb failure criterion to give the failure load of
earthbags which is outlined later in this paper. Significantly, Matsuoka & Liu (2003) outlined
that the compressive capacity of the earthbag is limited by the tensile capacity of the bag
material. Hence if the tensile capacity of the bag material is known, from a Mohr-Coulomb
failure envelope, the external compressive force which causes failure can be deduced.
Figure 2: Aluminium rods wrapped in Japanese paper under compression (Matsuoka & Liu,
2003).

Matsuoka & Liu (2003) verified the theoretical analysis of
with biaxial compression tests on aluminium rods
useful to support the theoretical analysis however are limited in that they do not consider the 3D
confining effect; thus in reality earthbags will exhibit a higher strength than the theory suggests.
Furthermore the analysis assumes a frictionless interface between the bag material and the fill
This is not true, there is likely to be some particle interlock at the interface and
shear deformation vertically through the earthbag is non linear. Furthermore
the bag varies across the section contrary to the assumption made by Matsuoka & Liu (2003)
From previous compression test (
2008) the earthbags tend to fail at the top and bottom faces,
horizontal stresses can be considered to cause the bag material to reach its tensile capacity and no
vertical confinement is provided by the bag
undertaken by Tantono (2007) considering particle inte
the tensile stresses in the middle of the bag materi
Furthermore this assumption would
been further explored in §4.2.1.
Figure 3: Variation in tensile stress in the bag material for an interlock interface with different
vertical displacements, found from finite element model
In reality earthbags are likely to be loaded in various directions,
investigated the effect of inclined loads on the apparent cohesion of the earthbag using biaxial
compression tests, see Figure 4. The earthbags
the load (Matsuoka & Liu, 2003)
reduces as the load inclination tends to 45°
considering earthbags in a dome structure were the load
3
fied the theoretical analysis of the strength properties of earthbags
with biaxial compression tests on aluminium rods wrapped in paper. These 2D experiments were
useful to support the theoretical analysis however are limited in that they do not consider the 3D
reality earthbags will exhibit a higher strength than the theory suggests.
Furthermore the analysis assumes a frictionless interface between the bag material and the fill
there is likely to be some particle interlock at the interface and the distribution of
shear deformation vertically through the earthbag is non linear. Furthermore the tensile force in
across the section contrary to the assumption made by Matsuoka & Liu (2003)
From previous compression test (e.g. Lohani et al., 2006; Matsuoka & Liu, 2003 and Xu
2008) the earthbags tend to fail at the top and bottom faces, thus, it is fair to conclude that
horizontal stresses can be considered to cause the bag material to reach its tensile capacity and no
is provided by the bag. This is further support by finite element analysis
undertaken by Tantono (2007) considering particle interlock at the interface, which indicated that
the tensile stresses in the middle of the bag material were high than at the edges
tion would satisfy vertical equilibrium given pv = σv
Variation in tensile stress in the bag material for an interlock interface with different
, found from finite element model (Tantono, 2007).
In reality earthbags are likely to be loaded in various directions, Matsuoka &
investigated the effect of inclined loads on the apparent cohesion of the earthbag using biaxial
. The earthbags were inclined at 0 º, 15 º, 30º, 45º,
(Matsuoka & Liu, 2003). It was found that the apparent cohesion provided
he load inclination tends to 45°, where after it is 0. This is important when
considering earthbags in a dome structure were the load is inclined according to the thrust line,
3. Literature Review
5
the strength properties of earthbags
These 2D experiments were
useful to support the theoretical analysis however are limited in that they do not consider the 3D
reality earthbags will exhibit a higher strength than the theory suggests.
Furthermore the analysis assumes a frictionless interface between the bag material and the fill.
the distribution of
the tensile force in
across the section contrary to the assumption made by Matsuoka & Liu (2003).
2006; Matsuoka & Liu, 2003 and Xu et al.,
, it is fair to conclude that the
horizontal stresses can be considered to cause the bag material to reach its tensile capacity and no
. This is further support by finite element analysis
rlock at the interface, which indicated that
al were high than at the edges (see Figure 3).
v, this model has
Variation in tensile stress in the bag material for an interlock interface with different
Matsuoka & Liu (2003)
investigated the effect of inclined loads on the apparent cohesion of the earthbag using biaxial
45º, 60 º and 90 º to
apparent cohesion provided by the bag
, where after it is 0. This is important when
according to the thrust line,

3. Literature Review
6
through a section of the dome. Hence if the rise of the dome is lowered, apparent cohesion
provided by the bags and hence the compressive strength of the bags is reduced.
Figure 4: Apparatus for biaxial compression test on 2D model earthbags and variation of the
apparent cohesion of the inclined earthbags c(δ), where δ is angle of inclination (Matsuoka &
Liu, 2003).
Unconfined compression tests on earthbags were carried out by Matsuoka & Liu, (2003) with
various bag materials and fills although it is unclear exactly what bag materials were used as
conflicting information is given in the paper. The bag deformation was not recorded throughout
loading, thus the predicted failure loads are made with initial bag dimensions and as such were
lower than actual values. Furthermore no initial study on soil properties was undertaken, so no
experimental analysis into the failure load of the soil was undertaken.
Three bags were loaded at one time to reduce the effect of friction on the upper and lower ends
of the loading unit (Matsuoka & Liu, 2003). However, this would not be sufficiently high to
remove end restraint effects and hence lead to an overestimation of the earthbag strength and
inhibits a global shear band developing as noted by Lohani et al. (2006).
Lohani et al. (2006) conducted several experiments on the compressive and shear strength of an
earthbag pile. The study focuses on the application of earthbags for permanent civil engineering
structures. Like Matsuoka & Liu (2003), Lohani et al. (2006) concluded that the compressive
strength of the earthbag is limited by the rupture of the bag material. However, for the
compression tests, lateral deformation of the earthbags was recorded using 16 pulley type
LVDTs attached to the earthbags (Lohani et al., 2006). Hence analysis by Lohani et al. (2006)
used the deformed shape of the bag to calculate the earthbags’ compressive strength, rather than
initial values like Matsuoka & Lin, (2003) which underestimates the axial force required to cause
failure of the bag. A vibratory compactor was used to compact the earthbags; however, a hand
tamper has been used for this project given that this would be more likely used in the
construction of an earthbag house.
From the conducted axial compression tests by Lohani et al. (2006), four earthbags reach the
maximum capacity of the machine. Lohani et al. (2006) deduced that this was an overestimation

3. Literature Review
7
of the compressive strength and is due to the end restraint effects which are more apparent at low
ratios of height to width (H/B) of the pile. At low H/B ratios the bags are under additional
confinement at the ends, which prohibits lateral expansion of the bags and induces shear stress.
Thus compressive testing was also undertaken on earthbag piles with an H/W ratio ≥ 2. Figure 5
shows an earthbag pile with H/B = 2.43 (Lohani et al., 2006); it can be seen that lateral strains
reached the failure strain limit of the bag material, furthermore that a global shear band was able
to develop. For the compression tests undertaken by Matsuoka & Lin (2003) the H/W ratio was
measured to be 0.75, hence the effect of end restraint was higher leading to an overestimating of
the compressive strength.
Figure 5: Earthbag pile before and after compression test, showing global shear band (Lohani et
al., 2006).
Lateral shear test were performed on 2 piles consisting of 4 earthbags. The top platen was
moveable and the two piles were laterally in contact. A normal was applied to the piles and a
constant shear rate of 0.3mm/min was maintained (Lohani et al., 2006). It was found that
mobilisation of shear strength of the fill was higher in compression tests than in lateral shear test.
Furthermore the earthbag exhibited high anisotropic strength, due to the bags not being laterally
confined which resulted in negligible complementary shear developed between the vertical bag
piles. Lohani et al. (2006) concluded that this indicated the stress distribution within the bags
was non-uniform, which ‘results in a dominant overturning displacement mode of the soil bag
piles and therefore a low shear strength with highly contractive behavior’ (Lohani et al., 2006).
The angle of the major principal stress is inclined, according to the ratio of vertical to horizontal
force. Given the high anisotropic behaviour exhibited in these test, it can be shown that as the
inclination of the resultant compressive load increases towards 45º, a state of pure shear, the
shear strength of earthbag piles greatly reduces. This is supported by the Matsuoka & Liu (2003),
and highlights the importance of barbwire to transfer shear between earthbag courses.
Tantono (2007) extended the analytical model of Matsuoka & Liu (2003) and outlines numerical
simulations for the mechanical behaviour of earthbags under vertical compression for plane

3. Literature Review
8
strain condition. The analytical method made similar assumptions to Matsuoka & Liu (2003)
some of which are outlined in §4.1. From analytical analysis Tantono (2007) proved that the
ratio of perimeter to initial perimeter of the earthbag varies non-linearly with ratio of vertical
displacement of platen to the initial height of the earthbag. Hence for large axial strains the
assumption that the earthbag deforms under vertical load with constant volume does not hold
true, however at small strains it is fairly accurate. Tantono (2007) analytically showed that an
increase in the stress ratio (K= σv/σh), which is related to the critical friction angle of the soil,
provides a stiffer earthbag with a higher compressive capacity. This indicates that theoretically a
material fill with a higher friction angle will provide an earthbag with a high compressive
strength, however, as shown by Daigle (2008) experimentally this does not hold true (see page
9).
Tantono (2007) identified that the proposed analytical model by Matsuoka & Liu (2003) did not
satisfy local equilibrium close to the top and bottom of the earthbag, given the applied stress (pv)
does not equal the stress in the material (σv). Tantono (2007) proposed a new model with lateral
semicircular ends which satisfies both global and local equilibrium. In this model the stress ratio
is not assumed to be constant, the middle part of earthbag has a stress ratio K = 3, while the
semicircular areas have K = 1 (Tantono, 2007). It was found that the contribution of vertical
stress in the soil at the semicircular area provided local vertical equilibrium. Furthermore, in
comparison with the Matsuoka & Liu (2003) model, the Tantono (2007) model produces a
higher stress in the bag for a vertical displacement, therefore failure occurs at a lower vertical
load. This can be attributed to the different distributions of stress ratio chosen by the two models.
In this dissertation the Tantono (2007) model will be examined in relation to the experimental
data from vertical compression tests to assess its accuracy.
As previously outlined the analytical models assume a constant volume throughout loading,
however this does not hold for larger axial strains and finite element analysis could be used. An
adopted micro-polar continuum approach by Bauer & Huang (1999) is used to numerically
model the granular material within the bag. The model considers Cosserat rotations (local
particle rotations), sliding at the interface, void ratio, normal, shear and couple stresses (torque
per unit area). The equations for Cauchy stress tensor and couple stress tensor are incrementally
non-linear and considered with respect to hypoplasticity (Huang & Bauer, 2003).
The numerical analysis considered two scenarios, a frictionless and an interlock interface
between the soil and the bag. The frictionless model allowed local particle rotations and sliding
at the interface. It was found that the tensile stress in the bag is uniform; however, the stress ratio
inside the bag is inhomogeneous (Tantono, 2007). The stress ratio in the middle of the bag was
higher than at the side, in the hypoplastic material model, and with an increase in vertical
displacement tends towards K =3. The stress ratio at the lateral boundary was close to one; hence
verifying the assumptions for the simplified semi-circular model. Strain localisation occurred at
the points where the voids ratio is higher. The shear band thickness, location and orientation are

3. Literature Review
9
dependent upon the microstructure (mean grain size), vertical pressure, boundary conditions and
current state of the material (Roscoe, 1970).
From Tantono (2007) the numerical model with interlocked interface had a non uniform tensile
stress distribution in the bag material (see Figure 3); this is a more representative model of the
earthbag under vertical loading. The stresses were higher in the middle of the earthbag than at
the sides; furthermore the stress limit of the bag was reached earlier with the interlocked
interface than the frictionless. Hence, the load capacity of the earthbag with an assumed interlock
interface is lower than a frictionless. Unlike the frictionless model, no significant strain
localisation was experienced in the soil and the centre of the soil remained mainly in
compression.
From extensive research, Daigle (2008) currently provides the only structural investigation into
the direct application of earthbags as structural material for housing. Daigle (2008) considers the
structural behaviour of earthbags under vertical compressive loads, concentrating on producing a
standard testing procedure. Three fill materials were considered, crushed granite, topsoil and
Kingston topsoil with masonry sand. Crushed granite, although has the highest friction angle,
produced the lowest compressive strength earthbags, which can be attributed to the sharp corners
of the granite aggregate rubbing against the bag, causing the bag to tear.
Tensile tests on polypropylene bags were undertaken using a wide strip method according with
ASTM D 4595. Narrow strip method was avoided as the influence of edge effects (i.e. bowing of
the sample due to server Possion’s ratio effects (Daigle, 2008; Koerner, 1997) along the sides is
higher.
The paper provided a greater understanding of the behaviour of various fill materials. However,
only the granite reached failure, the other two reached the capacity of the loading machine, thus
their ultimate capacity is unknown. Too few material fills were considered for a valuable
quantitative analysis on the affect of material fill on the compressive strength of earthbags. Both
the topsoil and Kingston topsoil with masonry sand consisted of over 25% clay and silts; a
further analysis could have been undertaken to assess the effect of clay content on the stiffness of
earthbags. The outlined methodology for compression testing is simple to follow, however,
offers nothing new from previous research (e.g. Matsuoka & Liu, 2003; Lohani et al., 2006; Xu
et al., 2008).
3.3 Summary of Literature Review
Current research from Matsuoka & Liu (2003) and Tantono (2007) provides good analytical
models for the mechanics of earthbags under vertical compression. Furthermore Tantono (2007)
supplemented his analytical model with a FEM model; however, this model has only been
applied to small displacements, therefore may not be entirely accurate for the experiments.
Furthermore both analytical models consider a frictionless interface between the bag and the fill
which is unrealistic. The analytical models and the results from the numerical model will be

3. Literature Review
10
verified with experimental data from this paper. Lohani et al. (2006) presented the importance of
end restraints, in over estimating the strength of earthbags, thus some compression tests will have
H/W >2. The paper also demonstrates the poor shear strength of earthbags when subjected to an
inclined load. This will be further explored in this paper which attempts to quantify the shear
strength between earthbags from an in plane load. Current engineering literature on the earthbags
only considers their application in a vertical retaining wall situation. This dissertation will give a
material analysis of earthbag housing; furthermore will investigate the material mechanics of
earthbags in relation to dome / arch geometries.

4. Theory
11
4 Theory
4.1 Initial Conditions and Assumptions
The following assumptions are made for analysis of the behaviour of earthbags for the various
loading cases:
• The earthbags have a constant cross section and are completely filled with a cohesionless
granular material; the volume of the bags do not change throughout loading. The
earthbags have a rectangular cross section for the shear and arch tests; however, for the
compression test lateral semi-circular boundaries will also be considered.
• For the compression test, the platens are rigid and parallel. Furthermore the surface of the
platen is frictionless.
• The behaviour of the bag material is linear elastic and remains constant thickness
throughout loading.
• Plane strain condition.
• Earthbag will fail at the top and bottom face hence the bag material reaches tensile
capacity only at these points.
• For an uncompressed state there is no stress induced in the bag material or material fill,
the weight of the fill material is neglected.
• The stress ratio σv/σh is assumed to be constant throughout loading.
4.2 Compressive Strength of Earthbags
When subject to an external vertical load the bag material provides confinement to the fill which
induces a tension in the bag material. Failure occurs when there is a loss in confinement
provided, i.e. when the bag material is stressed to its stress limit.
In reality the earthbags will not maintain a uniform rectangular section, there is likely to be
localised deformations thus the contact area between the platen and bags and between the bags
will be non uniform. Furthermore there will be significant friction at the interface between the
platen and earthbag, which would mean a proportion of the applied load will be taken by the
platen hence leading to an artificially high compressive strength.
The interface between the bag material and the soil will not be frictionless and the boundary will
affect the deformation behaviour of the sand, particularly at high vertical stresses. Due to
friction, the sand at the interface will be dragged by the bag material as it moves. This will create
a shear band close to the boundary. The sand outside this region will largely be unaffected, as
shown by DeJong & Frost (2002) with compacted dyed and non-dyed sand particles sheared on a
steel-alloy sleeve. The amount of particle interlock at the boundary is dependent upon the bag
surface roughness, sand roughness, particle angularity and mean grain size of the sand.

4. Theory
12
The tension in the bag material will not be uniform across the bag given the interface is not
frictionless, contrary to the Matsuoka & Liu (2003) model. As mentioned in the literature review,
the earthbag is likely to fail at the top and bottom faces hence it can be assumed the bag reaches
tensile capacity only at these points. This is assuming that the geometry of the bag is such that
H0/B0 ≤ 1, if H0/B0 → Kp then the tension in the bag material will be more uniform, thus the bag
could fail at the sides.
4.2.1 Assuming earthbag cross section as rectangular
Considering particle interlock at the boundary interface, the horizontal boundaries can be
considered similarly to a geogrid in a soil reinforced wall with the sides of the earthbag as rigid
parallel vertical walls. This analogy will be used to analyse the compressive strength of an
earthbag.
Assuming the volume of the earthbag does not change during compression the width of earthbag
can be related to the amount of vertical displacement the earthbag experiences according to
equation (4.2). It can be seen from the equation that when x → H0, B → ∞.
� � � � � �. (4.1)
� � � � � (4.2)
� � � (4.3)
The change in perimeter (∆L) with respect to the initial perimeter (L0) can be expressed in
relation to the displacement of the platen as shown in equation (4.4) and by Tantono (2007).
�� � ��� � � ��� � ���� � � (4.4)
This can be used to express the tensile stress in the bag for a plane strain condition as shown in
equation (4.5), where E is the stiffness of the bag material.
���� � � ∆�� (4.5)
����������� � ������ (4.6)
Thus substituting equation (4.4) into (4.5) the quadratic can be solved to find the vertical
displacement of the platen (x) at which the bag material reaches its tensile capacity:
�������� � 12 ! � � � ���������� �� � �"� !#� � ��$ � � � ��$ %2 � ���������� & ���������� "'
(4.7)

4. Theory
13
Figure 6: Free body diagram a) vertically and b) horizontally through earthbag under uniform
vertical loading.
Taking a free body diagram vertically and horizontally through the earthbag and resolving forces
results in:
�( � 2� � (4.8)
�) � *) (4.9)
Where σh and σv are the vertical and horizontal stresses experienced by the soil and pv is the
external applied vertical stress. Thus the horizontal stress experience by the granular material is a
function of the tension in the bag material. The vertical compressive stress is an unknown which
must be defined to give the uniform vertical load an earthbag can withstand. The relationship
between the vertical and horizontal stress experienced by the soil can be represented by the stress
ratio K, which is a property of the material fill;
+ � �)�( (4.10)
The stress ratio K is not constant because the behaviour of the granular material is inelastic and
non linear, but for this model will be considered constant. The principal vertical and horizontal
stresses can be represented on a Mohr-Coulomb diagram (see Figure 7), from which the stress
ratio K can be found in relation to the friction angle of the fill (φ).
Figure 7: Mohr’s Circle showing failure envelope of the earthbag where σv > σh.
From Figure 7:

4. Theory
14
�) � �(�) � �( � sin /
�) � �( 1 � sin /1 � sin /
Where: +1 � 1 � sin /1 � sin /
(4.11)
Hence it can be seen from equation (4.11) that an increase in the internal friction angle of the soil
results in a lower horizontal stress for the same exerted vertical stress. Thus an increase in
friction angle increases the overall stiffness of the earthbag and load carrying capacity. The
relationship between horizontal stress and vertical stress is represented by equation (4.12) where
it can be seen an increase in the ratio of B/H would improve the compressive strength of the
earthbags as the horizontal stress would be lower for a particular load.
*) � +2 32� �4 (4.12)
5 6� 789�:;< *) � 2���������� +1 (4.13)
Using equation (4.7) the displacement of the platen at which the bag ruptures can be found hence
the value of H, from which the failure load =)������� can be deduced from equation (4.14). The
units for ��������� in equation (4.14) are N/mm-2
, however, in §6.2 and §6.3.4 ��������� is taken as
N/mm-1
to avoid relying on the thickness (t) of the sample which can lead to inaccuracies, and
thus t is taken out of the equation.
=)������� � *)�� � 2����������� � +2 (4.14)
4.2.2 Assuming earthbag cross section with semi-circular lateral edges
Another model which can be used is to consider the lateral edges as semi-circular as shown
below and proposed by Tantono (2007). In this model the stress ratio, K, is assumed to be equal
to 1 at the edges, to create semi-circular boundary, and 3 in the middle of the earthbag. The
initial perimeter and volume of the bag are defined in equations (4.15) and (4.16) respectfully.
Again assuming the volume stays constant, the width of the bag can be found in relation to the
position of the platen.
� � 2� � > (4.15)
� � � � > 3 2 4$ � � � � � > 3 2 4$ � (4.16)
5 � � 4� � 2� > � �$>4� � �� (4.17)
The perimeter of the bag after the bag has undergone deformation due to the loading platen is
found by replacing equations (4.17) and (4.4) into equation (4.15) for B0 and H0 respectfully.

4. Theory
15
From this the change in perimeter with respect to the initial perimeter can be expressed which is
used to find the tensile stress in the bag.
∆�� � ��>� � 4��2� � ���2� � > � (4.18)
Substituting equation (4.20) into (4.5) we can solve the quadratic for the value of x at failure: ��������� 12> @AA
B4 !� � ���������� �� � >�"� CD16�$ � %4 ���������� & !8�$ � 8� > � 2 $>$ � ���������� �4�$ � 4� > � 2 $>$�"GH
(4.19)
Figure 8: Free body diagram a) vertically and b) horizontally through earthbag with lateral semi-
circular edges.
Taking a free body diagram vertically and horizontally through the bag the equilibrium of
horizontal and vertical forces reads;
�( � � 2������ I �( � 2�
(4.20)
�)�� � 2�)J 2 � � *)�� � 2������
I �) � �)J � � *) � 2��
(4.21)
Given the stress function is defined as K=1 at the edges σv2 = σh, thus substituting equation (4.20)
into (4.21):
�) � *) (4.22)
The vertical applied stress can be expressed in terms of the dimensions of the bag as outlined by
Tantono (2007):
*) � +2�( (4.23)

4. Theory
16
5 *) � +2 2����������
5 *) � 31 � sin /1 � sin /4 ����>� � 4��� � ��$�2� � > �
4.2.3 Summary of theoretical compressive strength of earthbag
It can be concluded from the two models that for a vertically loaded earthbag the compressive
strength of an earthbag is dependent upon the tensile strength of the bag material and the friction
angle of the soil, for the assumptions outlined in §4.1. The overall stiffness of an earthbag is
more complicated, and is dependent upon several factors such as the stiffness of the bag material,
compressibility of the soil and how the earthbags are restrained top and bottom.
Stabilising the soil will provide an initial cohesion which is represented by a vertical shift in
failure line on the Mohr’s circle which indicates that a higher vertical pressure is needed to cause
failure of the earthbag. A similar affect can be seen with the introduction of clay to act as a
binder and provide some cohesion to the soil. The corresponding relationship between vertical
and horizontal pressure in the earthbag, assuming a rectangular section, is therefore:
�) � 2KLM+2 � �(+2 (4.24)
5 �) � 2KLM+2 � 2���������� +1 (4.25)
Figure 9: Mohr’s circle showing the affect of the application of cement on granular fill.
It is expected that the relationship between stress and strain for the earthbag will be non linear.
As the earthbag is compressed, lateral confinement of the soil is provided by the bag material; as
previously shown the confinement force (T) increases with an increase in horizontal force
applied by the soil, up to rupture. Thus, the stiffness of the earthbag is expected to increase as
vertical applied stress increases. Hence it is important to initially compact the earthbag in
construction as this improves the initial stiffness of the earthbag and reduces overall short term

4. Theory
17
deformation of the structure. Finally, a global shear band may develop when the stack height is
sufficiently high such that end restraint effects are minor, as reported by Lohani et al., (2006).
The angle of the shear band can be found from plotting the experimental data on a Mohr’s circle.
Although it is important to gain an understanding of the mechanics of earthbags under uniform
vertical load; the vertical loads which an earthbag has to resist, in an earthbag house, are unlikely
to reach the vertical load capacity of the earthbag.
4.3 Shear Strength of Earthbags
To predict a potential failure mode of an earthbag structure an understanding of how earthbags
behave under direct shear is needed. From laboratory tests an experimental value for the
coefficient of friction µ (= tanφ’) can be deduced. Furthermore the experiments will indicate
potential improvements which could be made in construction and/or in material choices, which
would improve the shear resistance of earthbag structures.
The shear between two earthbags can be described using a Coulomb friction model as defined in
equation (4.26).
N� � ONP (4.26)
From Coulomb friction analysis, it should be noted that the contact area between two bodies is
proportional to the normal force applied; furthermore the frictional force is proportional to the
applied normal force as defined by equation (4.26). For low applied normal forces the interaction
between the two bodies becomes difficult to predict.
From the direct shear test between earthbags a value for µ is obtained for a particular material
interface. It is predicted that the hessian bags will provide the greatest frictional interface. The
barbwire will improve the shear resistance and provide an initial cohesion between the bags. The
predominant mode of interaction between the barbwire and sand is likely to be bearing; with the
points of the barbwire acting as dowels between the bags. Theoretically the mechanics of
barbwire can be considered to be acting in a similar manner to a short pile undergoing lateral
loading, as outlined by Broms (1964). If the earthbag is subject to direct shear the barbwire acts
to resist the bag material moving and hence shear displacement of the earthbag as a whole.
Failure of the earthbag in shear will occur when the bag material begins to tear as it tries to move
past the barbwire point.
Figure 10 shows the theoretical modes of failures of the barbwire points under direct shear;
beneficial shear force resistance in the barbwire point is considered negligible. The barbwire
point is more likely to fail as a rigid body given the rotational resistance of the connection
between the points is less than the bending strength of the barbwire material.

4. Theory
18
Figure 10: Theoretical failure mode of barbwire under direct shear a) overall view b) failure by
bending c) rigid body shear failure.
Equilibrium of the soil about the rigid body is illustrated in Figure 11 showing lateral resistance
is provided by passive earth pressure; note here the stress ratio is defined as K = σh/σv.
Figure 11: Force equilibrium about barbwire point showing lateral resistance of soil against
applied lateral force from the soil and bag material.
From Figure 11 it can be seen that the lateral resistance of a barbwire point in a cohesionless soil
and the applied lateral force on the barbwire can simply be expressed by equations (4.27) and
(4.28) respectfully. The coefficient of friction between the soil and the barbwire is conservatively
taken as 1. The barbwire point has some inherent initial resistance against lateral movement,
which has been denoted by Pax. =� � +2�)Q�� � =�R (4.27) =� � +��)��Q � =S (4.28)
4.4 Theoretical Earthbag Arch Mechanism
Traditional plastic analysis of masonry arch structures is considered to describe the theoretical
behaviour of earthbag arches. As outlined by Heyman (1995), with plastic analysis the concern is
with the ultimate limit state of the structure hence it is not concerned with the actual state of the
structure, for which there is an infinite potential number of equilibrium conditions for the
structure. Therefore this approach reduces the number of material properties that need to be
defined given the structure is only considered in relation to ultimate state.

4. Theory
19
However, there are several differences which reduce the accuracy of the initial assumptions
made for the plastic analysis of arch structures. Firstly it is assumed that sliding failure does not
occur; however, the accuracy of this for an earthbag structure is dependent upon the friction
coefficient between the bags and the compressive stresses normal to the interface. With the
addition of barbwire between the earthbags it is expected the arch will be able to sustain much
greater deformations before collapse. Furthermore the contact area between the bags is likely to
vary less throughout loading, in comparison to arch tests without barbwire, as the barbwire acts
to grip the bags together. Analysis has been undertaken, (e.g. Livesley, 1978; Gilbert et al.,
2006) to considered potential rotations, separation and sliding of masonry blocks in
computational analysis to provide a more accurate model of the behaviour of masonry arches,
but is outside the scope of this dissertation.
It is also assumed that the material has infinite compressive strength. Given the applied loads
relative to the compressive strength of the earthbags is safe to assume that the structure will not
fail due to crushing of the bags. However, local deformation is likely to occur, which would alter
the component section profile and thus the behaviour of the structure in relation to the applied
load. The level of local deformation is dependent upon the material fill (including any
stabilisation), bag material stiffness and initial compacted state of the earthbag. Thus for a
stabilised earthbag filled with dense coarse sand, the behaviour under a point load will be similar
to that of a masonry arch. Finally it can be assumed that the earthbag is incapable of carrying
tension, which is safe to consider.
Considering the case where the thrust transmitted between earthbags reaches the extrados of the
arch, the assumption of no tension capacity becomes significant. As the thrust line reaches the
surface, rotation of the earthbag occurs creating a hinge at this point. The hinge signifies the
point at which the load has reached the edge of the arch, any further movement of the thrust line
would mean the thrust line is outside the section area of the arch and thus failure of the arch
occurs. In addition no further moment can be sustained at this hinge location, if additional load is
applied however, hinges can occur elsewhere in the arch given there is still redundancy. Thus the
formation of a hinge has generated a redistribution of bending moments in the structure, allowing
the structure to carry a greater load after the initial hinge. Failure of the arch only occurs when
sufficient hinges have formed to transform the stable arch structure into a mechanism which is
statically determinate. For a point load at quarter span on an arch, the failure load will be the load
at which four hinges are formed along the line of thrust as shown in Figure 31. Using computer
software an iterative approach can be used to find the thrust line, hence hinge locations which
will yield the minimum collapse load of the structure.

5. Laboratory Testing
20
5 Laboratory Testing
5.1 Soil Analysis
5.1.1 Sieve Test
A dry sieve analysis was performed in accordance to BS 1377-2:1990 Clause 9.3, with altered
sieve sizes as shown in Appendix A. A fine builders’ sand was used to best replicate the sand
found in the Namib Desert.
5.1.2 Shear Box Tests
Shear box tests were carried out in accordance to BS 1377-7:1990 to find the internal friction
angle of the sand and shear strength of the sand. Sand samples were compacted by different
amounts and categorised as either very dense, medium dense or loose. The same sand was used
for all the experiments undertaken in this dissertation however the moisture content varied
between tests. The dimensions of the shear box were 100mm x 100mm x 50mm, however
sample depths were taken lower than 50mm to allow full fit of the loading cap. Shear
displacement was set at 1mm/min and normal loads of 0.314kN 0.804kN and 1.295kN were
applied.
5.2 Tensile Tests on Bag Material
Tensile tests were carried out on 70gsm polypropylene (good and poor condition), 100gsm
polypropylene and hessian bags using a constant rate of extension machine (DARTEC 20T
machine). 70gsm polypropylene bags were taken from the prototype build by FCBS, which had
been exposed externally for 172days being subject to UV, rain and snow during this period.
Samples were cut at least 150mm from the edge of the bag to 30mm x 200mm width and length,
respectively. Due to the limitations of laboratory equipment at the University of Bath, a wide
strip method is not viable. Balsa wood pieces were put between the grips to ensure the specimens
did not fail at the ends from the friction between the grips. The interface between the balsa and
the bag material was marked so any slipping of the material could be identified. No pretension
was applied to the specimens. Extension rate was initially set at 5mm/min.
5.3 Compression Tests
The aim of the compression tests was to gain an understanding of the behaviour of earthbags
under vertical load and quantify the compressive strength of earthbags with variation in bag
material and material content. To achieve this several compression test using a DARTEC 200T
machine were performed as outlined below;
• Single 20kg hessian, 70gsm and 100gsm polypropylene bags
• 3 bag stack – 10/15/20kg, 100gsm polypropylene bag
• 8 bag stack – 20kg 100gsm polypropylene bag
• 8 bag stack – 20kg 70gsm polypropylene bag

5. Laboratory Testing
21
Figure 12: Arrangement for eight
earthbag stack compression tests
• 8 bag stack – 20kg stabilised 100gsm polypropylene bag
Dry sand was used to fill the bags. The earthbags were then ‘diddled’, a process whereby the
corners of the bag are pushed inward to ensure they do not expand out during the compression
test. Compaction of the bags using a 12.6kg tamper occurred on the loading platform to ensure
the specimen was fully compacted before loading. Dimensions of the bag were recorded and the
bag was levelled to ensure the stack did not undergo rotation. 30mm thick steel plates were
positioned top and bottom of the earthbag stack to ensure a uniform compression was applied to
the bags. Compressive tests with 3 and 5 bags had two strands of 3 point barbwire between the
bags to replicate the actual construction case. However, for the 8 bag stack barbwire was not
used due to concerns of barbwire resisting lateral spreading of bag material. Load was applied
such to maintain a constant displacement of 10mm/min. For the 1, 3 and 5 bag stacks, the
specimens were taken past failure point to gain an understanding of the behaviour of earthbags
beyond initial tearing of the bag material. Testing was stopped for the 8 bag stack soon after the
sample had a loss in load carrying capacity.
For the 8 bag stack tests transducers were used to
measure the deformation of the bags. Transducers
were positioned at the long side of the bag to measure
the level of lateral expansion and at the short side of
the earthbag to verify the assumption of plane strain;
Figure 12 and Figure 20 show the location of the
transducers. Transducers were not positioned on both
sides of an earthbag as it is thought the expansion of
the earthbag would be fairly symmetrical either side.
The deformation of the bags may vary throughout the
stack with the earthbags furthest from the support
being less subjected to end restraint effects hence can
expand more freely. To verify this assumption,
transducers recorded movement of an earthbag in the
middle of the stack and one near the restraint. Profiles
of the earthbag edges were replicated using a profile gauge which was used to mark out the
profile onto wood pieces. The wood pieces were then attached at transducer locations using car
body filler.
It must be noted that the steel plates became significantly bent through compression of the
earthbags during the 1, 3 and 5 earthbag(s) stack tests hence the contact area between the platen
and earthbags was not uniform. To avoid this problem occurring again for the 8 bag stack test,
the lower jaws of the machine was removed and the earthbags were loaded onto the steel base of
the machine.

For the stabilised case 4% general purpose cement
of 6.5% and left to cure for 36days.
used for the arch test (7 days), due to availability of machinery, so th
strength of the earthbags will be higher.
5.4 Shear Tests
Earthbags were sheared in a large
specimen size of 300 x 253 x 110mm
confinement to the bags, hence the contact area between bags stayed constant throughout tes
Although the coefficient of friction
shear stress resistance between the bags to use for analysis a contact area size must be known
Furthermore the frame ensured the applied shear force wa
The internal dimensions of the shear box are 300 x 300 x 100mm (200mm for both boxes).
similar testing procedure as outlined by BS 133
tests performed is given below;
• 100gsm Polypropylene -
• 100gsm Polypropylene -
• Hessian – Normal loads 2.2 / 7.1 / 12.0kN without barbwire
Figure 13: Earthbag shear test apparatus
Steel rods were placed underneath the
filled with 13kg of sand and compacted with
smaller than width of the shear box, hence to provide lateral confinement two wood block were
placed either side of the bag.
At the sides of the steel frames the Teflon strips were replaced w
steel frame boxes and ensure the only contact areas between the boxes was between the bags
Figure 13). To check the friction of apparatus, a test with just the apparatus and no normal load
was done. Negligible horizontal load
5. Laboratory Testing
general purpose cement was added to the sand with a moisture content
days. Unfortunately the bags were left longer to cure than those
used for the arch test (7 days), due to availability of machinery, so the measured compressive
strength of the earthbags will be higher.
in a large scale direct shear box apparatus (see Figure
specimen size of 300 x 253 x 110mm. A large scale shear box was used as it provided lateral
confinement to the bags, hence the contact area between bags stayed constant throughout tes
Although the coefficient of friction is independent of the contact area, to obtain a magnitude of
shear stress resistance between the bags to use for analysis a contact area size must be known
Furthermore the frame ensured the applied shear force was uniformly applied to the earthbag.
The internal dimensions of the shear box are 300 x 300 x 100mm (200mm for both boxes).
similar testing procedure as outlined by BS 133-7:1990 was performed. A list of the direct shear
Normal loads 2.2 / 7.1 / 12.0 / 16.9kN without barbwire.
Normal loads 2.2 / 7.1 / 12.0kN with barbwire
Normal loads 2.2 / 7.1 / 12.0kN without barbwire
Earthbag shear test apparatus
placed underneath the shear box as bearings. Polypropylene 100gsm bags
filled with 13kg of sand and compacted within the shear box. The width of the
smaller than width of the shear box, hence to provide lateral confinement two wood block were
At the sides of the steel frames the Teflon strips were replaced with small steel rods to raise the
the only contact areas between the boxes was between the bags
To check the friction of apparatus, a test with just the apparatus and no normal load
load was required to move the bottom steel fram
5. Laboratory Testing
22
was added to the sand with a moisture content
Unfortunately the bags were left longer to cure than those
e measured compressive
Figure 13) with a
shear box was used as it provided lateral
confinement to the bags, hence the contact area between bags stayed constant throughout testing.
to obtain a magnitude of
shear stress resistance between the bags to use for analysis a contact area size must be known.
s uniformly applied to the earthbag.
The internal dimensions of the shear box are 300 x 300 x 100mm (200mm for both boxes). A
A list of the direct shear
Normal loads 2.2 / 7.1 / 12.0 / 16.9kN without barbwire.
100gsm bags were
n the shear box. The width of the earthbags were
smaller than width of the shear box, hence to provide lateral confinement two wood block were
ith small steel rods to raise the
the only contact areas between the boxes was between the bags (see
To check the friction of apparatus, a test with just the apparatus and no normal load
to move the bottom steel frame.

5. Laboratory Testing
23
For the tests with barbwire, two strands of 3 point barbwire were placed between the bags. The
horizontal load was applied and the vertical load was maintained using a hand operated hydraulic
jack system. For the earthbag without barbwire and hessian tests the bags were not replace
between load experiments. For the tests with barbwire, the bags were checked after each test for
damage, if substantial damage had been sustained by the bags then they were replaced.
Transducers were used to measure horizontal displacement of the bottom steel frame and vertical
displacement of the top steel plate. Applied load and displacements were logged using a
computer.
5.5 Arch Test
The arch test provides an insight into how the earthbags work as a structure and potential modes
of failure it may have. Furthermore the experiment will give a better understanding on the affect
of material factors on the failure mode of the arch. Of particular concern with earthbag structures
is the level of deformation under loading, thus, a stabilised arch is considered to quantify the
improvement in stiffness with the addition of cement. A full size dome could not be built due to
the limitations in laboratory space, time and resources. Furthermore obtaining accurate data from
the dome would be complicated. A scale model of a dome was considered using lead shots to
represent sand grains given they would have a similar friction angle, however, scaling the
barbwire and bag material proved problematic. The following experiments were undertaken (all
with 100gsm polypropylene bags);
• Point load at quarter span – unstabilised bags, no barbwire between bags (x2)
• Point load at midspan - unstabilised bags, no barbwire
• Point load at quarter span – stabilised bags, no barbwire
• Point load at quarter span – unstabilised bags, with barbwire
Earthbags were placed to form an arch between two concrete roller abutments and loaded by a
point load either at quarter span or mid span. The connection between the arch and abutment is
considered to be fixed. The abutments were tied together by rebar with a load cell between either
set of rebar to measure horizontal reaction force at the abutments. The rise and span of the arch
was 1:4.10, respectfully. Formwork was placed on jacks such to allow it to be lowered and
removed once the earthbags had formed an arch. The earthbags were compacted on the ground
then lifted into place and further compacted using a wood piece and mallet. This process was
found to provide a more uniform compaction than tamping the bags on the formwork, which
became increasingly difficult towards the keystone. Producing bags of uniform thickness was
difficult thus leading to an inconsistent number of bags used per arch test. The bag thickness can
be moderated if the length of the bag during compaction is strictly controlled.
Formation of the keystone required two earthbags with reduced fill and compaction so that they
formed a wedge shape. Once in place the keystone was compacted from above to ensure full
bearing onto neighbouring bags. For the barbwire arch, inserting the keystone in the same way
would result in tearing of the bags. To avoid this, two metal sheets were positioned on the faces

5. Laboratory Testing
24
of the neighbouring bags to the keystone (protecting the keystone from the barbwire). The
keystone was then inserted and the sheets were removed, finally the keystone was compacted
from above as before.
LVDT transducers were positioned at quarter spans and mid span. In addition a camera was set
up on a tripod and the face of the bags was marked to record movement of the arch. The camera
we set up in the same location for all arch tests. A point load was applied using a hydraulic jack
onto a roller and steel plate with a wood piece underneath to spread the load across one bag to
prevent significant localised deformation (see Figure 14). To ensure a uniform contact area
between the wood piece and earthbag dental paste was applied between the wood and earthbags.
Deflections of the arch at quarter spans and mid span were measured during formwork removal.
Furthermore the horizontal distance from the centre of the arch to the wall was measured before
and after formwork removal, such that any out of plane rotation of the arch could be detected.
Figure 14: Arch test apparatus
5.5.1 Stabilised Arch Tests
A similar procedure was used for the stabilised arch tests as the unstabilised, except, 4% (8kg)
general cement was added to the sand. The sand was sufficiently damp, with a moisture content
of 6% so no water was added. The earthbags were compacted and placed on the formwork and
allowed to cure for 7 days before being tested.

6. Results & Analysis
25
6 Results & Analysis
6.1 Soil Analysis
6.1.1 Sieve Tests
The results of the sieve tests are shown in Figure 33 and Figure 34, Appendix A. Comparing the
results with the dry sieve analysis from Namibia, it can be seen that the two samples are similar
as the majority of sand particles are fine – medium. The sand from Bath is finer with the 66% of
the sand being retained by the 125µm sieve, whereas the sand Namibia had 63% retained by the
250µm sieve.
6.1.2 Shear Box Tests
Figure 15: Shear box test; shear stress at failure against effective stress normal to the failure
plane.
The corresponding densities for the tests were 16kN/m3, 15.5kN/m
3 and 13.88kN/m
3 for the
dense, medium dense and loose samples, respectively. From Figure 15 the internal friction angle
of the sand sample can be found as outlined below;
The initial density of the sand does affect the internal friction angle of the sand, given a greater
shear force is required to overcome particle interlock in addition to the force required to
overcome interparticle friction. Hence, for use in calculating value of Kp for the earthbag
y = 0.4975x + 11.917
y = 0.4832x + 5.9987
y = 0.4862x + 1.6193
0
10
20
30
40
50
60
70
80
90
0 20 40 60 80 100 120 140
τ f (k
N/m
2)
σ'N (kN/m2)
Very Dense
Medium Dense
loose
For a granular material: T� � �UP tan / U (6.1) <;X Q<YZ< Z8[*�<: 0.498 � tan /L 5 /L � 26.5° b<c9:[ Q<YZ< Z8[*�<: 0.482 � tan /L 5 /L � 25.7° �eeZ< Z8[*�<: 0.486 � tan /L 5 /L � 25.9° (6.2)

6. Results & Analysis
26
compression test, the initial earthbag density was recorded. The density of the sand used in the
earthbag compression tests is given in Appendix B (see accompanying C.D).
6.2 Tensile Test on Bag Material
Table 1 shows the maximum tensile strength of each sample performed in the tensile tests.
Figure 16 is the stress strain relationship for each sample;
Table 1: Tensile strengths of all bag material samples obtained from tensile tests.
Figure 16: Stress strain relationship from tensile tests of all bag material samples.
-2
3
8
13
18
23
0 5 10 15 20 25 30 35
Str
ess
(N/m
m)
Vertical Strain (%)
Hessian
Polypropylene
70gsm
Polypropylene
70gsm damaged
Polypropylene
100gsm (1)
Polypropylene
100gsm (2)
Polypropylene
100gsm (3)
Polypropylene
100gsm (4)
Material Exposed
length (mm)
Initial width
(mm)
Strain at
tensile limit
(%)
Tensile stress
(N/mm per
mm thickness
of material)
Young’s Modulus E
(N/mm per mm
thickness of material)
Polypropylene
100gsm (1) -
100 30 16.2 20.9 129.5
Polypropylene
100gsm (2)
137 30 14.5 18.6 128.6
Polypropylene
100gsm (3)
135 30 13.9 15.3 109.8
Polypropylene
100gsm (4)
185 30 14.5 18.2 125.6
Average (sample (3) disregarded) 15.1 19.2 127.9
Polypropylene
70gsm (good
condition)
100 30 17.1 9.7 56.6
Polypropylene
70gsm (poor
condition)
137 30 14.2 8.3 58.6
Hessian 100 30 2.7 8.9 324.9
All polypropylene 100gsm had a thickness of 0.17mm 12/3/10

6. Results & Analysis
27
Note, measured stress and stiffness of the samples are per unit thickness of the bag material to
avoid errors due to inaccuracies in measurements of bag thickness. From the experiment it is
clear that the 100gsm polypropylene bags have the highest tensile strength and have around
double the stiffness of the 70gsm polypropylene used by FCBS, under uniaxial tension. The
damaged 70gsm polypropylene sample did not experience a large reduction in tensile strength
but was subject to brittle failure. Hence indicating that if an earthbag structure, made with
polypropylene bags, is left unprotected (i.e. no render is applied) then the earthbags are subject to
abrupt rupture if the tensile stresses in the polypropylene reaches the tensile capacity of the
polypropylene. However, a high vertical force is still required to cause rupture of the bag
material which is unlikely to be reached during the earthbags lifespan; i.e. assuming bag
dimensions at failure of 235x452.5x105mm (B x l x H), Kp = 2.6 and ��������� = 8.3N/mm and
using equation (4.14) =)������� = 43.7kN.
The sample width was assumed to be constant until the point at which maximum tensile stress
was reached in the material. However, this was not always true as some samples experienced
slight necking before capacity was reached. Furthermore, obtaining useable samples from the
hessian bags proved difficult as cutting the hessian left frayed edges, which would have affected
the load carrying capacity of the strip. Thus the accuracy of the experiment would have increased
if a wide strip was used.
6.3 Compression Tests
Compressions tests on earthbags were performed as outlined in §5.3 to gain an understanding
how the earthbags behave under vertical loading, some of the results are outlined below.
Compression tests were performed on single bags, however, the tensile capacity of the
polypropylene bag was never reached owing to end restraint effects. Thus the data is not a true
representation of the earthbag capacity and will not be considered further.
6.3.1 Three earthbag stack
The force displacement relationship will be considered first given no theoretical assumptions are
needed to create this graph, thus can be considered reliable. Figure 17 shows the earthbag’s
behaviour under uniform vertical loading was non linear. It is believed at the point prior to strain
softening the polypropylene had reached tensile capacity; hence it is this region which is of
primary concern for the design of earthbag structures and is taken as the failure point of an
earthbag under vertical loading. Tearing at the sides of bag was not seen during this period;
however, cracking was heard indicating tearing. Tearing on the top faces was noticed at the end
of the test when the steel plates were removed.

6. Results & Analysis
28
Figure 17: Compression test results of three 100gsm polypropylene earthbags with varying
amount of fill.
Frictional forces generated at the plate interface and the barbwire between earthbags would, to
some extent, resist extension of the bag material thus increase the load required to cause tearing.
Conversely, the barbwire created holes in the bag material, therefore as the bag attempts to
expand laterally under uniform vertical load there would be a higher stress concentration around
the holes. This would have somewhat increased the rate at which tearing of the bag material
occurs. A similar effect is seen between the plate and earthbag due to the rough surface of the
steel plate resisting movement of the bag material.
After the tensile capacity of the bag material had been reached, the stiffness of the earthbag
reduced for 15kg and 20kg earthbags. Although the bag material had reached its tensile capacity,
the earthbag is still able to sustain an overall positive load displacement relationship. It is
believed that frictional forces generated between the polypropylene and sand resist translations
of the sand particles at the top and bottom faces, as discussed in §4.2. As the pressure increases,
the sand confinement in the region underneath the applied load increases i.e. the void ratio
reduces. Thus there is a highly dense region of sand through the centre of the bag, with more
dilated edges, such that a high proportion of the load is transferred through the central portion of
the earthbag. Consequently subsequent tearing of bag material does not yield complete collapse
of the earthbag as the sand is less reliant on the confinement provided by the polypropylene.
Eventually an increase in shear stresses acting on the top and bottom faces of the earthbag causes
rupture of the sand block, which is represented by a sharp fall in the force displacement graph.
The bag material prevents sand from escaping the bag, thus the earthbag can still carry load.
0
200
400
600
800
1000
1200
1400
1600
1800
2000
0 20 40 60 80 100 120 140 160
Axia
l L
oad
(kN
)
Displacement (mm)
10kg
15kg
20kg

6. Results & Analysis
29
Subsequently for the 15kg earthbag there was a rapid increase in load carrying capacity. It is
thought that as the sand becomes more confined the stiffness of the sand region under vertical
loading increases, hence the level of particle interlock rises. Thus, for failure to occur high shear
stresses are required not only to overcome frictional resistance but also particle interlock.
Vertical dilatancy is prevented by the high vertical applied stresses thus yielding an exponential
load displacement relationship. Furthermore the ratio of height to width of the bags is greatly
reduced at this point, thus the end restraint effects become hugely significant as with the single
bag compression tests.
It is not imperative that a defined conclusion on the behaviour of earthbags under such loading is
made given these loads will never be experience by earthbag structure. Of primary concern for
the design of earthbag structures is their behaviour under working loads, well below the load at
which the tensile strength of the bag is reached. Figure 18 shows an enlarged section from the
load against normalised vertical displacement graph. Initially all three graphs have a low
resistance against vertical displacement, given some particles are still in a loose state and can
collapse into the surrounding voids. After which the sand moves laterally, initiating the bag
material into tension, such that the subsequent load displacement relationship is largely
dependent on the stiffness of the bag material. The 20kg bags had the lowest load capacity as
overall the stack height was greater thus the end restrain effects were less.
Figure 18: Three earthbag 100gsm polypropylene stack compression test showing enlarged
section of load displacement graph.
0
50
100
150
200
250
0.00 0.05 0.10 0.15 0.20
Axia
l L
oad
(kN
)
x/H0
10kg
15kg
20kg
190.7kN , 28mm
206.7kN, 46mm

6. Results & Analysis
30
6.3.2 Five earthbag stack
The 5 bag stack was less susceptible to end restraint effects than the 3 bag stack, therefore failed
at a lower vertical stress. Cracking of bag material fibres was heard around 135kN. The stack did
display some buckling during testing however the bag underwent local deformations which
meant the stack remained stable. The ratio of H0/B0, where H0 is the total initial height of the
stack, for the five bag stack was measured to be 2.2. In comparison to the eight bag stack, this is
not sufficient to remove significant end restraint effects. Thus, a value of H0/B0 ≥ 3.0 should be
taken. This may vary between different bag materials given the 70gsm polypropylene earthbag
test had a H0/B0 = 2.5 and did not demonstrate any inaccuracies due to end restraints. In Figure
19 the calculation of stress and ∆L/L0 uses theoretical widths as calculated from equation (4.2).
Figure 19: Stress strain relationship of earthbags in compression, with variation in stack height
6.3.3 Eight earthbag stack
An altered experimental procedure was used for these tests, given the used of transducer as
discuss in §5.3. Figure 20 indicates the location of the transducer along the 8 bag stack.
0
0.2
0.4
0.6
0.8
1
1.2
1.4
1.6
1.8
0 0.02 0.04 0.06 0.08 0.1
Str
ess
N/m
m2
∆L/L0
20kg - 3bags
20kg - 5bags
20kg - 8bags
20kg - 8 bags
stabilised
H0/B0 = 1.3
H0/B0 2.2
H0/B0 = 3.5
H0/B0 = 3.2

6. Results & Analysis
31
Figure 20: Location of transducers, failure points in bag material and recover of earthbag stack
after unloading
Figure 21: Load displacement graph for eight stabilised 100gsm polypropylene, unstabilised
100gsm polypropylene and unstabilised 70gsm polypropylene earthbags.
6.3.3.1 Unstabilised 100gsm polypropylene earthbag
As before, the behaviour of the earthbags underwent an initial rapid rise in stiffness. In relation
to previous experiments, the behaviour then onwards till failure is much more linear. Given there
is less restriction against movement of the bag, the bag material is fully initiated in tension
therefore this linear behaviour corresponds to the extension of the bag material. Cracking was
heard around 120kN (1.10N/mm2) relating to tearing of the bag material. Unlike the five
earthbag stack, buckling of the stack was not experienced. Accurate measurements of bag
dimensions using the transducers become difficult towards the end of the test. At 100mm vertical
0
20
40
60
80
100
120
140
160
0 25 50 75 100 125 150 175 200
Axia
l L
oad
(kN
)
Vertical displacement of platen (mm)
Stabilised
Unstabilised
100gsm PP
Unstabilised
70gsm PP
Drop in load
due to
machine
stopping
travel at
100mm

displacement, the transducer measuring expansion on
wood piece. There was also noticeable rotation of the wood pieces after the peak load was
reached. In addition wood pieces attached to the bags on the long side came into contact with one
another, the data therefore became unreliable and testing was stopped. Significant tear
noticed after testing mainly along the midd
occurs in this region. Recovery after loading was removed was calculated to be 27mm, which
considering the vertical stress experienced and given bag
reasonable high.
6.3.3.2 Unstabilised 70gsm polypropylene earthbag
Failure of the 70gsm polypropylene earthbag occurred at a much lower vertical loads than other
samples, which was to be expected given the bag material
relatively low loads (<20kN) tearing around the seams alo
noticed. As with the 100gsm polypropylene eight earthbag stack the earthbags experience an
initial compaction before the bag ma
occurs. Again recording movement of the earthb
wood piece attached to the second from bottom earthbag on the long side at 144mm total vertical
displacement. Furthermore the transducer on bag number
Despite this, data up to failure load of the earthbag
against theoretical models in §6.3.4
band. After removal of loading as clear level change was noticed in the cross section of the
earthbags (see Figure 22 ). Furthermore tearing of the earthbags occurred
faces of the earthbag along a diagonal through the stack, see
Figure 22: Tearing of 70gsm polypropylene earthbags after compression test
6.3.3.3 Stabilised earthbag
As expected the stabilised earthbag stack experienced a higher load capacity than the
unstabilised earthbags. Using equation
Firstly the vertical stress is calculated using theoretical bag dimension, given the data obtained
from the transducers is inaccurate.
�) �
6. Results & Analysis
ransducer measuring expansion on the short side of the bag was at the edge of
as also noticeable rotation of the wood pieces after the peak load was
In addition wood pieces attached to the bags on the long side came into contact with one
another, the data therefore became unreliable and testing was stopped. Significant tear
noticed after testing mainly along the middle of the bag, confirming a higher stress concentration
. Recovery after loading was removed was calculated to be 27mm, which
considering the vertical stress experienced and given bag material had been significantly torn is
Unstabilised 70gsm polypropylene earthbag
Failure of the 70gsm polypropylene earthbag occurred at a much lower vertical loads than other
samples, which was to be expected given the bag material has a lower tensile capacity.
relatively low loads (<20kN) tearing around the seams along the short side of the bag w
noticed. As with the 100gsm polypropylene eight earthbag stack the earthbags experience an
initial compaction before the bag material is initiated and a linear force displacement relationship
occurs. Again recording movement of the earthbags proved problematic, with movement of the
wood piece attached to the second from bottom earthbag on the long side at 144mm total vertical
lacement. Furthermore the transducer on bag number 4 ran out of travel around 153mm.
data up to failure load of the earthbags is reliable and will be used for comparison
6.3.4. The testing did give an indication of a potential global shear
band. After removal of loading as clear level change was noticed in the cross section of the
). Furthermore tearing of the earthbags occurred on the top and bottom
iagonal through the stack, see Figure 20 and Figure
Tearing of 70gsm polypropylene earthbags after compression test
As expected the stabilised earthbag stack experienced a higher load capacity than the
s. Using equation (4.25) we can quantify the cohesion the cement provides.
Firstly the vertical stress is calculated using theoretical bag dimension, given the data obtained
from the transducers is inaccurate.
� 157000265 f 450 � 1.31h/[[$
6. Results & Analysis
32
the short side of the bag was at the edge of
as also noticeable rotation of the wood pieces after the peak load was
In addition wood pieces attached to the bags on the long side came into contact with one
another, the data therefore became unreliable and testing was stopped. Significant tearing was
, confirming a higher stress concentration
. Recovery after loading was removed was calculated to be 27mm, which
material had been significantly torn is
Failure of the 70gsm polypropylene earthbag occurred at a much lower vertical loads than other
has a lower tensile capacity. Even at
ng the short side of the bag was
noticed. As with the 100gsm polypropylene eight earthbag stack the earthbags experience an
terial is initiated and a linear force displacement relationship
movement of the
wood piece attached to the second from bottom earthbag on the long side at 144mm total vertical
ran out of travel around 153mm.
is reliable and will be used for comparison
. The testing did give an indication of a potential global shear
band. After removal of loading as clear level change was noticed in the cross section of the
on the top and bottom
Figure 22.
As expected the stabilised earthbag stack experienced a higher load capacity than the
we can quantify the cohesion the cement provides.
Firstly the vertical stress is calculated using theoretical bag dimension, given the data obtained
(6.3)

6. Results & Analysis
33
K ′ � 1.31 � 32�19.2�77 f 2.61142√2.611 � 0.01h/[[$
(6.4)
The measurements of lateral expansion of the earthbag were inaccurate because the stack
underwent rotation, which meant initial measurements were recording the earthbags moving
away from the transducers. The gimbal also was tilted during the test which may have caused
and/or exaggerated the initial sway of the stack. Cracking was heard early in experiment, around
5kN loading. This is due to the cement bonds breaking from the sand, allowing the bag to
deform. Initially the bags were not fully in contact with each other, given that they were rigid
blocks of different dimensions. Hence, initially the stiffness of the stack is low as there are some
gaps between the bags; the stiffness rises as the bags fully bear onto one another.
6.3.4 Comparison between experimental results with theoretical predictions
A summary of the results from the compression tests is given in Table 2. The displacement of the
platen is divided by the number of bags to give the height of a single bag. Refer to Appendix B
for initial bag dimensions and densities.
Table 2: Summary of earthbag compression test results Ref: Material / Nº of bags Bag
weight
(kg)
Kp Bag failure
load (kN)
x (mm) Initial
height of
single bag
(mm)
Height of
single bag
at failure
(mm)
C1 100gsm PP / 3 20 2.53 190.7 28 105 96
C2 100gsm PP /3 15 2.61 206.7 24 86 78
C3 100gsm PP /5 20 2.53 139.0 46 100 90
C4 100gsm PP stabilised
/8
20 2.61 157.0 79 87 77
C5 100gsm PP /8 20 2.53 128.8 115 110 96
C6 70gsm PP / 8 20 2.61 92.8 124 95 79
The compression test involving a hessian bag experienced complete collapse at 1755kN,
however all tests involving single earthbags are unreliable due to end restraint effects. Evaluation
of theoretical behaviour against actual behaviour will use data from the 8 bag stack compression
test. Theoretical analysis will be made following the assumptions outlined in §4.1. The positions
of the transducers for the tests are shown in Figure 20. Not all bags were measured therefore the
assumption is made that all bags undergo a similar deformation. This is not true, and in some
cases there was a large divergence between bag dimensions, however, for the purpose of the
analysis this assumption must be made.
For theoretical analysis, it is assumed the earthbag remains in a plane strain condition throughout
loading. From the measurements taken during testing as shown in Table 3 (short side
displacement) it is clear this is not true. However, the magnitude of deformation is dependent
upon which side of the bag the transducer positioned, i.e. if positioned on the folded end it will
experience greater movement as the bag end can unravel. Secondly the wood pieces underwent
some rotation throughout the experiment. For the stabilised test, a wood piece was not used for
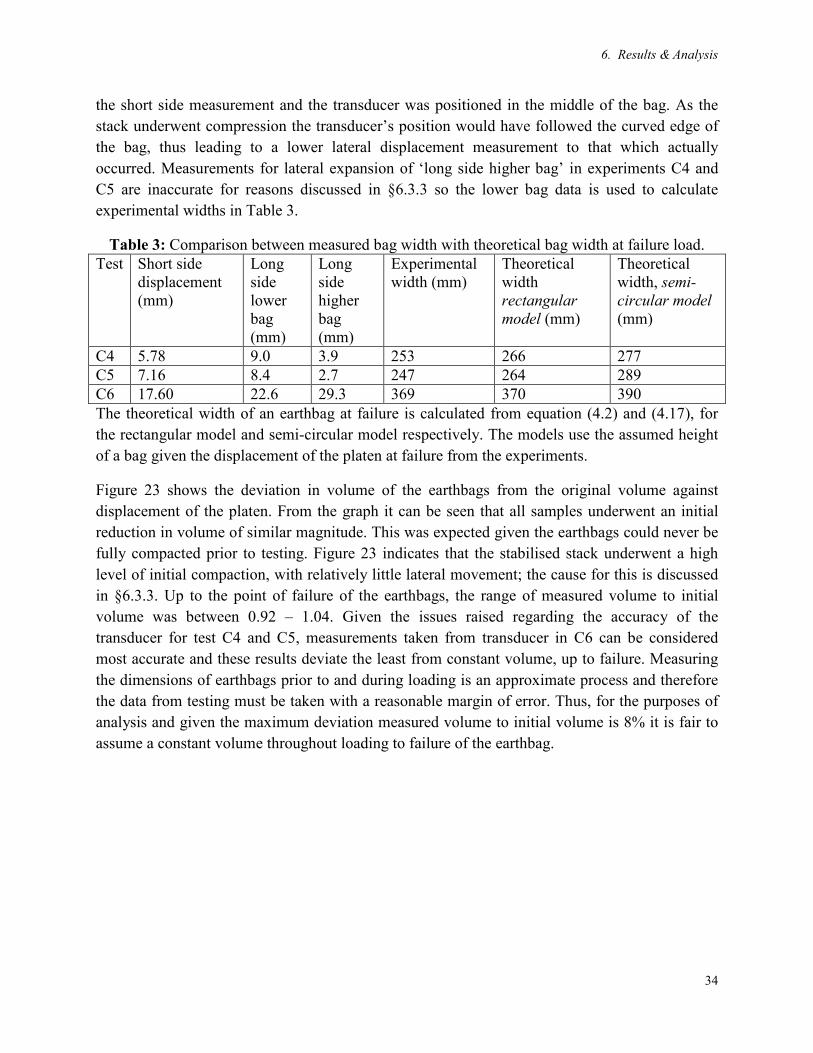
6. Results & Analysis
34
the short side measurement and the transducer was positioned in the middle of the bag. As the
stack underwent compression the transducer’s position would have followed the curved edge of
the bag, thus leading to a lower lateral displacement measurement to that which actually
occurred. Measurements for lateral expansion of ‘long side higher bag’ in experiments C4 and
C5 are inaccurate for reasons discussed in §6.3.3 so the lower bag data is used to calculate
experimental widths in Table 3.
Table 3: Comparison between measured bag width with theoretical bag width at failure load.
Test Short side
displacement
(mm)
Long
side
lower
bag
(mm)
Long
side
higher
bag
(mm)
Experimental
width (mm)
Theoretical
width
rectangular
model (mm)
Theoretical
width, semi-
circular model
(mm)
C4 5.78 9.0 3.9 253 266 277
C5 7.16 8.4 2.7 247 264 289
C6 17.60 22.6 29.3 369 370 390
The theoretical width of an earthbag at failure is calculated from equation (4.2) and (4.17), for
the rectangular model and semi-circular model respectively. The models use the assumed height
of a bag given the displacement of the platen at failure from the experiments.
Figure 23 shows the deviation in volume of the earthbags from the original volume against
displacement of the platen. From the graph it can be seen that all samples underwent an initial
reduction in volume of similar magnitude. This was expected given the earthbags could never be
fully compacted prior to testing. Figure 23 indicates that the stabilised stack underwent a high
level of initial compaction, with relatively little lateral movement; the cause for this is discussed
in §6.3.3. Up to the point of failure of the earthbags, the range of measured volume to initial
volume was between 0.92 – 1.04. Given the issues raised regarding the accuracy of the
transducer for test C4 and C5, measurements taken from transducer in C6 can be considered
most accurate and these results deviate the least from constant volume, up to failure. Measuring
the dimensions of earthbags prior to and during loading is an approximate process and therefore
the data from testing must be taken with a reasonable margin of error. Thus, for the purposes of
analysis and given the maximum deviation measured volume to initial volume is 8% it is fair to
assume a constant volume throughout loading to failure of the earthbag.

6. Results & Analysis
35
Figure 23: Ratio of measured volume of earthbag in 8 bag stack to initial volume of earthbag
against displacement of platen
To calculate the theoretical vertical load applied to an earthbag to cause failure the value of x
must be found using equation (4.7) assuming a rectangular cross section or equation (4.20)
assuming a cross section with lateral semi-circular edges as discussed in §4.2.1. Taking the
average values of E and ��������� found from the tensile tests and initial dimension of earthbags
given in Appendix B, a value for x for individual bags is found to be:
Table 4: Comparison between theoretical vertical deformation and experimental vertical
deformation of an earthbag. Test E
(N/mm) ��������� (N/mm) Actual x
(mm)
Theoretical x (mm)
Rectangular model
Theoretical x (mm)
Semi-circular model
C4 127.9 19.2 10.0 19.5 16.4
C5 127.9 19.2 14.4 28.2 22.3
C6 56.6 9.7 15.5 21.6 19.0
The theoretical models over estimate the magnitude of vertical deformation the earthbag has
undergone up to failure. This is likely to be a result of an overestimation of the bag material
strain capacity which could be due to an underestimation of the stiffness of the bag material or
overestimation the tensile strength. The theoretical models only consider 2D confinement
provided by the bag, in reality material fibres running longitudinally will act to resist lateral
movement of the bag material and hence improve the stiffness of the bag. For a value of x, the
strain experience by the bag material for the semi-circular model is higher than the rectangular,
thus the rate of predicted tensile stress development in the bag material is higher. This is
illustrated in Figure 44 (Appendix D). Hence with the semi-circular model, the tensile stress limit
is reached at a lower value of x, which would produce a closer estimation of failure strength to
0.85
0.9
0.95
1
1.05
1.1
0 25 50 75 100 125 150 175 200
V/V
0
Displacement of platen (mm)
C4 Middle bag
C4 Edge bag
C5 middle bag
C5 edge bag
C6 middle bag
C6 edge bag
C4: peak load of 157kN at 79mm
C5: peak load of 128.8kN at 115mm
C6: peak load of 92.8 kN at 124mm

6. Results & Analysis
36
the experimental value. Using the experimental and theoretical values of x a predicted failure
load for the earthbags can be made using equation (4.14):
Table 5: Comparison between theoretical and experimental failure loads of the earthbags under
vertical compression Test Actual Pv
(kN)
Theoretical Pv using
experimental values
of x at failure (kN)
Rectangular model Semi-circular model
Theoretical Pv
(kN)
B failure
(mm)
Theoretical Pv
(kN)
B failure
(mm)
C4 157.0 155.2 202.5 303 185.3 290
C5 128.8 115.0 156.8 310 136.5 288
C6 92.8 85 99.6 401 93.1 388
The results show a good correlation between the experimental and theoretical failure loads
calculated with a known value of x. For unknown value of x, assuming a rectangular cross
section provides a grossly inaccurate prediction of the failure load of the earthbag for C4, a
deviation of ≈ 30% to the experimental result. The semi-circular model also overestimates the
failure load (by 18%). It was thought both theoretical models would underestimate the strength
of the stabilised earthbag, as they do not account for any initial cohesion provided by the cement
which increases failure load as shown in Figure 9. The overestimation in strength could be a
result of several factors; underestimation of E, overestimation of contact area at failure,
overestimation of ��������� or inaccurate initial bag measurements. For the subsequent tests the
semi-circular model provides reasonable predictions of the failure loads, thus can be considered a
sufficiently accurate simplified analysis for the compressive capacity of earthbag under uniaxial
compression.
6.3.5 Sources of error in experimental and theoretical work
Several sources of error for both the experimental and theoretical work have been explored,
below is a summary of the key points:
• End restraint effects; as previously mentioned, frictional forces arise between the bag and
the plates which oppose the lateral spread. Work is done to counter these forces and thus
leads to inaccurate value of vertical stress.
• Frictional forces will vary across the section, maximum at the edges and minimum and
the centre, hence barrelling of the earthbag.
• Stress ratio is not constant; during loading the density of the sand increases which will
result in an increase in the friction angle and hence the value of Kp will rise.
• Changing voids ratio; all models assume a minimum possible voids ratio for the sand
prior to loading, which is not true as the sand underwent some compaction during the
early stages of loading. This is represented in Figure 44 by an initial negative region of
∆L/L0. Furthermore this assumption suggests once loading is started tensile forces in the
bag material are initiated immediately. This could lead an underestimation of failure load;
however, due to other affects, failure loads are generally overestimated even when end
restraints effects are minimum.

6. Results & Analysis
37
• Only 2D action considered in theoretical models; the models only considers σ1 and σ3
they ignore σ2. Longitudinally confinement provided by the bag material is ignored.
• Plane strain does not hold. This is largely dependent on initial arrangement of bags as
previously mentioned. However, in cases were the end did not fold out the bag still
experienced longitudinal expansion. The assumption of plane strain is more realistic as
the ratio of l0/B0 → ∞. In an earthbag structure, the plane strain can be assumed as the
bag will be restrained by neighbouring bags.
• Inaccurate measurements of earthbags; measurements of initial dimensions of earthbags
are never 100% accurate due to the uneven shape of the bags. Furthermore recording
deformations of the earthbags during testing proved problematic due to rotations of wood
pieces and rotation of bag stack.
6.3.6 Summary and conclusion of compression tests
Predictably the bag material strength was the principal material aspect governing the strength of
the earthbags. The 100gsm polypropylene earthbags were found to have the highest strength and
were the easiest to construct with. Although hessian bags are not susceptible to UV degradation,
which is a durability concern of polymer bags, they proved difficult to manage and failed during
the single bag compression tests. Due to their fibre spacing, tamping of the bag resulted in a
significant volume of sand escaping. The addition of 4% cement increased the load capacity by
22%; it also improved the stiffness of the earthbags which had a significant benefit for the arch
tests, see §6.5.1.2. With regards to the testing procedure, the stack had a dramatic effect on the
observed failure load of the bags. To reduce end restraint effects, a height to width ratio of H0/B0
≥ 3.0 is required, higher than that suggested by Lohani et al. (2006) (H/B ≥ 2.0).
The assumption of constant volume of the earthbag for analysis can be considered to be
acceptable up to failure of the earthbag, there after the assumption does not hold. Assuming a
plane strain condition does not hold for unconfined compression tests, however, the theoretical
models often overestimate the increase in width of the earthbag during loading by ignoring any
initial compaction of granular particles. Therefore, this overestimation in width is somewhat
offset by assuming plane strain, for the calculation of vertical failure load. Without assuming
plane strain a more complicated 3D analysis would be needed, furthermore in practical
application, the earthbags are restricted longitudinally.
The semi-circular model provided a more accurate theoretical model for the behaviour of
earthbag under vertical compression. The accuracy of either model is subject to accuracy of
initial measurement of earthbag dimension and bag material properties, thus the theoretical
models must be taken with a reasonable margin of error. It is unlikely the vertical loads which
the earthbags were subjected to during testing will be experienced during their structural
lifespan. The compressive strength of a 100gsm polypropylene earthbag was found to be
1.7N/mm2. Overall deformations due to self weight are expected to be small. For example,
assuming a 3.5m high unstabilised 100gsm polypropylene earthbag wall, bag height of 0.1m and

6. Results & Analysis
38
bag weight to be 20kg the lowest bag will experience a load of 6.9kN, from experimental data
this would result in 1.8mm vertical deformation.
6.4 Shear Test of Earthbags
Large scale direct shear box tests between 20kg earthbags were performed as outlined in §5.4.
From the experiments a relationship between shear stress / normal stress and horizontal
displacement can be obtained. This data is displayed in Appendix C, which is used to calculate the
residual shear stress / shear strength for each experiment. From the τf/σN against horizontal
displacement graph a data range was selected were the ratio of τf/σN remained relatively constant.
From this data range an average value of τf and σN was obtained; were more than one test was
undertaken for a particular normal load an average was taken. The results for each of the
experiments are represented in Figure 24. Graphs of τf/σN against horizontal displacement for all
tests is given in Appendix C.
Figure 24: Shear strength against normal compressive stress for large shear box experiment with
variation in interface between earthbags.
Table 6: Horizontal displacement at which shear strength was mobilised. Test Expected
normal load
(kN)
Average shear
stress (kN/m2)
Mobilisation (mm) Friction
coefficient µ
100gsm
polypropylene no
barbwire.
2.2 17.9 1.1 0.43
7.1 47.0 0.7
12.0 80.0 1.9
17.1 110.3 1.7
100gsm
polypropylene
barbwire.
2.2 29.2 11.7 0.67
7.1 80.1 20.5
12.0 132.4 14.0
Hessian no barbwire 2.2 34.6 7.4 0.89
259.59
183.49
110.82
35.96
35.38
111.27
189.35
37.99
108.73
183.60
y = 0.4289x
y = 0.67x + 5.5413
y = 0.885x
0
20
40
60
80
100
120
140
160
180
0 50 100 150 200 250 300
τ f (kN
/m2)
σN (kN/m2)
No barbwire
Barbwire
Hessian

6. Results & Analysis
39
7.1 93.1 18.5
12.0 164.2 16.0 i) Initial density of earthbag: 17.6 kN/m
3
ii) Contact area taken as 0.066m2
The friction coefficient between the earthbags is obtained from the gradient of the linear
regression of the points in Figure 24. For the hessian and no barbwire data the linear regression is
forced through the point (0,0). It should be noted at low normal compressive stresses the
accuracy of the results reduces. Furthermore providing a constant normal compressive force
using a hand operated hydraulic jack system proved difficult at low loads. In addition the
earthbags experienced dilatancy which caused the steel plate to tilt resulting in an increase in
normal load to try and sustain the vertical position of the plate. The tilt of the plate became
significant with relatively large horizontal displacement hence the measured vertical position of
the earthbags is inaccurate near the end of the test.
The graphs of τf/σN against horizontal displacement in Appendix C show good repeatability for
shear tests without barbwire between the earthbags. Data for shear test with barbwire is more
wide-ranging, as seen in Figure 41, which indicates the variability the barbwire brings to the
interface.
As predicted the hessian bags provide the highest frictional resistance against sliding between
two earthbags. It was noticed, after the experiment, that the interface between the bags included
sand and water which had been forced out from the hessian bags due to the applied normal load.
It is thought that the sand contributed to the high coefficient of friction obtained from the results.
Figure 25: Interface between hessian earthbags after large shear box test
The two strands of 3-point barbwire between the earthbags provided an initial ‘cohesion’ of
5.54kN/m2 and, unexpectedly, were shown to improve the friction coefficient between the bags.
It is through that an increase in vertical stress increases the horizontal confining stress within the
sand, thus the effective resistance provided by the barbwire points enhances resulting in a higher

6. Results & Analysis
40
friction coefficient between the bags. The linear regression for the polypropylene bags without
barbwire actually provided an initial cohesion of 2.3kN/m2, but has been forced through the point
(0,0) due to the unreliability of data at low applied normal loads. Hence, it can be seen that the
cohesion provided by the two strands of barbwire was by no means substantial.
The improved shear strength provided by the barbwire strands is dependent on several factors
namely, length of barbwire point, orientation of barbwire point, density of soil, soil bearing
strength and stiffness of barbwire. How the barbwire is initially laid between the earthbags is an
influential factor on the shear strength between the bags. For this experiment attention was paid
to ensure the barbwire points penetrated the earthbag material, however, during construction of
earthbag structures this is easily neglected, therefore the effectiveness of the barbwire is reduced.
The use of barbwire is beneficial during construction as it provides an apparent cohesion
between the bags which resists shear forces generated from tamping the earthbags, thus
preventing the earthbags sliding due to this action.
Figure 26: Photo of earthbag showing points where bag material was torn during direct shear
test.
A small amount of tearing around the barbwire point on the lower bag was noticed after the
experiment, see Figure 26. Therefore the barbwire point must have under gone translation as well
as rotation failure. No significant tearing was noticed on the upper bag, given the bag remained
stationary. Table 6 indicates that the shear strength mobilisation is much higher with barbwire
and hessian bags than polypropylene bags; illustrating the addition of barbwire or use of hessian
bags allows the earthbag to sustain higher shear displacements.
From the results of the shear box test, it was deduced that the failure mechanism for the barbwire
arch would not be due to sliding. This can be supported by comparing the coefficient of friction

6. Results & Analysis
41
µ = 0.67 to that of a traditional masonry on masonry system µ = 0.6 – 0.7 (Cobb, 2009) which,
for an arch of similar geometry, would fail due to formation of hinge mechanism.
6.4.1 Shear resistance in earthbag structures
As shown with the large shear box tests the barbwire increases the friction between the bags,
however, there is a further resistance against an out of plane shear force provided by barbwire
points which is detailed below. Consider an external line load acting on a proportion of an
earthbag dome, as shown by Figure 27. It is thought the stiffness of the barbwire strand is
significantly higher than the barbwire point. As the force pushes the bags inside the dome, the
barbwire strand remains rigid and is pulled by the barbwire point within the earthbag subject to
the external force undergoing translation. This in turn exerts a force onto the connecting
earthbags’ barbwire points neighbouring the earthbag subject to the external force. Translations
of these barbwire points are resisted by the bag material and fill within the earthbag; this
therefore acts to resist movement of the earthbag subject to the external force. For an internal
applied load this component is initiated at small deformations, although would be small.
However, for external loads acting on a dome structure, at small deformations no resisting forces
are initiated given the barbwire strand would be in compression, see Figure 27. Resisting forces
are activated once the angle between barbwire points, γ, is ≤ 90°, assuming a co-ordinate system
as shown in Figure 27.
Figure 27: Predicted shear failure mode of earthbags in a dome structure subject to a line load. *� . 8 � 2=kl (6.5)

6. Results & Analysis
42
*� . 8 � 2�=k sin m� (6.6)
For large values of a, the external applied force must be resolved perpendicular to the tangent of
the dome.
A rough estimation of the required force to cause translation of the barbwire point, in adjacent
unloaded earthbags can be made using the data from the large scale direct shear tests. From the
tests the barbwire was found to provide an apparent cohesion. Given that with no applied normal
load, the shear resistance between polypropylene earthbags is expected to be zero, one can
deduce that this apparent cohesion is solely due to the effect of the barbwire. Thus from the
apparent cohesion the maximum resisting shear force provided by the neighbouring earthbags
due to the mechanism illustrated in Figure 27 can be estimated. However, for the shear tests,
only tearing of one earthbag’s wrapping material was experience, whereas with the mechanism
shown in Figure 27 failure of both earthbags’ wrapping materials will occur. This can roughly be
accounted for by multiplying the calculated resistance by two:
=k � 2�T� . 6� � 2 f 5.54 f 0.235 f 0.453 � 1.18nh (6.7)
This approximate estimation of the maximum resisting force is an overestimation of the actual
resistance provided. Firstly the shear stress obtained from Figure 24 is a residual shear stress,
thus this value is only achieve once a degree of translation of the earthbag occurs. For an external
shear force this is less of a concern given the angle between barbwire points must be ≤ 90º (see
Figure 24), thus some initial movement is needed for a force to be initiated. Secondly the large
scale direct shear tests used two strands of 3-point barbwire. Therefore the force calculated in
(6.7) is the resistance provided by 12 barbwire points assuming 2 of the three points pierce the
bag material. Even though an overestimated resistance is found, it can be shown, comparable to
the resistance provided by friction between the bags this force is negligible. Resolving in the
direction of the applied load, the shear resistance is therefore given by:
=kl � =k sin m � 1.18 sin m (6.8)
From Table 6 it can be seen that the maximum recorded mobilisation was 20mm. Assuming the
earthbag subject to the applied shear force has undergone 20mm displacement parallel to the
applied load, the initial angle between barbwire points in adjacent earthbags is zero and the
distance between barbwire points is 100mm, θ can be taken as:
m � tanop 20100 � 11.3° (6.9)
Therefore, for this case, resolving in the direction of the applied load and ignoring normal loads
and compression forces tangential to the sides of the earthbag, it is shown that:
*� . 8 q 2r=kls � 2�1.18 sin 11.3� � 0.46nh (6.10)
Figure 28 compares this force with the resistance provided through friction between the bags in a
hemispherical dome; explanation of the derivation of the graph is given in Appendix E. The

6. Results & Analysis
43
influence of the mechanism illustrated in Figure 27 only becomes significant around α = 30°.
However, for the region of the hemispherical dome where α < 51.82° (Heyman, 1977)
compressive forces act within ring segments which will operate to resist shear movement of the
earthbag. These forces will be of a higher magnitude than the resistance provided by the action
shown in Figure 27. In addition, a rendered earthbag structure is likely to have chicken wire
mesh on its outside and possibly on the inside, if rendered both sides. This will act to resist shear
displacement of earthbags through bending, assuming it is adequately connected to the structure.
Figure 28: Comparison between shear resistance due to friction between earthbags and due to
barbwire mechanism in a hemispherical dome.
Thus, it can be concluded that the principal mechanism of the barbwire in improving shear
resistance between earthbags is individual dowel action of the barbwire points. Therefore,
theoretically similar systems could be employed to provide adequate shear resistance between
earthbags such as small wooden dowels/stakes, adequate diameter steel pins etc. Other forms of
shear connections have previously been employed; Grasser & Minke, (1990) hammered bamboo
poles through earthbags onto a continuous tie beam.
The advantage of using barbwire over other materials is that it can be easily sourced, quick to use
and is cheap. On the other hand, as previously mentioned, the effectiveness of placing barbwire
between earthbags to provide shear resistance is largely dependent upon the workmanship in
forming the earthbag structure. Furthermore it can be somewhat difficult to handle and there is a
safety issue both during construction and if it become exposed during the lifespan of the
structure. The use of hessian bags would provide sufficient friction however; would not provide
any initial cohesion. In addition hessian bags are very ductile therefore earthbag structures made
with this material would be subject to higher deformations for relatively lower loads.
0
0.5
1
1.5
2
2.5
3
3.5
4
4.5
0 20 40 60 80 100
Tj(k
N)
α (°)
Barbwire
Mechanism
Shear resistance
due to friction
between bags

6. Results & Analysis
44
The importance of material factors in providing shear resistance is largely dictated by the
geometry of the structure. That is to say, the issues regarding the shear resistance between
earthbags becomes more prominent in wall or arch structures rather than a dome structure which
is also less susceptible to disproportionate collapse.
6.5 Arch Test
Several arch tests were performed as outlined in §5.5 to gain a better understanding how
earthbags behave in a structural sense and how the materiality affects the structural performance.
Displacements of an arch were measured using transducers at quarter spans and mid span.
Failure of the arch loaded at midspan occurred due to rotation of abutments; due to limited space
in this dissertation this test will not be further discussed. In addition pictures of the arches were
taken at various load increments and a continuous stream was taken during collapse of the
arches. Pictures from the tests are put into a continuous video clip which is given in the
accompanying C.D. The results of the tests are shown below:
Table 7: Summary of results from earthbag arch tests Maximum load
Test Nº
of
bags
Weight
of arch
(kN)
Vertical
load
(kN)
Horizontal
load(c)
(kN)
Quarter
span (1)
deflection
(mm)
Midspan
deflection
(mm)
Quarter
span (2)
deflection
(mm)
Stiffness
of arch
(kN/mm)
Unstabilised
quarter span
load – 2
28 5.35 4.12 1.53 41.8 -3.6 -12.6 -
Unstabilised
midspan
load
30 5.76 7.69 10.1 -16.7 64.3 -2.2 -
Stabilised
quarter span
load
30 5.75 7.26 3.36 8.75 -5.9 -1.3 1.32 (up
to 4kN)
Barbwire
quarter span
load
29 5.71 3.85 2.50 40.4 -18.6 -8.4 -
Point of collapse of structure
Test Nº
of
bags
Weight
of arch
(kN)
Vertical
load
(kN)
Horizontal
load (kN)
Quarter span
(1) deflection
(mm)
Midspan
deflection
(mm)
Quarter span
(2) deflection
(mm)
Unstabilised
quarter span
load - 1(a)
23 4.38 2.0 1.2 17 -16 -15
Unstabilised
quarter span
load – 2
28 5.35 2.32 1.44 89.5 -10.9 -25.1
Unstabilised
midspan
load
30 5.76 5.59 8.27 -37.5 96.3 -4.2
Stabilised 30 5.75 1.77 2.20 51.4 -34.9 -53.3

6. Results & Analysis
45
Figure 29: Picture of earthbag
and abutment for first
unstabilised earthbag arch test
quarter span
load
Barbwire
quarter span
load (b)
29 5.71 1.2 1.7 129.0 -55.8 -30.4
(a) Transducers were not used for this experiment, loading was read from load cells and
measurements were taken from photographs.
(b) The displacements at collapse for the barbwire were measured from the pictures taken; the LVDT
transducers were removed to protect them from the collapse of the structure.
(c) Includes thrust applied due to arch weight
6.5.1 Earthbag arches loaded at quarter span
6.5.1.1 Unstabilised no barbwire arch
An initial earthbag arch test was performed so an estimated
failure load and deformation could be known. The failure
load was measured as 2kN with a 17mm displacement
underneath the applied load; it is clear this is much lower
than the failure load for the second unstabilised arch test
(4.12kN and 41.8mm). This difference can largely be
accounted to improved initial compaction of the earthbags
and an overall better constructed arch which meant a further
5 earthbags were needed for the test. This increase in bag
number is also due to a slight increase in abutment spacing
for the second test. During the first test it was noticed the
earthbags did not fully bear onto the abutments, therefore
were subject to rotation and thus not acting as fixity. From Figure 29 shows the earthbag is not
fully supported, which meant the thrust line deviates from the arch at a lower loading.
Experiment 2, unstabilised earthbag arch loaded at quarter span, will be used as a basis for
comparison of material effects.
Unload and reload cycles were performed on the arches to give an appreciation of the elasticity
and recovery of the arch structure. Figure 32 shows the load displacement relationship at quarter
span for the unstabilised earthbag arches loaded at quarter span. Full data up to collapse of the
arches is not shown in this graph for clarity of the initial behaviour up to ultimate strengths.
Unload reload cycles occurred around 0.5kN, 2kN and 3kN for the unstabilised no barbwire
arch. The unstabilised arch with no barbwire had a low stiffness and showed little elastic
behaviour. For 2kN applied load the arch experienced quarter span, mid span and three quarter
span deflections of +13.9mm, +0.9mm and -2.6mm respectively. Therefore the arch has failed in
serviceability at this stage, taking an allowable span to depth ratio of 1:200. In addition the arch
showed little recovery which would be problematic for its practical application, e.g. for a similar
span to rise ratio arch or open ended barrel vault structure.

6. Results & Analysis
46
There was no clear defined 4 hinge mechanism, however, near collapse of the arch some rotation
between earthbags was beginning to form. Collapse of the arch occurred due to sliding between
segments of the arch. The formation of a defined hinge mechanism could not occur because the
earthbags did not behave rigidly, but that is not to say a mechanism did not form, merely that it
was unclear. It is thought as the thrust line deviates from the centre line of the arch, rotation of
the earthbags occurs. This reduces the contact area between the bags, which results in higher
stresses acting between the bags. These stresses causes failure of the sand which redistributes
within the earthbag to areas under lower stress, hence, the gap between the bags diminishes such
that any initial rotation is reduced. Consequently, the arch has undergone deformation and the
position of the thrust line must alter according to the new shape. Thus, overall, the behaviour of
the arch is non-linear, which is support by Figure 32. The plastic analysis outlined in §4.4
assumes the earthbags do not fail in compression, which holds, however failure of sand does
occur which reduces the accuracy of the analysis method.
6.5.1.2 Stabilised arch
The effect of having rigid earthbags can be seen by comparing the stabilised and unstabilised
arches. The addition of 4% cement improved the ultimate strength of the earthbag arch by 76%.
Comparing the behaviour of the two arches it can be seen that the stabilised arch experienced a
sharp loss in load carrying capacity after peak ultimate strength, where as the unstabilised arch
showed a more gradual reduction in load carrying capacity after ultimate strength.
The addition of cement meant the earthbags behaved more like rigid blocks, therefore in regions
of high moment stress resultants hinges formed which redistribute the bending moments across
the structure. From the arch pictures and video stream, it can be seen that the sharp loss in load
carrying capacity corresponds to the formation of a hinge underneath the applied vertical load.
The hinge causes rotation to occur which lead to deformation of the arch as load is applied.
Unload and reload cycles were performed at 1kN, 4kN and 6kN vertical load. Initially the arch
showed elastic behaviour, with virtually full recovery after 1kN unload reload cycle. Residual
deformations at quarter span of 1.4mm and 2.5mm were recorded by the transducers at 4kN and
6kN unloading and reloading cycles. This is more encouraging for the application of earthbag
arches. It can be argued the arch did not fail in serviceability for an allowable span to depth ratio
of 1/300. It is clear, that with respect to the unstabilised arch, the behaviour of stabilised arch is
similar to that of a masonry arch, which makes it somewhat easier to predict failure load.

6. Results & Analysis
47
Figure 30: Photos from stabilised arch test showing hinge mechanism failure of arch
Analysis using ‘Ring 2.0’ software has been undertaken to compare the theoretical failure load of
a masonry structure with the experimental failure load of the stabilised earthbag arch. The
analysis program suggests an equivalent masonry arch with the same dimensions would fail in
sliding at 7.9kN applied vertical load taking µ =0.43. This further confirms that the stabilised
earthbags undergo local deformation which prevents individual earthbags from sliding out.
However, it was concluded from Pelly (2010) that stabilised earthbag arch could be analysed as
masonry arches.
Figure 31: Masonry arch analysis using Ring 2.0
6.5.1.3 Barbwire arch
Like the unstabilised arch without barbwire a pronounced peak load was not achieved. The
barbwire did not improve the strength of the arch; in fact the failure strength is slightly less than
the unstabilised arch without barbwire. Up to 1kN applied load the behaviour of the arch was
linear elastic, there after it was non-linear. Therefore the inclusion of barbwire prevented
movement of the earthbags under relatively low loads. The arch was able to sustain a substantial
deformation before collapse, around 39.5mm more at quarter span than the unstabilised arch
without barbwire (measured from pictures taken during experiment). Although the arch was able
to sustain loading at high deformation, such deformations are well above the acceptable limit for
practical application. The structure would be designed such that failure strength is not reached.
Therefore, it can be argued that the barbwire has no positive affect in this application given the
arch structure without barbwire achieved a similar load capacity. However, the barbwire does

6. Results & Analysis
48
provide resistance against shear forces developing due to out of plane loading which must be
consider in a practical application.
Figure 32: Load displacement graph for earthbag arches loaded at quarter span
6.5.2 Summary and conclusion of earthbag arch tests
It is clear from tests that the addition of 4% cement made a significant effect on the behaviour of
the earthbag arch. The addition of cement caused the earthbags to behave as semi-rigid blocks, as
follows, can be seen to act more like a masonry arch. A similar affect could be seen with the
addition of clay content in improving the strength of the arch structure. The magnitude of
improvement is largely dependent on percentage clay added and moisture content thus empirical
analysis is required. Both the stabilised and unstabilised arches did not fail prematurely due to
sliding. Therefore the addition of barbwire did not improve the failure strength of the arch,
although increases its capacity to sustain higher deformations. However, the magnitude of shear
stresses developing between the earthbags is a function of the geometry of the arch and applied
load(s), thus the application of barbwire is geometrically dependent.
For the arches loaded at quarter span the hydraulic load ran out of travel, often prior to the arch
reaching peak load. Additional wood / metal blocks were placed underneath the load, however,
rotation of these blocks occurred which meant the load was not applied vertically to the extrados.
This may have resulted in a lower peak load. Quality control on the construction of the arch is
also a principal factor governing the load capacity of the structure; this is most evident when
comparing the results from the first and second unstabilised arches without barbwire.
0
1
2
3
4
5
6
7
8
0 10 20 30 40 50 60
Ver
tica
l lo
ad (
kN
)
Quarter span displacement (1) (mm)
Quarter span displacement - Arch
with barbwire
Quarter span displacement -
Stabilised
Quarter span displacement -
Unstabilised & no barbwire

7. Conclusion
49
7 Conclusion
Experimental and analytical analysis on the behaviour of earthbags in relation to earthbag
housing has been conducted. Particular focus has been paid to define material parameters
required for the design of earthbag structures.
Compression tests on earthbags with variations in stack height, material fill quantity and bag
material have been performed. The behaviour of an earthbag in compression is non-linear until
the voids ratio of granular material reaches minimum, thereafter the load displacement
relationship is linear almost to failure. The compressive strength of an earthbag is governed by
several material parameters principally, tensile capacity of bag material, friction angle of soil and
initial cohesion provided by soil. For an unstabilised 100gsm polypropylene earthbag the
compressive strength was found to be 1.7N/mm2, hence compressive failure is unlikely to occur
in an earthbag structure. However, unlike the polypropylene earthbags, the hessian earthbag
failed under a single bag compressive test. The bag showed comparably less strength, was
difficult to handle due its flexibility and could not retain very fine sand. From testing, a stack
height ratio of H0/B0 ≥ 3.0 was found to be sufficient to minimise end restraint effects.
Analysis of compression data found that current theoretical models overestimate the vertical
deformation of the earthbag up to failure leading to an overestimation of load capacity. A
maximum divergence between measured earthbag volume and initial volume of 8% was found
during testing to failure. Although measurement accuracy is suspect, deviation is not expected to
be greater than 8%. Therefore, the assumption of constant volume is acceptable for the purpose
of simplified analysis. A theoretical model assuming an earthbag cross section with lateral semi-
circular edges was found to be most accurate in predicted the failure load.
Results from the large scale direct shear box tests between earthbags indicate the inclusion of
barbwire improves the coefficient of friction and provides an initial cohesion between earthbags.
The primary mechanism of the barbwire points in providing shear resistance is expected to be
dowel action. Therefore, the effectiveness of the barbwire is dependent on density of granular
fill, barbwire point surface area and orientation of barbwire point. However, this hypothesis
should be further investigated through empirical analysis to confirm its accuracy. Hessian on
hessian provided the highest coefficient of friction, however as before proved difficult to
manage.
The addition of 4% cement produced a 76% increase in load capacity for the arch. With the
addition of cement the earthbags behaved as semi-rigid blocks, with overall elastic behaviour up
to 6kN applied load, and failure of the arch via formation of a defined hinge mechanism. The
unstabilised arch did not fail prematurely due to sliding, owing to the flexible nature of bags,
thus the addition of barbwire contributed little to the strength of the arch. Unlike the stabilised

7. Conclusion
50
arch both unstabilised arches failed in serviceability at relatively low loading. The quality control
of construction was a significant influence on the failure load of the arches.
This work provides a preliminary investigation into the material and structural behaviour of
earthbags. However, given the variable behaviour of earthbags with variation in structural
system, continued research is required to gain an understanding on the structural limitations of
earthbags. Some suggested further research areas are given below.
7.1 Future Work
The current structural form of most earthbag housing is a catenary dome; extrapolating data from
the arch test to estimate failure strengths of a dome structure would provide very conservative
answers. Thus full scale dome testing is required to quantify failure capacity and gain an
understanding of how earthbags behave in 3d structures.
Often a barrier to the implementation of earthbag housing is its ‘primitive’ architectural form and
departure from western buildings. Furthermore there are limitations to the use of earthbag domes
for large scale projects. For the application of more orthogonal structures a greater understanding
into the flexural strength of earthbag walls in required. A test procedure similar to that outlined
in BS1052-2:1999 for determining the flexural strength of masonry walls could be implemented.
Other forms of shear connectors between earthbags should be investigated. A similar large scale
shear box test as performed in this dissertation could be undertaken using wood dowels or steel
pins between bags. The experiment would also verify whether the shear mechanism provided by
the barbwire is primarily dowel action of the barbwire points.
The chosen materials which have been investigated in this project are limited specifically to
relate to the Namibia project with FCBS. There is scope to investigate variation in soil
constituents, specifically the addition of clay and how the variation affects the earthbag’s
behaviour.
Finally, for the long term employment of earthbag structures, a further investigation into the
material durability should be undertaken.

Bibliography
51
Bibliography
Cal-Earth Inc. / Geltaftan. (2010, February 11). Cal Earth photo gallery. Retrieved March 29, 2010, from
Cal Earth: http://calearth.org/galleries/eco-dome.html
Broms, B. (1964). Lateral resistance of piles in cohesionless soils. 90, pp. 123-155. J. Soil Mechanics &
Foundation Division ASCE.
BS1052-2:1999. (n.d.). Methods of test for masonry. Part 2: Determination of flexural strength . BSI.
BS1377-2:1990. (n.d.). Methods of test for Soils for civil engineering purposes. Part 2: Classification
tests . BSI.
BS1377-7:1990. (n.d.). Methods of test for Soils for civil engineering purposes -. Part 7: Shear strength
tests (total stress) . BSI.
BS4102:1998. (n.d.). Specification for steel wire for general fencing purposes. BSI.
Cobb, F. (2009). Structural engineer's pocket book (Second edition ed.). Oxford: Elsevier.
Daigle, B. (2008). Earthbag housing: Structural behaviour and applicability in developing countries.
Queen's University, Ontario, Canada, Department of Civil Engineering.
DeJong, J., & Frost, J. (2002). Physical evidence of shear banding at granular-continuum interfaces. 15th
ASCE Engineering Mechanics Conference, (pp. 1-7). Columbia University, New York, NY.
du Pisanie, N. (2009). Community building - Sustainable, appropriate desert building for the Topnaar
communities of the Kuiseb River. 11th international conference on non-conventional materials and
technologies.
Gilbert, M., Casapulla, C., & Ahmed, H. (2006). Limit analysis of masonry block structures with non-
associative frictional joints using linear programming. Computers and Structures. (84), 873-887.
Grasser, K., & Minke, G. (1990). Building with Pumice. Friedr. Vieweg & Sohn Verlagsgesellschaft.
Heyman, J. (1977). Equilibrium of shell structures. Oxford University Press.
Heyman, J. (1995). The stone skeleton : structural engineering of masonry architecture. Cambridge
University Press.
Huang, W., & Bauer, E. (2003). Numerical investigations of shear localization in a micro-polar
hypoplastic material. International journal for numerical analytical methods in geomechanics (27), 325-
352.
Jewell, R. A., & Wroth, C. P. (1987). Direct shear tests on reinforced sand. Geotechnique , 37 (No. 1), 53-
68.

Bibliography
52
Kibbert, C. (1994). Principles of sustainable construction. 1-9. Tampa, Florida, US.
Koerner, R. (1997). Designing with Geosynthetics (4th Edition ed.). New Jersey: Prentice Hall.
Livesley, R. (1978). Limit analysis of structures formed from rigid blocks. International Journal of
Numerical Methods in Engineering (12), 1853-1871.
Lohani, T., Matsushima, K., Aqil, U., Mohri, Y., & Tatsuoka, F. (2006). Evaluating the strength and
deformation characteristics of a soil bag pile from full-scale laboratory test. Geosynthetics International ,
13 (6), 246-264.
Matsuoka, H., & Liu, S. (2003). New earth reinforcement method by soilbags ("Donow"). Soils and
Foundations , 43 (6), 173 -188.
Pedley, M. (1990). The performance of soil reinforcement in bending and shear. University of Oxford,
Soil mechanics group.
Pelly, R. (2010). Plastic limit analysis of earthbag structures. University of Bath, Department of
Architecture and Civil Engineering.
Roscoe, K. (1970). The influence of strains in soil mechanics, 10th Rankine Lecture. Geotechnique , 20
(2), 129-170.
Tantono, S. (2007). The mechanical behavior of a soilbag under vertical compression. Graz Univerisity
of Technology, Institute of Applied Mechanics.
Xu, Y., Huang, J., Du, Y., & Sun, D. (2008). Earth reinforcement using soilbags. Geotextiles and
Geomembranes (26), 279-289.

Appendices
53
Appendix A
Figure 33: Dry sieve analysis of Kuiseb riverbed sand, near Gobabeb.
1/2/10
Figure 34: Dry sieve analysis builders sand - Bath
Bath sand description:
Medium grained, clean, light / yellowish / yellow, rounded SAND.
18/1/10

Appendices
54
Appendix B
Figure 35: Diagram showing how earthbags were measured.
Table 8: Earthbag dimensions and densities for compression tests. Experiment Bag
Materia
l /
Weight
li lii l0 � �� � ���2
ledge B0 Bedge H0 A Volume
(m3)
Density
(kN/m3)
Compression
test – 3bag
PP1
10kg
340 310 325 18 280 18 68 93 7.15x10⁻³
13.7
Compression
test – 3bag
PP1
15kg
410 337 374 25 230 28 86 118 8.55x10⁻³
17.2
Compression
test – 3bag
PP1
20kg
480 425 453 35 235 30 105 130 0.013 15.1
Compression
test – 3bag
PP2
20kg
390 289 340 25 305 25 95 130 0.011 17.8
Compression
test – 8bag
PP1
20kg
430 410 420 40 230 30 110 150 0.013 15.1
Compression
– stabilised
test 8 bag
PP1
20kg
470 430 450 10 235 10 87 100 9.80x10⁻³
20.0
Compression
test - 8 bag
PP2
20kg
390 330 360 30 310 30 95 127 0.013 15.7
Arch test – ¼
span load
PP1
20kg
412 360 386 25 212 25 100 171 9.68x10⁻³
20.3
Arch test –
barbwire
PP1
20kg
480 445 463 35 235 35 103 100 0.014 14.6
Arch test –
Stabilised
PP1
20kg
480 440 460 35 250 35 101 100 0.014
14.6
Large shear
box test
PP1 &
H 20kg
- - 300 - 220 - 110 - 0.0073 17.6
*PP1 – Polypropylene 100gsm, PP2 – Polypropylene 70gsm, H – Hessian. All bag dimensions
are in mm unless stated. Date measurements were taken: Feb 2010 – April 2010.
Table 9: Moisture content of sand for barbwire and stabilised arch tests. Sample 1 Sample 1 Sample 1 Average
Arch test -
barbwire
MC % 9.4 8.7 6.5 8.2
Arch test -
stabilised
MC % 6.43 6.5 5 6.0
Samples were oven dried at 100°C for 24 hours.
Barbwire arch:12/3/10 Stabilised arch: 1/3/10

Appendices
55
Appendix C
Figure 36: Large scale shear box test for 100gsm polypropylene earthbag no barbwire - 2.2kN
applied normal load
Figure 37: Large scale shear box test for 100gsm polypropylene earthbag no barbwire - 7.1kN
applied normal load
0
0.1
0.2
0.3
0.4
0.5
0.6
0.7
0.8
0.9
1
0 5 10 15 20 25 30
τ f /σ
N(k
N/m
2)
Horizontal Displacement (mm)
2.2kN (1) PP no
barbwire
2.2kN(2) PP no
barbwire
2.2kN (3) PP no
barbwire
0
0.1
0.2
0.3
0.4
0.5
0.6
0 1 2 3 4 5 6 7 8 9
τ f /σ
N(k
N/m
2)
Horizontal Displacement (mm)
7.1kN (1) PP
no barbwire
7.1kN (2) PP
no barbwire
7.1kN (3) PP
no barbwire

Appendices
56
Figure 38: Large scale shear box test for 100gsm polypropylene earthbag no barbwire - 12.0kN
applied normal load
Figure 39: Large scale shear box test for 100gsm polypropylene earthbag no barbwire - 17.0kN
applied normal load
0
0.1
0.2
0.3
0.4
0.5
0.6
0 2 4 6 8 10 12
τ f /σ
N(k
N/m
2)
Horizontal Displacement (mm)
12.0kN (1) PP no barbwire
12.0kN (2) PP no barbwire
12.0kN (3) PP no barbwire
0
0.05
0.1
0.15
0.2
0.25
0.3
0.35
0.4
0.45
0.5
0 2 4 6 8 10 12 14
τ f /σ
N(k
N/m
2)
Horizontal Displacement (mm)
17.0kN (1) PP no barbwire
17.0kN (2) PP no barbwire
17.0kN (3) PP no barbwire

Appendices
57
Figure 40: Large scale shear box test for 100gsm polypropylene earthbag with barbwire - 2.2kN
applied normal load
Figure 41: Large scale shear box test for 100gsm polypropylene earthbag with barbwire - 7.1kN
applied normal load
0
0.2
0.4
0.6
0.8
1
1.2
0 5 10 15 20 25 30 35 40 45 50
τ f /σ
N(k
N/m
2)
Horizontal Displacement (mm)
2.2kN PP
Barbwire
0
0.2
0.4
0.6
0.8
1
1.2
0 5 10 15 20 25 30 35 40
τ f /σ
N(k
N/m
2)
Horizontal Displacement (mm)
7.1kN (1)
PP
Barbwire
7.1kN (2)
PP
Barbwire
7.1kN (3)
PP
Barbwire

Appendices
58
Figure 42: Large scale shear box test for 100gsm polypropylene earthbag with barbwire -
12.0kN applied normal load
Figure 43: Large scale shear box test – hessian earthbags
0
0.2
0.4
0.6
0.8
1
1.2
0 5 10 15 20 25 30 35 40 45
τ f /σ
N(k
N/m
2)
Horizontal Displacement (mm)
12kN (1) PP barbwire
12kN (2-side) PP barbwire
0
0.2
0.4
0.6
0.8
1
1.2
0 5 10 15 20 25 30 35
τ f /σ
N(k
N/m
2)
Horizontal Displacement (mm)
2.2kN
Hessian
7.1kN
Hessian
12.0kN
Hessian

Appendices
59
Appendix D
Figure 44: Change in perimeter over initial perimeter of 70gsm polypropylene earthbag in 8bag
compression test against normalised displacement of loading platen
-0.05
0
0.05
0.1
0.15
0.2
0.25
0.3
0.35
0 0.05 0.1 0.15 0.2
∆L
/L0
x/H0
Theory
rectangular
model
Theory semi-
circular edges
model
Experimental
middle bag
Experimental
edge bag
failure point of bag material

Appendices
60
Appendix E
Figure 45: Single earthbag in hemisphere dome showing contact forces
The normal stress at the interface of a bag can be found from the co-ordinate system given in
Figure 45, as shown by Heyman (1977):
ht � � u81 � cos xy
Where w = density of earthbag material
(0.1)
The corresponding shear resistance is therefore:
�y � htO � � u81 � cos xy . O
(0.2)
The base of the dome is where α = z$; the initial segment length is taken as 450mm regressing to
0 at the top of the dome. The radius of the dome was taken as 3500mm, the earthbag width is
taken as 230mm, coefficient of friction as 0.67 and the density of sand as 17kN/m3.