a mar ket po tential analysis for t he tcaap site in...
TRANSCRIPT

Prepared
RamseSt. Pau Janua
A Mar
d for:
ey Countul, Minn
ry 2013
rket Po
ty nesota
tential Analyssis for tArden
he TCAHills, M
1SM6
AAP SiteMinneso
1221 NicolleSuite 218 Minneapolis,612.338.001
e in ota
t Mall
, MN 554032
3

January 8 Ms. HeatDeputy CSuite 25015 West St. Paul, Dear Ms. AttachedMinnesocommercdifferentand indu The studmarket cdevelopmspace. Rneeded icompetitland use Please co Sincerely MAXFIEL
Matt MuVice Pres Attachm
8, 2013
ther M. WorCounty Mana0 Court HousKellogg BlvdMN 55102
. Worthingto
d is the analyta”. This Phcial/industriat types of owstrial uses in
y addresses onditions; foment potentecommendan the Marketive properticomponent
ontact us if y
y,
LD RESEARCH
ullins sident
ent
rthington, ICager, Ramsese d.
on:
ysis titled, “Ahase I marketal real estatewned housingn the Market
the demogror‐sale houstial for commations are pret Area. A Phies in the mas and recom
you have que
H INC.
1221 N
MA‐CM ey County
A Market Pot analysis exe markets ang, rented hot Area.
raphic and esing; senior hmercial spacerovided for thase II analyarketplace tommend speci
estions or re
(main) 612‐338‐Nicollet Mall, Su
www.ma
tential Analyxamines currnd determinousing, comm
conomic chahousing suppe; and, an asthe various rysis would pro provide anific developm
equire additi
Joe HollmanSenior Anal
‐0012 (fax) 612ite 218, Minneaaxfieldresearch.c
ysis for the Trent conditiones the markmercial uses
aracteristicsply and demssessment oreal estate tyrovide detain indication oment concep
ional inform
n yst
2‐904‐7979 apolis, MN 5540com
TCAAP Site ions in the hoket potentias (retail, offic
s of the Markmand; an anaof the demanypes identifled informaof pricing fopts to optim
mation.
03
n Arden Hillousing and l for developce, and hote
ket Area; renalysis of the nd for industied as beingtion regardior the variouize absorpti
s,
ping el),
ntal
trial g ng s on.

TABLE OF CONTENTS Section Title Page i. EXECUTIVE SUMMARY ................................................................................... 1 Purpose and Scope............................................................................................. 1 Site Analysis ....................................................................................................... 1 Demographic Analysis ........................................................................................ 1 Employment Trends ........................................................................................... 3 Housing Market Analysis .................................................................................... 3 Senior Housing Market Analysis ........................................................................ 4 Retail Market Analysis ....................................................................................... 5 Office Market Analysis ....................................................................................... 5 Hotel Market Analysis ........................................................................................ 6 Industrial Market Analysis ................................................................................. 6 Demand Summary ............................................................................................. 6 ii. PURPOSE AND SCOPE OF STUDY .................................................................... 8 A. SITE LOCATION ANALYSIS ............................................................................... 9 Introduction ....................................................................................................... 9 Regional Location ............................................................................................... 9 Arden Hills Characteristics ................................................................................. 10 Site Location and Characteristics ....................................................................... 14 Access and Visibility ........................................................................................... 16 Proximity to Housing, Employment, and Retail ................................................. 19 Appropriateness of the Subject Site for Redevelopment .................................. 20 B. DEMOGRAPHIC ANALYSIS .............................................................................. 24 Introduction ....................................................................................................... 24 Market Area Definition ...................................................................................... 24 Population and Household Growth Trends ....................................................... 25 Age Distribution ................................................................................................. 28 Household Income ............................................................................................. 30 Household Tenure .............................................................................................. 34 Household Type ................................................................................................. 36 Summary of Demographic Trends ..................................................................... 38 C. EMPLOYMENT TRENDS ................................................................................... 40 Introduction ....................................................................................................... 40 Employment Growth ........................................................................................ 40 Resident Employment ........................................................................................ 42 Covered Employment by Industry ..................................................................... 44 Commuting Patterns of Area Workers .............................................................. 47

TABLE OF CONTENTS (continued)
D. HOUSING MARKET ANALYSIS ......................................................................... 49 Introduction ....................................................................................................... 49 Residential Construction Trends ........................................................................ 49 Overview of Rental Market Conditions ............................................................. 52 Pending Rental Developments ........................................................................... 56 Rental Housing Demand Analysis ...................................................................... 57 Home Sales ......................................................................................................... 61 For‐Sale Housing Market Demand Analysis ....................................................... 67 E. SENIOR HOUSING MARKET ANALYSIS ............................................................. 70 Introduction ....................................................................................................... 70 Senior Housing Defined ..................................................................................... 70 Senior Housing Market Area Definition ............................................................. 72 Older Adult (Age 55+) Population and Household Trends ................................ 73 Older Adult and Senior Household Incomes ...................................................... 75 Homeownership Rate ........................................................................................ 78 Home Sale Values .............................................................................................. 79 Supply of Senior Housing in the Market Area.................................................... 80 Pending Senior Housing Developments in the Market Area ............................. 82 Market Rate Adult/Few Services Senior Housing Demand ............................... 83 Demand for Congregate Senior Housing ........................................................... 85 Assisted Living Demand Estimate ...................................................................... 87 Demand for Memory Care Senior Housing ........................................................ 90 Senior Housing Demand Summary .................................................................... 92 F. RETAIL MARKET ANALYSIS .............................................................................. 93 Introduction ....................................................................................................... 93 Consumer Expenditure Patterns ........................................................................ 93 Retail Demand Potential and Leakage ............................................................... 96 Types of Retail Goods and Customer Shopping Patterns .................................. 98 Twin Cities Retail Market Conditions ................................................................. 99 Retail Development Potential ............................................................................ 102 G. OFFICE MARKET ANALYSIS ............................................................................. 104 Introduction ....................................................................................................... 104 Twin Cities Office Market Conditions ................................................................ 104 Business Growth by Type of Business ................................................................ 106 Growth of Office‐Using Jobs .............................................................................. 109 Office Development Potential ........................................................................... 110 Corporate Campus ............................................................................................. 112
TABLE OF CONTENTS (continued)
H. HOTEL MARKET ANALYSIS .............................................................................. 114 Introduction ....................................................................................................... 114 Regional Conditions ........................................................................................... 114 Regional Attractions ........................................................................................... 116 Metro Area Visitor Profile .................................................................................. 118 Hotel Demand .................................................................................................... 119 I. INDUSTRIAL MARKET ANALYSIS ..................................................................... 121 Introduction ....................................................................................................... 121 Multi‐Tenant Industrial Market Conditions ....................................................... 121 Business Growth by Type of Business ................................................................ 126 Growth of Industrial‐Type Jobs .......................................................................... 131 Industrial Demand Estimates ............................................................................. 132 J. CONCLUSIONS & RECOMMENDATIONS .......................................................... 134 Introduction ....................................................................................................... 134 Residential Demand ........................................................................................... 134 Commercial/Industrial Demand ........................................................................ 137 Final Conclusions ................................................................................................ 139

LIST OF TABLES Table Number and Title Page A‐1 Traffic Volume Trends, TCAAP Site Area ................................................................... 16 B‐1 Population Growth Trends and Projections, TCAAP Site Market Area ..................... 26 B‐2 Household Growth Trends and Projections, TCAAP Site Market Area ...................... 27 B‐3 Age Distribution, TCAAP Site Market Area ................................................................ 30 B‐4 Household Income by Age of Householder, Primary Market Area ........................... 32 B‐5 Household Income by Age of Householder, Secondary Market Area ....................... 33 B‐6 Tenure by Age of Householder, TCAAP Site Market Area ......................................... 35 B‐7 Household Type, TCAAP Site Market Area ................................................................ 38 C‐1 Employment Growth Trends and Projections, TCAAP Site Market Area .................. 41 C‐2 Local Area Unemployment Statistics, TCAAP Site Market Area ................................ 43 C‐3 Quarterly Census of Employment and Wages, TCAAP Site Market Area .................. 45 C‐4 Commuting Patterns .................................................................................................. 47 C‐5 Commuting Inflow/Outflow Characteristics .............................................................. 48 D‐1 Residential Building Permit Trends, 2000 – 2011 ...................................................... 49 D‐2 Residential Units Permitted by City, TCAAP Site Primary Market Area .................... 51 D‐3 Average Rents/Vacancies Trends, TCAAP Site Market Area ...................................... 55 D‐4 Pending Market Rate Rental Developments, TCAAP Site Primary Market Area ....... 56 D‐5 Projected Demand for Market Rate Rental Housing, TCAAP Site Market Area ........ 59 D‐6 Residential Sale Transactions, TCAAP Site Market Area ............................................ 62 D‐7 Single‐Family Detached Residential Sales, TCAAP Site Market Area ......................... 63 D‐8 Multifamily Residential Sales, TCAAP Site Market Area ............................................ 64 D‐9 For‐Sale Housing Demand, TCAAP Site Market Area ................................................. 69 E‐1 Older Adult (55+) Population and Household Age Distribution ................................ 74 E‐2 Older Adult (55+) Income Distribution ...................................................................... 77 E‐3 Older Adult Household Tenure .................................................................................. 79 E‐4 Sale Trends of Single‐Family Homes .......................................................................... 80 E‐5 Market Rate Senior Housing Properties .................................................................... 81 E‐6 Market Rate Adult/Few Services Housing Demand ................................................... 84 E‐7 Congregate Living Demand ........................................................................................ 86 E‐8 Market Rate Assisted Living Demand ........................................................................ 88 E‐9 Memory Care Demand ............................................................................................... 91 E‐10 Senior Housing Demand Summary ............................................................................ 92 F‐1 Household Expenditures by Selected Product Type, TCAAP Site PMA ..................... 94 F‐2 Retail Demand Potential and Leakage, TCAAP Site PMA .......................................... 97 F‐3 Retail Vacancy and Absorption, Twin Cities, 2011 – 2012 ......................................... 100 F‐4 Demand for Retail Space, TCAAP Site PMA ............................................................... 103 G‐1 Office Vacancy and Absorption, Twin Cities, 2011 – 2012 ........................................ 105 G‐2 Businesses by Industry and Size of Business, Arden Hills .......................................... 107 G‐3 Employment Growth Trends and Projections, TCAAP Site PMA ............................... 110 G‐4 Projected Demand for Office Space, TCAAP Site PMA .............................................. 111
LIST OF TABLES (continued)
H‐1 Lodging Industry Performance, Year‐Over‐Year Percent Change ............................. 114 H‐2 Most Popular Tourist Attractions in Minnesota, 2010 Attendance .......................... 117 I‐1 Industrial Space Vacancy and Absorption, Twin Cities, 2011 – 2012 ........................ 123 I‐2 Industrial Space Vacancy and Absorption by Property Type ..................................... 125 I‐3 Industrial Businesses by Industry and Size of Business, Arden Hills .......................... 129 I‐4 Employment Growth Trends and Projections, TCAAP Site PMA ............................... 132 I‐5 Projected Demand for Industrial Space, TCAAP Site PMA ........................................ 133 J‐1 Housing Demand Summary, TCAAP Site Market Area .............................................. 134 J‐2 Commercial/Industrial Demand Summary, TCAAP Site Market Area ....................... 137

EXECUTIVE SUMMARY
MAXFIELD RESEARCH INC. 1
Purpose and Scope of Study
Maxfield Research Inc. was engaged by Ramsey County (the “Client”) to conduct an analysis of the market potential to develop various uses on a portion of the property generally re‐ferred to as the Twin Cities Army Ammunition Plant (TCAAP) Site in Arden Hills, Minnesota. Uses evaluated include housing, commercial, and industrial.
The scope of this study includes: a site evaluation; an analysis of the demographic and economic characteristics of the Market Area; a review of rental market conditions in the area; a review of the for‐sale housing market; a senior housing supply and demand analysis; an analysis of the development potential for commercial uses (retail, office, and hotel); and an assessment of the demand for industrial space.
Site Analysis
The Site location within the Metro Area can be reached within a 30 minute drive time from much of the Metro Area, and both Downtown Minneapolis and Downtown St. Paul can be reached within a 15‐minute drive. The subject property has several other positive attrib‐utes that make it an attractive location for redevelopment. The property is one of the larg‐est tracts of undeveloped land near the Metro core and has convenient access to I‐35W and interstate highway network. It is situated along a major north‐south commuter route with heavy traffic volumes on I‐35W and the surrounding road network. Solid household growth is projected in the market area and there are several large employment centers located nearby. Additionally, the property contains many natural amenities and features.
Some environmental remediation will be required which could negatively impact the marketability of the Site as a location for residential development. In addition, some exist‐ing infrastructure (monitoring wells, pump station) will need to remain in place or be relo‐cated on the Site which could hinder the overall design and layout of development on the property.
Demographic Analysis
Maxfield Research determines the Market Area for housing, retail, office, hospitality, and industrial space based on geographic and man‐made boundaries, commuting patterns, community orientation, places of employment, and our knowledge of the area. Considering these factors, we determined a Primary Market Area (PMA) for the Twin Cities Army Am‐munition Plant (TCAAP) Site in Arden Hills consisting of the following communities: Arden Hills, Blaine, Centerville, Circle Pines, Columbia Heights, Columbus, Falcon Heights, Fridley, Ham Lake, Hilltop, Lauderdale, Lexington, Lino Lakes, Little Canada, Mounds View, New Brighton, North Oaks, Roseville, Shoreview, Spring Lake Park, St. Anthony, and Vadnais

EXECUTIV
MAXFIELD
HeighArea reloc
As of2010gestinhas dsons declinThe Cmode
By 20(+7.1Blainof agdensideveportio
VE SUMMA
D RESEARCH IN
hts. The rem(SMA), wheate from.
f 2010, the P, the populang a trend todecreased stper househone of ‐6.1% fCity of Ardenestly, from 3
020, the PMA%). The maje and Lino Ling areas in ity residentiloped cities.on of this gr
RY
C.
mainder of Are a portion
Prima
PMA containation increaso shrinking headily over told. This numfrom 1990 ton Hills was an3.17 in 1990
A is projectejority of theLakes where established al uses will g In additionrowth.
Anoka County of the pote
ary and Seco
ed 305,567 sed +5.8% whousehold sithe years. Inmber declineo 2010. Thisn exception,to 3.23 in 20
ed to add an population there is mocommunitiegenerate somn, the TCAAP
y and Ramsential deman
ondary Mark
people and hile the numizes. Withinn 1990, the aed to 2.59 ins trend is an, as the num010.
other 21,135and househre land availes like Rosevme househoP Site in Arde
ey County cond not curren
ket Area Ma
120,199 houmber of housn the PMA, thaverage houn 2000 and 2n indication omber of perso
5 people (+6hold growth lable for devville and Newold and popuen Hills will l
omprise a Sently in the P
ap
useholds. Beseholds grewhe average husehold size 2.54 in 2010,of an aging hons per hous
6.9%) and 8,is expected velopment. w Brighton inulation growikely captur
econdary MaMA would li
etween 2000w by +7.6%, household swas 2.71 pe, representinhousehold bsehold incre
515 househto occur in Redevelopmnto higher‐
wth in these fre a substant
2
arket ikely
0 and sug‐ize er‐ng a ase. eased
olds
ment
fully‐tial
EXECUTIVE SUMMARY
MAXFIELD RESEARCH INC. 3
The greatest growth is predicted to occur among the older adults in the Market Area. Aging of baby boomers will generate growth in all cohorts age 55 or greater over the next five years, particularly the 65 to 74 age group, suggesting that there will be a growing oppor‐tunity for retail goods and services catering to these age groups.
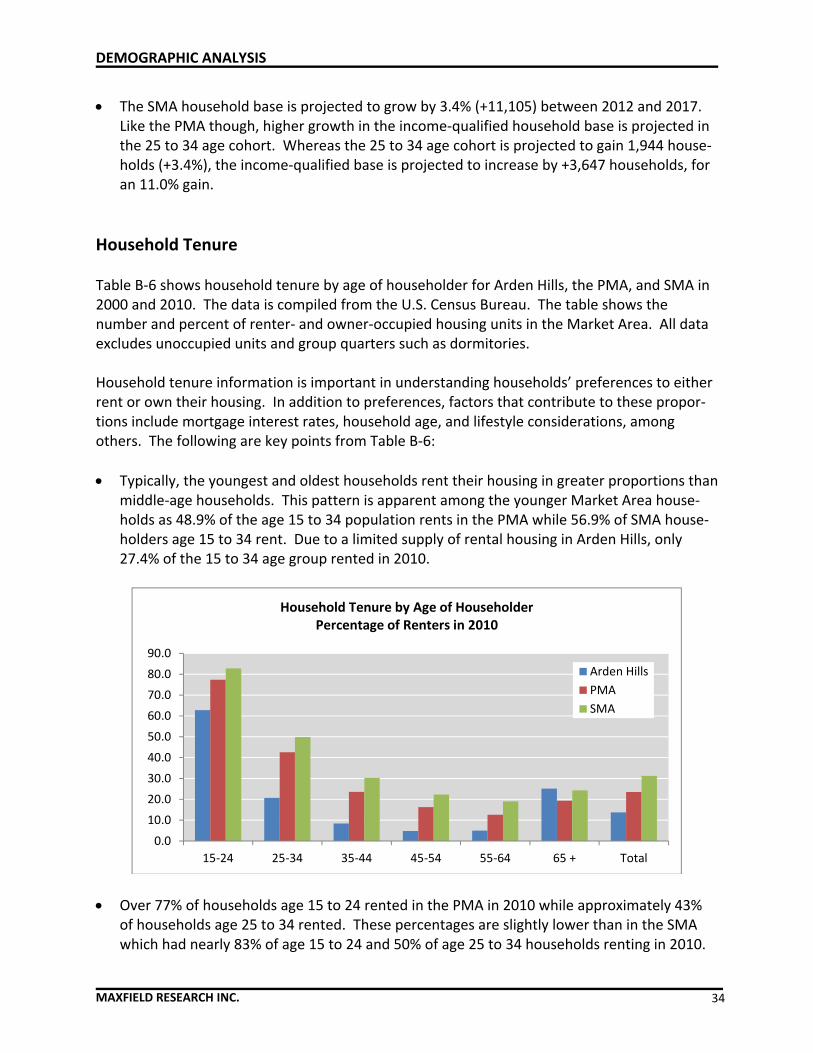
In the PMA, 24% of all households rented in 2010, giving it a rental rate that was slightly lower than the SMA (31% of households rented in 2010) and the Metro Area (30% rented). The percentage of PMA renter households increased for all age cohorts between 2000 and 2010 as the total number of renter households residing in the PMA grew approximately 13% during the decade. The number of owner‐occupied households grew roughly 6%. In the PMA, the 45 to 54 and 55 to 64 age cohorts experienced the largest increase in the number of renters. These increases were due, in large part, to the bursting of the housing bubble which pushed many occupants out of home ownership and into rental units.
Employment Trends
In light of the economic recession, between 2000 and 2010, employment declined by ‐8,182 jobs in the PMA. Arden Hills experienced a slight gain in employment during the decade, adding 76 jobs. Between 2010 and the second quarter of 2012, the PMA has gained over 5,500 jobs. Much of the job growth occurred in the Professional and Business Services sec‐tor and the Trade, Transportation, and Utilities industry sector.
Solid job growth is expected in the Market Area between 2010 and 2020. The PMA is projected to experience a 13.9% gain during the decade while SMA employment is expected to increase by 10.1%. Employment in the Twin Cities Metro Area is projected to expand by 12.0%. The PMA is expected to outperform the surrounding areas during the decade as jobs lost during the past decade are replaced and employers become increasingly attracted to the large existing labor pool and convenient access to the major transportation corridors located in the area.
Arden Hills is a strong importer of workers as a significantly higher number of nonresidents commute into the City for work. Over 14,600 workers come into Arden Hills for employ‐ment while nearly 3,600 leave. Arden Hills experiences Net Job Inflow of 11,069.
Housing Market Analysis
The total number of residential units permitted declined steadily from 2005 to 2009 after reaching a peak of 2,469 units in the PMA in 2004. Detached single‐family homes have been the most common housing type developed in the PMA since 2000, representing 51.4% of all units permitted. Multifamily units represented 27.7% of all residential construction activity while townhomes represented 20.9% of all units permitted.

EXECUTIVE SUMMARY
MAXFIELD RESEARCH INC. 4
The equilibrium vacancy rate for rental housing is considered to be 5.0%. This allows for normal turnover and an adequate supply of alternatives for prospective renters. During the 3rd Quarter 2012, the vacancy rate was 2.7% in the Twin Cities Metro Area. The Arden Hills/Shoreview submarket had a vacancy rate of 3.2% while the other PMA communities had a vacancy rate of 2.5%. In effect, the overall supply of rental housing in the Market Ar‐ea is below the adequate level to meet demand.
We estimate that a general occupancy market rate rental development on the subject property could capture approximately 10% and 15% of the total demand in the Market Ar‐ea. We anticipate that the subject property could support approximately 423 to 634 units of new market rate general occupancy rental housing between 2012 and 2017.
The 2012 median sale price across the PMA was $175,686, higher than Anoka County ($152,000), Ramsey County ($141,100), and the Twin Cities ($167,900). Between 2007 and November 2012, the median price declined ‐24.5% in the PMA, compared to a ‐28.3% de‐cline in Anoka County, ‐32.5% in Ramsey County, and ‐25.4% in the Twin Cities. It appears that pricing for single‐family detached homes is recovering, as the 2012 median sales price is higher than the 2011 median in nearly every community comprising the PMA, although prices are still down significantly from 2007. Multifamily housing has not experienced the pricing recovery that is occurring in the single‐family market as prices in several communi‐ties continued to decline in 2012.
Due to the Site’s desirability as a residential location, we estimate that the subject property could capture roughly 15% to 20% of the PMA demand and 10% of the demand from the SMA, equating to a total of 271 to 350 single‐family units and 116 to 150 multifamily units supportable on the Site between 2012 and 2017.
Senior Housing Market Analysis
A growing older adult and senior population should maintain long‐term demand for senior housing alternatives in the PMA, although pending growth in the supply of senior housing in the PMA will limit demand growth between 2012 and 2017.
There appears to be pent‐up demand for 422 active adult rental units in the PMA. Based on a capture rate of 15% to 20%, we estimate that the subject property could support between 63 and 84 active adult rental units in 2012, increasing to a range of 66 to 88 active adult rental units in 2017. Due, in large part, to the large supply of active adult ownership units in the PMA, we found little demand for new active adult ownership housing.
There is currently demand to support an additional 32 to 42 congregate and 47 to 63 assisted living units on the Site in 2012, with little change in demand expected by 2017. We

EXECUTIVE SUMMARY
MAXFIELD RESEARCH INC. 5
also find demand for 47 to 62 memory care units. By 2017, memory care demand is ex‐pected to grow to between 52 and 69 units.
Retail Market Analysis
Because of the relatively large size of the PMA and the Site’s location within the PMA along I‐35W and Highway 10, we estimate that the subject property could capture roughly 15% to 20% of the growth in retail demand, resulting in demand from PMA households for approx‐imately 195,000 to 259,000 square feet of retail space between 2012 and 2020.
Total leakage of retail expenditures (including food and drink) from the PMA was estimated to be at 14%, indicating a substantial loss of potential retail sales. The subject property will likely attract stores in the retail categories where there is existing leakage. By dollar vol‐ume, retail leakage was greatest in Automobile Dealers, Grocery Stores, Food Services and Drinking Places, and General Merchandise Stores. Retail businesses with the greatest po‐tential are community/neighborhood‐oriented retailers serving the local population, such as grocery, full‐service restaurants, and health and personal care stores. Because many big box retailers are already located in the trade area, the potential to draw a big box store to the Site unless there is limited competition may be difficult.
While exhibiting signs of improvement, the local retail market has not yet fully‐recovered from the recession. As such, the demand for retail on the Site will not likely be realized until the second half of the decade.
Office Market Analysis
We estimate that the subject property could capture roughly 10% to 15% of the growth in total office demand based on its location in the PMA and the characteristics of the sur‐rounding area, resulting in demand for between 138,000 square feet and 207,000 square feet of office space between 2012 and 2020.
Because of the relatively high office vacancy rate in the submarket surrounding the TCAAP Site, we do not anticipate much demand for new office development in the short‐term. Sustained job growth in the Market Area will be needed to generate the demand necessary to absorb the existing vacancy in the market. We expect that market conditions will sup‐port a new office development on the Site during the second half of the decade.
The most likely target markets for office space on the Site would be businesses in the industry sectors that are projected to grow and have an existing presence in the Market Ar‐ea. The PMA has a large employment base in the Professional and Business Services sector as well as the Education and Health Services industry, both of which are expected to experi‐

EXECUTIVE SUMMARY
MAXFIELD RESEARCH INC. 6
ence substantial growth by 2020. In addition to traditional multi‐tenant office space, the Site would also likely be an attractive location for a corporate campus as well as less‐traditional office users such as governmental agencies and medical services.
Hotel Market Analysis
According to published data, the Minneapolis‐St. Paul Metro Area has experienced flat occupancies over the past year (58.2%), but experienced growth in average daily rates (ADR) and in revenue per available room. Generally, a 65% occupancy rate is considered the equilibrium for a hotel to be profitable.
Due to the Site’s close proximity to several major employers and employment centers, as well as the National Sports Center in Blaine, the subject property would likely be a suitable location for a hotel. The development of additional retail and entertainment uses on the Site would increase the attractiveness of the Site to a hotel operator. There appears to be a market from leisure travelers, but the ability to support a hotel on the site is going to be dependent on the ability to attract weekday business which will come from developing of‐fice and industrial uses that will have business travelers requiring overnight hotel space. Also, there are several large employers in the surrounding area, such as Medtronic, Land O’Lakes, and Deluxe, which will likely generate demand for overnight hotel stays from busi‐ness travelers.
Industrial Market Analysis
Due to the Site’s access to Highway 10 and I‐35W and the central location of the property within the Northeast industrial submarket, we project that the TCAAP Site could capture approximately 400,000 to 445,000 square feet of industrial space on the property.
Bulk Warehouse properties with 32‐foot clear height ceilings appear to be in highest de‐mand currently and forecasted job growth in the Transportation and Warehousing subsec‐tor will continue to support demand for this product type. Functionally well‐designed Office Warehouse facilities that have 24‐foot or higher clear height ceilings, are energy efficient, have ample parking and good lighting are also in demand.
Demand Summary
The table on the following page illustrates the level of demand by property type capturable on the TCAAP Site along with an estimate of the amount of land required to support the projected demand.

EXECUTIVE SUMMARY
MAXFIELD RESEARCH INC. 7
General‐Occupancy Housing Units
Market Rate Rental 20.0 ‐ 30.0 21 ‐ 32
For‐Sale Housing 190 ‐ 225
Single‐Family, Detached 1.7 ‐ 2.0 175 ‐ 206
Multifamily 8.0 ‐ 10.0 15 ‐ 19
Total General Occupancy Housing 211 ‐ 256
Market Rate Senior Housing Units
Senior Housing Total 193 ‐ 256 204 ‐ 272 20.0 ‐ 30.0 9 ‐ 14
Commercial/Industrial Square Feet
Retail ‐ 0.25 ‐ 0.20 24 ‐ 30
Office ‐ 0.40 ‐ 0.35 12 ‐ 14
Industrial ‐ 0.35 ‐ 0.20 29 ‐ 51
Commercial/Industrial Total ‐ 65 ‐ 94
Total Acres Required 285 ‐ 364
Source: Maxfield Research Inc.
404,400 444,840
737,033 911,364
2012 ‐ 2020 FAR Acres
194,555 259,407
138,078 207,117
150
1,134
2012 2017 Units/Acre Acres
2012 ‐ 2017 Units/Acre Acres
634
500
350
SUMMARY OF DEMAND
TCAAP SITE MARKET AREA
December 2012
Demand Capturable
on Site
Maximum Land Area
Requirements

PURPOSE AND SCOPE
MAXFIELD RESEARCH INC. 8
Study Purpose Maxfield Research Inc. was engaged by Ramsey County (the “Client”) to conduct an analysis of the market potential to develop various uses on a portion of the property generally referred to as the Twin Cities Army Ammunition Plant (TCAAP) Site in Arden Hills, Minnesota. Uses evalu‐ated include housing, commercial, and industrial. It is our understanding that the Client executed an offer to purchase with the United States General Services Administration for approximately 427 acres of the TCAAP property. The Ramsey County Board has also entered into an agreement with Carl Bolander and Sons Co. for hazardous material abatement, demolition and site remediation of the 427‐acre site.
Scope of Services The scope of this study includes: a site evaluation; an analysis of the demographic and econom‐ic characteristics of the Market Area; a review of rental market conditions in the area; a review of the for‐sale housing market; a senior housing supply and demand analysis; an analysis of the development potential for commercial uses (retail, office, and hotel); and an assessment of the demand for industrial space. This report includes both primary and secondary research. Primary research includes inter‐views with local officials and real estate professionals. Secondary research is credited to the source when used, and is usually data from the U.S. Census, the Minnesota Department of Employment and Economic Development, or regional planning agencies. Secondary research is always used as a basis for analysis, and is carefully reviewed in light of other factors that may impact projections such as residential building permit data or migration trends. All of the information on pending developments was gathered by Maxfield Research Inc. and is accurate to the best of our knowledge.

SITE LOC
MAXFIELD
Introdu This sectpropertythe propsubject pFinally, th
Regiona Arden HiencompaHills is sitpopulouspopulatiocounty co
CATION ANA
D RESEARCH IN
uction
ion of the rey in Arden Hierty’s generproperty andhis section d
al Location
lls is a commasses 13 coutuated in thes county in Mon of 508,64ore of the M
ALYSIS
C.
eport presenlls, Minnesoral characterd the Site’s pdiscusses the
n
munity of 9,5unties and ine northern MMinnesota, b40 people. TMetro Area.
nts an analysota discussinristics. Adjacproximity to e appropriat
552 people lcludes abouMetro in Rambehind HennThe map beloNon‐urbaniz
Regio
sis of the locg the regioncent land usemploymeneness of the
ocated in thut 3.0 millionmsey Countynepin Countyow shows thzed portions
Map 1
onal Locatio
cation and chnal location, es, accessibnt, shopping e Site for red
he Twin Citien people as oy. Ramsey Cy. As of 201he Site’s locas of the regio
on
haracteristicthe City of Aility to and vand servicedevelopmen
es Metropoliof the 2010 CCounty is the10, Ramsey Cation within on are shade
cs of the subArden Hills, avisibility of ths are present.
tan Area, wCensus. Arde second moCounty had athe seven‐ed green.
9
bject and he nted.
hich den st a
SITE ANALYSIS
MAXFIELD RESEARCH INC. 10
The map shows that the Site is located in an area designated as “Developed” by the Metropoli‐tan Council, the regional planning agency serving the Twin Cities seven‐county metropolitan area. With the exception of North Oaks, to the east of Arden Hills, all communities in Ramsey County area considered to be developed by the Metropolitan Council. Much of the area to the north of Arden Hills in Anoka County is designated as either a developing area, diversified rural, or rural residential. Developing communities focus on accommodating growth, supporting centers along corridors, encouraging connected land use patterns for new development and encouraging the develop‐ment of communities where shopping, jobs and a variety of housing choices coexist. The rural residential designation is used for areas that have large numbers of individual sewage treat‐ment systems at densities of 2.5 acres or less. Diversified rural communities are comprised of a variety of farm and non‐farm land uses that mix large‐lot residential and clustered housing with agriculture. Developed communities are focused on maintaining or improving current infra‐structure; and, renewing or improving land and buildings to provide for additional growth, particularly along transit corridors, in a manner supporting development that integrates land uses. The subject Site is unique within the developed area as it has been held out of availability because of its ownership by the United States government. The strong market dynamics of the Primary Market Area should encourage this area to fill out due to its key location and the lack of available sites elsewhere in the Primary Market Area.
Arden Hills Characteristics The City of Arden Hills covers approximately 9.6 square miles in northern Ramsey County. Interstate Highway 35W and the City of New Brighton (pop. 21,456) form most of the western border of Arden Hills. The City of Shoreview (pop. 25,043) is located north and east of Arden Hills and the City of Roseville (pop. 33,660) forms the southern border. The City of Mounds View (pop. 12,155) is adjacent to the northwestern portion of Arden Hills, directly west of I‐35W from the subject property. Arden Hills experienced rapid growth between 1970 and 1990, adding approximately 941 households between 1970 and 1980 and another 620 households between 1980 and 1990. The 1990s were a period of slower growth for Arden Hills, adding 55 households during the decade (+1.9%), an average of 5.5 per year. The number of households remained essentially un‐changed during the 2000s. In comparison, the Twin Cities Metro Area household base expand‐ed 16.6% between 1990 and 2000 which was followed by 9.4% growth between 2000 and 2010. Excluding open water, Arden Hill’s land area is approximately 71% developed and 29% unde‐veloped (1,587 acres) according to existing land use information from the Metropolitan Council. The undeveloped land is concentrated in the TCAAP property.

SITE ANALYSIS
MAXFIELD RESEARCH INC. 11
Map 2 shows existing land uses in Arden Hills and Map 3 illustrates the 2030 projected land use as identified in the Arden Hills Comprehensive Plan. These maps show that Arden Hills’ land uses include a diverse mix of residential, commercial and industrial uses. The TCAAP Site is currently designated as mixed use industrial and undeveloped. Surrounding land to the south across County Road 96 is a mix of institutional, undeveloped and single‐family residential uses. The area to the west across Highway 10 is a manufactured home park and across I‐35W in Mounds View is a mix of industrial and residential (including single‐family along with a manufactured home park). Properties to the north of the TCAAP Site are generally single‐family residential. The area east of the subject property is undeveloped land on the larger TCAAP property and single‐family residential east of Lexington Avenue in Shoreview. Roughly 24% of Arden Hills’ land area is developed for residential uses, 19% is developed for industrial or mixed‐used industrial uses, 7% is institutional, and 5% is developed for commercial uses. As mentioned previously, approximately 29% of the land area in Arden Hills is undevel‐oped, the largest proportion in the City. Of the 3,941 developed acres, single‐family detached residential comprised the greatest pro‐portion of land use in 2010 at 30%. Mixed use industrial represented nearly 23% of the devel‐oped land area. Park, recreational or preserve land represented 14% of the City’s 2010 land area while institutional represented 9% of the total. Industrial/utility and office uses each comprised just over 4% of the developed land area. Multifamily represented nearly 3% of the developed land area while retail and other commercial uses totaled 2%. Major roadways comprised nearly 10% of the developed land area. The 2030 land use plan indicates that the undeveloped portion of the TCAAP property is desig‐nated as park and recreation land which would total nearly 34% of Arden Hills land area. Much of the subject property is designated for multifamily residential and multi‐optional develop‐ment. According to the Metropolitan Council, the multiple use designation was changed to “Multi‐Optional Development” to help avoid confusion with the generalized land use category “Mixed Use”. The definition of the category essentially remains the same ‐ describing an area marked for development that could be developed into one of many possible land uses. By 2030, the amount of land dedicated for single‐family and multifamily residential develop‐ment will be 21% for single‐family and 7% for multifamily. Multi‐optional development is anticipated to make up 13% of the total land area in Arden Hills.

SITE ANA
MAXFIELD
ALYSIS
D RESEARCH INC.
Cityy of Arden HMap 2
Hills Existing Conditions
12

SITE ANA
MAXFIELD
ALYSIS
D RESEARCH INC.
City of Arden Hills FutuMap 3
ure Land Use
e Guide Map, 2030
13

SITE ANA
MAXFIELD
Site Loc The TCAAboundaryCounty Rsouth. ACounty aand Coun
ALYSIS
D RESEARCH IN
cation and
AP Site is locy descriptionRoad I on theAs illustratedre located innty Road 96.
C.
Character
cated just eans for the ene north, I‐35 on the follon the wester.
ristics
ast of I‐35W ntire TCAAP W and Highwowing aerial rn half of the
Ae
and Highwaproperty incway 10 on thmap, the 42e TCAAP pro
Map 4 erial View
ay 10 in Ardeclude Lexinghe west, and27 acres to boperty, adjac
en Hills, Mington Avenued County Robe purchasedcent to I‐35W
nesota. Gen on the east
oad 96 on thed by RamseyW, Highway
14
neral t, e y 10,

SITE ANA
MAXFIELD
Map 5 shlocated wMounds Blaine, n
ALYSIS
D RESEARCH IN
hows Arden within a five‐View, Fridleorthern Ros
C.
Hills and the‐mile radius y, Spring Lakeville, and s
e Site’s positof several cke Park, St. Aouthwestern
TCAA
tioning in theommunitiesAnthony, Con Lino Lakes
Map 5 AP Site Area
e northern Ms, including; olumbia Heigs.
a
Metro. The New Brightoghts, the sou
property is on, Shorevieuthern half o
15
ew, of

SITE ANALYSIS
MAXFIELD RESEARCH INC. 16
Access and Visibility Excellent access and visibility are vital to the success of commercial business establishments while industrial businesses rely on efficient access to transportation and shipping corridors. Currently, access to the Site can be obtained from Highway 10 or via the County Road H exit off I‐35W from the north. County Road H does not currently have an exit off I‐35W for northbound traffic. Table A‐1 displays the 2000 and 2011 estimated traffic volumes (measured in annual average daily trips) and the 2030 projected traffic volumes for adjacent roads surrounding the Site. The table also presents estimated heavy commercial average daily traffic for 2011.
Traffic near the intersection of I‐35W and Highway 10 declined between 2000 and 2011, with AADT dropping by ‐13,000 (‐10.8%) to 107,000. This drop was likely due in large part to road construction rerouting traffic in the area. Highway 10 experienced 13.3% more traffic (+5,500 AADT) and traffic along County Road 96 increased 19.4% (+3,400). County Road I experienced modest growth in traffic, as AADT increased 2.9% to 7,000. Significant growth in AADT is expected to occur over the next 20 years. I‐35W is projected to receive an AADT increase of nearly 35% while County Road 10 is expected to experience a 27% increase in AADT. Traffic along County Road 96 and County Road I is also projected to increase, growing +12.4% and +22.9%, respectively. During the summer of 2013, County Road 96 will be reconstructed to pass beneath Highway 10 and the existing traffic signal will be removed. In addition, the section of Highway 10 between I‐694 and I‐35W is planned to be resurfaced during 2013. These projects will improve traffic flow and safety on the road network surrounding the TCAAP Site.
HCADT
Estimate Estimate Projected Estimate
2000 2011 2030* 2011 No. Pct. No. Pct.
I‐35W 120,000 107,000 144,000 6,000 ‐13,000 ‐10.8% 37,000 34.6%
Highway 10 41,500 47,000 59,900 1,650 5,500 13.3% 12,900 27.4%
County Rd 96 17,500 20,900 23,500 NA 3,400 19.4% 2,600 12.4%
County Rd I 6,800 7,000 8,600 NA 200 2.9% 1,600 22.9%
AADT = Annual Average Daily Traffic
HCADT = Heavy Commercial Average Daily Traffic
* As projected in the City of Arden Hi l l s 2030 Comprehens ive Plan
Sources: MnDOT; City of Arden Hills; Maxfield Research Inc.
TABLE A‐1
Change, 2011 ‐ 2030
TRAFFIC VOLUME TRENDS
TCAAP SITE AREA
2000, 2011, & 2030
Annual Average Daily Traffic (AADT)
Change, 2000 ‐ 2011
Annual Average Daily Traffic (AADT)

SITE ANA
MAXFIELD
Map 6 illdraw areploymencommuteDowntowthe Site cdrive timMichael tthe east.ban com
ALYSIS
D RESEARCH IN
ustrates drivea for variout centers as e distance wwn Minneapcan be reachme reaches asto the north However, dmunities in t
C.
ve times froms services onpotential ho
when decidinolis and Dowhed within a s far as Northwest, Lakevduring peak the south an
m the propen the Site. Itome buyers ng to purchawntown St. P30 minute dth Branch in ville and Eagatravel timesnd west met
TCAAP
erty. This inft is also usefare likely tose or rent a Paul can be drive from mChisago Couan to the sos (such as rustro area wou
Map 6 Site Drive T
formation isful to determo give strong home. As sreached witmuch of the Munty to the nuth, and mosh hour), could be much
ime
s helpful in dmine access consideratihown on thethin a 15‐minMetro Area.north, Albertost of Washimmute timemore than 3
determining to major emon to their e map, bothnute drive a. The 30 mintville and Stngton Countes to the sub30 minutes.
17
a m‐
nd nute . ty to bur‐

SITE ANA
MAXFIELD
Map 7 illroundingwestern down to As such, the higheshould cramenity
ALYSIS
D RESEARCH IN
ustrates theg area. As shside of the S900 feet nea
the Site shoer elevationsreate a broato potential
C.
e United Stathown, the SitSite to over 1ar Lexington
uld have goos near the ead viewshed residential
tes Geologicte elevation1,000 feet nn Avenue.
od visibility fastern edge of the surrouses.
To
al Survey to changes froear the midd
from the surof the porti
ounding area
Map 7 opography
pographic mom approximdle of the TC
rrounding roon being pua which wou
map for the Smately 900 feCAAP proper
oad networkrchased by
uld likely be a
Site and sur‐eet along thrty, then bac
k. AdditionaRamsey Couan attractive
18
‐e ck
ally, unty e

SITE ANA
MAXFIELD
Proximi Redeveloretail nodindustrianoted onwithin anretail spations in Bretail spaRosedaleon the mfoot Rivecustome
ALYSIS
D RESEARCH IN
ity to Hous
opment possdes. The subl uses and isn the followin approximaace in the coBlaine and Roace within the Center, Nomap, the City erdale Villagers and tenan
C.
sing, Empl
sibilities are bject propers near majorng map, thetely five‐milommunities loseville. Hohree miles ofrthtown Maof Coon Rape located nents away fro
Major
oyment, a
partly influerty is surrounr employmenre are severe radius of tlocated withowever, therf the Site. Tall, The Villagpids has a laear the intersm some of t
r Retail ConcDece
and Retail
enced by pronded by a mnt concentraral large conthe Site. Thehin five milese are only sihe largest shge of Blaine, rge retail prsection of Hthe older cen
Map 8 centrations ember 2012
oximity to homix of residenations and ncentrations ere is nearlys of the Site,ix centers anhopping cen and Har Maresence, partighway 10 anters in the
Near the Sit2
ousing, empntial, commeodes of retaof retail sery 8.0 million , with the hind 408,000 snters in the aar Mall. Whticularly thend Highwayarea like No
te
ployment andercial, and ail activity. Avices locatedsquare feet ghest concesquare feet oarea include hile not show 950,000‐sqy 242, which orthtown Ma
19
d
As d of
entra‐of
wn uare pulls all.

SITE ANALYSIS
MAXFIELD RESEARCH INC. 20
Large employment centers in the neighboring area can be found at established busi‐ness/industrial parks surrounding the Site. Arden Hills and the surrounding communities are home to several large employers, including: Medtronic, Boston Scientific, Land O’Lakes, Smiths Medical, Presbyterian Homes and Services, Deluxe Corporation, Cummins Power Generation, Wells Fargo, and FICO. Additionally, the Site is approximately a 15‐mile drive to both Down‐town Minneapolis and Downtown St. Paul. Highway visibility and access will be key drivers of demand for commercial or industrial uses on the subject property. There are also several colleges and universities, such as Bethel College, Northwestern College, and United Theological Seminary in relatively close proximity to the Site which will make it an attractive location for a rental housing development marketed to the younger age groups.
Appropriateness of the Subject Site for Redevelopment The following summarizes some of positive and negative attributes of the Site in regards to potential redevelopment.
Site Strengths Site Limitations
The property has convenient access to I‐35W and the interstate highway net‐work.
It is one of the largest tracts of unde‐veloped land near the Metro core.
The Site is situated along a major north‐south commuter route with heavy traffic volumes on I‐35W and the surrounding road network.
Solid household growth is projected in the market area.
Several large employment centers are located in the neighboring area.
The property contains many natural amenities and features.
Some environmental remediation will be required which could negatively im‐pact the marketability of the Site as a location for residential development.
There is some existing infrastructure (monitoring wells, pump station) that will need to remain in place or be relo‐cated on the Site which could hinder the overall design and layout of devel‐opment on the property.

SITE ANA
MAXFIELD
Groundw
Existin
ALYSIS
D RESEARCH IN
Gate 4, o
water monit
ng building o
C.
Photo
off Highway
oring station
on Site near
ographs of S
10
ns near Gate
Highway 10
ite and Surr
e 4 Nea
Ga
rounding Are
At Gate 4
r Gate 4, loo
ated access
ea
4, looking so
oking northe
point off Co
utheast
east across S
ounty Road H
21
Site
H
SITE ANA
MAXFIELD
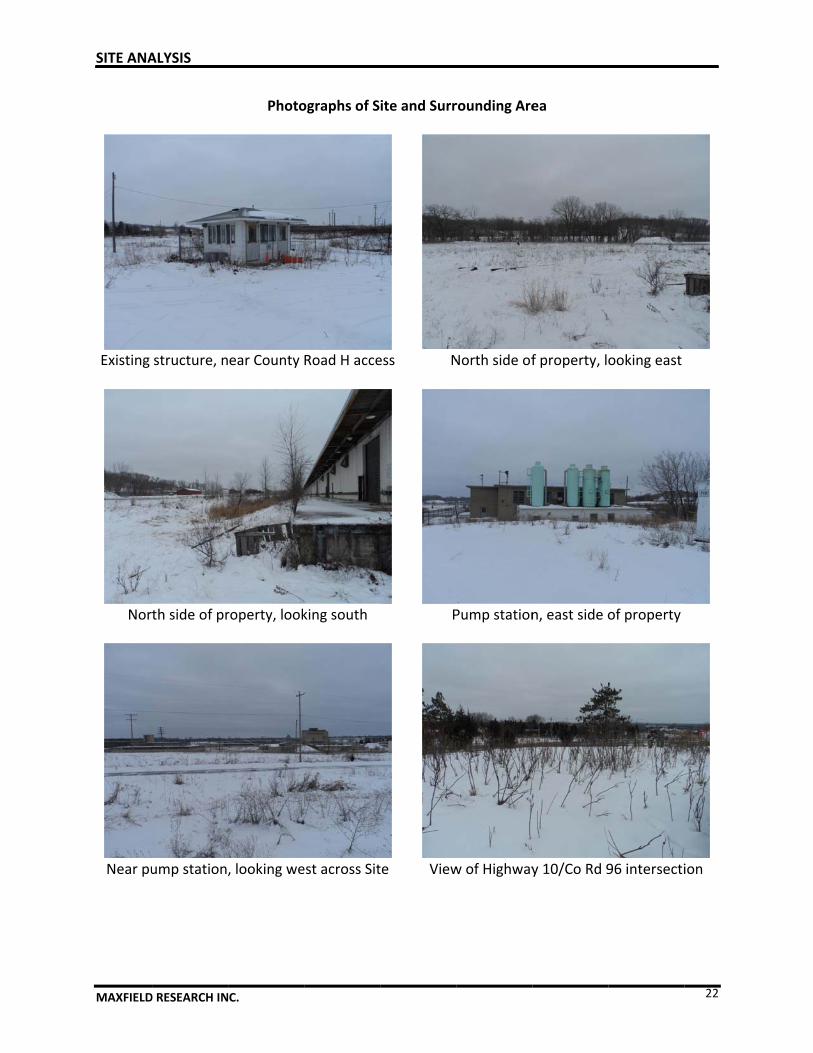
Existing
Nor
Near pu
ALYSIS
D RESEARCH IN
structure, n
th side of pr
ump station,
C.
Photo
ear County
roperty, look
, looking we
ographs of S
Road H acce
king south
est across Sit
ite and Surr
ess N
P
te View
rounding Are
North side of
Pump station
w of Highway
ea
f property, lo
n, east side o
y 10/Co Rd 9
ooking east
of property
96 intersecti
22
ion

SITE ANA
MAXFIELD
South
Big Ten
Housing
ALYSIS
D RESEARCH IN
side of prop
n Tavern, acr
across Coun
C.
Photo
perty, lookin
ross Hwy 10
nty Rd I, nor
ographs of S
g northwest
0 from Gate 4
rth of proper
ite and Surr
t Sou
4 Ma
rty Hou
rounding Are
th side of pr
anufactured
using across
ea
roperty, look
housing, we
Hwy 96, sou
king northea
est of Hwy 1
uth of prope
23
ast
10
rty
DEMOGR
MAXFIELD
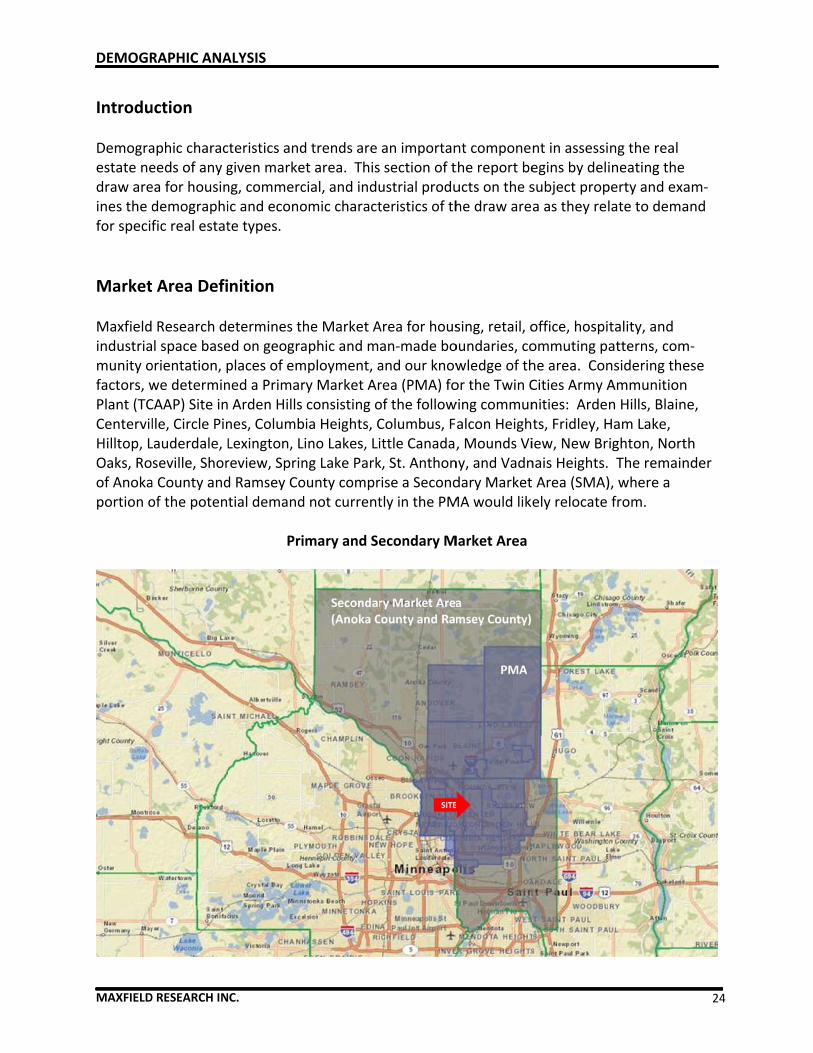
Introdu Demograestate nedraw areines the dfor specif
Market Maxfieldindustriamunity ofactors, wPlant (TCCentervilHilltop, LOaks, Roof Anokaportion o
RAPHIC ANA
D RESEARCH IN
uction
aphic characeeds of any gea for housindemographific real estat
Area Defi
Research del space baseorientation, pwe determinCAAP) Site inlle, Circle PinLauderdale, Lseville, Shora County andof the poten
ALYSIS
C.
cteristics andgiven markeng, commercic and econote types.
nition
etermines thed on geograplaces of emned a Primar Arden Hills nes, ColumbLexington, Lreview, Sprind Ramsey Cotial demand
Pri
d trends are et area. Thiscial, and induomic charact
he Market Aaphic and mamployment, ary Market Arconsisting oia Heights, Cino Lakes, Ling Lake Parkounty comprd not current
mary and Se
an importan section of tustrial produteristics of th
Area for housan‐made boand our knowrea (PMA) foof the followColumbus, Fittle Canada,k, St. Anthonrise a Secondtly in the PM
econdary M
nt componethe report beucts on the she draw are
sing, retail, ooundaries, cowledge of thor the Twin Cwing communalcon Heigh, Mounds Viny, and Vadndary MarketMA would like
Market Area
nt in assessiegins by delisubject propa as they rel
office, hospiommuting phe area. ConCities Army Anities: Ardets, Fridley, Hiew, New Brnais Heights. Area (SMA)ely relocate
ng the real ineating theperty and exalate to dema
tality, and atterns, comnsidering theAmmunitionn Hills, BlainHam Lake, ighton, Nort The remain), where a from.
24
am‐and
m‐ese n ne,
th nder

DEMOGRAPHIC ANALYSIS
MAXFIELD RESEARCH INC. 25
Population and Household Growth Trends Tables B‐1 and B‐2 present population and household growth trends in the Primary Market Area (PMA) from 1990 to 2030. The 1990, 2000 and 2010 population and household figures were obtained from the U.S. Census Bureau. The 2012 estimate and projections for 2017, 2020, and 2030 were based on forecasts made by ESRI (a nationally recognized demographics firm) and the Metropolitan Council, with adjustments made by Maxfield Research, Inc. Adjust‐ments were made to better reflect the unique local dynamics of the area based on our under‐standing of the residential development slowdown that began late last decade which impacted household growth throughout the Twin Cities Metro Area. The following are key figures from Tables B‐1 and B‐2.
As of 2010, the PMA contained 305,567 people and 120,199 households. Between 2000 and 2010, the population increased +5.8% while the number of households grew by +7.6%, sug‐gesting a trend to shrinking household sizes. During this same time period, the SMA popu‐lation grew 3.8% against household growth of 5.3%.
Within the PMA, the average household size has decreased steadily over the years. In 1990, the average household size in the PMA was 2.71 persons per household. This number de‐clined to 2.59 in 2000 and 2.54 in 2010, representing a ‐6.1% decline from 1990 to 2010. This trend is an indication of an aging household base. The City of Arden Hills was an excep‐tion, as the number of persons per household increased modestly, from 3.17 in 1990 to 3.23 in 2010.
‐2.0%
0.0%
2.0%
4.0%
6.0%
8.0%
10.0%
12.0%
14.0%
16.0%
18.0%
Arden Hills PMA SMA Twin Cities
Household Growth ComparisonPercent Growth by Decade
1990‐2000
2000‐2010
2010‐2020
2020‐2030

DEMOGRAPHIC ANALYSIS
MAXFIELD RESEARCH INC. 26
Estimate
1990 2000 2010 2012 2017 2020 2030 No. Pct. No. Pct.
Primary Market Area 264,762 288,867 305,567 310,397 320,708 326,702 353,584 16,700 5.8% 21,135 6.9%
Arden Hills 9,199 9,652 9,552 9,753 10,193 10,457 11,316 ‐100 ‐1.0% 905 9.5%
Blaine 38,975 45,014 57,186 58,810 61,452 64,094 72,830 12,172 27.0% 6,908 12.1%
Centervil le 1,633 3,202 3,792 3,787 3,780 3,780 4,091 590 18.4% ‐12 ‐0.3%
Circle Pines 4,704 4,663 4,918 4,991 5,146 5,239 5,670 255 5.5% 321 6.5%
Columbia Heights 18,910 18,520 19,496 19,772 20,215 20,348 22,020 976 5.3% 852 4.4%
Columbus 3,690 3,957 3,914 3,960 4,043 4,126 5,023 ‐43 ‐1.1% 212 5.4%
Falcon Heights 5,380 5,572 5,321 5,279 5,296 5,306 5,312 ‐251 ‐4.5% ‐15 ‐0.3%
Fridley 28,335 27,449 27,208 27,299 27,565 27,632 27,660 ‐241 ‐0.9% 424 1.6%
Ham Lake 8,924 12,710 15,296 15,458 15,743 16,028 18,212 2,586 20.3% 732 4.8%
Hilltop 749 766 744 736 724 722 722 ‐22 ‐2.9% ‐22 ‐3.0%
Lauderdale 2,700 2,364 2,379 2,301 2,214 2,223 2,405 15 0.6% ‐156 ‐6.6%
Lexington 2,279 2,142 2,049 2,043 2,037 2,038 2,038 ‐93 ‐4.3% ‐11 ‐0.5%
Lino Lakes 8,807 16,791 20,216 20,660 21,445 22,387 26,650 3,425 20.4% 2,171 10.7%
Little Canada 8,971 9,771 9,773 9,576 9,429 9,547 10,331 2 0.0% ‐226 ‐2.3%
Mounds View 12,541 12,738 12,155 12,436 13,070 13,197 13,353 ‐583 ‐4.6% 1,042 8.6%
New Brighton 22,207 22,206 21,456 21,908 22,990 23,152 23,176 ‐750 ‐3.4% 1,696 7.9%
North Oaks 3,386 3,883 4,469 4,619 4,945 5,141 5,563 586 15.1% 672 15.0%
Rosevil le 33,485 33,690 33,660 34,255 35,685 35,971 37,954 ‐30 ‐0.1% 2,311 6.9%
Shoreview 24,587 25,924 25,043 25,259 25,994 26,435 28,608 ‐881 ‐3.4% 1,392 5.6%
Spring Lake Park 6,532 6,772 6,412 6,760 7,335 7,335 7,335 ‐360 ‐5.3% 923 14.4%
St. Anthony 7,727 8,012 8,226 8,420 8,884 8,898 9,629 214 2.7% 672 8.2%
Vadnais Heights 11,041 13,069 12,302 12,315 12,523 12,648 13,687 ‐767 ‐5.9% 346 2.8%
Secondary Market Area 729,406 809,119 839,484 849,744 874,279 889,000 962,061 30,365 3.8% 49,516 5.9%
Twin Cities Metro Area 2,288,721 2,642,056 2,849,567 2,889,889 2,991,555 3,035,000 3,284,427 207,511 7.9% 185,433 6.5%
Note: Twin Cities Metro represents the 7‐County planning region
Sources: US Census Bureau; Metropolitan Council; ESRI; Maxfield Research, Inc.
TABLE B‐1
POPULATION GROWTH TRENDS AND PROJECTIONS
TCAAP SITE MARKET AREA
1990‐2020
Change
Census 2000‐2010 2010‐2020Forecast
Population

DEMOGRAPHIC ANALYSIS
MAXFIELD RESEARCH INC. 27
Estimate
1990 2000 2010 2012 2017 2020 2030 No. Pct. No. Pct.
Primary Market Area 97,843 111,730 120,199 121,783 126,497 128,714 138,786 8,469 7.6% 8,515 7.1%
Arden Hills 2,904 2,959 2,957 3,036 3,219 3,302 3,574 ‐2 ‐0.1% 345 11.7%
Blaine 12,825 15,926 21,077 21,565 22,672 23,647 26,870 5,151 32.3% 2,570 12.2%
Centervil le 519 1,077 1,315 1,309 1,316 1,316 1,424 238 22.1% 1 0.1%
Circle Pines 1,562 1,697 2,006 2,023 2,092 2,130 2,305 309 18.2% 124 6.2%
Columbia Heights 7,766 8,033 7,926 7,996 8,234 8,288 8,969 ‐107 ‐1.3% 362 4.6%
Columbus 1,129 1,328 1,416 1,429 1,474 1,504 1,831 88 6.6% 88 6.2%
Falcon Heights 2,016 2,103 2,131 2,106 2,110 2,114 2,116 28 1.3% ‐17 ‐0.8%
Fridley 10,909 11,328 11,110 11,116 11,333 11,360 11,372 ‐218 ‐1.9% 250 2.3%
Ham Lake 2,720 4,139 5,171 5,210 5,351 5,448 6,190 1,032 24.9% 277 5.4%
Hilltop 410 400 380 374 370 369 369 ‐20 ‐5.0% ‐11 ‐3.0%
Lauderdale 1,166 1,150 1,130 1,091 1,052 1,056 1,143 ‐20 ‐1.7% ‐74 ‐6.5%
Lexington 829 819 787 782 787 787 787 ‐32 ‐3.9% 0 0.0%
Lino Lakes 2,603 4,857 6,174 6,293 6,598 6,888 8,199 1,317 27.1% 714 11.6%
Little Canada 3,902 4,375 4,393 4,314 4,280 4,333 4,690 18 0.4% ‐60 ‐1.4%
Mounds View 4,702 5,018 4,954 5,055 5,312 5,364 5,427 ‐64 ‐1.3% 410 8.3%
New Brighton 8,523 9,013 8,915 9,119 9,625 9,693 9,703 ‐98 ‐1.1% 778 8.7%
North Oaks 1,085 1,300 1,746 1,807 1,942 2,019 2,185 446 34.3% 273 15.6%
Rosevil le 13,562 14,598 14,623 14,864 15,530 15,654 16,517 25 0.2% 1,031 7.1%
Shoreview 8,991 10,125 10,402 10,464 10,765 10,948 11,847 277 2.7% 546 5.2%
Spring Lake Park 2,343 2,724 2,672 2,811 3,076 3,076 3,076 ‐52 ‐1.9% 404 15.1%
St. Anthony 3,453 3,697 3,848 3,950 4,190 4,197 4,541 151 4.1% 349 9.1%
Vadnais Heights 3,924 5,064 5,066 5,069 5,169 5,221 5,650 2 0.0% 155 3.0%
Secondary Market Area 272,937 307,664 323,918 327,155 338,260 343,956 372,223 16,254 5.3% 20,038 6.2%
Twin Cities Metro Area 875,504 1,021,456 1,117,749 1,131,120 1,178,075 1,205,000 1,320,015 96,293 9.4% 87,251 7.8%
Note: Twin Cities Metro represents the 7‐County planning region
Sources: US Census Bureau; Metropolitan Council; ESRI; Maxfield Research, Inc.
TABLE B‐2
HOUSEHOLD GROWTH TRENDS AND PROJECTIONS
TCAAP SITE MARKET AREA
1990‐2020
Change
Census 2000‐2010 2010‐2020Forecast
Households

DEMOGRAPHIC ANALYSIS
MAXFIELD RESEARCH INC. 28
By 2020, the PMA is projected to add another 21,135 people (+6.9%) and 8,515 households (+7.1%). The majority of the population and household growth is expected to occur in Blaine and Lino Lakes where there is more land available for development. Redevelopment of aging areas in established communities like Roseville and New Brighton into higher‐density residential uses will generate some household and population growth in these fully‐developed cities. In addition, the TCAAP Site in Arden Hills will likely capture a substantial portion of this growth.
Between 2010 and 2020 the SMA population is projected to growth 5.9%, adding 49,516 people while the Twin Cities Metro Area grows by 185,433 people (+6.5%).
In 1990, the PMA contained 11.6% of the Metro Area’s population. This proportion dropped to 10.9% in 2000 and 10.7% in 2010 as much of the region’s residential growth oc‐curred beyond the I‐494/I‐694 loop in communities like Woodbury, Lakeville, Shakopee, and Maple Grove. With 9,552 people in 2,957 households, the City of Arden Hills contained 3.1% of the PMA’s population and 2.5% of its households in 2010.
These proportions are expected to increase slightly by 2020 as transportation costs and demographic shifts increase the desirability of residing closer to the Metro core.
Age Distribution The age distribution of a community’s population helps in assessing the type of housing and commercial services needed. For example, younger and older people are more attracted to higher density housing located near urban services and entertainment while middle‐aged people (particularly those with children) traditionally prefer lower‐density single‐family homes. Also, younger people are more likely to seek a variety of retail services including entertainment, electronics and specialty apparel. Child stores increase in popularity for the 25 to 34 and 35 to 44 cohorts while home furnishings are more frequently sought by the 45 to 54 and 55 to 64 age groups. Table B‐3 presents the age distribution of the TCAAP Site Market Area population from 2000 to 2017. Information from 2000 and 2010 is sourced from the U.S. Census. The 2012 estimates and projections for 2017 were calculated by Maxfield Research Inc. based on information from ESRI, a reputable national demographics firm, and the Metropolitan Council. The following are key trends about the age distribution of the Market Area’s population.
In 2010, the largest adult cohort by age in the PMA and SMA was 45 to 54, totaling 48,828 people (16% of the total population) in the PMA and 126,499 (15% of the total population) in the SMA. This age group is predicted to decline ‐6.2% between 2012 and 2017 for a loss of ‐3,019 people in the PMA and ‐6.4% (‐8,113 people) in the SMA.

DEMOGRAPHIC ANALYSIS
MAXFIELD RESEARCH INC. 29
In the City of Arden Hills, the largest age group was 55 to 64 in 2010. This cohort is project‐ed to increase +8.6% (+120 people) between 2012 and 2017.
The greatest growth is predicted to occur among the older adults in the Market Area. Aging of baby boomers led to an increase of 12,582 people (+48.3%) in the 55 to 64 population between 2000 and 2010 in the PMA. As this group ages, all cohorts age 55 or greater are predicted to see increases over the next five years, particularly the 65 to 74 age group which is projected to grow 23.6% in Arden Hills, 33.9% in the PMA, and 33.5% in the SMA.
The Market Area is expected to see a decline in the middle aged cohorts between 2012 and 2017. The 45 to 54 age cohort is expected to decline ‐3.8% in Arden Hills, ‐6.2% in the PMA, and ‐6.4% in the SMA. The 35 to 44 age group is expected to shrink slightly throughout the PMA (‐0.5%) and SMA (‐1.0%). The 20 to 24 age group is also projected to decline through‐out the Market Area, losing ‐1.0% (‐14 people) in Arden Hills, ‐2.4% (‐476 people) in the PMA, and ‐2.2% (‐1,352 people) in the SMA.
The weak growth projected for the middle aged population is a result the comparatively small number of people who will move into those age cohorts between 2012 and 2017, a phenomenon known as the “baby bust.” The “baby bust” is often referred to the genera‐tion of children born between 1965 and 1980, an era when the United States birthrate dropped sharply.
‐10.0 ‐5.0 0.0 5.0 10.0 15.0 20.0 25.0 30.0 35.0 40.0
Under 20
20 to 24
25 to 34
35 to 44
45 to 54
55 to 64
65 to 74
75+
Total
Percent Change
Projected Population Growth by Age2012‐2017
SMA
PMA
Arden Hills

DEMOGRAPHIC ANALYSIS
MAXFIELD RESEARCH INC. 30
Household Income Household income data helps ascertain demand for different types of retail services. People with lower incomes are likely to seek out discount retailers and spend a higher proportion of their income on necessities like grocery items. Retail services and goods such as dining and home furnishings will experience higher spending from more moderate‐income households while upper income households will also shop for specialty apparel, recreation and sporting
Estimate Projection
Age 2000 2010 2012 2017 No. Pct. No. Pct.
City of Arden Hills
Under 20 2,802 2,608 2,622 2,694 ‐194 ‐6.9 72 2.7
20 to 24 1,092 1,417 1,435 1,421 325 29.8 ‐14 ‐1.0
25 to 34 805 769 801 852 ‐36 ‐4.5 51 6.4
35 to 44 1,182 768 767 791 ‐414 ‐35.0 24 3.1
45 to 54 1,573 1,180 1,165 1,121 ‐393 ‐25.0 ‐44 ‐3.8
55 to 64 858 1,322 1,400 1,520 464 54.1 120 8.6
65 to 74 553 660 713 881 107 19.3 168 23.6
75+ 787 828 850 913 41 5.2 63 7.4
Total 9,652 9,552 9,753 10,193 ‐100 ‐1.0 440 4.5
Primary Market Area
Under 20 79,738 78,155 77,860 79,466 ‐1,583 ‐2.0 1,311 1.7
20 to 24 19,532 19,693 20,216 19,217 161 0.8 ‐476 ‐2.4
25 to 34 39,492 40,344 41,590 43,143 852 2.2 2,799 6.9
35 to 44 49,836 39,375 38,910 39,176 ‐10,461 ‐21.0 ‐199 ‐0.5
45 to 54 41,985 48,828 48,072 45,809 6,843 16.3 ‐3,019 ‐6.2
55 to 64 26,055 38,637 40,931 44,024 12,582 48.3 5,387 13.9
65 to 74 17,430 21,460 23,249 28,733 4,030 23.1 7,273 33.9
75+ 14,799 19,075 19,569 21,140 4,276 28.9 2,065 10.8
Total 288,867 305,567 310,397 320,708 16,700 5.8 15,141 5.0
Secondary Market Area
Under 20 241,380 229,950 228,455 232,815 ‐11,430 ‐4.7 2,865 1.2
20 to 24 58,270 62,674 64,388 61,322 4,404 7.6 ‐1,352 ‐2.2
25 to 34 121,213 120,751 124,097 128,811 ‐462 ‐0.4 8,060 6.7
35 to 44 137,329 109,228 107,628 108,186 ‐28,101 ‐20.5 ‐1,042 ‐1.0
45 to 54 108,127 126,499 124,250 118,386 18,372 17.0 ‐8,113 ‐6.4
55 to 64 62,216 96,969 102,478 110,211 34,753 55.9 13,242 13.7
65 to 74 41,348 49,907 53,940 66,614 8,559 20.7 16,707 33.5
75+ 39,236 43,506 44,508 47,934 4,270 10.9 4,428 10.2
Total 809,119 839,484 849,744 874,279 30,365 3.8 34,795 4.1
Sources: U.S. Census Bureau; ESRI; Maxfield Research, Inc.
AGE DISTRIBUTION
TABLE B‐3
2000‐2010 2012‐2017
2000‐2017
TCAAP SITE MARKET AREA
Change
Census

DEMOGRAPHIC ANALYSIS
MAXFIELD RESEARCH INC. 31
goods, and luxury items. This data also helps determine demand for different types of owned and rented housing based on the size of the market at specific cost levels. In general, housing costs of up to 30 percent of income are considered affordable by the Department of Housing and Urban Development (HUD). The next two tables present data on household income by age of householder in 2012 and 2017 for the Market Area. The data is estimated by ESRI, a nationally recognized demographic services firm, and adjusted by Maxfield Research Inc. to reflect the most current local house‐hold estimates and projections. The following are key points.
In 2012, the median household income was estimated to be approximately $64,000 in the PMA and $55,823 in the SMA. As such, it appears that PMA residents are relatively affluent compared to the SMA and have more resources to devote toward housing and retail goods than residents elsewhere in Anoka County and Ramsey County.
By 2017, the median household income is projected to increase 20% to $76,790 in the PMA and +18% in the SMA to $65,868. In both market areas, the average annual increase (4% in the PMA and 3.6% in the SMA) will exceed the historical annual inflation rate of 2.4% over the past ten years. As households age through the lifecycle, their household income tends to peak in their late 40s and early 50s. This trend is evident throughout the Market Area as the age 45 to 54 cohort has the highest estimated income at $81,944 in the PMA and $72,769 in the SMA.
Within the PMA, the 65 to 74 and 55 to 64 age cohorts are projected to experience the largest increases between 2012 and 2017, rising 22.5% (+3,257 households) and 6.7%
$‐
$10,000
$20,000
$30,000
$40,000
$50,000
$60,000
$70,000
$80,000
$90,000
$100,000
Total <25 25‐34 35‐44 45‐54 55‐64 65‐74 75+
2012 Median Income by Age of Householder
PMA
SMA

DEMOGRAPHIC ANALYSIS
MAXFIELD RESEARCH INC. 32
(+1,600 households), respectively. Median incomes in these two age groups are also ex‐pected to climb significantly, suggesting that there will be a growing opportunity for retail goods and services catering to these age groups.
Based on average pricing of $1,179 for a new (built in the year 2000 or more recently) one‐bedroom rental unit in the Twin Cities Metro Area, a household would need to have an an‐nual income of $47,000 or greater to not exceed 30% of its monthly income on housing costs. In 2012, we estimate that approximately 79,852 PMA households (66% of the total) are estimated to have incomes of at least $47,000. By 2017, the total income‐qualified
Total <25 25‐34 35‐44 45‐54 55‐64 65 ‐74 75+
Less than $15,000 8,753 644 1,177 786 1,214 1,320 1,334 2,278
$15,000 to $24,999 8,764 557 1,123 817 1,111 1,178 1,177 2,801
$25,000 to $34,999 11,238 530 1,789 1,449 1,669 1,786 1,590 2,425$35,000 to $49,999 16,470 700 2,956 2,450 2,688 2,999 2,309 2,368
$50,000 to $74,999 23,995 884 4,378 4,139 5,128 4,647 3,187 1,632
$75,000 to $99,999 18,679 274 3,369 3,809 4,736 3,707 1,982 802
$100,000 or more 33,884 314 3,828 6,966 10,377 8,343 2,900 1,156
Total 121,783 3,903 18,620 20,416 26,923 23,980 14,479 13,462
Median Income $63,999 $38,600 $60,210 $77,722 $81,944 $75,294 $54,574 $31,036
Less than $15,000 8,811 612 1,149 672 1,010 1,247 1,562 2,559
$15,000 to $24,999 6,845 463 856 452 676 793 1,083 2,522
$25,000 to $34,999 8,535 418 1,320 882 1,017 1,273 1,482 2,143$35,000 to $49,999 14,551 628 2,549 1,959 1,999 2,561 2,398 2,457
$50,000 to $74,999 21,996 801 4,034 3,512 4,089 4,269 3,519 1,772
$75,000 to $99,999 24,882 348 4,543 4,757 5,518 5,056 3,357 1,303
$100,000 or more 40,877 361 4,777 8,206 11,161 10,381 4,335 1,656
Total 126,497 3,631 19,228 20,440 25,470 25,580 17,736 14,412
Median Income $76,790 $41,390 $72,419 $87,105 $90,988 $85,961 $64,352 $34,887
Less than $15,000 58 ‐32 ‐28 ‐114 ‐204 ‐73 228 281
$15,000 to $24,999 ‐1,919 ‐94 ‐267 ‐365 ‐435 ‐385 ‐94 ‐279
$25,000 to $34,999 ‐2,703 ‐112 ‐469 ‐567 ‐652 ‐513 ‐108 ‐282
$35,000 to $49,999 ‐1,919 ‐72 ‐407 ‐491 ‐689 ‐438 89 89
$50,000 to $74,999 ‐1,999 ‐83 ‐344 ‐627 ‐1,039 ‐378 332 140
$75,000 to $99,999 6,203 74 1,174 948 782 1,349 1,375 501
$100,000 or more 6,993 47 949 1,240 784 2,038 1,435 500
Total 4,714 ‐272 608 24 ‐1,453 1,600 3,257 950
Median Income $12,791 $2,790 $12,209 $9,383 $9,044 $10,667 $9,778 $3,851
Sources: ESRI; US Census Bureau; Maxfield Research Inc.
2012
2017
Change 2012 ‐ 2017
TABLE B‐4
HOUSEHOLD INCOME BY AGE OF HOUSEHOLDER
PRIMARY MARKET AREA
2012 & 2017
Age of Householder

DEMOGRAPHIC ANALYSIS
MAXFIELD RESEARCH INC. 33
households are projected to increase to nearly 88,200 households (+10%) after accounting for inflation. Households under the age of 35 are most likely to rent their housing. In 2012, 41% of households age 24 and below and 65% of households age 25 to 34 in the PMA are estimated to have incomes of at least $47,000. Additionally, because younger householders are often willing to live with roommates, the percent income‐qualified is likely somewhat higher. Between 2012 and 2017, the number of income‐qualified PMA households in the 25 to 34 age cohort is expected to increase by approximately 1,264 households (+10.4%). The age 24 or younger cohort will lose approximately ‐83 income‐qualified households (‐5%) during this period.
Total <25 25‐34 35‐44 45‐54 55‐64 65 ‐74 75+
Less than $15,000 34,949 3,779 5,909 4,144 5,360 5,576 4,039 6,142
$15,000 to $24,999 28,746 2,582 4,803 3,270 3,927 3,854 3,514 6,796
$25,000 to $34,999 33,393 1,911 6,373 5,051 5,138 5,333 4,114 5,473$35,000 to $49,999 46,367 2,552 9,399 7,599 7,913 8,098 5,529 5,277
$50,000 to $74,999 63,844 2,610 13,313 11,826 13,876 11,927 7,119 3,173
$75,000 to $99,999 45,499 837 8,802 9,961 11,602 8,749 4,036 1,512
$100,000 or more 74,357 848 9,205 16,170 22,853 17,770 5,651 1,860
Total 327,155 15,119 57,804 58,021 70,669 61,307 34,002 30,233
Median Income $55,823 $30,570 $53,031 $66,951 $72,769 $64,027 $49,282 $28,161
Less than $15,000 35,995 3,750 6,070 3,877 4,796 5,653 4,901 6,948
$15,000 to $24,999 22,776 2,103 3,802 1,985 2,554 2,690 3,398 6,244
$25,000 to $34,999 25,921 1,480 4,891 3,331 3,331 4,033 3,961 4,894$35,000 to $49,999 41,670 2,326 8,390 6,314 6,101 7,154 5,876 5,509
$50,000 to $74,999 59,807 2,444 12,708 10,387 11,407 11,280 8,054 3,527
$75,000 to $99,999 61,399 1,099 12,151 12,733 13,787 12,196 6,922 2,511
$100,000 or more 90,692 1,020 11,736 19,343 24,891 22,436 8,557 2,709
Total 338,260 14,222 59,748 57,970 66,867 65,442 41,669 32,342
Median Income $65,868 $33,132 $60,637 $79,450 $82,483 $77,875 $56,256 $30,315
Less than $15,000 1,046 ‐29 161 ‐267 ‐564 77 862 806
$15,000 to $24,999 ‐5,970 ‐479 ‐1,001 ‐1,285 ‐1,373 ‐1,164 ‐116 ‐552
$25,000 to $34,999 ‐7,472 ‐431 ‐1,482 ‐1,720 ‐1,807 ‐1,300 ‐153 ‐579
$35,000 to $49,999 ‐4,697 ‐226 ‐1,009 ‐1,285 ‐1,812 ‐944 347 232
$50,000 to $74,999 ‐4,037 ‐166 ‐605 ‐1,439 ‐2,469 ‐647 935 354
$75,000 to $99,999 15,900 262 3,349 2,772 2,185 3,447 2,886 999
$100,000 or more 16,335 172 2,531 3,173 2,038 4,666 2,906 849
Total 11,105 ‐897 1,944 ‐51 ‐3,802 4,135 7,667 2,109
Median Income $10,045 $2,562 $7,606 $12,499 $9,714 $13,848 $6,974 $2,154
2012
2017
Change 2012 ‐ 2017
TABLE B‐5
HOUSEHOLD INCOME BY AGE OF HOUSEHOLDER
SECONDARY MARKET AREA
2012 & 2017
Age of Householder
DEMOGRAPHIC ANALYSIS
MAXFIELD RESEARCH INC. 34
The SMA household base is projected to grow by 3.4% (+11,105) between 2012 and 2017. Like the PMA though, higher growth in the income‐qualified household base is projected in the 25 to 34 age cohort. Whereas the 25 to 34 age cohort is projected to gain 1,944 house‐holds (+3.4%), the income‐qualified base is projected to increase by +3,647 households, for an 11.0% gain.
Household Tenure Table B‐6 shows household tenure by age of householder for Arden Hills, the PMA, and SMA in 2000 and 2010. The data is compiled from the U.S. Census Bureau. The table shows the number and percent of renter‐ and owner‐occupied housing units in the Market Area. All data excludes unoccupied units and group quarters such as dormitories. Household tenure information is important in understanding households’ preferences to either rent or own their housing. In addition to preferences, factors that contribute to these propor‐tions include mortgage interest rates, household age, and lifestyle considerations, among others. The following are key points from Table B‐6:
Typically, the youngest and oldest households rent their housing in greater proportions than middle‐age households. This pattern is apparent among the younger Market Area house‐holds as 48.9% of the age 15 to 34 population rents in the PMA while 56.9% of SMA house‐holders age 15 to 34 rent. Due to a limited supply of rental housing in Arden Hills, only 27.4% of the 15 to 34 age group rented in 2010.
Over 77% of households age 15 to 24 rented in the PMA in 2010 while approximately 43% of households age 25 to 34 rented. These percentages are slightly lower than in the SMA which had nearly 83% of age 15 to 24 and 50% of age 25 to 34 households renting in 2010.
0.0
10.0
20.0
30.0
40.0
50.0
60.0
70.0
80.0
90.0
15‐24 25‐34 35‐44 45‐54 55‐64 65 + Total
Household Tenure by Age of HouseholderPercentage of Renters in 2010
Arden Hills
PMA
SMA

DEMOGRAPHIC ANALYSIS
MAXFIELD RESEARCH INC. 35
Age No. Pct. No. Pct. No. Pct. No. Pct. No. Pct. No. Pct.
15‐24 Own 32 40.5 19 37.3 1,310 23.8 909 22.7 3,549 19.6 2,660 17.2
Rent 47 59.5 32 62.7 4,198 76.2 3,099 77.3 14,550 80.4 12,798 82.8
Total 79 100.0 51 100.0 5,508 100.0 4,008 100.0 18,099 100.0 15,458 100.0
25‐34 Own 209 67.4 211 79.3 11,451 60.9 10,437 57.4 33,151 55.2 28,354 50.1
Rent 101 32.6 55 20.7 7,362 39.1 7,741 42.6 26,873 44.8 28,217 49.9
Total 310 100.0 266 100.0 18,813 100.0 18,178 100.0 60,024 100.0 56,571 100.0
35‐44 Own 548 92.3 350 91.6 22,330 81.8 15,918 76.4 58,416 75.9 41,389 69.7
Rent 46 7.7 32 8.4 4,973 18.2 4,925 23.6 18,515 24.1 17,993 30.3
Total 594 100.0 382 100.0 27,303 100.0 20,843 100.0 76,931 100.0 59,382 100.0
45‐54 Own 821 96.4 610 95.2 21,130 87.8 23,120 83.7 51,889 81.8 56,382 77.7
Rent 31 3.6 31 4.8 2,949 12.2 4,495 16.3 11,570 18.2 16,186 22.3
Total 852 100.0 641 100.0 24,079 100.0 27,615 100.0 63,459 100.0 72,568 100.0
55‐64 Own 498 96.5 709 95.0 14,020 90.7 19,974 87.4 31,554 84.4 47,411 81.0
Rent 18 3.5 37 5.0 1,438 9.3 2,879 12.6 5,835 15.6 11,108 19.0
Total 516 100.0 746 100.0 15,458 100.0 22,853 100.0 37,389 100.0 58,519 100.0
65 + Own 501 82.4 652 74.9 16,427 79.9 21,544 80.7 37,899 73.2 46,510 75.7
Rent 107 17.6 219 25.1 4,142 20.1 5,158 19.3 13,863 26.8 14,910 24.3
Total 608 100.0 871 100.0 20,569 100.0 26,702 100.0 51,762 100.0 61,420 100.0
TOTAL Own 2,609 88.2 2,551 86.3 86,668 77.6 91,902 76.5 216,458 70.4 222,706 68.8Rent 350 11.8 406 13.7 25,062 22.4 28,297 23.5 91,206 29.6 101,212 31.2
Total 2,959 100.0 2,957 100.0 111,730 100.0 120,199 100.0 307,664 100.0 323,918 100.0
Sources: U.S. Census Bureau; Maxfield Research Inc.
2000 2010 2000 2010
TABLE B‐6
TCAAP SITE MARKET AREA
2000 & 2010
TENURE BY AGE OF HOUSEHOLDER
Primary Market Area Secondary Market AreaArden Hills
2000 2010
DEMOGRAPHIC ANALYSIS
MAXFIELD RESEARCH INC. 36
In Arden Hills, nearly 63% of the age 15 to 24 households rented while 21% of the 25 to 34 cohort rented in 2010. Within the prime ownership years (35 to 64), 94% of households in Arden Hills owned in 2010, compared to 83% of PMA householders and 76% in the SMA.
In the PMA, 24% of all households rented in 2010, giving it a rental rate that was slightly lower than the SMA (31% of households rented in 2010) and the Metro Area (30% rented). In Arden Hills, only 14% of all households rented. Except for the 65 and older age cohort, all groups over the age of 35 rented at higher rates in the SMA than the PMA and Arden Hills. Approximately 25% of households in Arden Hills over the age of 65 rented in 2010, com‐pared to 19% in the PMA and 24% in the SMA.
The percentage of PMA renter households increased for all age cohorts between 2000 and 2010 as the total number of renter households residing in the PMA grew by 3,235 during the decade, an increase of approximately 13%. The number of owner‐occupied households grew by 5,234, representing a 6% increase during the decade. In Arden Hills, the number of renter households grew by 56, for a 16% increase while the number of owner households declined by ‐58 (‐2%) between 2000 and 2010.
In the PMA, the 45 to 54 and 55 to 64 age cohorts experienced the largest increase in the number of renters, gaining 1,546 (+52%) and 1,441 (+100%) renter households, respective‐ly. A similar pattern emerged in the SMA. These increases were due, in large part, to the bursting of the housing bubble which pushed many occupants out of home ownership and into rental units.
Household Type Table B‐7 shows household type trends in the TCAAP Site Market Area in 2000 and 2010. The data is collected from the U.S. Census. The following are key points from Table B‐7:
In 2010, family households comprised 68.3% of all households in Arden Hills, 66.2% in the PMA, and 63.5% in the SMA. However, the number of family households declined in Arden Hills while increasing in both the PMA and SMA between 2000 and 2010.
Within Arden Hills, the number of married couple families with children declined by ‐230, representing a ‐27.8% decline, while the number of other family households declined ‐8.4%. Married couple families without children increased by 51 (+4.8%).
The PMA experienced a ‐11.4% decline in the number of married couples with children after a loss of ‐3,281 households, while the number of married couples without children in‐creased by 4,256 (+13.0%). Other family households increased by 18.4% during the decade (+6,946 households). The SMA experienced an increase in the number of family households during the decade as the number of married couples without children climbed 13.4%

DEMOGRAPHIC ANALYSIS
MAXFIELD RESEARCH INC. 37
(+10,265 households) and the number of other family households grew by 15.0% (+6,946). Married couples with children declined ‐14.4% after losing ‐11,018 households.
Married couple families with children typically generate demand for single‐family detached ownership housing. Married couple families without children are generally made up of younger couples that have not had children, will not have children, and older couples with adult children that have moved out of the home. These household types often desire multi‐family housing options for convenience reasons. Other family households, defined as a male or female householder with no spouse present (typically single‐parent households), often require affordable housing. The increase in other family households in the PMA and SMA suggests a growing need for affordable housing options in the Market Area.
Of the five separate household categories, households with one resident were the most common type in the SMA, comprising 28.7% of all households. Married couples without children were the most common in Arden Hills and the PMA, representing 37.4% and 30.8% of all households, respectively. Single‐person households represented 26.5% of all house‐holds in Arden Hills and 27.1% in the PMA.
Changes in households living alone and households composed of unrelated roommates often drive demand for rental housing in the Market Area. Between 2000 and 2010, these household types collectively increased by 206 households (+28.1) in Arden Hills, +4,846 households in the PMA (+13.6%), and +10,061 households in the SMA (+9.3%). An increase in the percentage of these household types indicates a shift in housing needs that favors rental development. However, households composed of unrelated roommates can also be unmarried couples that may choose to own and can often afford to own if they are double‐income.
20%27% 25% 27% 28% 29%
5%5% 7% 7% 8% 8%
28%20%
26% 21%25% 20%
36% 37% 29% 31% 25% 27%
12% 11% 13% 14% 15% 16%
0%
10%
20%
30%
40%
50%
60%
70%
80%
90%
100%
ArdenHills2000
ArdenHills2010
PMA2000
PMA2010
SMA2000
SMA2010
Household Type Comparison
Other Family
Married w/o Children
Married w/ Children
Other (Roommates)
Persons Living Alone

DEMOGRAPHIC ANALYSIS
MAXFIELD RESEARCH INC. 38
Summary of Demographic Trends The following points summarize key demographic trends that will impact the demand potential for housing and commercial space on the subject property.
As of 2010, the PMA contained 305,567 people and 120,199 households. Between 2000 and 2010, the population increased +5.8% while the number of households grew by +7.6%, sug‐gesting a trend to shrinking household sizes. Within the PMA, the average household size has decreased steadily over the years. In 1990, the average household size was 2.71 per‐sons per household. This number declined to 2.59 in 2000 and 2.54 in 2010, representing a decline of ‐6.1% from 1990 to 2010. This trend is an indication of an aging household base. The City of Arden Hills was an exception, as the number of persons per household increased modestly, from 3.17 in 1990 to 3.23 in 2010.
By 2020, the PMA is projected to add another 21,135 people (+6.9%) and 8,515 households (+7.1%). The majority of the population and household growth is expected to occur in Blaine and Lino Lakes where there is more land available for development. Redevelopment of aging areas in established communities like Roseville and New Brighton into higher‐density residential uses will generate some household and population growth in these fully‐developed cities. In addition, the TCAAP Site in Arden Hills will likely capture a substantial portion of this growth.
Total Persons Other Married w/ Married w/o Other
Households Living Alone (Roommates) Children Children Family
Arden Hills 2,959 590 142 827 1,056 344
Primary Market Area 111,730 28,042 7,695 28,830 32,803 14,360
Secondary Market Area 307,664 84,865 23,370 76,355 76,768 46,306
Arden Hills 2,957 784 154 597 1,107 315
Primary Market Area 120,199 32,585 7,998 25,549 37,059 17,008
Secondary Market Area 323,918 92,976 25,320 65,337 87,033 53,252
Sources: U.S. Census Bureau; ESRI; Maxfield Research Inc.
NON‐FAMILY HHs FAMILY HHs
2000
2010
TABLE B‐7
HOUSEHOLD TYPE
TCAAP MARKET AREA
2000 & 2010
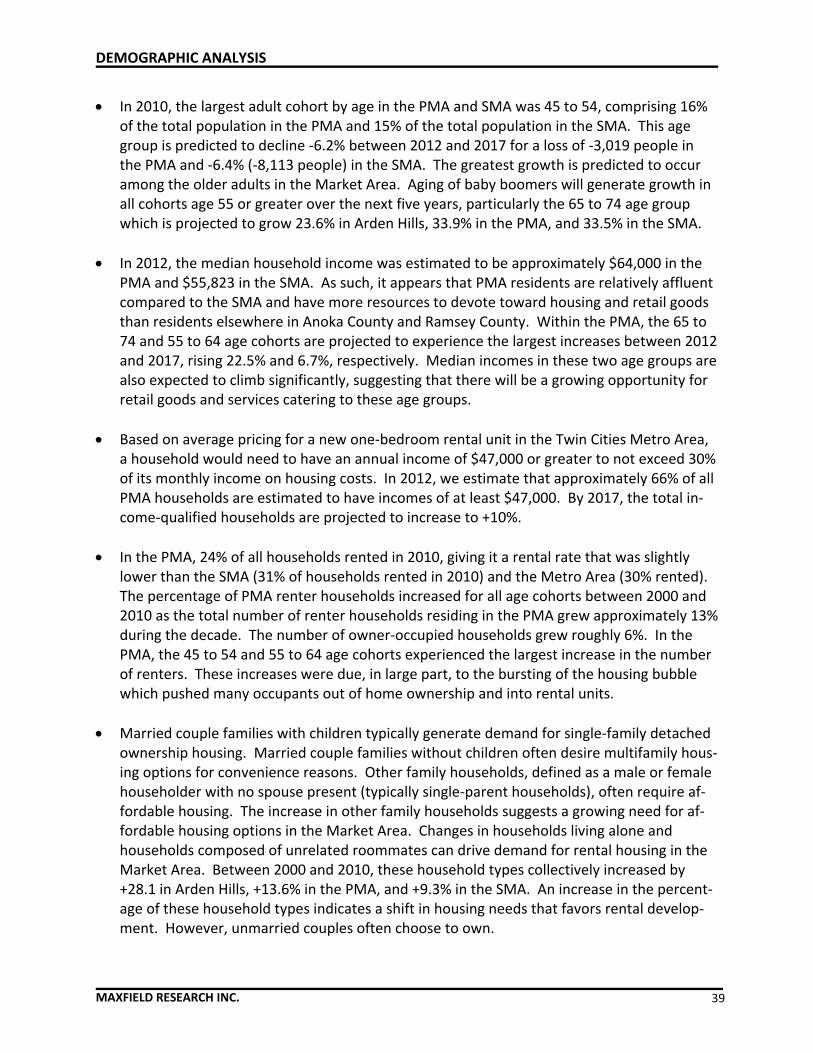
DEMOGRAPHIC ANALYSIS
MAXFIELD RESEARCH INC. 39
In 2010, the largest adult cohort by age in the PMA and SMA was 45 to 54, comprising 16% of the total population in the PMA and 15% of the total population in the SMA. This age group is predicted to decline ‐6.2% between 2012 and 2017 for a loss of ‐3,019 people in the PMA and ‐6.4% (‐8,113 people) in the SMA. The greatest growth is predicted to occur among the older adults in the Market Area. Aging of baby boomers will generate growth in all cohorts age 55 or greater over the next five years, particularly the 65 to 74 age group which is projected to grow 23.6% in Arden Hills, 33.9% in the PMA, and 33.5% in the SMA.
In 2012, the median household income was estimated to be approximately $64,000 in the PMA and $55,823 in the SMA. As such, it appears that PMA residents are relatively affluent compared to the SMA and have more resources to devote toward housing and retail goods than residents elsewhere in Anoka County and Ramsey County. Within the PMA, the 65 to 74 and 55 to 64 age cohorts are projected to experience the largest increases between 2012 and 2017, rising 22.5% and 6.7%, respectively. Median incomes in these two age groups are also expected to climb significantly, suggesting that there will be a growing opportunity for retail goods and services catering to these age groups.
Based on average pricing for a new one‐bedroom rental unit in the Twin Cities Metro Area, a household would need to have an annual income of $47,000 or greater to not exceed 30% of its monthly income on housing costs. In 2012, we estimate that approximately 66% of all PMA households are estimated to have incomes of at least $47,000. By 2017, the total in‐come‐qualified households are projected to increase to +10%.
In the PMA, 24% of all households rented in 2010, giving it a rental rate that was slightly lower than the SMA (31% of households rented in 2010) and the Metro Area (30% rented). The percentage of PMA renter households increased for all age cohorts between 2000 and 2010 as the total number of renter households residing in the PMA grew approximately 13% during the decade. The number of owner‐occupied households grew roughly 6%. In the PMA, the 45 to 54 and 55 to 64 age cohorts experienced the largest increase in the number of renters. These increases were due, in large part, to the bursting of the housing bubble which pushed many occupants out of home ownership and into rental units.
Married couple families with children typically generate demand for single‐family detached ownership housing. Married couple families without children often desire multifamily hous‐ing options for convenience reasons. Other family households, defined as a male or female householder with no spouse present (typically single‐parent households), often require af‐fordable housing. The increase in other family households suggests a growing need for af‐fordable housing options in the Market Area. Changes in households living alone and households composed of unrelated roommates can drive demand for rental housing in the Market Area. Between 2000 and 2010, these household types collectively increased by +28.1 in Arden Hills, +13.6% in the PMA, and +9.3% in the SMA. An increase in the percent‐age of these household types indicates a shift in housing needs that favors rental develop‐ment. However, unmarried couples often choose to own.

EMPLOYMENT TRENDS
MAXFIELD RESEARCH INC. 40
Introduction Employment characteristics are an important component in assessing housing needs in any given market area. These trends are important to consider since job growth can generally fuel household and population growth as people generally desire to live near where they work. Long commute times and the redevelopment of core cities have encouraged households to move closer to major employment centers. Job growth will also drive demand for office and industrial real estate and increased hiring in a market area will typically lead to higher levels of retail spending, stimulating demand for retail space. Commercial and industrial businesses will often want to locate near similar businesses to draw employees from an existing labor pool.
Employment Growth Table C‐1 shows employment growth trends and projections from 1990 to 2020 based on the most recent information available from the Minnesota Department of Employment and Eco‐nomic Development (DEED). Data for 1990, 2000, 2005, and 2010 represents the annual average employment for that year while 2012 data is from the second quarter. The 2020 forecast is based on 2010‐2020 industry projections for the Twin Cities published by DEED, the most recent employment forecast available for the region. Maxfield Research applied the projected ten‐year growth rate of 12.0% for the Twin Cities to the 2010 employment data to arrive at the 2020 forecast for the Metro Area. We arrived at the 2020 forecast for the PMA and SMA based on the proportion of the Metro Area jobs that were located in each area in 2012. We then estimate future employment for the individual cities comprising the PMA based on the 2012 proportion of PMA jobs located in each City.
In 2000, there were 12,326 jobs in Arden Hills, 163,064 jobs in the PMA and 444,298 jobs in the SMA. In light of the economic recession, by 2010 employment declined ‐5.0% (‐8,182 jobs) in the PMA and ‐4.7% (‐20,752 jobs) in the SMA. Arden Hills experienced a slight gain in employment during the decade, adding 76 jobs (+0.6%). By comparison, the number of jobs in the Twin Cities dropped ‐3.9%.
Data from the Quarterly Census of Employment and Wages indicates that the PMA gained 5,514 jobs (+3.6%) between 2010 and the second quarter of 2012. During that time, the number of jobs increased +1.7% in the SMA and +3.4% in the Twin Cities Metro Area. The City of Arden Hills added 239 jobs for a +1.9% increase. Much of the PMA job growth be‐tween 2010 and the second quarter of 2012 occurred in the Professional and Business Ser‐vices sector and the Trade, Transportation, and Utilities industry sector.
Solid job growth is expected in the PMA and SMA between 2010 and 2020. The PMA is projected to experience a 13.9% gain (+21,575 jobs) during the decade while SMA employ‐ment is expected to increase by 10.1%. Employment in the Twin Cities is projected to ex‐pand by 12.0%. Arden Hills is projected to gain 1,505 jobs for a +12.1% growth rate.

EMPLOYMENT TRENDS
MAXFIELD RESEARCH INC. 41
Estimate Forecast
1990 2000 2005 2010 2012 2020 No. Pct. No. Pct.
Primary Market Area 126,639 163,064 166,143 154,882 160,396 176,457 ‐8,182 ‐5.0% 21,575 13.9%
Arden Hills 10,929 12,326 13,113 12,402 12,641 13,907 76 0.6% 1,505 12.1%
Blaine 11,751 17,434 19,856 20,561 21,685 23,856 3,127 17.9% 3,295 16.0%
Centervil le 168 363 371 409 468 515 46 12.7% 106 25.9%
Circle Pines 861 2,150 2,243 790 817 899 ‐1,360 ‐63.3% 109 13.8%
Columbia Heights 4,536 6,397 5,217 3,484 4,075 4,483 ‐2,913 ‐45.5% 999 28.7%
Columbus 100 507 899 1,172 1,239 1,363 665 131.2% 191 16.3%
Falcon Heights 3,180 4,190 4,216 5,298 4,205 4,626 1,108 26.4% ‐672 ‐12.7%
Fridley 23,821 26,257 24,125 21,333 22,361 24,600 ‐4,924 ‐18.8% 3,267 15.3%
Ham Lake 1,820 3,194 3,619 2,931 3,040 3,344 ‐263 ‐8.2% 413 14.1%
Hilltop 250 257 211 314 381 419 57 22.2% 105 33.5%
Lauderdale 500 360 1,452 718 511 562 358 99.4% ‐156 ‐21.7%
Lexington 630 634 487 467 544 598 ‐167 ‐26.3% 131 28.2%
Lino Lakes 1,229 2,671 3,749 3,313 3,583 3,942 642 24.0% 629 19.0%
Little Canada 4,287 5,960 6,108 5,467 6,572 7,230 ‐493 ‐8.3% 1,763 32.2%
Mounds View 3,142 4,170 3,931 6,386 6,472 7,120 2,216 53.1% 734 11.5%
New Brighton 9,779 11,007 10,211 9,213 8,971 9,869 ‐1,794 ‐16.3% 656 7.1%
North Oaks 370 1,091 966 1,260 1,285 1,414 169 15.5% 154 12.2%
Rosevil le 33,046 39,211 37,887 35,104 37,043 40,752 ‐4,107 ‐10.5% 5,648 16.1%
Shoreview 5,771 9,938 12,961 11,665 11,182 12,302 1,727 17.4% 637 5.5%
Spring Lake Park 3,019 4,401 4,037 2,934 2,823 3,106 ‐1,467 ‐33.3% 172 5.9%
St. Anthony 3,650 3,382 3,005 2,983 3,253 3,579 ‐399 ‐11.8% 596 20.0%
Vadnais Heights 3,800 7,164 7,479 6,678 7,245 7,970 ‐486 ‐6.8% 1,292 19.4%
Secondary Market Area 372,143 444,298 443,686 423,546 430,747 466,452 ‐20,752 ‐4.7% 42,906 10.1%
Twin Cities Metro Area 1,272,773 1,607,916 1,598,836 1,544,613 1,597,543 1,729,967 ‐63,303 ‐3.9% 185,354 12.0%
Note: Twin Cities Metro represents the 7‐County planning region
Sources: MN Dept of Employment and Economic Development; Metropolitan Council; Maxfield Research, Inc.
Actual 2000‐2010 2010‐2020
TABLE C‐1
EMPLOYMENT GROWTH TRENDS AND PROJECTIONS
TCAAP SITE MARKET AREA
1990‐2020
Employment Change
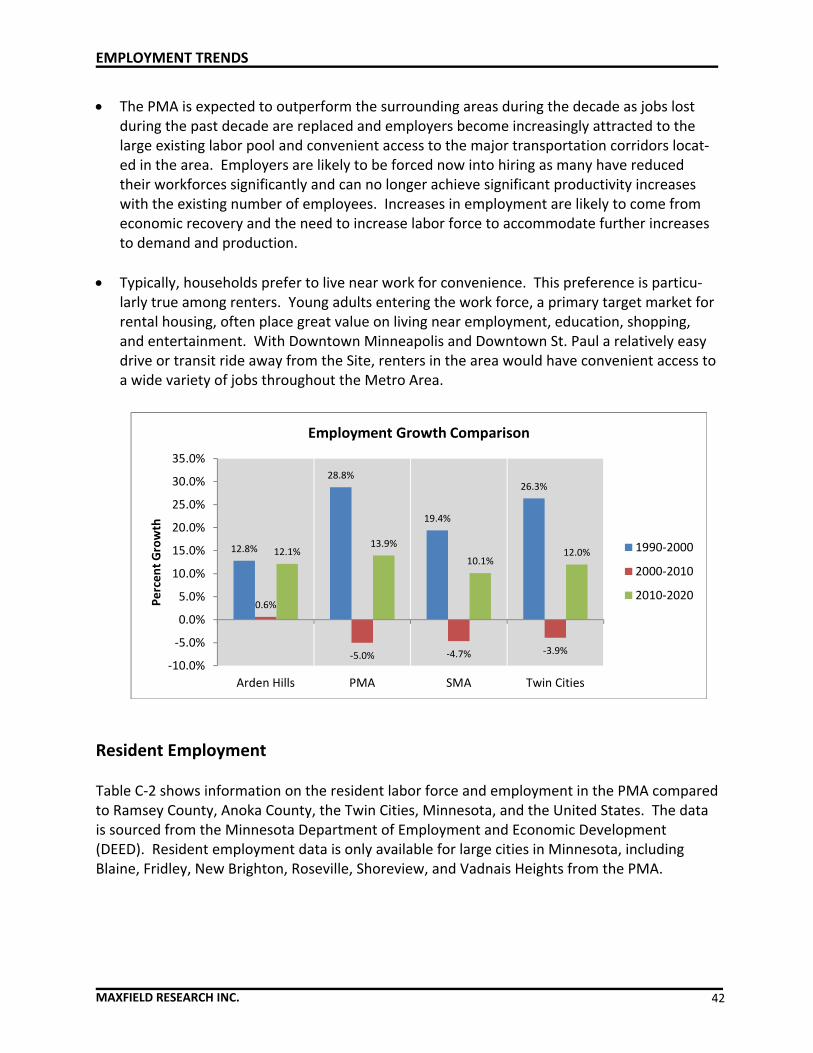
EMPLOYMENT TRENDS
MAXFIELD RESEARCH INC. 42
The PMA is expected to outperform the surrounding areas during the decade as jobs lost during the past decade are replaced and employers become increasingly attracted to the large existing labor pool and convenient access to the major transportation corridors locat‐ed in the area. Employers are likely to be forced now into hiring as many have reduced their workforces significantly and can no longer achieve significant productivity increases with the existing number of employees. Increases in employment are likely to come from economic recovery and the need to increase labor force to accommodate further increases to demand and production.
Typically, households prefer to live near work for convenience. This preference is particu‐larly true among renters. Young adults entering the work force, a primary target market for rental housing, often place great value on living near employment, education, shopping, and entertainment. With Downtown Minneapolis and Downtown St. Paul a relatively easy drive or transit ride away from the Site, renters in the area would have convenient access to a wide variety of jobs throughout the Metro Area.
Resident Employment Table C‐2 shows information on the resident labor force and employment in the PMA compared to Ramsey County, Anoka County, the Twin Cities, Minnesota, and the United States. The data is sourced from the Minnesota Department of Employment and Economic Development (DEED). Resident employment data is only available for large cities in Minnesota, including Blaine, Fridley, New Brighton, Roseville, Shoreview, and Vadnais Heights from the PMA.
12.8%
28.8%
19.4%
26.3%
0.6%
‐5.0% ‐4.7% ‐3.9%
12.1%13.9%
10.1%12.0%
‐10.0%
‐5.0%
0.0%
5.0%
10.0%
15.0%
20.0%
25.0%
30.0%
35.0%
Arden Hills PMA SMA Twin Cities
Percent Growth
Employment Growth Comparison
1990‐2000
2000‐2010
2010‐2020
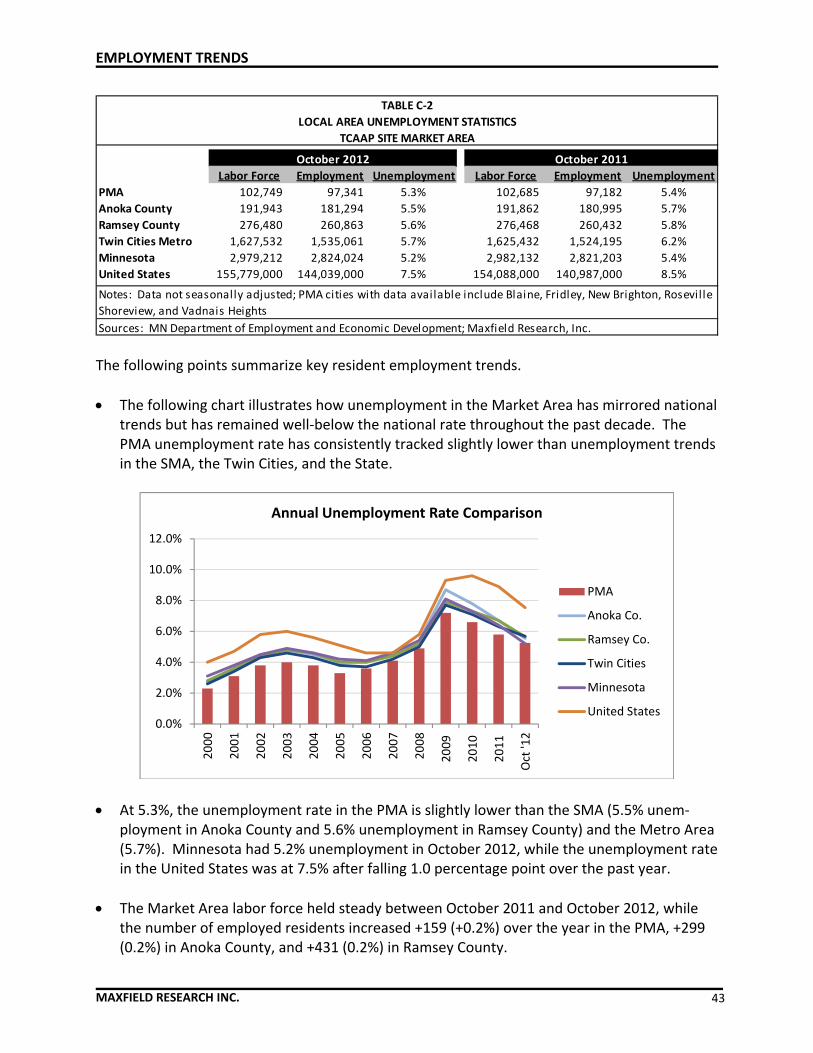
EMPLOYMENT TRENDS
MAXFIELD RESEARCH INC. 43
The following points summarize key resident employment trends.
The following chart illustrates how unemployment in the Market Area has mirrored national trends but has remained well‐below the national rate throughout the past decade. The PMA unemployment rate has consistently tracked slightly lower than unemployment trends in the SMA, the Twin Cities, and the State.
At 5.3%, the unemployment rate in the PMA is slightly lower than the SMA (5.5% unem‐ployment in Anoka County and 5.6% unemployment in Ramsey County) and the Metro Area (5.7%). Minnesota had 5.2% unemployment in October 2012, while the unemployment rate in the United States was at 7.5% after falling 1.0 percentage point over the past year.
The Market Area labor force held steady between October 2011 and October 2012, while the number of employed residents increased +159 (+0.2%) over the year in the PMA, +299 (0.2%) in Anoka County, and +431 (0.2%) in Ramsey County.
Labor Force Employment Labor Force Employment
PMA 102,749 97,341 5.3% 102,685 97,182 5.4%
Anoka County 191,943 181,294 5.5% 191,862 180,995 5.7%
Ramsey County 276,480 260,863 5.6% 276,468 260,432 5.8%
Twin Cities Metro 1,627,532 1,535,061 5.7% 1,625,432 1,524,195 6.2%
Minnesota 2,979,212 2,824,024 5.2% 2,982,132 2,821,203 5.4%
United States 155,779,000 144,039,000 7.5% 154,088,000 140,987,000 8.5%
Sources: MN Department of Employment and Economic Development; Maxfield Research, Inc.
Unemployment Unemployment
Notes: Data not seasonally adjusted; PMA cities with data available include Blaine, Fridley, New Brighton, Roseville
Shoreview, and Vadnais Heights
TABLE C‐2
LOCAL AREA UNEMPLOYMENT STATISTICS
TCAAP SITE MARKET AREA
October 2012 October 2011
0.0%
2.0%
4.0%
6.0%
8.0%
10.0%
12.0%
2000
2001
2002
2003
2004
2005
2006
2007
2008
2009
2010
2011
Oct '12
Annual Unemployment Rate Comparison
PMA
Anoka Co.
Ramsey Co.
Twin Cities
Minnesota
United States

EMPLOYMENT TRENDS
MAXFIELD RESEARCH INC. 44
Employment in the Twin Cities grew by 0.7% (+10,866). Minnesota’s labor force declined by ‐0.1% while employment increased by 0.1%. Employment growth in the United States out‐paced the local markets, increasing 2.2% against labor force growth of 1.1%.
Covered Employment by Industry Table C‐3 on the following page displays information on the employment and wage situation in Arden Hills compared to the PMA and the Twin Cities Metro Area. The Quarterly Census of Employment and Wages (QCEW) data is sourced from the Minnesota DEED for the second quarters of 2011 and 2012, which is the most recent data available. All establishments covered under the Unemployment Insurance (UI) Program are required to report wage and employment statistics quarterly to Minnesota DEED. Federal government establishments are also covered by the QCEW program. Certain industries in the table do not display any information which means that there is either no reported economic activity for that industry or the data has been suppressed to protect the confidentiality of cooperating employ‐ers. This generally occurs when there are too few employers or one employer comprises too much of the employment in that geography. The following are key trends derived from Table C‐3.
There were 12,641 jobs in Arden Hills in the second quarter of 2012 which represents an employment to resident ratio of 1.30, compared to 0.52 in the PMA and 0.55 in the Twin Cities Metro Area.
The Professional and Business Services industry is the largest employment sector in Arden Hills, providing 4,409 jobs (34.9% of total employment).
In the PMA, the Trade, Transportation and Utilities sector is the largest employer with 35,431 jobs (22.1% of total employment).
Education and Health Services is the largest employment sector in the Metro Area, provid‐ing 359,614 jobs (22.5% of total employment).
Within Arden Hills, the Manufacturing industry provides the second highest number of jobs with 29.9% of the total (3,785 jobs) while 18.0% of all PMA jobs and 10.1% of all jobs in the Twin Cities are in the Manufacturing sector.
Average weekly wages in Arden Hills ($1,178) are higher than the PMA ($932) and the Twin Cities ($1,021). Wages experienced little change over the past year, dropping ‐0.7% in Ar‐den Hills and ‐1.9% in the PMA while increasing +0.3% in the Twin Cities.

EMPLOYMENT TRENDS
MAXFIELD RESEARCH INC. 45
IndustryEstablish‐
ments
Employ‐
ment
Weekly
Wage
Establish‐
ments
Employ‐
ment
Weekly
Wage
Total, All Industries 313 11,703 $1,186 310 12,641 $1,178 938 8.0% ($8) ‐0.7%
Natural Resources & Mining ‐‐ ‐‐ ‐‐ ‐‐ ‐‐ ‐‐ ‐‐ ‐‐ ‐‐ ‐‐
Construction 13 78 $844 13 52 $979 ‐26 ‐33.3% $135 16.0%
Manufacturing 27 3,881 $1,571 27 3,785 $1,462 ‐96 ‐2.5% ($109) ‐6.9%
Trade, Transportation, Util ities 57 743 $939 52 684 $1,080 ‐59 ‐7.9% $141 15.0%
Information 9 360 $2,162 8 379 $2,742 19 5.3% $580 26.8%
Financial Activities 43 741 $1,191 43 738 $1,381 ‐3 ‐0.4% $190 16.0%
Professional & Business Services 76 3,264 $1,109 80 4,409 $1,069 1,145 35.1% ($40) ‐3.6%
Education & Health Services 24 1,956 $756 23 1,953 $772 ‐3 ‐0.2% $16 2.1%
Leisure & Hospitality 30 456 $269 30 407 $268 ‐49 ‐10.7% ($1) ‐0.4%
Other Services 27 98 $619 27 111 $600 13 13.3% ($19) ‐3.1%
Public Administration 7 122 $648 7 119 $978 ‐3 ‐2.5% $330 50.9%
Total, All Industries 8,264 157,699 $950 8,314 160,396 $932 2,697 1.7% ($18) ‐1.9%
Natural Resources & Mining 11 73 $506 11 73 $475 0 0.0% ($30) ‐6.0%
Construction 467 2,923 $951 465 2,787 $915 ‐136 ‐4.7% ($36) ‐3.8%
Manufacturing 699 28,755 $1,421 679 28,919 $1,392 164 0.6% ($29) ‐2.0%
Trade, Transportation, Util ities 1,927 33,989 $780 1,932 35,431 $777 1,442 4.2% ($3) ‐0.4%
Information 89 2,975 $1,538 93 3,221 $1,455 246 8.3% ($83) ‐5.4%
Financial Activities 699 6,688 $934 647 5,435 $1,005 ‐1,253 ‐18.7% $72 7.7%
Professional & Business Services 1,402 21,562 $1,063 1,400 23,246 $1,008 1,684 7.8% ($55) ‐5.2%
Education & Health Services 872 28,992 $863 908 29,904 $863 912 3.1% $0 0.0%
Leisure & Hospitality 697 13,784 $310 735 14,535 $314 751 5.4% $4 1.2%
Other Services 502 3,637 $593 508 3,895 $544 258 7.1% ($49) ‐8.2%
Public Administration 73 4,690 $969 75 3,784 $906 ‐906 ‐19.3% ($63) ‐6.5%
Total, All Industries 79,994 1,571,947 $1,018 80,873 1,597,543 $1,021 25,596 1.6% $3 0.3%
Natural Resources & Mining 275 4,650 $595 289 4,754 $661 104 2.2% $66 11.1%
Construction 6,928 51,901 $1,086 6,978 54,071 $1,129 2,170 4.2% $43 4.0%
Manufacturing 4,272 160,226 $1,248 4,235 161,907 $1,230 1,681 1.0% ($18) ‐1.4%
Trade, Transportation, Util ities 16,567 297,264 $874 16,597 299,621 $863 2,357 0.8% ($11) ‐1.3%
Information 1,481 40,927 $1,361 1,466 40,782 $1,302 ‐145 ‐0.4% ($59) ‐4.3%
Financial Activities 9,275 132,155 $1,404 9,200 135,221 $1,474 3,066 2.3% $70 5.0%
Professional & Business Services 15,910 258,541 $1,381 16,082 264,831 $1,343 6,290 2.4% ($38) ‐2.8%
Education & Health Services 9,319 352,786 $919 9,647 359,614 $941 6,828 1.9% $22 2.4%
Leisure & Hospitality 6,862 153,938 $382 7,066 156,951 $392 3,013 2.0% $10 2.6%
Other Services 7,682 53,323 $572 7,932 54,027 $586 704 1.3% $14 2.4%
Public Administration 1,241 66,154 $1,054 1,231 65,553 $1,062 ‐601 ‐0.9% $8 0.8%
Sources: Minnesota Department of Employment and Economic Development; Maxfield Research, Inc.
TWIN CITIES
* Twin Cities Planning Region: Anoka, Carver, Dakota, Hennepin, Ramsey, Scott, and Washington Counties
ARDEN HILLS
PRIMARY MARKET AREA
TABLE C‐3
QUARTERLY CENSUS OF EMPLOYMENT AND WAGES
TCAAP SITE MARKET AREA
Employment
# %
Wage
# %
Change 2011 ‐ 20122012 Q22011 Q2

EMPLOYMENT TRENDS
MAXFIELD RESEARCH INC. 46
0.0% 5.0% 10.0% 15.0% 20.0% 25.0% 30.0% 35.0% 40.0%
Natural Resources & Mining
Construction
Manufacturing
Trade, Transportation, Utilities
Information
Financial Activities
Professional & Business Services
Education & Health Services
Leisure & Hospitality
Other Services
Public Administration
2012 Q2 Average Employment: Percent of Total
Arden Hills
PMA
Twin Cities
$‐ $500 $1,000 $1,500 $2,000 $2,500 $3,000
Total, All Industries
Natural Resources & Mining
Construction
Manufacturing
Trade, Transportation, Utilities
Information
Financial Activities
Professional & Business Services
Education & Health Services
Leisure & Hospitality
Other Services
Public Administration
2012 Q2 Average Weekly Wage
Arden Hills
PMA
Twin Cities

EMPLOYMENT TRENDS
MAXFIELD RESEARCH INC. 47
Commuting Patterns of Area Workers Proximity to employment is often a primary consideration when choosing where to live, par‐ticularly for younger and lower income households since transportation costs often account for a greater proportion of their budgets. Table C‐4 highlights the commuting patterns of workers in Arden Hills in 2010, based on data from the U.S. Census Bureau.
As the table illustrates, only 7.1% of the workers living in Arden Hills also have jobs in Arden Hills. The remaining 92.9% commute to other communities, most notably into Minneapolis (19.0%) and St. Paul (13.3%).
Approximately 68% of Arden Hills’ residents travel less than 10 miles to their place of employment, while 5.5% have a commute distance of more than 25 miles. Roughly 27% commute between 10 and 25 miles to their place of work.
Over 98.2% of the workers in Arden Hills reside outside the City, with most commuting from St. Paul (7.5%), Minneapolis (6.7%), Blaine (4.7%), and Shoreview (4.5%).
Place of Employment Count Share Place of Residence Count Share
Minneapolis city, MN 735 19.0% St. Paul city, MN 1,122 7.5%
St. Paul city, MN 515 13.3% Minneapolis city, MN 998 6.7%
Rosevil le city, MN 281 7.3% Blaine city, MN 695 4.7%
Arden Hills city, MN 273 7.1% Shoreview city, MN 666 4.5%
Shoreview city, MN 179 4.6% Coon Rapids city, MN 433 2.9%
Bloomington city, MN 122 3.2% Woodbury city, MN 394 2.6%
Maplewood city, MN 107 2.8% Brooklyn Park city, MN 364 2.4%
New Brighton city, MN 96 2.5% Rosevil le city, MN 321 2.1%
Fridley city, MN 93 2.4% Lino Lakes city, MN 297 2.0%
Golden Valley city, MN 75 1.9% New Brighton city, MN 281 1.9%
All Other Locations 1,394 36.0% All Other Locations 9,368 62.7%
Distance Traveled Count Share Distance Traveled Count Share
Less than 10 miles 2,623 67.8% Less than 10 miles 6,299 42.2%
10 to 24 miles 1,035 26.7% 10 to 24 miles 6,144 41.1%
25 to 50 miles 73 1.9% 25 to 50 miles 1,369 9.2%
Greater than 50 miles 139 3.6% Greater than 50 miles 1,127 7.5%
Work Destination = Where Workers are Employed Who Live in the Selection Area
Home Destination = Where Workers Live Who are Employed in the Selection Area
Sources: US Census Bureau Local Employment Dynamics, Maxfield Research, Inc.
Work Destination Home Destination
TABLE C‐4
2010
CITY OF ARDEN HILLS
COMMUTING PATTERNS

EMPLOYMENT TRENDS
MAXFIELD RESEARCH INC. 48
Approximately 42% of the workers in Arden Hills reside within 10 miles of their place of employment while nearly 17% travel greater than 25 miles. Roughly 41% of Arden Hills’ workers commute from a distance of 10 to 24 miles.
Table C‐5 provides a summary of the inflow and outflow characteristics of the workers in Arden Hills. Outflow reflects the number of workers living in the City but employed outside Arden Hills while inflow measures the number of workers that are employed in Arden Hills but live outside the City. Interior flow reflects the number of workers that both live and work in Arden Hills.
As the table shows, Arden Hills is a strong importer of workers as a significantly higher number of nonresidents commute into the City for work. Over 14,600 workers come into Arden Hills for employment while nearly 3,600 leave. Arden Hills experiences Net Job In‐flow of 11,069.
Most of the workers coming into Arden Hills are aged 30 to 54 and earn more than $3,333 per month. The “All Other Services” sector brings in the most employees (56.4%) while “Goods Producing” industries bring in 25.8% of the workers in Arden Hills.
Most of the workers leaving Arden Hills for employment are also in the 30 to 54 age group (51.0%) and earn more than $3,333 per month (51.4%).
Arden Hills Total 3,597 100% 14,666 100% 273 100%
By Age
Workers Aged 29 or younger 798 22.2% 2,717 18.5% 52 19.0%
Workers Aged 30 to 54 1,835 51.0% 9,685 66.0% 151 55.3%
Workers Aged 55 or older 964 26.8% 2,264 15.4% 70 25.6%
By Monthly Wage
Workers Earning $1,250 per month or less 841 23.4% 1,653 11.3% 76 27.8%
Workers Earning $1,251 to $3,333 per month 908 25.2% 3,389 23.1% 82 30.0%
Workers Earning More than $3,333 per month 1,848 51.4% 9,624 65.6% 115 42.1%
By Industry
"Goods Producing" 469 13.0% 3,779 25.8% 34 12.5%
"Trade, Transportation, and Util ities" 533 14.8% 2,615 17.8% 40 14.7%
"All Other Services" 2,595 72.1% 8,272 56.4% 199 72.9%
Sources: US Census Bureau Local Employment Dynamics, Maxfield Research, Inc.
Outflow Inflow Interior Flow
TABLE C‐5
COMMUTING INFLOW/OUTFLOW CHARACTERISTICS
2010

HOUSING MARKET ANALYSIS
MAXFIELD RESEARCH INC. 49
Introduction This section of the report presents an overview of the supply of housing in the Market Area as it relates to the TCAAP Site. Included are reviews of residential construction trends, rental rate and vacancy trends among general‐occupancy apartments, residential sales trends, and de‐mand calculations of market rate general‐occupancy apartments, and for‐sale housing.
Residential Construction Trends Based on building permit data obtained from the Metropolitan Council, the following table presents the number of housing units added in Arden Hills and the remainder of the PMA between 2000 and 2011.
The total number of units permitted declined steadily from 2005 to 2009 after reaching a peak of 2,469 units in the PMA in 2004. The sharpest year‐over‐year drop in permitting oc‐curred in 2006 when the number of units permitted in the PMA declined ‐833 (‐47.7%) to 912 units permitted. Residential construction activity experienced another sharp drop in 2008 as the number of units declined from 850 in 2007 to 435, for a ‐48.8% decline.
Residential construction activity in Arden Hills has remained relatively steady over the years, averaging four new units per year. This data does not include construction activity at Fox Ridge, a 39‐unit subdivision by Pulte Homes that was approved in 2011 and nearly fully built‐out during 2012.
SFD TH MF TOTAL SFD TH MF TOTAL SFD TH MF TOTAL
2000 5 0 0 5 1,053 448 157 1,658 1,058 448 157 1,663
2001 5 0 0 5 1,059 231 194 1,484 1,064 231 194 1,489
2002 4 0 0 4 968 395 417 1,780 972 395 417 1,784
2003 5 0 0 5 857 503 583 1,943 862 503 583 1,948
2004 5 0 0 5 939 394 1,131 2,464 944 394 1,131 2,469
2005 3 0 0 3 681 355 706 1,742 684 355 706 1,745
2006 8 0 0 8 509 350 45 904 517 350 45 912
2007 3 0 0 3 399 98 350 847 402 98 350 850
2008 2 0 0 2 191 103 139 433 193 103 139 435
2009 4 0 0 4 310 39 68 417 314 39 68 421
2010 0 0 0 0 358 109 64 531 358 109 64 531
2011 4 0 0 4 348 106 300 754 352 106 300 758
Notes: SFD = Single Family Detached; TH = Townhome; MF = Multifamily (duplex, triplex, and 4+ units)
Sources: Metropolitan Council; Maxfield Research, Inc.
TABLE D‐1
RESIDENTIAL BUILDING PERMIT TRENDS
2000 ‐ 2011
Arden Hills Remainder of PMA PMA Total

HOUSING MARKET ANALYSIS
MAXFIELD RESEARCH INC. 50
The residential construction industry appears to be recovering, as the number of units permitted increased for two consecutive years in the PMA, climbing 26.1% to 531 units in 2010 and jumping 42.7% to 758 units in 2011.
Detached single‐family homes have been the most common housing type developed in the PMA since 2000, representing 51.4% of all units permitted. Multifamily units represented 27.7% of all residential construction activity while townhomes represented 20.9% of all units permitted.
From 2000 to 2011, single‐family detached construction activity declined ‐67% from 1,058 units in 2000 to 352 units permitted in 2011 while townhome building dropped ‐76% (from 448 units to 106).
After declining to 64 units permit‐ted in 2010, multifamily construc‐tion activity jumped in 2011 with 300 units permitted, up 91% from 2000 as an apartment building boom began adding multifamily units throughout the Metro Area.
0
500
1,000
1,500
2,000
2,500
3,000
2000 2001 2002 2003 2004 2005 2006 2007 2008 2009 2010 2011
Units Perm
itted
Residential Building PermitsTCAAP Site PMA
Multifamily
Townhome
Single‐Family Detached
Single‐Family
Detached7,720
Townhome3,131
Multifamily4,154
Residential Units Permitted in the PMA2000‐2011

HOUSING MARKET ANALYSIS
MAXFIELD RESEARCH INC. 51
As depicted in Table D‐2, the City of Blaine experienced the highest residential building permit activity between 2000 and 2011, with 6,517 units permitted (43% of the PMA total). Lino Lakes and Ham Lake were a distant second and third with 1,545 units (10%) and 1,202 units (8%), respectively.
While Blaine experienced the largest number of multifamily building activity between 2000 and 2011 with 1,069 units, multifamily units represented only 16% of all units permitted during that time period.
The fully‐developed communities experienced a much higher proportion of multifamily building activity. In St. Anthony, 521 multifamily units were permitted which represented 93% of all units. Similar activity occurred in Falcon Heights (91%), New Brighton (87%), and Roseville (75%).
SFD TH MF TOTAL
Primary Market Area 7,720 3,131 4,154 15,005
Arden Hills 48 0 0 48
Blaine 3,974 1,474 1,069 6,517
Centervil le 256 6 31 293
Circle Pines 55 213 148 416
Columbia Heights 61 292 273 626
Columbus 127 0 0 127
Falcon Heights 0 18 175 193
Fridley 67 78 118 263
Ham Lake 1,023 111 68 1,202
Hilltop 0 0 0 0
Lauderdale 3 0 0 3
Lexington 21 12 0 33
Lino Lakes 1,121 362 62 1,545
Little Canada 118 52 132 302
Mounds View 54 32 38 124
New Brighton 45 17 426 488
North Oaks 227 9 192 428
Rosevil le 155 73 669 897
Shoreview 207 225 68 500
Spring Lake Park 18 58 25 101
St. Anthony 29 12 521 562
Vadnais Heights 111 87 139 337
Sources: Metropolitan Council; Maxfield Research, Inc.
TABLE D‐2
RESIDENTIAL UNITS PERMITTED BY CITY
TCAAP SITE PRIMARY MARKET AREA
2000 ‐ 2011
Notes: SFD = Single Family Detached; TH = Townhome; MF = Multifamily
(duplex, triplex, and 4+ units)

HOUSING MARKET ANALYSIS
MAXFIELD RESEARCH INC. 52
Overview of Rental Market Conditions The following points analyze the current market conditions for general occupancy rental housing in the TCAAP Site Market Area. Detailed information on individual rental develop‐ments planned or under construction in the Market Area is also presented. Average monthly rent and vacancy rate data from Marquette Advisors Apartment Trends report is shown for the Arden Hills/Shoreview submarket, a combination of other submarkets compris‐ing the PMA, and the Twin Cities Metro Area in Table D‐3. Other PMA communities include: Blaine, Falcon Heights/Lauderdale, Fridley/Columbia Heights, Little Canada, Mounds View/Spring Lake Park, New Brighton, Roseville, St. Anthony, and Vadnais Heights. The data is shown for the 3rd Quarter of 2012 compared to the 3rd Quarter of 2011. The following are key points concerning the Market Area’s rental market.
The equilibrium vacancy rate for rental housing is considered to be 5.0%. This allows for normal turnover and an adequate supply of alternatives for prospective renters. During the 3rd Quarter 2012, the vacancy rate was 2.7% in the Twin Cities Metro Area. The Arden Hills/Shoreview submarket had a vacancy rate of 3.2% while the other PMA communities had a vacancy rate of 2.5%. In effect, the overall supply of rental housing in the Market Ar‐ea is below the adequate level to meet demand.
As illustrated in the preceding chart, studio units have the highest vacancy rate in Arden Hills/Shoreview at 6.5% while being 1.9% vacant in the other PMA communities and 2.2% vacant throughout the Twin Cities Metro Area.
0.0%
2.0%
4.0%
6.0%
8.0%
10.0%
12.0%
Total Studio 1 BR 1 BRw/Den
2 BR 2 BR w/Den
3 BR 3 BR/D or 4BR
Vacan
cy
‐‐‐Unit Type‐‐‐
TCAAP Site Market AreaAverage Vacancy Rate by Unit Type
Arden Hills/Shoreview
Other PMA Communities
Twin Cities Metro Area

HOUSING MARKET ANALYSIS
MAXFIELD RESEARCH INC. 53
One‐bedroom units have a vacancy rate of 3.1% in Arden Hills/Shoreview and two‐bedroom units are 2.6% vacant. There is one three‐bedroom vacancy in Arden Hills/Shoreview, rep‐resenting a 3.1% vacancy rate. Total vacancy increased 1.4 percentage points over the past year, from 1.9% in the third quarter of 2011 to 3.2% in 2012.
In the other PMA communities, one‐bedroom units are 2.3% vacant while units with one bedroom and a den are 1.4% vacant. Two‐bedroom units have a 2.8% vacancy rate and three‐bedroom units are 1.0% vacant. Total vacancy climbed 0.2 percentage points over the year, from 2.3% to 2.5%. Some of this vacancy increase can be attributed to the recent‐ly completed The View Apartments at Long Lake in New Brighton. The Twin Cities experi‐enced a 0.4 percentage point vacancy increase over the year from 2.3% to 2.7%.
Average monthly rents increased 2.8% over the year to $951 across the Twin Cities Metro Area. Arden Hills/Shoreview experienced a 1.4% gain in monthly rents over the year to $874 while rents in the other PMA communities jumped 4.0% to $854.
Within the other PMA communities, average rental rates range from $625 for studio units in New Brighton to $1,690 for three‐bedroom units in St. Anthony. Rents range from $692 for a studio unit to $1,393 for three‐bedroom units in Arden Hills/Shoreview.
At $874, the average monthly rent in Arden Hills/Shoreview is 8.1% lower than the Twin Cities average. The average rent of $854 across the other PMA communities is 10.2% lower than the Metro average and 2.3% lower than Arden Hills/Shoreview.
$‐
$200
$400
$600
$800
$1,000
$1,200
$1,400
$1,600
$1,800
Total Studio 1 BR 1 BRw/Den
2 BR 2 BR w/Den
3 BR 3 BR/D or 4BR
Rent
‐‐‐Unit Type‐‐‐
TCAAP Site Market AreaAverage Monthly Rent by Unit Type
Arden Hills/Shoreview
Other PMA Communities
Twin Cities Metro Area

HOUSING MARKET ANALYSIS
MAXFIELD RESEARCH INC. 54
The following chart illustrates how the general‐occupancy apartment market is recovering after struggling with rapidly rising vacancy rates between the first quarter of 2008 and the first quarter of 2010.
The recent market tightening can be attributed to a growing group of foreclosed homeown‐ers in the rental market and traditional renters, who are potential home‐owners, staying in the rental market longer due to the uncertainty of housing prices.
According to the Marquette Advisors, 2010 was a record year, with metro absorption totaling more than 6,400 units. A total of 2,320 units was absorbed in 2011, and 1,164 units were absorbed during the first three quarters of 2012. This slower absorption can be at‐tributed, in large part, to the tight inventory.
As apartment market fundamentals have improved significantly over the past two years, development activity is gaining steam. Apartment development is at a ten‐year high in the Twin Cities, with numerous projects either under construction or in the development pipe‐line. According to Marquette Advisors, approximately 1,240 unit deliveries are expected in 2012 with another nearly 2,000 units expected to come online in 2013.
$841 $847 $850 $855 $876 $908 $908 $901 $916 $935 $951
6.5%
7.4%6.9%
5.5%
4.4%3.9%
4.9%
6.1%
3.1%2.8% 2.7%
$750
$800
$850
$900
$950
$1,000
0.0%
1.0%
2.0%
3.0%
4.0%
5.0%
6.0%
7.0%
8.0%
9.0%
10.0%
2003 2004 2005 2006 2007 2008 2009 2010 2011 2012 2012q3
Average Ren
t
Vacancy Rate
Twin Cities Metro Area Apartment Vacancy vs. Rent1st Quarter of Each Year
Rent Vacancy

HOUSING MARKET ANALYSIS
MAXFIELD RESEARCH INC. 55
1 BR 2 BR 3 BR/D Average
Total Studio 1 BR w/ Den 2 BR w/ Den 3 BR or 4BR Increase
Units 1,023 77 540 ‐‐ 378 ‐‐ 28 ‐‐ ‐‐
No. Vacant 19 0 13 ‐‐ 6 ‐‐ 0 ‐‐ ‐‐
Avg. Rent $859 $693 $777 ‐‐ $963 ‐‐ $1,382 ‐‐ 2.6%
Vacancy 1.9% 0.0% 2.4% ‐‐ 1.6% ‐‐ 0.0% ‐‐ ‐3.3%
Units 1,027 77 540 ‐‐ 378 ‐‐ 32 ‐‐ ‐‐
No. Vacant 33 5 17 ‐‐ 10 ‐‐ 1 ‐‐ ‐‐
Avg. Rent $874 $692 $766 ‐‐ $1,014 ‐‐ $1,393 ‐‐ 1.7%
Vacancy 3.2% 6.5% 3.1% ‐‐ 2.6% ‐‐ 3.1% ‐‐ 1.4%
Units 9,575 208 4,226 172 4,449 13 507 ‐‐ ‐‐
No. Vacant 224 4 86 5 105 1 23 ‐‐ ‐‐
Avg. Rent $822 $620 $729 $926 $885 $1,273 $1,104 ‐‐ 3.1%
Vacancy 2.3% 1.9% 2.0% 2.9% 2.4% 7.7% 4.5% ‐‐ ‐2.3%
Units 10,562 216 4,709 69 5,090 ‐‐ 478 ‐‐ ‐‐
No. Vacant 261 4 110 1 141 ‐‐ 5 ‐‐ ‐‐
Avg. Rent $854 $631 $758 $953 $924 ‐‐ $1,164 ‐‐ 4.0%
Vacancy 2.5% 1.9% 2.3% 1.4% 2.8% ‐‐ 1.0% ‐‐ 0.1%
Units 107,739 5,055 47,147 2,214 46,130 1,009 5,893 291 ‐‐
No. Vacant 2,518 112 989 63 1,133 32 183 6 ‐‐
Avg. Rent $925 $692 $803 $1,116 $1,004 $1,440 $1,285 $1,655 2.3%
Vacancy 2.3% 2.2% 2.1% 2.8% 2.5% 3.2% 3.1% 2.1% ‐1.8%
Units 111,204 5,318 48,863 2,217 47,493 1,097 5,955 261 ‐‐
No. Vacant 2,977 119 1,188 77 1,325 53 199 16 ‐‐
Avg. Rent $951 $710 $828 $1,157 $1,033 $1,478 $1,309 $1,693 2.8%
Vacancy 2.7% 2.2% 2.4% 3.5% 2.8% 4.8% 3.3% 6.1% 0.4%
Sources: GVA Marquette Advisors; Maxfield Research Inc.
*Other PMA Communities include the following City groupings as established by GVA: Blaine, Falcon
Heights/Lauderdale, Fridley/Columbia Heights, Little Canada, Mounds View/Spring Lake Park, New Brighton, Rosevil le,
St. Anthony, Vadnais Heights
TABLE D‐3
AVERAGE RENTS/VACANCIES TRENDS
TCAAP SITE MARKET AREA
3rd Quarter 2011 through 3rd Quarter 2012
Q3/2012
Q3/2011
Q3/2012
TWIN CITIES METRO AREA
Q3/2011
ARDEN HILLS/SHOREVIEW
Q3/2011
Q3/2012
OTHER PMA COMMUNITIES*

HOUSING MARKET ANALYSIS
MAXFIELD RESEARCH INC. 56
Pending Rental Developments Maxfield Research interviewed planning and community development staff in the Market Area to identify any new rental developments that are proposed, planned or under construction that may be competitive with a possible development on the subject property. Table D‐4 lists pending apartment developments in the Primary Market Area with their loca‐tion, number of units, and name of developer, if known. There five pending projects with a combined total of 453 units in the PMA.
Parkside Village Townhomes in Vadnais Heights was originally proposed as an owner‐occupied townhome development. However, due to slow sales activity, the project was changed to a renter‐occupied development. When completed, this project will consist of 35 rental units divided between 20 one‐, two‐, and three‐unit buildings.
Originally approved as a 55‐unit workforce rental project, revised plans to change the Arden Village development into a project containing 56 market rate units and four affordable units were approved by the City of Arden Hills in December 2012. According to the City, con‐struction is expected to begin in the spring of 2013.
Area/Name/Address# of
UnitsType Developer Status
Construction
Start
Parkside Village Townhomes 35 Market Rate Southpoint Ridge Under 2011
Berwood Ave and Arcade St Construction
Vadnais Heights
Arden Village 56 Market Rate Sand Companies Approved Spring 2013
1296 County Rd F 4 Affordable (est)
Arden Hills
Arden Place 75 Market Rate TAT Properties Approved Spring 2013
1201 County Rd E (est)
Arden Hills
Midland Terrace 104 Market Rate Tycon Properties Approved Spring 2013
3588 Owasso St (est)
Shoreview
Ulysses St Project 179 Market Rate Oppidan Proposed Summer 2013
9422 Ulysses St (est)
Blaine
PMA Total: 453
Sources: City planning staff; Maxfield Research Inc.
TABLE D‐4
PENDING MARKET RATE RENTAL DEVELOPMENTS
TCAAP SITE PRIMARY MARKET AREA
December 2012

HOUSING MARKET ANALYSIS
MAXFIELD RESEARCH INC. 57
The owners of the former Holiday Inn at 1201 County Road E in Arden Hills received ap‐proval to convert the property into 75 market rate apartment units and 20,000 square feet of specialty retail space. Marketing of the Arden Place apartment units will be targeted to students at nearby colleges. Construction is expected to begin in spring 2013.
The City of Shoreview recently approved Tycon Properties plan to develop a new six‐story 104‐unit market rate apartment project on the Midland Terrace site. As proposed, the pro‐ject will consist of 70% one‐bedroom units, 20% two‐bedroom units, along with some studio and one‐bedroom plus den units.
Oppidan has shared conceptual plans with the City of Blaine for a 179‐unit market rate apartment project at 9422 Ulysses Street. A formal application for approval has not yet been submitted to the City at the time this report was written, but it is expected to be sub‐mitted soon.
Demand for rental housing has increased because of more people in the rental market than would have otherwise been the case if the for‐sale market had not declined. Also, population growth has occurred among the echo boom generation (20 to 34 year olds), the primary age for renters. Job growth is occurring and the Twin Cities 7‐County Metro Area unemployment rate decreased to 5.7% as of October 2012 from 6.2% the previous year after employment increased by nearly 11,000 while the number of people in the labor force held steady. The ability to support a significant number of new rental units in the market will rely on the following situa‐tions:
Prospects continuing to prefer rentals over homeownership;
More robust job growth; and,
Continued skepticism about the long‐term appreciation of for‐sale housing.
Rental Housing Demand Analysis This section of the report calculates demand for market rate general occupancy rental housing in the TCAAP Site Market Area and assesses the potential for the subject property to capture a portion of demand. Factors considered include site location, competitiveness of existing nearby rental properties, pending developments, demographic trends and population shifts, and the overall image and popularity of Arden Hills as a residential location. Table D‐5 presents our calculation of market rate rental housing demand for the subject prop‐erty. A portion of the demand for a project on the Site will be drawn from existing households in the PMA that want to upgrade their housing situations. Because of the Site’s close proximity to the major employment centers in Downtown Minneapolis and Downtown St. Paul, the methodology also accounts for a portion of the demand drawn from the Secondary Market Area (portions of Anoka County and Ramsey County outside the PMA). A third component of

HOUSING MARKET ANALYSIS
MAXFIELD RESEARCH INC. 58
demand will be drawn from outside of the Primary and Secondary Market Areas from house‐holds that will choose to locate in the PMA for various reasons, such as a job transfer from out of state. For both the Primary and Secondary Market Areas, potential demand is calculated from two categories:
1. From new household growth by age group based on the propensity of households to rent their housing in the Market Area; and,
2. From existing households that will remain in the Market Area because new product is
available and they value other amenities including easy access to major employment centers, entertainment and cultural opportunities.
First, we calculate potential demand from new income‐qualified household growth over the next five years by age group based on the propensity of households to rent their housing in the PMA and SMA. For the purposes of our analysis, we focus on households between the ages of 18 and 64 that will account for the vast majority of rental demand at the proposed project, plus a small percentage of seniors over the age of 65. The propensity to rent or own is based on Census Bureau 2010 figures by age cohort. For market rate housing, household incomes must equal or exceed $47,000 in order to afford the average rent of new one‐bedroom rental units in the Twin Cities. The second part of our analysis calculates demand from existing households, or turnover demand. Younger households tend to be highly mobile, relative to older households. The youngest households are generally unable to afford rents at the top of the market unless they receive assistance from their parents or desire a roommate. Mobility rates were identified by age group (utilizing Census data). In addition, we calculate the proportion of these households that would seek new general occupancy multifamily housing versus renting at older properties and apply these proportions to the income‐qualified household market turning over. Similar calculations were completed for households that reside in the Secondary Market Area, along with a potential capture rate of households from the SMA to the PMA. As shown on the table, between 5% and 10% of overall market demand in the SMA, depending on the age group, is considered capturable by a site in the PMA. These proportions are based on the overall size and location of the PMA and our knowledge of the typical resident profile of area apartment communities. Together with demand from projected household growth and turnover, the total demand for PMA and SMA market rate rental housing is summarized. In the PMA, total demand for in‐come‐qualified market rate rental housing over the next five years is 3,341 units while demand from the SMA is 471 units. An additional proportion is added for households that would move to a rental project in the PMA who currently reside outside the PMA or SMA. We estimate that 15% of the demand potential for rental housing in the PMA would be derived from outside the PMA/SMA, increasing demand to 4,485 units.

HOUSING MARKET ANALYSIS
MAXFIELD RESEARCH INC. 59
PMA SMA PMA SMA PMA SMA PMA SMA PMA SMA
Demand From Household Growth
Projected Income‐Qualifed Household Growth 2012 ‐ 20171
0 0 1,264 2,383 1,130 2,046 2,535 3,880 3,493 3,616
(times) Proportion estimated to be renting their housing2
x 77.3% 89.1% 42.6% 57.7% 23.6% 33.4% 14.6% 20.8% 19.1% 24.1%
(equals) Demand For Rental Housing, 2012 ‐ 2017 = 0 0 538 1,375 267 683 370 807 667 871
Demand From Existing Households
Number of renter households in 2012 3,017 9,502 7,932 20,912 4,818 12,762 7,410 19,998 5,345 10,148
(times) Estimated % Turnover between 2012 & 2017 x 91% 91% 91% 91% 69% 69% 69% 69% 52% 46%
(equals) Total Existing Households Projected to Turnover = 2,745 8,647 7,218 19,030 3,324 8,806 5,113 13,799 2,779 4,668
(times) Percent of Households Income Qualified2
x 41% 32% 65% 57% 76% 68% 75% 68% 45% 40%(equals) Total Number of Income‐Qualified Households = 1,126 879 4,692 4,114 2,527 2,261 3,835 3,477 1,251 1,112
(times) Estimated % Desiring New Rental Housing3
x 16% 16% 16% 16% 16% 16% 16% 16% 16% 16%
(equals) Demand From Existing Households = 180 141 751 658 404 362 614 556 200 178
Total Demand From Household Growth and Existing Households 180 141 1,289 2,033 671 1,045 984 1,363 867 1,049
(times) % Capturable from SMA to PMA4
x ‐‐ 10% ‐‐ 10% ‐‐ 10% ‐‐ 10% ‐‐ 5%
Total Demand in the PMA & SMA = 180 14 1,289 203 671 105 984 136 867 52
Demand Summary
Total Market Area Demand for Rental Housing in PMA & SMA
(plus) Demand from outside PMA/SMA (15%)5
+
(equals) Potential demand for rental housing in the Market Area (2012 to 2017) =
(minus) Approved rental developments in the PMA at equil ibrium ‐
(equals) Excess demand for rental housing in the Market Area (2012 to 2017) =
(times) Percent capturable on Subject Property x 10% ‐ 15%
(equals) Total Demand Capturable on Site = 423 ‐ 634
1 $47,160 in 2012 for Market Rate pricing.
2 Data from U.S. Census Bureau.
3 Source ‐ The Upscale Apartment Market: Trends and Prospects . Prepared by Jack Goodman of Hartrey Advisors for the National Multi Housing Council.
4 Proportions are based on our knowledge of area apartment leasing patterns and the PMA's location within the Market Area.
5 15% of total units to be captured from outside PMA & SMA.
Source: Maxfield Research Inc.
PMA SMA
3,341 471
4,485
673
257
4,228
TABLE D‐5
PROJECTED DEMAND FOR MARKET RATE RENTAL HOUSING
TCAAP SITE MARKET AREA
2012 to 2017
‐‐‐‐‐‐‐‐‐‐‐‐‐‐‐‐‐‐‐‐‐‐‐‐‐‐‐‐ Number of Households ‐‐‐‐‐‐‐‐‐‐‐‐‐‐‐‐‐‐‐‐‐‐‐‐‐‐‐‐
Age 45 to 64 Age 65 & OverAge <25 Age 25 to 34 Age 35 to 44

HOUSING MARKET ANALYSIS
MAXFIELD RESEARCH INC. 60
From the demand potential, we subtract pending developments in the PMA at market equilib‐rium (95% occupancy) to find the remaining excess demand in the Market Area. There are a total of five pending rental projects in the PMA with 453 units. However, because the Oppidan project in Blaine has not yet received approval, we do not include those units in our demand calculations. In addition, we excluded the four affordable units that are planned as part of the Arden Village project. We estimate that a development on the subject property could capture approximately 10% to 15% of the total demand in the Market Area. This capture rate is based on the Site location in the PMA and considers its potential draw from the PMA and SMA. It also accounts for the number and location of other developments that would satisfy demand. We anticipate that the subject property could support approximately 423 to 634 units of new market rate general occupancy rental housing between 2012 and 2017. Multifamily rental housing is a bright spot in the real estate industry today; here in the Twin Cities Metro Area and nationally. The downturn in the housing market and the overall econom‐ic slowdown initially created increased demand for rental housing. With increased home buying due to the tax credit and subsequent increased unemployment, vacancy rates climbed during the 4th Quarter of 2009 and remained relatively high until the 1st Quarter 2010. How‐ever, as of the 2nd Quarter 2010, vacancy rates have decreased and rental traffic has increased according to property managers and leasing personnel. As of 3rd Quarter 2012, the PMA apartment market vacancy rate was at 2.5% while the Twin Cities vacancy rate was 2.7%, both of which were well‐below equilibrium. A vacancy rate under 5.0% indicates pent‐up demand. Apartment development is also at a 20‐year high in the Twin Cities, with numerous projects either under construction or in the development pipeline. The majority of new planned devel‐opment is located in Downtown Minneapolis and the surrounding neighborhoods. New rental properties recently completed or under construction in the Twin Cities are charging rents (on average) from $1.35 per square foot to $2.20 per square foot, depending on the location of the property. Most of the new rental development that has occurred or is currently being devel‐oped in the Twin Cities is located in Southwest Minneapolis, in or near Downtown Minneapolis, St. Paul, or in popular suburban communities such as St. Louis Park, Golden Valley, Blooming‐ton, and Maple Grove. Today’s rental population is also changing. The housing market crash of the Great Recession has pushed the homeownership rate down, resulting in new renters into the market. Home ownership psychology remains fragile as many former owners lost their homes to the foreclo‐sure or sold at a loss. Many first‐time home buyers remain on the fence as they await clearer indication the economy is recovering before deciding to purchase. If mortgage interest rates remain low and job growth continues, prospects will begin to have greater confidence. The low prices of for‐sale homes are encouraging those that want to and are able to move back into the for‐sale market or move into the for‐sale market, especially first‐time homebuyers. Strong demographics from the echo boom generation and a tough lending environment will result in robust rental housing demand over the next several years. The Twin Cities Metro Area contin‐

HOUSING MARKET ANALYSIS
MAXFIELD RESEARCH INC. 61
ues to see more lifestyle renters, those with busy professional lives and people who prefer to spend their free time in leisure pursuits rather than on upkeep and maintenance of a home. In summary, the strongest sources of demand for housing at the subject location will be profes‐sionals in their late‐20s and early‐30s who work in Minneapolis, St. Paul, or in nearby suburban communities. Younger households, those in their early and mid‐20s, will likely account for a smaller portion of demand for housing at the subject development and will be more price sensitive.
Home Sales Tables D‐6 through D‐8 present home sale data from 2007 through November 2012 for the communities comprising the TCAAP Site Market Area. Table D‐6 displays the median sale price and number of closed transactions for all residential sales in the Market Area while Tables D‐7 and D‐8 provide information for single‐family detached residential sales and multifamily resi‐dential sales (includes townhomes and condominiums). This data was obtained from the Minneapolis Area Association of Realtors.
Between 2007 and 2011, the number of home sales in the PMA increased approximately 6.7% with a total of 3,906 closed sales in 2011. The number of single‐family detached sales increased 11.0% while multifamily sale transactions declined ‐5.4%. Through the first 11 months of 2012, sales activity has exceeded the volume of sales in 2011 with a total of 2,901 single‐family detached sales and 1,005 multifamily sales.
With a total of 9,675 sales in 2011, the SMA (Anoka County and Ramsey County) experi‐enced a 9.9% increase in residential sales between 2007 and 2011. Sales activity increased 1.4% across the Twin Cities Metro Area. Similar to the PMA, activity increased in 2012 as the number of sales during the first 11 months of the year exceeded 2011 by 7.8% in the SMA and 8.3% in the Twin Cities.
‐
1,000
2,000
3,000
4,000
5,000
2007 2008 2009 2010 2011 2012 ytd
Residential Sale TransactionsPrimary Market Area
multifamily
single‐familydetached

HOUSING MARKET ANALYSIS
MAXFIELD RESEARCH INC. 62
'07 ‐ '12
Median
Sale Price
# of
Sales
Median
Sale Price
# of
Sales
Median
Sale Price
# of
Sales
Median
Sale Price
# of
Sales
Median
Sale Price
# of
Sales
Median
Sale Price
# of
Sales
% Change
Sale Price
Primary Market Area $232,553 3,257 $206,529 3,119 $180,372 3,545 $180,720 3,079 $157,459 3,474 $175,686 3,906 ‐24.5%
Arden Hills $238,800 77 $262,600 67 $232,250 65 $241,025 54 $157,500 68 $285,500 102 19.6%
Blaine $222,500 730 $194,750 780 $169,900 917 $170,500 818 $154,900 962 $174,000 958 ‐21.8%
Centervil le $230,000 55 $209,000 59 $222,000 40 $180,000 46 $154,600 48 $190,000 53 ‐17.4%
Circle Pines $187,000 65 $171,100 60 $148,750 72 $139,900 53 $124,150 66 $139,450 88 ‐25.4%
Columbia Heights $180,000 220 $145,000 289 $122,500 333 $120,000 257 $101,500 289 $98,000 306 ‐45.6%
Columbus $270,000 23 $262,450 24 $222,000 33 $232,000 12 $177,277 23 $209,200 32 ‐22.5%
Falcon Heights $286,250 34 $280,250 38 $267,500 32 $239,500 30 $207,500 41 $230,412 43 ‐19.5%
Fridley $194,000 252 $160,025 277 $138,900 310 $136,545 200 $120,000 279 $127,500 268 ‐34.3%
Ham Lake $316,000 124 $289,500 115 $235,500 160 $227,500 161 $211,500 156 $225,900 191 ‐28.5%
Hilltop $152,000 2 $51,875 2 $120,000 1 $35,000 2 ‐‐ ‐‐ $24,500 1 ‐83.9%
Lauderdale $183,950 23 $197,000 17 $189,950 22 $173,900 13 $128,150 18 $171,450 16 ‐6.8%
Lexington $158,150 14 $170,000 19 $138,250 16 $130,000 15 $108,563 10 $138,900 15 ‐12.2%
Lino Lakes $262,000 218 $227,700 160 $218,950 201 $211,250 191 $174,200 201 $208,375 222 ‐20.5%
Little Canada $236,900 82 $205,500 69 $175,250 86 $106,500 97 $140,000 113 $163,000 96 ‐31.2%
Mounds View $221,225 105 $175,000 93 $153,000 93 $166,700 74 $134,950 98 $139,000 117 ‐37.2%
New Brighton $224,700 219 $210,000 168 $187,000 185 $178,000 152 $157,500 177 $165,000 246 ‐26.6%
North Oaks $625,000 48 $637,735 43 $475,000 42 $584,000 53 $480,000 51 $505,000 61 ‐19.2%
Roseville $235,000 331 $225,000 283 $198,000 293 $190,000 281 $158,500 310 $187,000 384 ‐20.4%
Shoreview $236,500 317 $222,000 257 $204,950 315 $205,000 290 $180,000 267 $191,000 364 ‐19.2%
Spring Lake Park $195,000 61 $159,000 70 $136,500 86 $131,000 63 $92,250 56 $117,500 103 ‐39.7%
St. Anthony $251,200 122 $220,000 108 $210,000 98 $181,000 82 $178,200 102 $155,000 93 ‐38.3%
Vadnais Heights $201,250 135 $195,900 121 $153,500 145 $165,000 135 $165,000 139 $149,000 147 ‐26.0%
Anoka County $212,110 3,629 $180,000 3,762 $155,000 4,613 $155,000 3,854 $136,900 4,371 $152,000 4,537 ‐28.3%
Ramsey County $209,000 5,171 $174,900 5,126 $144,000 6,303 $145,000 5,043 $125,500 5,304 $141,100 5,890 ‐32.5%
Twin Cities Metro $225,000 41,034 $195,000 39,598 $165,000 45,877 $169,900 38,288 $150,000 41,606 $167,900 45,070 ‐25.4%
Note: 2012 data through November; Twin Cities Metro represents the 7‐County planning region
Sources: Minneapolis Area Association of Realtors; Maxfield Research, Inc.
RESIDENTIAL SALE TRANSACTIONS
TABLE D‐6
TCAAP SITE MARKET AREA
2007 through November 2012
2007 2008 2009 2010 2011 2012

HOUSING MARKET ANALYSIS
MAXFIELD RESEARCH INC. 63
'07 ‐ '12
Median
Sale Price
# of
Sales
Median
Sale Price
# of
Sales
Median
Sale Price
# of
Sales
Median
Sale Price
# of
Sales
Median
Sale Price
# of
Sales
Median
Sale Price
# of
Sales
% Change
Sale Price
Primary Market Area $255,347 2,283 $223,049 2,279 $195,987 2,649 $201,783 2,198 $178,115 2,534 $195,303 2,901 ‐23.5%
Arden Hills $287,750 51 $341,000 50 $271,000 55 $281,000 41 $276,750 42 $370,000 83 28.6%
Blaine $253,950 468 $222,900 514 $193,000 635 $199,900 550 $185,700 652 $197,000 630 ‐22.4%
Centervil le $248,000 46 $216,500 51 $236,750 36 $191,750 41 $169,000 28 $211,950 48 ‐14.5%
Circle Pines $201,000 45 $185,250 38 $155,000 45 $149,500 38 $127,950 44 $147,950 62 ‐26.4%
Columbia Heights $179,900 172 $135,900 230 $120,750 290 $119,750 211 $101,000 249 $99,000 260 ‐45.0%
Columbus $270,000 23 $262,450 24 $222,000 33 $232,000 12 $177,277 23 $209,200 32 ‐22.5%
Falcon Heights $287,500 32 $280,250 36 $267,500 29 $265,000 25 $214,900 36 $231,706 39 ‐19.4%
Fridley $207,700 205 $172,700 222 $144,500 256 $141,500 169 $128,750 230 $131,600 233 ‐36.6%
Ham Lake $313,500 119 $271,000 106 $235,000 156 $219,900 146 $203,850 146 $216,000 178 ‐31.1%
Hilltop $226,000 1 ‐‐ 0 $120,000 1 ‐‐ 0 ‐‐ 0 ‐‐ 0 ‐‐
Lauderdale $199,000 14 $200,950 16 $197,450 18 $185,000 9 $122,900 12 $168,300 10 ‐15.4%
Lexington $158,150 14 $172,500 18 $146,250 14 $130,000 11 $99,900 9 $136,950 15 ‐13.4%
Lino Lakes $293,000 162 $242,500 132 $238,000 156 $235,000 146 $192,250 155 $227,912 181 ‐22.2%
Little Canada $260,000 46 $244,000 43 $195,000 47 $209,000 37 $209,200 53 $212,500 49 ‐18.3%
Mounds View $221,000 90 $172,500 82 $153,000 88 $163,500 63 $134,950 92 $139,750 101 ‐36.8%
New Brighton $250,000 146 $225,700 123 $201,000 143 $190,000 107 $177,000 131 $189,900 174 ‐24.0%
North Oaks $598,000 45 $629,465 40 $434,950 35 $533,000 45 $480,500 42 $512,178 56 ‐14.4%
Rosevil le $246,900 245 $235,250 208 $208,900 234 $211,000 204 $175,000 237 $205,000 280 ‐17.0%
Shoreview $276,500 189 $255,000 161 $255,000 177 $245,000 176 $219,900 163 $225,000 242 ‐18.6%
Spring Lake Park $199,900 44 $160,000 56 $141,000 71 $132,025 52 $115,000 39 $120,000 91 ‐40.0%
St. Anthony $255,750 59 $227,000 56 $237,000 56 $218,000 40 $212,450 72 $215,000 55 ‐15.9%
Vadnais Heights $271,000 67 $224,000 73 $212,350 74 $217,500 75 $200,000 79 $195,000 82 ‐28.0%
Anoka County $227,000 2,680 $192,900 2,889 $167,900 3,596 $167,000 2,940 $148,000 3,370 $162,000 3,650 ‐28.6%
Ramsey County $216,003 3,906 $175,129 4,129 $144,000 5,235 $149,900 4,048 $130,000 4,311 $145,000 4,761 ‐32.9%
Twin Cities Metro $245,000 29,031 $209,500 29,759 $178,750 34,758 $185,000 28,557 $167,000 31,082 $182,000 34,735 ‐25.7%
Note: 2012 data through November; Twin Cities Metro represents the 7‐County planning region
Sources: Minneapolis Area Association of Realtors; Maxfield Research, Inc.
TABLE D‐7
SINGLE‐FAMILY DETACHED RESIDENTIAL SALES
TCAAP SITE MARKET AREA
2007 through November 2012
2007 2008 2009 2010 2011 2012

HOUSING MARKET ANALYSIS
MAXFIELD RESEARCH INC. 64
'07 ‐ '12
Median
Sale Price
# of
Sales
Median
Sale Price
# of
Sales
Median
Sale Price
# of
Sales
Median
Sale Price
# of
Sales
Median
Sale Price
# of
Sales
Median
Sale Price
# of
Sales
% Change
Sale Price
Primary Market Area $181,715 960 $163,807 822 $142,220 874 $137,704 857 $112,855 908 $114,419 1,005 ‐37.0%
Arden Hills $142,032 25 $136,176 17 $128,873 10 $126,762 13 $112,346 26 $101,942 19 ‐28.2%
Blaine $184,270 260 $166,266 262 $144,156 275 $144,760 258 $117,597 305 $114,596 328 ‐37.8%
Centervi l le $159,000 9 $134,450 8 $119,000 4 $103,000 5 $132,000 20 $96,000 5 ‐39.6%
Circle Pines $163,750 20 $154,000 20 $135,000 27 $132,300 15 $114,250 22 $121,000 26 ‐26.1%
Columbia Heights $177,037 46 $166,974 58 $147,491 42 $145,772 46 $120,744 40 $99,172 46 ‐44.0%
Columbus ‐‐ 0 ‐‐ 0 ‐‐ 0 ‐‐ 0 ‐‐ 0 ‐‐ 0 ‐‐
Falcon Heights $249,000 1 $440,725 2 $250,000 2 $203,000 5 $178,600 5 $193,475 4 ‐22.3%
Fridley $150,575 53 $131,008 58 $117,479 47 $105,292 36 $66,027 37 $82,500 35 ‐45.2%
Ham Lake $363,000 5 $333,532 9 $253,000 4 $291,715 14 $249,950 10 $270,000 13 ‐25.6%
Hilltop ‐‐ 0 $51,875 2 ‐‐ 0 $35,000 2 ‐‐ 0 $24,500 1 ‐‐
Lauderdale $172,500 9 $122,500 1 $142,500 4 $132,875 4 $143,000 6 $150,750 6 ‐12.6%
Lexington ‐‐ 0 ‐‐ 0 ‐‐ 0 ‐‐ 0 ‐‐ 0 ‐‐ 0 ‐‐
Lino Lakes $189,200 56 $150,500 27 $130,000 45 $131,500 45 $114,000 45 $121,125 41 ‐36.0%
Little Canada $150,706 34 $129,962 26 $123,846 39 $72,802 58 $87,068 59 $96,640 47 ‐35.9%
Mounds View $213,525 14 $212,408 10 $132,701 5 $182,556 9 $127,167 6 $129,125 16 ‐39.5%
New Brighton $177,993 71 $167,333 44 $164,000 42 $145,653 45 $111,328 43 $123,063 72 ‐30.9%
North Oaks $760,000 3 $765,000 3 $550,000 7 $587,000 8 $480,500 9 $500,000 5 ‐34.2%
Roseville $162,058 86 $144,315 73 $126,588 58 $134,263 77 $95,563 71 $109,639 104 ‐32.3%
Shoreview $179,728 123 $167,737 93 $138,444 135 $140,088 107 $107,614 101 $119,997 122 ‐33.2%
Spring Lake Park $171,300 16 $156,500 14 $114,900 15 $114,000 10 $71,000 17 $90,200 12 ‐47.3%
St. Anthony $246,193 63 $187,952 52 $184,191 42 $104,429 42 $93,180 30 $81,112 38 ‐67.1%
Vadnais Heights $160,886 66 $137,233 43 $110,937 71 $110,921 58 $93,018 56 $92,879 65 ‐42.3%
Anoka County $171,550 889 $151,529 824 $124,281 964 $122,711 847 $98,121 943 $106,870 887 ‐37.7%
Ramsey County $179,674 1,228 $168,020 960 $141,263 1,040 $129,796 957 $99,975 968 $111,386 1,129 ‐38.0%
Twin Cities Metro $180,005 11,374 $165,086 9,317 $137,236 10,592 $132,282 9,175 $111,064 9,849 $120,723 10,335 ‐32.9%
Note: 2012 data through November; Twin Cities Metro represents the 7‐County planning region
Sources: Minneapolis Area Association of Realtors; Maxfield Research, Inc.
TABLE D‐8
MULTIFAMILY RESIDENTIAL SALES
TCAAP SITE MARKET AREA
2007 through November 2012
2007 2008 2009 2010 2011 2012
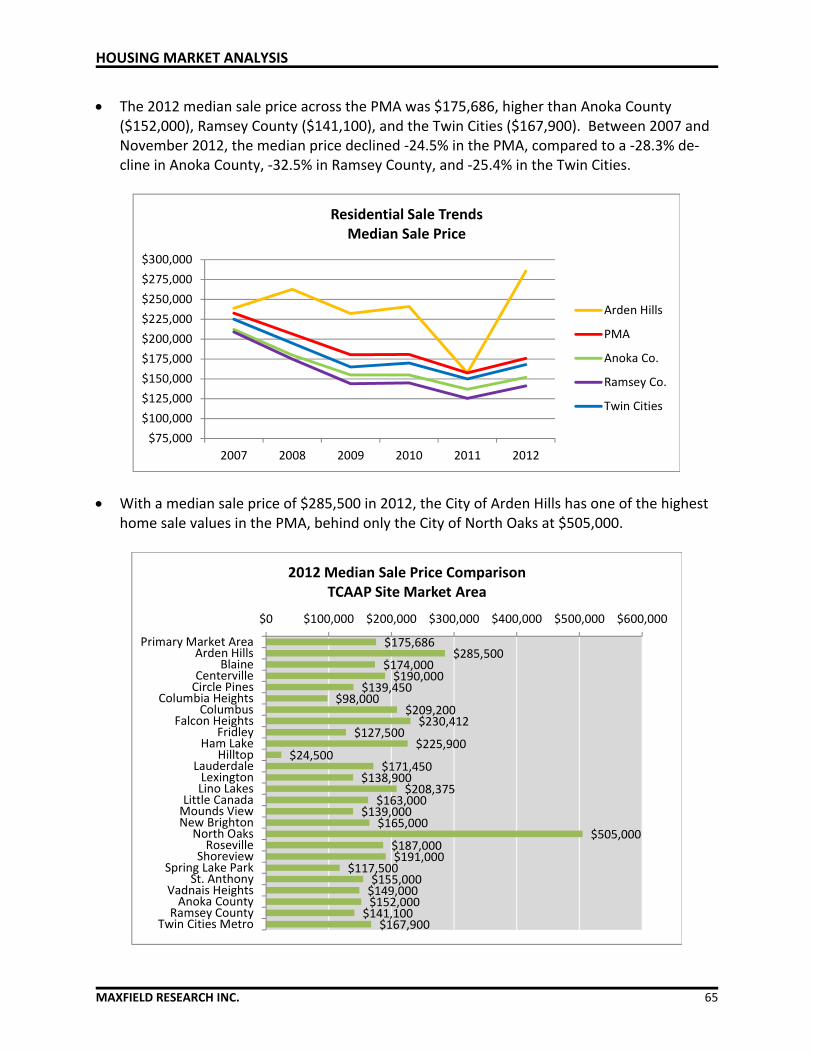
HOUSING MARKET ANALYSIS
MAXFIELD RESEARCH INC. 65
The 2012 median sale price across the PMA was $175,686, higher than Anoka County ($152,000), Ramsey County ($141,100), and the Twin Cities ($167,900). Between 2007 and November 2012, the median price declined ‐24.5% in the PMA, compared to a ‐28.3% de‐cline in Anoka County, ‐32.5% in Ramsey County, and ‐25.4% in the Twin Cities.
With a median sale price of $285,500 in 2012, the City of Arden Hills has one of the highest home sale values in the PMA, behind only the City of North Oaks at $505,000.
$75,000
$100,000
$125,000
$150,000
$175,000
$200,000
$225,000
$250,000
$275,000
$300,000
2007 2008 2009 2010 2011 2012
Residential Sale TrendsMedian Sale Price
Arden Hills
PMA
Anoka Co.
Ramsey Co.
Twin Cities
$175,686$285,500
$174,000$190,000
$139,450$98,000
$209,200$230,412
$127,500$225,900
$24,500$171,450
$138,900$208,375
$163,000$139,000
$165,000$505,000
$187,000$191,000
$117,500$155,000$149,000$152,000
$141,100$167,900
$0 $100,000 $200,000 $300,000 $400,000 $500,000 $600,000
Primary Market AreaArden Hills
BlaineCentervilleCircle Pines
Columbia HeightsColumbus
Falcon HeightsFridley
Ham LakeHilltop
LauderdaleLexingtonLino Lakes
Little CanadaMounds ViewNew BrightonNorth OaksRoseville
ShoreviewSpring Lake Park
St. AnthonyVadnais HeightsAnoka County
Ramsey CountyTwin Cities Metro
2012 Median Sale Price ComparisonTCAAP Site Market Area

HOUSING MARKET ANALYSIS
MAXFIELD RESEARCH INC. 66
Within the PMA, Blaine has been the most active market since 2007 with approximately 5,165 sale transactions (25% of all sales). Roseville and Shoreview each represented 9% of the sales activity while Columbia Heights and Fridley represented 8% of the activity. With a total of 433 transactions, approximately 2% of the PMA’s sale transactions occurred in the City of Arden Hills.
It appears that pricing for single‐family detached homes is recovering, as the 2012 median sales price is higher than the 2011 median in nearly every community comprising the PMA, although prices are still down significantly from 2007.
Multifamily housing has not experienced the pricing recovery that is occurring in the single‐family market as prices in several communities continued to decline in 2012, most notably Columbia Heights, St. Anthony, and Arden Hills. However, based on 2012 sales activity, it appears that multifamily pricing is stabilizing.
Between 2007 and November 2012, the median sale price of single‐family detached homes in the PMA declined ‐23.5% from $255,347 to $195,303. Mulitfamily values dropped ‐37.0% from $181,715 to $114,419. Since 2011, single‐family values have increased nearly 9.7% while multifamily values held steady (+1.4%).
The condominium market experienced a steeper pricing decline than the townhome market between 2007 and November. Within the PMA, the median sale price of condominium units dropped nearly ‐58%, from $148,295 in 2007 to $62,500 in 2012. Townhome values slipped ‐27.5% from $192,794 to $139,688. By comparison, the median sale price of con‐dominiums fell ‐39% to $105,000 across the Twin Cities while townhome sale prices dropped ‐30% to $128,000.
$255,347
$195,303 $181,715
$114,419
$‐
$50,000
$100,000
$150,000
$200,000
$250,000
$300,000
2007 2008 2009 2010 2011 2012
Median Sale PricePrimary Market Area
single‐family detached
multifamily

HOUSING MARKET ANALYSIS
MAXFIELD RESEARCH INC. 67
For‐Sale Housing Market Demand Analysis Table D‐9 presents our demand calculations for general occupancy for‐sale housing in the Market Area between 2012 and 2017. This analysis identifies potential demand for general occupancy for‐sale housing that is generated from both new households and turnover house‐holds. The points following the table summarize our findings.
According to our projections, the Primary Market Area is expected to grow by 4,714 house‐holds while the SMA (portions of Anoka County and Ramsey County outside the PMA) is projected to grow by 6,391 households between 2012 and 2017.
Because the 65 and older cohort is typically not a target market for new general occupancy for‐sale housing, we limit demand from household growth to only those households under the age of 65. In the PMA, approximately 11% of the growth will occur among households age 64 and younger, most notably in the 25 to 34 and 55 to 64 age groups, which results in demand for 519 for‐sale general occupancy housing units. Within the SMA, 12% of the pro‐jected household growth will occur among age 64 and younger households resulting in pro‐jected demand for 767 general occupancy for‐sale units.
Based on household tenure data from the US Census, we expect that 75% of PMA and 67% of SMA demand will be for owner‐occupied housing units, equating to a potential 389 own‐er households from PMA growth and 514 households from SMA growth.
An additional proportion is added for households that would move into ownership housing who currently reside outside the Market Area. We estimate that 15% of the demand poten‐tial for general occupancy ownership housing would be derived from outside the area, in‐creasing total demand for 486 units from PMA household growth and 605 units from SMA household growth.
As of 2012, there are approximately 70,665 owner households under the age of 65 in the PMA. Based on household turnover data from the 2011 American Community Survey, we estimate that 25% of these under‐65 owner households will experience turnover between 2012 and 2017. This estimate results in anticipated turnover of approximately 17,666 exist‐ing PMA households by 2017. Within the SMA, we estimate that there are 105,904 owner households under the age of 65 with 25% projected to turn over, resulting in approximately 26,476 households turning over.
We then estimate the percent of existing owner households turning over that would prefer to purchase new housing. Throughout the Twin Cities, approximately 8% of all home sales were for new homes over the past six years while slightly over 6% of SMA sales were for new homes. Considering the declining supply of homes for sale throughout the Metro Area, we project that these percentages will increase over the next five years. As such, we esti‐mate that 10% of households turning over will desire new owner housing. This estimate

HOUSING MARKET ANALYSIS
MAXFIELD RESEARCH INC. 68
results in demand from existing households for 1,767 new residential units from existing PMA households and 2,648 new units from SMA households between 2012 and 2017.
Total demand from household growth and existing household turnover between 2012 and 2017 equates to 2,253 new for‐sale housing units from the PMA and 3,252 for‐sale units from the SMA. Based on our knowledge of the local residential real estate market, we uti‐lize an estimated 15% capture rate of households from the SMA to the PMA. This limits to‐tal demand potential from the SMA to 488 new for‐sale housing units.
Based on recent new construction sales trends and the age distribution of Market Area households, we estimate that 70% of the householders seeking new housing will desire sin‐gle‐family detached residential units, while the remaining 30% will be seeking multifamily units. We anticipate that there will be demand potential for 1,577 single‐family and 676 multifamily units from the PMA along with 341 single‐family and 146 multifamily units from the SMA over the next five years.
Due to the Site’s desirability as a residential location, we estimate that the subject property could capture roughly 15% to 20% of the PMA demand and 10% of the demand from the SMA, equating to a total of 271 to 350 single‐family units and 116 to 150 multifamily units supportable on the Site between 2012 and 2017.

HOUSING MARKET ANALYSIS
MAXFIELD RESEARCH INC. 69
Projected household growth in the Market Area 2012 to 2017¹
(times) Pct. of HH growth for general occupancy housing2
x
(equals) Projected demand for general occupancy units =
(times) Propensity to Own3
x
(equals) Number of potential owner households from HH growth =
(times) Ownership demand generated from outside Market Area +
(equals) Total demand potential for ownership housing in Market Area =
Number of owner households (age 64 and younger) in Market Area, 2012 =
(times) Estimated % of owner turnover (age 64 and younger, 2012 to 2017)4
x
(equals) Total existing households projected to turnover between 2012 and 2017 =
(times) Estimated % desiring new owner housing x
(equals) Demand from existing households =
Total Demand From Household Growth and Existing Households, 2012 to 2017 =
(times) Percent capturable from SMA to PMA x
Total Demand in the PMA and SMA =
(times) Percent desiring for‐sale single family vs. multifamily5
x
(equals) Total demand potential for new for‐sale housing =
(times) Percent capturable on Site x 15% ‐ 20% 15% ‐ 20%
(equals) Number of housing units supportable on Site = 237 ‐ 315 101 ‐ 135
1 Estimated household growth based per ESRI and Maxfield Research Inc.
2 Pct. of household growth under age 65
3 Pct. Owner households under age 65 in 2010
4 Based on household turnover and mobility data (2011 American Community Survey, Five Year Estimates).
5 Based on new construction sales data from 2007 to present
* Multifamily demand includes demand for townhomes, twinhomes, and condominium units.
Source: Maxfield Research Inc.
10% 10%
34 15
70% 30% 70% 30%
1,577 676 341 146
2,253 3,252
Single
Family
Multi‐
family*
Single
Family
Multi‐
family*
‐‐ 15%
2,253 488
17,666 26,476
10% 10%
1,767 2,648
25% 25%
75% 67%
389 514
15% 15%
486 605
DEMAND FROM EXISTING OWNER HOUSEHOLDS
70,665 105,904
519 767
TABLE D‐9
FOR‐SALE HOUSING DEMAND
TCAAP SITE MARKET AREA
2012 to 2017
PMA SMA
DEMAND FROM PROJECTED HOUSEHOLD GROWTH
4,714 6,391
11% 12%

SENIOR HOUSING MARKET ANALYSIS
MAXFIELD RESEARCH INC. 70
Introduction This section provides an assessment of the market support for senior housing (active adult, congregate, assisted living, memory care, and skilled nursing care) in the TCAAP Site Market Area. An overview of the demographic and economic characteristics of the senior population in the area is presented along with an inventory of existing and pending senior housing develop‐ments. Demand for senior housing is calculated based on demographic, economic and compet‐itive factors that would impact demand for additional senior housing units in the Market Area. Our assessment concludes with an estimation of the proportion of demand that could be captured by additional senior housing units located on the Site.
Senior Housing Defined Senior housing is a concept that generally refers to the integrated delivery of housing and services to seniors. However, as Figure 1 illustrates, senior housing embodies a wide variety of product types across the service‐delivery spectrum. Products range from independent apartments and/or townhomes with virtually no services on one end, to highly specialized, service‐intensive assisted living units or housing geared for people with dementia‐related illnesses (termed "memory care") on the other end of the spectrum. In general, independent senior housing attracts people age 65 and over while assisted living typically attracts people age 80 and older who need assistance with activities of daily living (ADLs). For analytical purposes, Maxfield Research Inc. classifies market rate senior housing into five categories based on the level and type of services offered:
Active Adult properties (or independent living without services available) are similar to a general‐occupancy building, in that they offer virtually no services but have age‐restrictions (typically 55 or 62 or older). Residents are generally age 70 or older if in an apartment‐style building. Organized entertainment, activities and occasionally a transportation program represent the extent of services typically available at these properties. Because of the lack
Townhome or Apartment
Senior Housing Product Type
Fully
Independent
Lifestyle
Source: Maxfield Research Inc.
FIGURE 1
Single‐Family
Home
CONTINUUM OF HOUSING AND SERVICES FOR SENIORS
Age‐Restricted Independent Single‐Family or
Townhomes or Apartments or Condominiums or
Cooperatives
Congregate Apartments w/ Optional
Services
Congregate Apartments w/
Intensive Services
Assisted Living
Memory Care
(Alzheimer's Units)
Nursing Facilities
Fully or Highly
Dependent on Care

SENIOR HOUSING MARKET ANALYSIS
MAXFIELD RESEARCH INC. 71
of services, active adult properties generally do not command the rent premiums of more service‐enriched senior housing. Active adult properties can have a rental or owner‐occupied (condominium or cooperative) format.
Congregate properties (or independent living with services available) offer support services such as meals and/or housekeeping, either on an optional basis or a limited amount includ‐ed in the rents. These properties often dedicate a larger share of the overall building area to common areas, in part, because the units are smaller than in adult housing and in part to encourage socialization among residents. Congregate properties attract a slightly older tar‐get market than adult housing, typically seniors age 75 or older. Rents are also above those of the active adult buildings. Sponsorship by a nursing home, hospital or other health care organization is common.
Assisted Living properties come in a variety of forms, but the target market for most is generally the same: very frail seniors, typically age 80 or older (but can be much younger, depending on their particular health situation), who are in need of extensive support ser‐vices and personal care assistance. Absent an assisted living option, these seniors would otherwise need to move to a nursing facility. At a minimum, assisted living properties in‐clude two meals per day and weekly housekeeping in the monthly fee, with the availability of a third meal and personal care (either included in the monthly fee or for an additional cost). Assisted living properties also have either staff on duty 24 hours per day or at least 24‐hour emergency response.
Memory Care properties, designed specifically for persons suffering from Alzheimer’s disease or other dementias, is one of the newest trends in senior housing. Properties con‐sist mostly of suite‐style or studio units or occasionally one‐bedroom apartment‐style units, and large amounts of communal areas for activities and programming. In addition, staff typically undergoes specialized training in the care of this population. Because of the great‐er amount of individualized personal care required by residents, staffing ratios are much higher than traditional assisted living and thus, the costs of care are also higher. Unlike conventional assisted living, however, which addresses housing needs almost exclusively for widows or widowers, a higher proportion of persons afflicted with Alzheimer’s disease are in two‐person households. That means the decision to move a spouse into a memory care facility involves the caregiver’s concern of incurring the costs of health care at a special facil‐ity while continuing to maintain their home.
Skilled Nursing Care, or long‐term care facilities, provides a living arrangement that inte‐grates shelter and food with medical, nursing, psychosocial and rehabilitation services for persons who require 24‐hour nursing supervision. Residents in skilled nursing homes can be funded under Medicare, Medicaid, Veterans, HMOs, insurance as well as use of private funds.

SENIOR H
MAXFIELD
Senior H MaxfieldArden Hicommunsenior hoCities of A We estimthe PMAPMA. Thorientatidesire toand pare
HOUSING M
D RESEARCH IN
Housing M
Research dells, Minnesoity orientatiousing feasibArden Hills,
mate that 75. The remaihese individuon to the aro move back ents of adult
MARKET ANA
C.
Market Are
etermined tota based onon patternsbility. The seMounds Vie
% of the demning portionuals will incluea (i.e. churto be near fchildren livi
Sen
ALYSIS
a Definitio
he draw aren growth tren, geographicenior housinew, New Brig
mand for sen of the demude people cch, doctor, efriends and fng in the PM
nior Housing
on
ea for a potends and demc and man‐mng Primary Mghton, Rosev
nior housingmand (25%) wcurrently resetc.), peoplefamily, retireMA. A map o
g Primary M
ntial senior mographic chmade barrierMarket Area ville, and Sh
g in Arden Hwill come frosiding just oe who once rees who wisof the PMA i
Market Area
housing devharacteristicrs and our ex(PMA) is deforeview.
ills will be geom outside tutside the Presided in thh to relocateis shown bel
velopment incs, traffic andxperience infined as the
enerated frothe defined MA who havhe area who e to the arealow.
72
n d
om
ve an
a,

SENIOR HOUSING MARKET ANALYSIS
MAXFIELD RESEARCH INC. 73
Older Adult (Age 55+) Population and Household Trends Table E‐1 shows the age distribution of people and households age 55 and older in the senior housing PMA. Information for 2000 and 2010 is supplied by the U.S. Census Bureau. The estimate for 2012 and the projection for 2017 were supplied by ESRI, a nationally recognized demographics firm, with adjustments made by Maxfield Research to reflect current year data. The following points are key observations from Table E‐1:
As of 2010, the senior housing PMA had 101,866 residents and 41,851 households. The population decreased by ‐2,344 people (‐2.2%) while the household base expanded by +138 households (+0.3%) from 2000 to 2010. The number of new households was high relative to the number of new people suggesting a trend toward smaller household sizes due to an aging population. We estimate that the population increased by approximately 1,745 peo‐ple to 103,611 since the 2010 Census.
Aging of baby boomers led to an increase of 3,383 people (+32.1%) in the 55 to 64 popula‐tion between 2000 and 2010. As this group ages, all cohorts age 55 or greater are predicted to see increases over the next five years, particularly the 55 to 64 and 65 to 69 age groups which are projected to grow 7.9% (+1,167 people) and 23.9% (+1,237 people). The 70 to 74 age group is expected to increase by 971 people (+24.3%).
Between 2012 and 2017, the PMA’s senior (age 65+) population is projected to increase by 2,968 people (+16.4%). Much of this growth will be among people age 65 to 69, as the lead‐ing edge of the baby boom ages into their late 60s.
The age 75 and over population is projected to grow more modestly (+8.5%) between 2012 and 2017 after growing over 22% (+1,577 people) between 2000 and 2010. The weaker
6,179
4,667 4,357
8,628
5,613 6,112
9,209
6,874 6,565
0
2,000
4,000
6,000
8,000
10,000
12,000
14,000
55 to 64 65 to 74 75+
Projected Household Growth by Age of HouseholderPrimary Market Area
200020122017

SENIOR HOUSING MARKET ANALYSIS
MAXFIELD RESEARCH INC. 74
growth forecasted in the age 75+ population reflects the aging of people born during the Depression Era, a period of much lower births.
The primary market for service‐enhanced housing is senior households age 75 and older. While individuals in their 50s and 60s typically do not comprise the market base for service‐enhanced senior housing, they often have elderly parents to whom they provide support when they decide to relocate to senior housing. Since elderly parents typically prefer to be near their adult caregivers, growth in the older adult age cohort (age 55 to 64) generally re‐sults in additional demand for senior housing products.
Estimate Projection
Age 2000 2010 2012 2017
55 to 64 10,539 13,922 14,717 15,884 3,383 32.1% 1,167 7.9%
65 to 69 3,887 4,745 5,169 6,406 858 22.1% 1,237 23.9%
70 to 74 3,599 3,731 4,001 4,972 132 3.7% 971 24.3%
75 to 79 3,111 3,154 3,218 3,666 43 1.4% 448 13.9%
80 to 84 2,099 2,702 2,697 2,734 603 28.7% 37 1.4%
85 + 1,928 2,859 3,057 3,332 931 48.3% 275 9.0%
Total 55+ 25,163 31,113 32,859 36,994 5,950 23.6% 4,135 12.6%
Total 65+ 14,624 17,191 18,142 21,110 2,567 17.6% 2,968 16.4%
Total 75+ 7,138 8,715 8,972 9,732 1,577 22.1% 760 8.5%
Tot. Pop. 104,210 101,866 103,611 107,932 ‐2,344 ‐2.2% 4,321 4.2%
Age 2000 2010 2012 2017
55 to 64 6,179 8,223 8,628 9,209 2,044 33.1% 581 6.7%
65 to 74 4,667 5,223 5,613 6,874 556 11.9% 1,261 22.5%
75+ 4,357 5,982 6,112 6,565 1,625 37.3% 453 7.4%
Total 55+ 15,203 19,428 20,353 22,648 4,225 27.8% 2,295 11.3%
Total 65+ 9,024 11,205 11,725 13,439 2,181 24.2% 1,714 14.6%
Total 75+ 4,357 5,982 6,112 6,565 1,625 37.3% 453 7.4%
Tot. HH 41,713 41,851 42,538 44,451 138 0.3% 1,913 4.5%
Sources: U.S. Census Bureau; ESRI.; Maxfield Research Inc.
2012 ‐ 2017
POPULATION
2000 ‐ 2010 2012 ‐ 2017
TABLE E‐1
HOUSEHOLDS
OLDER ADULT (55+) POPULATION & HOUSEHOLD AGE DISTRIBUTION
SENIOR HOUSING PRIMARY MARKET AREA
2000 to 2017
Census Change
2000 ‐ 2010

SENIOR HOUSING MARKET ANALYSIS
MAXFIELD RESEARCH INC. 75
Older Adult and Senior Household Incomes Table E‐2 shows incomes for older adult and senior households in the PMA in 2012 and 2017 based on information provided by ESRI and the U.S. Census Bureau with adjustments made by Maxfield Research based on current Census information. The data in Table E‐2 helps determine demand for senior housing based on the size of the market at specific income levels. This data is incorporated into our demand calculations which are presented later in this report. It is important to note that the data does not account for the asset base of senior households or supplemental income that a senior household could gain from the proceeds of a sale of a home or from contributions from family members. The frailer the senior, the greater the proportion of their income they will typically spend on housing and services. Studies have shown that seniors are willing to pay increasing proportions of their incomes on housing with services, beginning with an income allocation of 40% to 50% for market rate adult senior housing with little or no services, increasing to 65% for congregate housing and to 80% to 90% or more for assisted living housing. The proceeds from the sales of their homes, as well as financial assistance from their adult children, are often used as supple‐mental income in order to afford senior housing alternatives. The following are key points from Table E‐2:
Overall, senior households in the PMA have above‐average incomes when compared to the Twin Cities. The median income of $45,865 for 65+ households in 2012 compares to a me‐dian income of $40,357 65+ households throughout the Metro Area. Thus, a greater pro‐portion of seniors in the PMA should income‐qualify for market rate senior housing than in the Metro as a whole.
The key market for active adult/few services housing is comprised of senior households (age 65+), with incomes of $35,000 or more. The age threshold increases to 70+ if in an apart‐ment‐style building. In 2012, we estimate there are 7,296 age‐ and income‐qualified households in the PMA that comprise the key market for active adult housing. Including all households with incomes of $40,000 and over (adjusted for inflation), the number of 65+ senior households projected to income‐qualify for active adult/few services housing is ex‐pected to grow to 8,558 households in 2017 (+17.3%).
Congregate housing demand is driven by senior households (age 75+) with incomes of $35,000 or more. We estimate the number of age‐ and income‐qualified households in the PMA to be 3,024 householders in 2012, increasing to 3,245 (+7.3%) householders in 2017.
The target market for assisted living housing is senior households age 75 and older with incomes of at least $40,000 (plus senior homeowners with lower incomes). As of 2012, there were about 2,623 older senior households (age 75+) in the PMA with incomes of at least $40,000, accounting for over 43% of all older senior households.

SENIOR HOUSING MARKET ANALYSIS
MAXFIELD RESEARCH INC. 76
Including all households with incomes of $45,000 and over (adjusted for inflation), the number of older senior households projected to income‐qualify for senior housing with ser‐vices is expected to grow to 2,833 households in 2017 (+8.0%).
Memory care housing has a target market of senior households age 75 and older with incomes of at least $60,000. As of 2012, there were approximately 1,484 age 75+ house‐holds in the PMA with incomes of at least $60,000, accounting for 24.3% of all senior households. The number of income‐qualified ($65,000 adjusted for inflation) households is projected to increase to 2,057 by 2017.
Since senior housing with services is need‐driven, seniors with low incomes are still candi‐dates for private pay housing, provided they have home equity or other financial assistance that they can utilize to pay for the costs. Very low‐income seniors who are Medicaid‐qualified also could live in assisted living or memory care facilities that accept Elderly Waiv‐ers. Due to the limited availability of facilities that accept Elderly Waivers, demand from low‐income seniors is often substantial.
‐
1,000
2,000
3,000
4,000
5,000
6,000
7,000
8,000
9,000
Active Adult Congregate Assisted Living Memory Care
Households
Age‐ and Income‐Qualified Households2012 and 2017
2012
2017
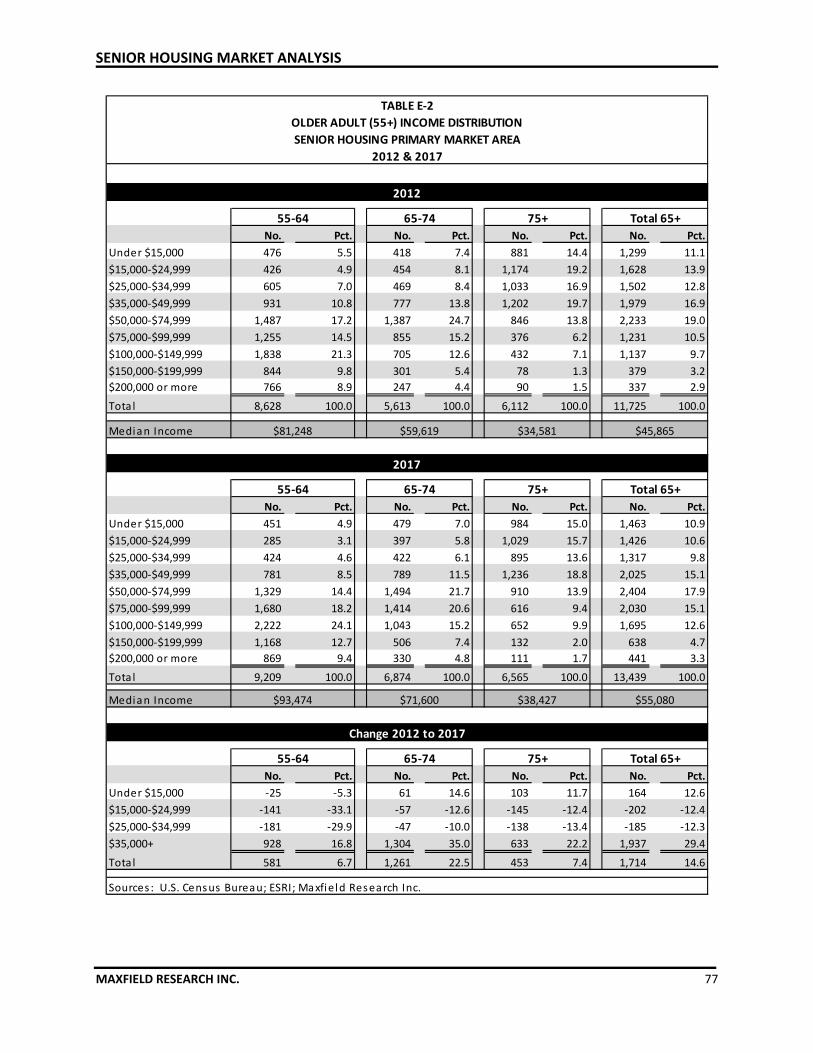
SENIOR HOUSING MARKET ANALYSIS
MAXFIELD RESEARCH INC. 77
No. Pct. No. Pct. No. Pct. No. Pct.
Under $15,000 476 5.5 418 7.4 881 14.4 1,299 11.1
$15,000‐$24,999 426 4.9 454 8.1 1,174 19.2 1,628 13.9
$25,000‐$34,999 605 7.0 469 8.4 1,033 16.9 1,502 12.8
$35,000‐$49,999 931 10.8 777 13.8 1,202 19.7 1,979 16.9
$50,000‐$74,999 1,487 17.2 1,387 24.7 846 13.8 2,233 19.0
$75,000‐$99,999 1,255 14.5 855 15.2 376 6.2 1,231 10.5
$100,000‐$149,999 1,838 21.3 705 12.6 432 7.1 1,137 9.7
$150,000‐$199,999 844 9.8 301 5.4 78 1.3 379 3.2
$200,000 or more 766 8.9 247 4.4 90 1.5 337 2.9
Tota l 8,628 100.0 5,613 100.0 6,112 100.0 11,725 100.0
Median Income
No. Pct. No. Pct. No. Pct. No. Pct.
Under $15,000 451 4.9 479 7.0 984 15.0 1,463 10.9
$15,000‐$24,999 285 3.1 397 5.8 1,029 15.7 1,426 10.6
$25,000‐$34,999 424 4.6 422 6.1 895 13.6 1,317 9.8
$35,000‐$49,999 781 8.5 789 11.5 1,236 18.8 2,025 15.1
$50,000‐$74,999 1,329 14.4 1,494 21.7 910 13.9 2,404 17.9
$75,000‐$99,999 1,680 18.2 1,414 20.6 616 9.4 2,030 15.1
$100,000‐$149,999 2,222 24.1 1,043 15.2 652 9.9 1,695 12.6
$150,000‐$199,999 1,168 12.7 506 7.4 132 2.0 638 4.7
$200,000 or more 869 9.4 330 4.8 111 1.7 441 3.3
Tota l 9,209 100.0 6,874 100.0 6,565 100.0 13,439 100.0
Median Income
No. Pct. No. Pct. No. Pct. No. Pct.
Under $15,000 ‐25 ‐5.3 61 14.6 103 11.7 164 12.6
$15,000‐$24,999 ‐141 ‐33.1 ‐57 ‐12.6 ‐145 ‐12.4 ‐202 ‐12.4
$25,000‐$34,999 ‐181 ‐29.9 ‐47 ‐10.0 ‐138 ‐13.4 ‐185 ‐12.3
$35,000+ 928 16.8 1,304 35.0 633 22.2 1,937 29.4
Tota l 581 6.7 1,261 22.5 453 7.4 1,714 14.6
Sources : U.S. Census Bureau; ESRI; Maxfield Research Inc.
$93,474 $71,600 $38,427 $55,080
Change 2012 to 2017
55‐64 65‐74 75+ Total 65+
55‐64 65‐74 75+ Total 65+
$81,248 $59,619 $34,581 $45,865
TABLE E‐2
OLDER ADULT (55+) INCOME DISTRIBUTION
SENIOR HOUSING PRIMARY MARKET AREA
2012 & 2017
2017
55‐64 65‐74 75+ Total 65+
2012
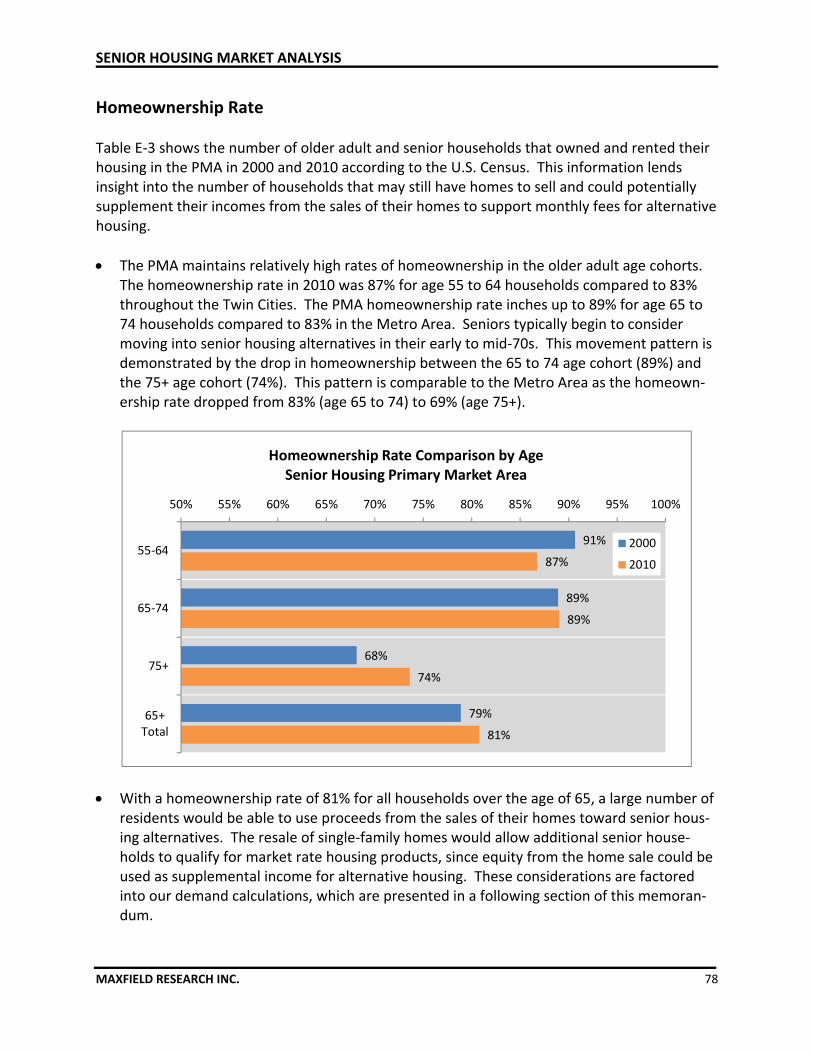
SENIOR HOUSING MARKET ANALYSIS
MAXFIELD RESEARCH INC. 78
Homeownership Rate Table E‐3 shows the number of older adult and senior households that owned and rented their housing in the PMA in 2000 and 2010 according to the U.S. Census. This information lends insight into the number of households that may still have homes to sell and could potentially supplement their incomes from the sales of their homes to support monthly fees for alternative housing.
The PMA maintains relatively high rates of homeownership in the older adult age cohorts. The homeownership rate in 2010 was 87% for age 55 to 64 households compared to 83% throughout the Twin Cities. The PMA homeownership rate inches up to 89% for age 65 to 74 households compared to 83% in the Metro Area. Seniors typically begin to consider moving into senior housing alternatives in their early to mid‐70s. This movement pattern is demonstrated by the drop in homeownership between the 65 to 74 age cohort (89%) and the 75+ age cohort (74%). This pattern is comparable to the Metro Area as the homeown‐ership rate dropped from 83% (age 65 to 74) to 69% (age 75+).
With a homeownership rate of 81% for all households over the age of 65, a large number of residents would be able to use proceeds from the sales of their homes toward senior hous‐ing alternatives. The resale of single‐family homes would allow additional senior house‐holds to qualify for market rate housing products, since equity from the home sale could be used as supplemental income for alternative housing. These considerations are factored into our demand calculations, which are presented in a following section of this memoran‐dum.
91%
89%
68%
79%
87%
89%
74%
81%
50% 55% 60% 65% 70% 75% 80% 85% 90% 95% 100%
55‐64
65‐74
75+
65+Total
Homeownership Rate Comparison by AgeSenior Housing Primary Market Area
2000
2010

SENIOR HOUSING MARKET ANALYSIS
MAXFIELD RESEARCH INC. 79
Home Sale Values Table E‐4 presents home sale data for single‐family homes in the PMA. The home sale data is useful in that it represents the amount of equity seniors may be able to derive from the sales of their homes that could be used to cover the cost of senior housing alternatives. The data on home sales in Table E‐4 was obtained from the Minneapolis Area Association of Realtors. The following points summarize key findings:
In the PMA, the average resale price of single‐family homes declined from $292,900 in 2007 to $235,609 in 2012, representing a drop of ‐24.3%. The median sale price fell from $254,943 to $215,588 (‐18.3%) during the same time period. It is worth noting that the market appears to have hit bottom as sale prices posted a solid increase from 2011 to No‐vember 2012 and the average number of days on market declined.
Between 2007 and 2011, the total number of sales in the PMA declined nearly ‐8% from 721 closed sales in 2007 to 665. Through the first 11 months of 2012, the number of closed sale transactions has exceeded the whole year totals for each of the previous years (2007‐2011). There have been a total of 880 closed sales through November, on pace for approximately 960 sales by year‐end.
Based on the 2012 median sale price in the PMA ($215,588), a senior household could generate approximately $4,053 of additional income annually (about $338 per month), if they invested in an income‐producing account (2.0% interest rate) after accounting for mar‐keting costs and/or real estate commissions (6.0% of home sale price).
Own Rent Own Rent Own Rent Own Rent
No. of Households 7,135 1,088 4,650 573 4,403 1,579 9,053 2,152
Homeownership Rate
No. of Households 5,602 577 4,150 517 2,968 1,389 7,118 1,906
Homeownership Rate
Sources : U.S. Census Bureau, ESRI, Maxfield Research Inc.
TABLE E‐3
OLDER ADULT HOUSEHOLD TENURE
SENIOR HOUSING PRIMARY MARKET AREA
2000 & 2010
2000
2010
‐‐‐‐‐‐‐ Age of Householder ‐‐‐‐‐‐‐‐
87% 89% 74% 81%
55‐64 65‐74 75+
91% 89% 68% 79%
Total 65+
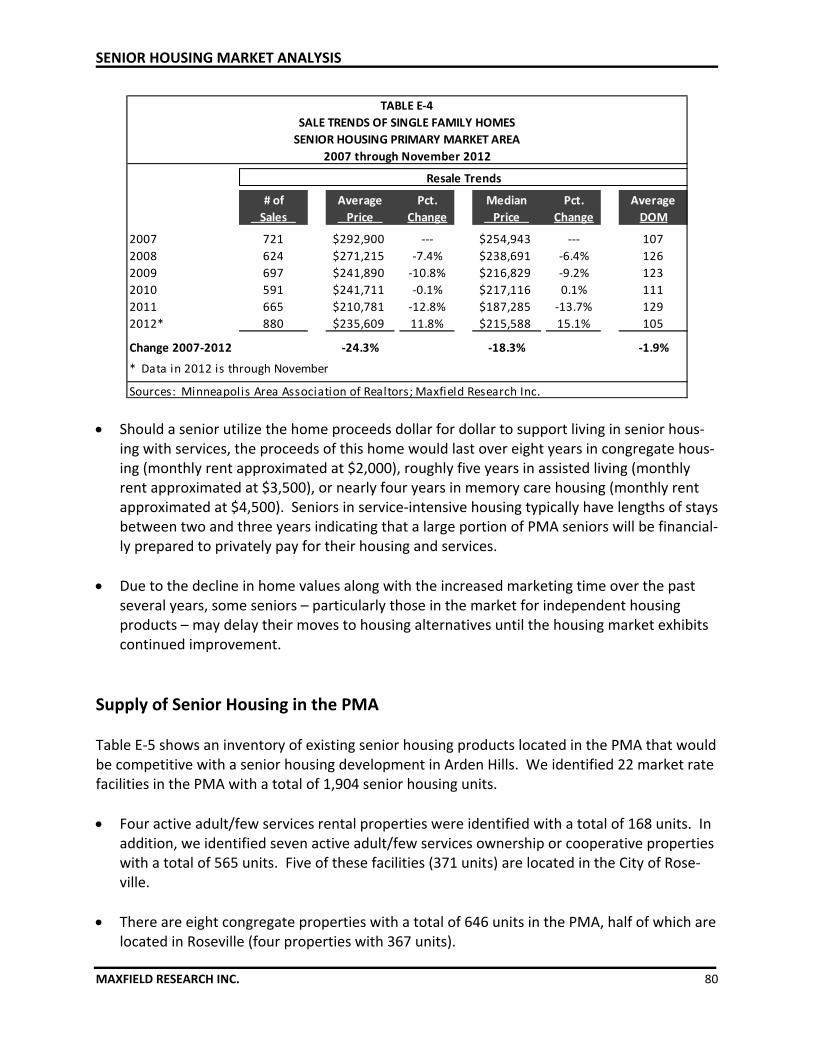
SENIOR HOUSING MARKET ANALYSIS
MAXFIELD RESEARCH INC. 80
Should a senior utilize the home proceeds dollar for dollar to support living in senior hous‐ing with services, the proceeds of this home would last over eight years in congregate hous‐ing (monthly rent approximated at $2,000), roughly five years in assisted living (monthly rent approximated at $3,500), or nearly four years in memory care housing (monthly rent approximated at $4,500). Seniors in service‐intensive housing typically have lengths of stays between two and three years indicating that a large portion of PMA seniors will be financial‐ly prepared to privately pay for their housing and services.
Due to the decline in home values along with the increased marketing time over the past several years, some seniors – particularly those in the market for independent housing products – may delay their moves to housing alternatives until the housing market exhibits continued improvement.
Supply of Senior Housing in the PMA Table E‐5 shows an inventory of existing senior housing products located in the PMA that would be competitive with a senior housing development in Arden Hills. We identified 22 market rate facilities in the PMA with a total of 1,904 senior housing units.
Four active adult/few services rental properties were identified with a total of 168 units. In addition, we identified seven active adult/few services ownership or cooperative properties with a total of 565 units. Five of these facilities (371 units) are located in the City of Rose‐ville.
There are eight congregate properties with a total of 646 units in the PMA, half of which are located in Roseville (four properties with 367 units).
# of Average Pct. Median Pct. Average
Sales Price Change Price Change DOM
2007 721 $292,900 ‐‐‐ $254,943 ‐‐‐ 107
2008 624 $271,215 ‐7.4% $238,691 ‐6.4% 126
2009 697 $241,890 ‐10.8% $216,829 ‐9.2% 123
2010 591 $241,711 ‐0.1% $217,116 0.1% 111
2011 665 $210,781 ‐12.8% $187,285 ‐13.7% 129
2012* 880 $235,609 11.8% $215,588 15.1% 105
Change 2007‐2012 ‐24.3% ‐18.3% ‐1.9%
* Data in 2012 is through November
TABLE E‐4
SALE TRENDS OF SINGLE FAMILY HOMES
SENIOR HOUSING PRIMARY MARKET AREA
2007 through November 2012
Resale Trends
Sources: Minneapolis Area Association of Realtors; Maxfield Research Inc.

SENIOR HOUSING MARKET ANALYSIS
MAXFIELD RESEARCH INC. 81
Year Project TotalDevelopment City Built Type Units
Cottage Villas Arden Hills 1995 Rental 18Golden Pond New Brighton 1989 Rental 39Shores of Shoreview Shoreview 2002 Rental 39Summerhouse of Shoreview Shoreview 2000 Rental 72
168
Realife Cooperative of Mounds View Mounds View 1999 Cooperative 74Applewood Pointe of New Brighton New Brighton 2007 Cooperative 120Applewood Pointe at Langton Lake Rosevil le 2011 Cooperative 48Applewood Pointe of Rosevil le Rosevil le 2004 Cooperative 94Greenhouse Village Rosevil le 2006 Cooperative 102Rosevil le Commons Condominiums Rosevil le 2000 Ownership 30Villa Park Rosevil le 1986 Ownership 97Total 565
Johanna Shores Arden Hills 2012 Rental 54Meadowood Shores New Brighton 2000 Rental 106Eagle Crest Terrace Rosevil le 1994 Rental 127Rosepointe II Rosevil le 1996 Rental 42Heritage Place of Rosevil le Rosevil le 2004 Rental 50Rosepointe I Rosevil le 1988 Rental 148Shoreview Senior Living Shoreview 2012 Rental 54
Scandia Shores Shoreview 1996 Rental 65
Total 646
Johanna Shores Arden Hills 2012 Rental 36
Brightondale New Brighton 1988 Rental 59
Eagle Crest Commons Rosevil le 1994 Rental 91
Rosewood Estate ‐ Rosevil le Rosevil le 1989 Rental 104
Cherrywood Pointe Rosevil le 2012 Rental 56
Sunrise of Rosevil le Rosevil le 2001 Rental 48
Shoreview Senior Living Shoreview 2012 Rental 34
Total 428
Johanna Shores Arden Hills 2012 Rental 18
Brightondale New Brighton 1988 Rental 11
Eagle Crest Arbors Rosevil le 2001 Rental 36
Cherrywood Pointe Rosevil le 2012 Rental 24
Sunrise of Rosevil le Rosevil le 2001 Rental 29
Shoreview Senior Living Shoreview 2012 Rental 15
Total 133
Memory Care
Source: Maxfield Research Inc.
Assisted Living
TABLE E‐5
MARKET RATE SENIOR HOUSING PROPERTIES
TCAAP SITE SENIOR HOUSING PMA
December 2012
Adult/Few Services
Congregate
SENIOR HOUSING MARKET ANALYSIS
MAXFIELD RESEARCH INC. 82
The PMA has seven assisted living properties and six memory care properties, with 428 units and 133 units, respectively. The PMA has experienced a surge in senior housing de‐velopment recently, with the delivery of 339 units in the past two years.
Johanna Shores, located along Lake Johanna Boulevard in Arden Hills, is one of the largest developments in the area. The first phase of this project just opened in late fall 2012 and consists of 54 independent living/congregate apartment units, 36 assisted living units, and 18 units of memory care. Approximately 188 existing units on the site are being demol‐ished, and two additional phases of development are planned. These final two phases will consist of 54 assisted living units, 18 memory care units, and 36 independent living brown‐stone apartment units on the campus. While the independent living units will add supply to the market, the new service‐enhanced units will replace the existing units on the site that are being demolished.
Cherrywood Pointe at 2996 Cleveland Avenue in Roseville is another project that just opened in late 2012. According to the site plan submitted as part of the development ap‐plication, this project consists of 56 assisted living units and 24 memory care units.
Shoreview Senior Living is a 103‐unit catered living facility that just opened in December 2012. The project consists of 54 congregate units, 34 assisted living units, and 15 units for memory care.
Because the Roseville properties are located a relatively long distance from the subject property, they have a draw area that overlaps with other markets in the region. As such, we only include half of the Roseville units in our demand calculations presented later in this market study.
Pending Senior Housing Developments in the PMA In order to assess future competition for a potential project on the subject property, Maxfield Research interviewed planning staff from communities in the PMA to learn of any proposed or planned senior housing developments that may impact senior housing demand in the Market Area. We identified three proposed senior housing developments in the PMA, totaling 227 units (77 active adult, 32 congregate, 81 assisted living, and 37 memory care).
Presbyterian Homes recently opened the first phase of their Johanna Shores redevelopment at 3220 Lake Johanna Boulevard which includes 54 congregate units, 36 assisted living units, and 18 memory care units. Phase II will include demolition of the existing buildings on the Site, except for the McKnight Care Center, and the construction of 36 additional assisted living and 18 memory care units. Phase III will include the construction of two new brown‐stone style apartments with 36 independent living units.

SENIOR HOUSING MARKET ANALYSIS
MAXFIELD RESEARCH INC. 83
Coventry Senior Living has been approved for a 96‐unit senior housing development at 2320/2340 County Highway 10 in Mounds View. The project will consist of 32 congregate units, 45 assisted living units, and 19 units for memory care. Construction is expected to begin in February 2013.
United Properties has begun construction of a second phase to their Applewood Pointe at Langton Lake senior housing cooperative. Phase II will consist of 41 units ranging in size from 1,188 square feet to 1,659 square feet.
Market Rate Adult/Few Services Senior Housing Demand Table E‐6 presents our demand calculations for market rate active adult/few services housing in the PMA in 2012 and 2017. The market for active adult/few services housing is comprised of older adult (age 55 to 64), younger senior (age 65 to 74) and older senior (age 75+) households, with market demand weighted most heavily toward older seniors. In order to arrive at the potential age‐, income‐ and asset‐qualified base for active adult housing, we include all age‐qualified households with incomes of $35,000 or more plus homeowner households with incomes between $25,000 and $34,999 who would qualify with the proceeds from a home sale. The number of qualifying homeowner households is estimated by applying the appropriate homeownership rate, as identified in Table E‐3 to each age cohort. We estimate there are 16,125 age‐, income‐ and asset‐qualified PMA households that comprise the market for active adult housing in 2012, increasing to 17,815 qualified households in 2017. Adjusting to include appropriate capture rates for each age cohort (0.5% of households age 55 to 64, 5.0% of households age 65 to 74, and 12.0% of households age 75 and older) results in a demand potential for 728 active adult housing units in 2012 and 793 units in 2017. These capture rates reduce the total number of age/income/asset‐qualified households to consider only the portion of older adult and senior households who would be able, willing, and inclined to move to senior housing alternatives, including both owner‐ and renter‐occupied housing. We estimate that seniors currently residing outside the PMA will generate 25% of the demand for active adult housing – increasing demand to 970 active adult units in 2012. Demand from outside the PMA includes parents of adult children living in the PMA, individuals who live outside the PMA but have an orientation to the area and former residents who desire to return upon retirement. Demand for active adult/few services housing in the PMA is apportioned between ownership and rental product types. Based on the age distribution of the PMA population, homeowner‐ship rates and trends for senior housing product, we project that 40% of the PMA’s demand will be for owner‐occupied active adult housing (388 units in 2012), and the remaining 60% of demand will be for rental active adult housing units (582 units in 2012).
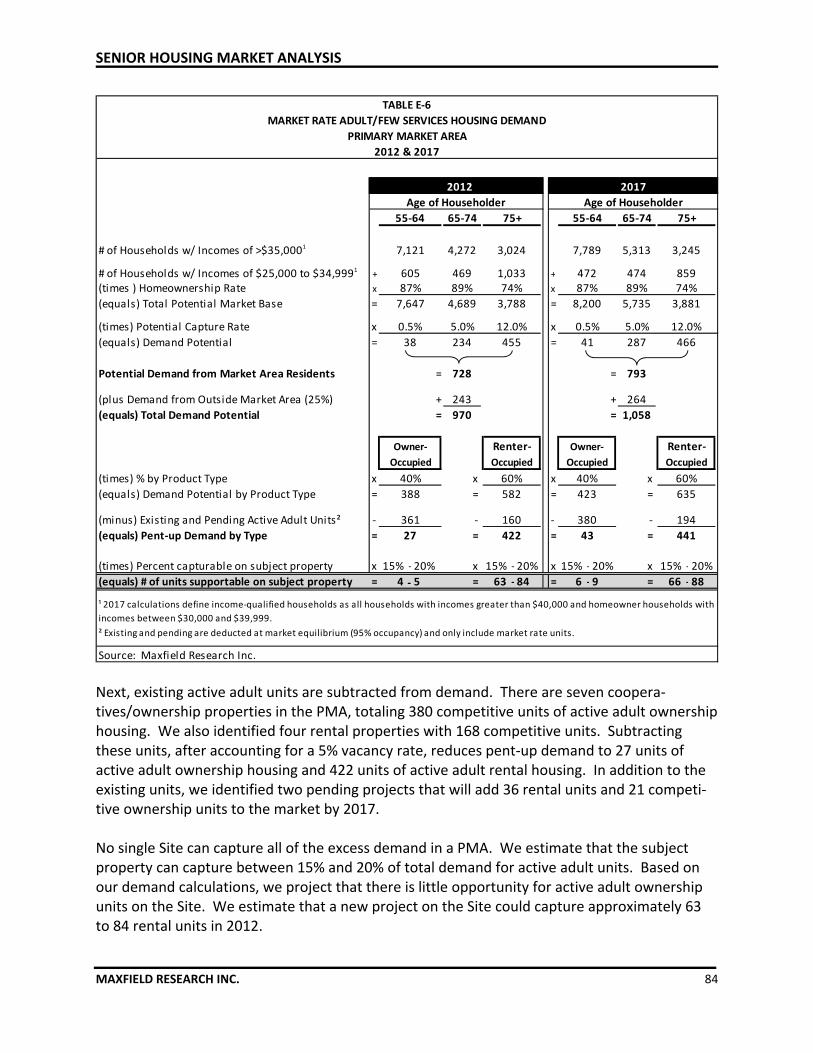
SENIOR HOUSING MARKET ANALYSIS
MAXFIELD RESEARCH INC. 84
Next, existing active adult units are subtracted from demand. There are seven coopera‐tives/ownership properties in the PMA, totaling 380 competitive units of active adult ownership housing. We also identified four rental properties with 168 competitive units. Subtracting these units, after accounting for a 5% vacancy rate, reduces pent‐up demand to 27 units of active adult ownership housing and 422 units of active adult rental housing. In addition to the existing units, we identified two pending projects that will add 36 rental units and 21 competi‐tive ownership units to the market by 2017. No single Site can capture all of the excess demand in a PMA. We estimate that the subject property can capture between 15% and 20% of total demand for active adult units. Based on our demand calculations, we project that there is little opportunity for active adult ownership units on the Site. We estimate that a new project on the Site could capture approximately 63 to 84 rental units in 2012.
65‐74 65‐74
# of Households w/ Incomes of >$35,0001 4,272 5,313
# of Households w/ Incomes of $25,000 to $34,9991 + 469 + 474
(times ) Homeownership Rate x 89% x 89%
(equals) Total Potential Market Base = 4,689 = 5,735
(times) Potential Capture Rate x 5.0% x 5.0%
(equals) Demand Potential = 234 = 287
Potential Demand from Market Area Residents = 728 = 793
(plus Demand from Outside Market Area (25%) + 243 + 264
(equals) Total Demand Potential = 970 = 1,058
(times) % by Product Type x x x x
(equals) Demand Potential by Product Type = = = =
(minus) Existing and Pending Active Adult Units² ‐ ‐ ‐ ‐
(equals) Pent‐up Demand by Type = = = =
(times) Percent capturable on subject property x 15% ‐ 20% x 15% ‐ 20% x 15% ‐ 20% x 15% ‐ 20%
(equals) # of units supportable on subject property = 4 ‐ 5 = 63 ‐ 84 = 6 ‐ 9 = 66 ‐ 88
Source: Maxfield Research Inc.
60%
635
194
44143
40%
423
380
Occupied
41
Owner‐
Occupied
75+
3,245
85974%
3,881
12.0%
466
Renter‐
0.5%
Occupied
55‐64
7,789
47287%
8,200
75+
3,024
455
TABLE E‐6
MARKET RATE ADULT/FEW SERVICES HOUSING DEMAND
PRIMARY MARKET AREA
2012 & 2017
¹ 2017 calculations define income‐qualified households as all households with incomes greater than $40,000 and homeowner households with
incomes between $30,000 and $39,999.
388 582
55‐64
7,121
60587%
7,647
0.5%
1,03374%
38
² Existing and pending are deducted at market equilibrium (95% occupancy) and only include market rate units.
2012 2017
Age of Householder Age of Householder
Owner‐
60%
Occupied
40%
160
42227
361
3,788
12.0%
Renter‐

SENIOR HOUSING MARKET ANALYSIS
MAXFIELD RESEARCH INC. 85
Adjusting for inflation, we estimate that households with incomes of $40,000 or more and home‐owners with incomes of $30,000 to $39,999 would be candidates for active adult housing in 2017. Following the same methodology, we project that there will be demand for between 43 owner‐occupied and 441 active adult rental units in the PMA in 2017. Utilizing the 15% to 20% capture rate, demand for owner‐occupied active adult housing will remain negligible while there will be demand for approximately 66 to 88 rental units.
Demand for Congregate Senior Housing Table E‐7 presents our demand calculations for congregate living senior housing in the Primary Market Area in 2012 and 2017. This analysis focuses on the potential private pay/market rate demand for congregate living units in the Primary Market Area. In order to arrive at the poten‐tial age‐income qualified base for congregate senior housing, we include all senior households with incomes of $35,000 or more and homeowners with incomes between $25,000 and $35,000 who would qualify with the proceeds from a home sale (this proportion was estimated based on the homeownership rates for each age cohort). Senior householders with incomes of $35,000 allocating 65% of their income toward base housing cost could afford beginning rents of $1,900. We estimate the number of age/income/asset‐qualified households in the Market Area to be 8,478 householders as of 2012, increasing to 9,616 in 2017. Demand for congregate housing is need‐driven, which reduces the qualified market to only the portion of seniors who need some assistance. Thus, the age/income‐qualified base is multiplied by the percentage of seniors who need some assistance with IADLs (at least three), but not six or more ADLs/IADLs, as these frailer seniors would need the level of care found in service‐intensive assisted living. According to the Summary Health Statistics of the U.S. Population: National Health Interview Survey, 2007 (conducted by the U.S. Department of Health and Human Services), the percentage of seniors having limitation in activities of daily living (bathing, dressing, toileting, transferring, eating) and instrumental activities of daily living (using the telephone, shopping, food preparation, housekeeping, laundry, transportation, taking medica‐tion, handling finances) are as follows: Limitation in ADLs & IADLs Age ADLs IADLs 65‐74 years 3.3% 6.3% 75+ years 11.0% 20.0% It is most likely that seniors who need assistance with ADLs also need assistance with multiple IADLs, and are more likely to be candidates for service‐intensive assisted living. The prime candidates for congregate living are seniors needing assistance with IADLs, but not ADLs. We derive the capture rate for congregate housing by subtracting the percentage of seniors need‐ing assistance with ADLs from those needing assistance with IADLs, which equates to 3.0% of seniors age 65 to 74 and 9.0% of seniors 75+. For the purposes of this report and understand‐ing current market conditions and a sluggish housing market, we have reduced the potential

SENIOR HOUSING MARKET ANALYSIS
MAXFIELD RESEARCH INC. 86
capture rates for the 65 to 74 age group to 1.5% while increasing the capture rate of the 75+ age group to 11.0%. Multiplying the senior household base by these capture rates results in Market Area demand potential for 487 congregate housing units in 2012 and 513 units in 2017. As discussed earlier in this report, we estimate that seniors currently residing outside the Market Area will generate 25% of the demand for congregate senior housing – increasing total demand by 162 congregate units in 2012. This demand consists primarily of parents of adult children living in the Market Area, individuals who live just outside the Market Area and have an orientation to the area, retirees who wish to relocate to the area and former residents who desire to return upon retirement. Together, the demand from Market Area seniors and de‐mand from seniors who would relocate to the Market Area totals about 649 congregate units as of 2012 and 684 units in 2017.
# of Householders w/ Incomes of $35,000+ in 2012 / $40K in 2017
(plus) + +
# of Hhldrs w/ Incomes of $25K ‐ $35K in 2012 / $30K ‐ $40K in 2017
(times) Homeownership Rate x x
(equals) Potential Market = =
(equals) Total Potential Market Base = =
(times) Potential Capture Rate of Congregate Living Demand1
x x
(equals) Potential Demand = + = +
Total Local Demand Potential = =
(plus) Demand from Outside the PMA (25%) + +
(equals) Total Demand Potential = =
(minus) Existing Competitive Units2
‐ ‐
(equals) Excess Limited‐Care Demand Potential = =
(times) Proportion Capturable on Site x 15% ‐ 20% x 15% ‐ 20%
(equals) Excess Limited‐Care Demand Potential on the Site = 32 ‐ 42 = 32 ‐ 43
Source: Maxfield Research Inc.
2 Competitive existing and pending units at 95% occupancy (market equilibrium).
1 The potential capture rate is derived from data from the Summary Health Statistics for the U.S. Population: National
Health Interview Survey, 2007 by the U.S. Department of Health and Human Services. The capture rate used is the
percentage of seniors needing assistance with IADLs, but not ADLs (seniors needing assistance with ADLs typcially need
assistance with multiple IADLs and are primary candidates for service‐intensive assisted l iving.).
210 214
417 764 422 636
439 470
70 417 86 427
487 513
162 171
649 684
1.5% 11.0% 1.5% 11.0%
4,689 3,788 5,735 3,881
TABLE E‐7
CONGREGATE LIVING DEMAND
PRIMARY MARKET AREA
2012 & 2017
4,272 3,024 5,313 3,245
2012 2017
Age of
Householder
Age of
Householder
65‐74 75+ 65‐74 75+
89% 74% 89% 74%
469 1,033 474 859

SENIOR HOUSING MARKET ANALYSIS
MAXFIELD RESEARCH INC. 87
Next, existing and pending congregate units are subtracted from overall demand. There are eight properties with a total of 646 units in the Market Area. Overall, we subtract 439 competi‐tive units from the demand potential after accounting for a 5% vacancy rate and adjusting the number of competitive units based on distance from the Site, resulting in a total Market Area excess demand potential of 210 units in 2012, expanding to 214 units in 2017 despite the additional units planned in Mounds View. No single site can capture all of the potential demand in a PMA. We preliminarily estimate that the subject Site in Arden Hills could capture between 15% and 20% of the PMA excess demand for a total range of 32 to 42 units in 2012 and 2017.
Assisted Living Demand Estimate Table E‐8 presents our demand calculations for assisted living housing in the PMA in 2012 and 2017. This analysis focuses on the potential private pay/market rate demand for assisted living units in the PMA. The availability of more intensive support services such as meals, housekeeping and personal care at assisted living facilities usually attracts older, frailer seniors. According to the 2009 Overview of Assisted Living (which is a collaborative research project by the American Associa‐tion of Homes and Services for the Aging, the American Seniors Housing Association, National Center for Assisted Living, and National Investment Center for the Seniors Housing and Care Industry), the average age of residents in freestanding assisted living facilities was 87 years in 2008. Hence, the age‐qualified market for assisted living is defined as seniors ages 75 and over, as we estimate that of the half of demand from seniors under age 87, almost all would be over age 75. In 2012, there were an estimated 8,972 seniors ages 75 and over in the PMA and we project that this number will increase to 9,732 in 2017. Demand for assisted living housing is need‐driven, which reduces the qualified market to only the portion of seniors who need assistance. According to a study completed by the U. S. Census Bureau (1990 & 1991 panels of the Survey of Income and Program Participation (SIPP) files), about 30% of seniors needed assistance with everyday activities (from 19.5% of 75‐to‐79‐year‐olds, to 31.2% of 80‐to‐84‐year‐olds and 49.5% of 85+ year olds). Applying these percentages to the senior population yields a potential assisted living market of an estimated 2,982 seniors in the PMA in 2012 and 3,217 in 2017. Due to the supportive nature of assisted living housing, most daily essentials are included in monthly rental fees which allow seniors to spend a higher proportion of their incomes on housing with basic services. Therefore, the second step in determining the potential demand for assisted living housing in the PMA is to identify the income‐qualified market based on a senior’s ability to pay the monthly rent. We consider seniors in households with incomes of $40,000 or greater to be income‐qualified for assisted living senior housing in the PMA.

SENIOR HOUSING MARKET ANALYSIS
MAXFIELD RESEARCH INC. 88
Households with incomes of $40,000 could afford monthly assisted living fees of $3,000 by allocating a high proportion of their income toward the fees. According to the 2009 Overview of Assisted Living, the average arrival income of assisted living residents in 2008 was $27,260, while the average annual assisted living fee was $37,281 ($3,107/month). This data highlights
Percent Percent
Needing Needing
Age group People Assistance¹ People Assistance¹
75 ‐ 79 3,218 19.5% 3,666 19.5%
80 ‐ 84 2,697 31.2% 2,734 31.2%
85+ 3,057 49.5% 3,332 49.5%
Total 8,972 9,732
Percent Income‐Qualified2
Total potential market
(times) Percent l iving alone x
(equals) Age/income‐qualified singles needing assistance =
(plus) Proportion of demand from couples (12%)³ +
(equals) Total age/income‐qualified market needing assistance =
(times) Potential penetration rate4
x
(equals) Potential demand from PMA residents =
(plus) Proportion from outside the PMA (25%) +
(equals) Total potential assisted l iving demand =
(minus) Existing market rate assisted l iving units5
‐
(equals) Total excess market rate assisted living demand =
(times) Percent that could be captured on the Site in Rochester x 15% ‐ 20% 15% ‐ 20%
(equals) Excess market rate assisted living demand on the Site = 47 ‐ 63 48 ‐ 63
Source: Maxfield Research Inc.
1 The percentage of seniors needing assistance with ADLs, based on the 1990 & 1991 panels of the Survey of Income
and Program Participation (SIPP) fi les, conducted by the U.S. Census Bureau.2 Includes households with incomes of $40,000 or more (who could afford monthly rents of $3,000+ per month) plus
40% of the estimated owner households with incomes below $40,000 (who will spend down assets, including home‐
equity, in order to l ive in assisted l iving housing).
3 The 2009 Overview of Assisted Living (a collaborative project of AAHSA, ASHA, ALFA, NCAL & NIC) found that 12% of
assisted l iving residents are couples.4 We estimate that 60% of the qualified market needing assistance with ADLs could either remain in their homes or
reside at less advanced senior housing with the assistance of a family member or home health care, or would need
greater care provided in a skilled care faci l ity.
5 Existing and pending units at 95% occupancy, minus units estimated to be occupied by Elderly Waiver residents.
212 273
315 317
119 133
988 1,106
40% 40%
395 442
132 147
527 590
2,982 3,217
1,581 1,769
53% 55%
55% 55%
869 973
1,513 1,649
Number Number
Needing Needing
Assistance1
Assistance1
628 715
841 853
TABLE E‐8
MARKET RATE ASSISTED LIVING DEMAND
PRIMARY MARKET AREA
2012 & 2017
2012 2017
SENIOR HOUSING MARKET ANALYSIS
MAXFIELD RESEARCH INC. 89
that seniors are spending down assets to live in assisted living and avoid institutional care. Thus, in addition to households with incomes of $40,000 or greater, there is a substantial base of senior households with lower incomes who income‐qualify based on assets – their homes, in particular. Seventy four percent of age 75+ households in the PMA are homeowners and the average resale price of single‐family homes in the PMA through November 2012 was $215,588. Seniors selling their homes for the median price would generate about $202,653 in proceeds after selling costs. With an average monthly fee of $3,500, these proceeds would last approximately five years (60 months) in assisted living housing, which is longer than the average length of stay in assisted living (20 months according to the 2009 Overview of Assisted Living). For the age groups in Table 7, we estimate the income‐qualified percentage to be all seniors in households with incomes at or above $40,000 (who could afford monthly rents of $3,000+ per month) plus 40% of the estimated seniors in owner households with incomes below $40,000 (who will spend down assets, including home‐equity, in order to live in assisted living housing). This results in a total potential market for about 1,581 units from the PMA in 2012. Because the vast majority of assisted living residents are single (88% according to the 2009 Overview of Assisted Living), our demand methodology multiplies the total potential market by the percentage of seniors age 75+ in the PMA living alone, or 55% based on Census data. This results in a total base of about 869 age/income‐qualified singles. The 2009 Overview of Assist‐ed Living found that 12% of residents in assisted living were couples. Including couples results in a total of 988 age/income‐qualified seniors needing assistance in the PMA in 2012. We estimate that 60% of the qualified market needing significant assistance with ADLs could either remain in their homes or less service‐intensive senior housing with the assistance of a family member or home health care, or would need greater care provided in a skilled care facility. The remaining 40% could be served by assisted living housing. Applying this market penetration rate of 40% results in demand for 395 assisted living units in 2012. We estimate that a portion of demand for assisted living units in the PMA (25%) will come from outside the PMA. This secondary demand will include seniors currently living just outside the PMA, former residents, and parents of adult children who desire supportive housing near their adult children. Applying this figure results in total potential demand for 527 assisted living units in 2012. Next, existing and pending assisted living units are subtracted from overall demand. There are seven existing properties in the PMA with a total of 428 assisted living units. However, we adjust the number of competing units based on location and exclude estimated units occupied by low‐income seniors utilizing Elderly Waivers (56 units). After subtracting the 212 existing units (minus a 5% vacancy factor) from the total demand equals an excess demand potential for 315 assisted living units in the PMA in 2012. Following this same methodology, we project that

SENIOR HOUSING MARKET ANALYSIS
MAXFIELD RESEARCH INC. 90
total excess demand in the PMA will hold steady at 317 units in 2017 after including the pend‐ing assisted living units. Allocating a range of 15% to 20% of the total assisted living demand to the Site in Arden Hills results in excess demand for between 47 and 63 additional assisted living units in 2012, with little change in 2017.
Demand for Memory Care Senior Housing Table E‐9 presents our demand calculations for memory care housing in the Primary Market Area in 2012 and 2017. Demand is calculated by starting with the estimated Market Area senior (ages 65+) population in 2012 and multiplying by the incidence rate of Alz‐heimer’s/dementia among this population’s age cohorts. This yields a potential market of about 2,591 seniors in the Primary Market Area in 2012. According to data from the National Institute of Aging, about 25% of all individuals with memory care impairments are a market for memory care housing units. This figure considers that seniors in the early stages of dementia will be able to live independently with the care of a spouse or other family member, while those in the latter stages of dementia will require intensive medical care that would only be available in skilled care facilities. Applying this figure to the estimated population with memory impairments yields a potential market of about 648 seniors in the Primary Market Area in 2012. Because of the staff‐intensive nature of dementia care, typical monthly fees for this type of housing start at about $4,000. Although some of the seniors will have high monthly incomes, most will be seniors willing to spend down assets and/or receive financial assistance from family members to afford memory care housing. Based on our review of senior household incomes in the Market Area, homeownership rates, and home sale data, we estimate that 44% of all seniors in the Market Area have incomes and/or assets to sufficiently cover the costs for memory care housing. This figure takes into account married couple households where one spouse may have memory care needs and allows for a sufficient income for the other spouse to live independently. Multiplying the potential market (648 seniors) by 44% results in a total of about 285 income‐qualified seniors in the Market Area in 2012. We estimate that 25% of the overall demand for memory care housing in Arden Hills would come from outside the Market Area, for a total demand for 380 units in 2012. Currently, there are six properties with 89 competing memory care units in the Market Area. We subtract 15% of these units (excluding public Elderly Waivers) and allocate a 7% vacancy factor for a total of 70 units. We also identified two projects with 37 memory care units that have been approved. The addition of these pending units (excluding Elderly Waivers and accounting for a 7% vacancy factor) reduces potential demand from 445 units to 346 units in 2017.
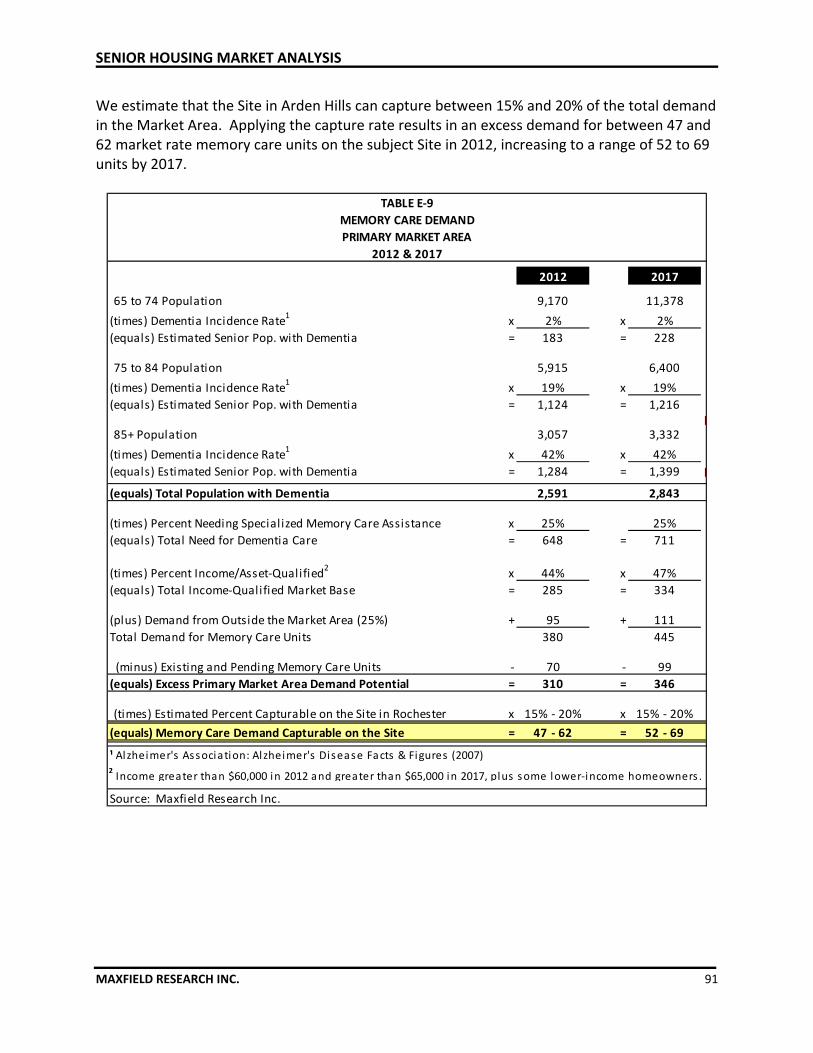
SENIOR HOUSING MARKET ANALYSIS
MAXFIELD RESEARCH INC. 91
We estimate that the Site in Arden Hills can capture between 15% and 20% of the total demand in the Market Area. Applying the capture rate results in an excess demand for between 47 and 62 market rate memory care units on the subject Site in 2012, increasing to a range of 52 to 69 units by 2017.
65 to 74 Population
(times) Dementia Incidence Rate1
x x
(equals) Estimated Senior Pop. with Dementia = =
75 to 84 Population
(times) Dementia Incidence Rate1
x x
(equals) Estimated Senior Pop. with Dementia = =
85+ Population
(times) Dementia Incidence Rate1
x x
(equals) Estimated Senior Pop. with Dementia = =
(equals) Total Population with Dementia
(times) Percent Needing Specialized Memory Care Assistance x
(equals) Total Need for Dementia Care = =
(times) Percent Income/Asset‐Qualified2
x x
(equals) Total Income‐Qualified Market Base = =
(plus) Demand from Outside the Market Area (25%) + +
Total Demand for Memory Care Units
(minus) Existing and Pending Memory Care Units ‐ ‐
(equals) Excess Primary Market Area Demand Potential = =
(times) Estimated Percent Capturable on the Site in Rochester x 15% ‐ 20% x 15% ‐ 20%
(equals) Memory Care Demand Capturable on the Site = 47 ‐ 62 = 52 ‐ 69
Source: Maxfield Research Inc.
346
TABLE E‐9
MEMORY CARE DEMAND
PRIMARY MARKET AREA
2012 & 2017
111
445
99
6,400
47%
334
2,843
25%
711
2017
11,378
2%
228
19%
1,216
3,332
42%
1,399
310
25%
648
44%
70
1,124
3,057
42%
¹ Alzheimer's Association: Alzheimer's Disease Facts & Figures (2007)2 Income greater than $60,000 in 2012 and greater than $65,000 in 2017, plus some lower‐income homeowners .
1,284
285
95
380
2,591
19%
2012
9,170
2%
183
5,915

SENIOR HOUSING MARKET ANALYSIS
MAXFIELD RESEARCH INC. 92
Senior Housing Demand Summary As described below, our assessment of the factors impacting demand for senior housing, including demographic, economic and competitive variables, supports additional active adult rentals, assisted living, and memory care senior housing in the PMA in 2012 and over the next five years. A growing older adult and senior population should maintain long‐term demand for senior housing alternatives in the PMA, although pending growth in the supply of senior hous‐ing in the PMA will limit demand growth between 2012 and 2017. There appears to be pent‐up demand for 422 active adult rental units in the PMA. Based on a capture rate of 15% to 20%, we estimate that the subject property could support between 63 and 84 active adult rental units in 2012, increasing to a range of 66 to 88 active adult rental units in 2017. Due, in large part, to the large supply of active adult ownership units in the PMA, we found little demand for new active adult ownership housing. There is currently demand to support an additional 32 to 42 congregate and 47 to 63 assisted living units on the Site in 2012, with little change in demand expected by 2017. We also find demand for 47 to 62 memory care units. By 2017, memory care demand is expected to grow to between 52 and 69 units. If residency to lower‐income residents with Elderly Waivers is al‐lowed, then more units could be supported.
It should be noted that our conclusions are preliminary and do not consider the quality of a specific site for a senior housing development, historical performance of other senior housing developments in the PMA, price and positioning of the subject project, or other important factors (i.e. architectural, marketing and management issues) that would likely impact the market feasibility of the subject development.
Service Level
2012 2017
Active Adult ‐ Owner 27 43 4 ‐ 5 6 ‐ 9
Active Adult ‐ Rental 422 441 63 ‐ 84 66 ‐ 88
Congregate 210 214 32 ‐ 42 32 ‐ 43
Assisted Living 315 317 47 ‐ 63 48 ‐ 63
Memory Care 310 346 47 ‐ 62 52 ‐ 69
Total Units 1,284 1,361 193 ‐ 256 204 ‐ 272
Source: Maxfield Research Inc.
20172012
TABLE E‐10
PRIMARY MARKET AREA
2012 & 2017
Total Excess Demand
in the PMA
Demand Capturable
on a Site
SENIOR HOUSING DEMAND SUMMARY

RETAIL MARKET ANALYSIS
MAXFIELD RESEARCH INC. 93
Introduction This section presents and analyzes information relating to the condition of the retail market and the potential for future retail development in the Market Area. Information analyzed in this section includes consumer expenditures by Market Area residents, retail sales trends, and an analysis of the existing supply of retail space. Based on an analysis of this information, calcula‐tions of the retail development potential in the Market Area during this decade are presented. The potential for new retail development on the Site is greatly influenced by overall market conditions in the surrounding area.
Consumer Expenditure Patterns Table F‐1 shows estimated consumer expenditures for retail goods and services in the PMA in 2011, according to data obtained from ESRI based on Consumer Expenditure Surveys from the Bureau of Labor Statistics. The table shows the average expenditures per household and the amount spent in the Market Area by product or service. In addition, a Spending Potential Index (SPI) is illustrated for comparison purposes. The SPI is based on households and represents the annual expenditures for a product or service relative to the national average which is given a benchmark index of 100. An SPI of 115 indicates that the average annual expenditure by local consumers is 15% above the national average. In addition, the SMA is indexed in the table. The average expenditure reflects the average amount spent per household, while the total expendi‐ture reflects the aggregate amount spent by all households in the area. Consumer spending is influenced by market conditions and trends. In times of economic troubles, market conditions drive spending patterns toward convenience and necessities, whereas in times of a booming economy consumer trends feature opportunity and luxury items. Sales of luxury items and other large purchases are generally the first to falter during economic downturns. Two‐thirds of the national economy is driven by consumer spending. During the most recent recession, households decreased spending, increased savings, and reduced credit card debt as many households have been faced with job losses. In essence, when the housing market began its decline in late 2006 into 2007, consumer spending and consumer confidence followed. During the recession, consumers curtailed their spending habits as credit and home equity lines diminished as available sources of cash. Although consumer spending has increased in recent quarters, a change in consumer habits is likely to result in consumer spending levels below pre‐recession rates in the near term. Convenience, however, remains paramount, and convenience goods and services have shown little, if any, downturn in sales.

RETAIL MARKET ANALYSIS
MAXFIELD RESEARCH INC. 94
SMA
Expenditures
Total Average Average Primary Secondary
Category ($000's) Per HH Per HH Market Area Market Area
Index Index
Apparel & Services 238,417 1,958 1,777 84 77
Entertainment and Recreation 466,659 3,832 3,416 123 109
Nonprescription Drugs 13,906 114 102 114 102
Prescription Drugs 68,101 559 493 116 102
Eye Glasses & Contact Lenses 11,087 91 81 122 108
Personal Care Products 56,352 463 418 120 108
Day Care 68,394 562 506 125 113
School Books & Supplies 14,870 122 116 118 112
Smoking Products 55,190 453 430 109 104
Computer Hardware 27,252 224 204 121 110
Computer Software 4,099 34 31 122 110
Pets 74,353 611 542 146 130
Index Index
Food at Home 619,342 5,086 4,634 117 107
Food Away from Home 456,857 3,751 3,403 120 109
Alcoholic Beverages 82,744 679 622 123 113
Misc. Beverages at Home 60,271 495 453 117 107
Index Index
Home Mortgage Payment/Rent 1,423,391 11,688 10,037 129 111
Maintenance & Remodeling Services 302,852 2,487 2,104 129 109
Maintenance & Remodeling Materials 52,054 427 367 119 102
Util ities 631,426 5,185 4,670 118 106
Index Index
Household Textiles 18,980 156 139 121 108
Furniture 87,062 715 636 123 109
Floor Coverings 11,366 93 81 128 111
Major Appliances 42,562 349 307 119 104
Small Appliances 4,588 38 34 119 107
Housewares 10,767 88 80 106 96
Luggage 1,373 11 10 126 111
Telephone & Accessories 4,048 33 31 81 74
Lawn & Garden 60,338 495 424 122 105
Moving/Storage/Freight Express 8,302 68 62 116 106
Housekeeping Supplies 97,987 805 724 118 106
Index Index
Investments 240,369 1,974 1,701 117 101
Vehicle Loans 674,118 5,535 5,000 116 105
Owners & Renters Insurance 67,257 552 475 123 106
Vehicle Insurance 164,241 1,349 1,214 119 108
Life/Other Insurance 60,390 496 429 123 106
Health Insurance 270,430 2,221 1,963 119 105
Home
Household Furnishings, Equipment, & Operations
PMA Annual
Expenditures
Spending Potential Index
to USA
Financial & Insurance
CONTINUED
Food
TABLE F‐1
HOUSEHOLD EXPENDITURES BY SELECTED PRODUCT TYPE
TCAAP SITE PRIMARY MARKET AREA
2011
Goods & Services

RETAIL MARKET ANALYSIS
MAXFIELD RESEARCH INC. 95
The following are key points from the household expenditures table.
Overall, residents from the PMA are estimated to have spent approximately $3.19 billion on retail goods and services in 2011, excluding housing, finance/insurance, and travel expendi‐tures, as well as vehicle purchases.
Average annual expenditures (excluding the categories mentioned above) are estimated to be $25,590 per household in the PMA. This compares to a Secondary Market Area average of $23,122 per household in 2011.
As reflected in the SPI, expenditures by PMA households are substantially higher than both the national average and SMA in virtually every product and service category except Appar‐el and Services and Telephone and Accessories. SMA expenditures are generally higher than the national average.
SMA
Expenditures
Total Average Average Primary Secondary
Category ($000's) Per HH Per HH Market Area Market Area
Index Index
Cars and Trucks (Net Outlay) 613,370 5,037 4,527 118 106
Gasoline and Motor Oil 392,436 3,222 2,927 116 105
Vehicle Maintenance/Repair 133,074 1,093 982 120 107
Index Index
Airline Fares 69,377 570 501 128 113
Lodging 65,028 534 463 126 110
Vehicle Rental 5,699 47 41 131 115
Food & Drink 63,478 521 457 124 108
Summary
Goods & Services 1,098,680 8,411 7,574
Food 1,219,214 10,011 9,113
Home 2,409,723 19,787 17,178
Household 347,373 2,852 2,527
Financial and Insurance 1,476,806 12,127 10,782
Transportation 1,138,880 9,352 8,435
Travel 203,581 1,672 1,462
Total 7,894,256 64,212 57,071
Sources: ESRI; Maxfield Research Inc.
HOUSEHOLD EXPENDITURES BY SELECTED PRODUCT TYPE
TCAAP SITE PRIMARY MARKET AREA
2011
Spending Potential Index
to USA
TABLE F‐1
Transportation
Travel
PMA Annual
Expenditures
(CONTINUED)
Note: The Spending Potential Index is based on households and represents the amount spent for a product or
service relative to the national average of 100.

RETAIL MARKET ANALYSIS
MAXFIELD RESEARCH INC. 96
Average annual expenditures per household in the PMA are estimated to be approximately $64,212 in the PMA compared to $57,071 in the SMA, a 12.5% difference. Housing expens‐es account for approximately one‐third of total consumer expenditures in the PMA with res‐idents spending about 15% more than the SMA average.
The roughly 121,783 households in the PMA spent a total of $7.9 billion on retail expendi‐tures in 2011. With the number of households projected to grow to 126,497 in 2017, they would generate an additional $38 million in expenditures annually, not factoring in inflation.
Retail Demand Potential and Leakage The table on the following page presents retail sales data for the PMA. The sales information is from ESRI based on household counts. This information lists retail demand (potential sales), retail supply to consumers (retail sales) and provides a picture of the gap between the area’s retail supply and demand. A positive value represents “leakage” of retail opportunity to stores outside of the PMA. A negative value represents a “surplus,” where more customers are coming into the area for retail goods and services than there are households in the area. The following are key points of the retail demand potential.
In 2010, the PMA had leakage in retail sales in 11 retail sectors, including: Motor Vehicle and Parts Dealers; Furniture and Home Furnishings Stores; Electronics & Appliance Stores; Building Materials, Garden Equipment, and Supply Stores; Health & Personal Care Stores; Clothing and Accessories Stores; General Merchandise Stores; Miscellaneous Store Retail‐ers; Nonstore Retailers; and, Food Services and Drinking Places.
(10.0) (5.0) 0.0 5.0 10.0 15.0 20.0 25.0 30.0 35.0
Motor Vehicle & Parts Dealers
Furniture & Home Furnishings Store
Electronics & Appliance Stores
Bldg Materials, Garden Equip. & Supply Stores
Food & Beverage Store
Health & Personal Care Stores
Gasoline Stations
Clothing and Clothing Accessories Stores
Sporting Goods, Hobby, Book, and Music Stores
General Merchandise Stores
Miscellaneous Store Retailers
Nonstore Retailers
Food Services & Drinking Places
Surplus/Leakage by Industry
------surplus------ ------leakage------

RETAIL MARKET ANALYSIS
MAXFIELD RESEARCH INC. 97
Surpluses existed in two retail industry groups; Gasoline Stations and Sporting Goods, Hobby, Book, and Music Stores. The following retail subcategories also have surpluses:
Demand Supply Retail Gap Surplus/Leakage Number of
Industry Group (NAICS Code) (Retail Potential) (Retail Sales) (Demand ‐ Supply) Factor Businesses
Total Retail Trade and Food & Drink (NAICS 44‐45, 722) $3,838,120,319 $2,922,208,437 $915,911,882 13.5 2,108
Total Retail Trade (NAICS 44‐45) $3,258,611,817 $2,474,711,786 $783,900,031 13.7 1,581
Total Food & Drink (NAICS 722) $579,508,502 $447,496,651 $132,011,850 12.9 527
Motor Vehicle & Parts Dealers $762,852,758 $449,738,091 $313,114,667 25.8 174
Automobile Dealers $652,621,735 $331,060,941 $321,560,794 32.7 66
Other Motor Vehicle Dealers $58,392,565 $75,778,330 ($17,385,765) (13.0) 46
Auto Parts, Accessories & Tire Stores $51,838,459 $42,898,820 $8,939,639 9.4 62
Furniture & Home Furnishings Stores $96,435,709 $95,842,364 $593,346 0.3 86
Furniture Stores $59,948,681 $55,924,740 $4,023,940 3.5 31
Home Furnishings Stores $36,487,029 $39,917,623 ($3,430,595) (4.5) 55
Electronics & Appliance Stores $88,961,579 $68,585,262 $20,376,317 12.9 100
Bldg Materials, Garden Equip. & Supply Stores $131,193,910 $98,594,957 $32,598,952 14.2 157
Bldg Material & Supplies Dealers $110,288,935 $86,487,978 $23,800,957 12.1 129
Lawn & Garden Equip & Supply Stores $20,904,975 $12,106,979 $8,797,995 26.7 28
Food & Beverage Stores $585,605,899 $416,762,372 $168,843,527 16.8 149
Grocery Stores $518,554,644 $357,111,786 $161,442,858 18.4 64
Specialty Food Stores $14,276,434 $8,495,758 $5,780,675 25.4 26
Beer, Wine & Liquor Stores $52,774,822 $51,154,828 $1,619,994 1.6 59
Health & Personal Care Stores $110,427,624 $81,429,771 $28,997,852 15.1 134
Gasoline Stations $554,357,410 $555,735,356 ($1,377,947) (0.1) 94
Clothing & Clothing Accessories Stores $112,266,903 $90,780,627 $21,486,277 10.6 212
Clothing Stores $90,404,191 $75,270,159 $15,134,032 9.1 149
Shoe Stores $12,979,810 $7,212,834 $5,766,976 28.6 25
Jewelry, Luggage & Leather Goods Stores $8,882,902 $8,297,634 $585,268 3.4 38
Sporting Goods, Hobby, Book & Music Stores $41,520,684 $45,574,736 ($4,054,052) (4.7) 135
Sporting Goods/Hobby/Musical Instr Stores $29,220,625 $34,025,172 ($4,804,547) (7.6) 117
Book, Periodical & Music Stores $12,300,060 $11,549,564 $750,496 3.1 18
General Merchandise Stores $547,968,860 $443,551,968 $104,416,892 10.5 63
Department Stores Excluding Leased Depts. $250,486,615 $236,554,598 $13,932,017 2.9 30
Other General Merchandise Stores $297,482,246 $206,997,371 $90,484,875 17.9 33
Miscellaneous Store Retailers $59,290,411 $39,331,200 $19,959,211 20.2 249
Florists $7,028,592 $5,859,876 $1,168,717 9.1 44
Office Supplies, Stationery & Gift Stores $12,639,236 $16,809,357 ($4,170,121) (14.2) 68
Used Merchandise Stores $2,913,686 $2,799,023 $114,663 2.0 28
Other Miscellaneous Store Retailers $36,708,897 $13,862,945 $22,845,953 45.2 109
Nonstore Retailers $167,730,069 $88,785,081 $78,944,987 30.8 28
Electronic Shopping & Mail‐Order Houses $140,930,920 $55,156,801 $85,774,119 43.7 4
Vending Machine Operators $1,994,627 $2,144,356 ($149,729) (3.6) 7
Direct Selling Establishments $24,804,522 $31,483,925 ($6,679,403) (11.9) 17
Food Services & Drinking Places $579,508,502 $447,496,651 $132,011,850 12.9 527
Full‐Service Restaurants $234,044,004 $183,969,700 $50,074,304 12.0 251
Limited‐Service Eating Places $263,805,810 $236,462,726 $27,343,084 5.5 230
Special Food Services $61,329,655 $11,768,956 $49,560,699 67.8 22
Drinking Places ‐ Alcoholic Beverages $20,329,033 $15,295,269 $5,033,764 14.1 24
Sources: ESRI; Maxfield Research Inc.
SUMMARY
EXPENDITURE TYPE
Note: All figures quoted in 2010 dollars. Supply (retail sales ) estimates sales to consumers by establishments, sales to businesses are excluded.
Demand (retail potential) estimates the expected amout spent by consumers at a retail establishment. Leakage/Surplace factor measures the
relationship between supply and demand and ranges from +100 (total leakage) to ‐100 (total surplus). A positive value represents "leakage" of
retail opportunity outside the trade area. A negative value represents a surplus of retail sales, a market where customers are drawn in from outside
the trade area.
TABLE F‐2
RETAIL DEMAND POTENTIAL AND LEAKAGE
TCAAP SITE PRIMARY MARKET AREA
2010

RETAIL MARKET ANALYSIS
MAXFIELD RESEARCH INC. 98
Other Motor Vehicle Dealers; Home Furnishings Stores; Office Supplies, Stationary and Gift Stores; Vending Machine Operators; and, Direct Selling Establishments.
Data indicates that, while a few surpluses exist, a variety of retailers considering the Market Area should be able to capture sales that are currently being transacted outside of the PMA. By dollar volume, retail leakage was greatest in Automobile Dealers, Grocery Stores, Food Services and Drinking Places, and General Merchandise Stores.
Types of Retail Goods and Customer Shopping Patterns The following describes the various types of retail goods and the manner in which customers generally shop for these goods. Because of the significant diversification of retail outlets, some of these categories overlap in certain cases. Shopping goods are those on which shoppers spend the most effort and for which they have the greatest desire to comparison shop. The trade area for shopping goods tends to be gov‐erned by the urge among shoppers to compare goods based on selection, service and price. Therefore, the size of the trade area for shopping goods is affected most by the overall availa‐bility of goods in alternate locations. Some examples of shopping goods include furniture, appliances, clothing and automobiles. Convenience goods are those that consumers need immediately and frequently and are there‐fore purchased where it is most convenient for shoppers. Shoppers as a rule find it most convenient to buy such goods near home, near work or near a temporary residence when traveling. Examples of these types of goods include gasoline, fast food, liquor, groceries, pharmaceuticals, health and beauty aids, among others. Specialty goods are those on which shoppers spend more effort to purchase. Such merchandise has no clear trade area because customers will go out of their way to find specialty items wherever they are sold. By definition, comparison shopping for specialty goods is much less significant than for shopping goods. Examples of these include gift shops, florists, pet stores, art gallery, antiques, home furnishings, textiles (needlework and fabrics), art supplies, books. The home furnishings segment has some overlap between shopping goods and specialty goods. Impulse goods are those that shoppers do not actively or consciously seek. In stores, impulse goods are positioned near entrances or exits or in carefully considered relationships to shop‐ping goods. Impulse goods are most likely to be located as a segment within other stores to capture additional impulse revenue from customer traffic. Examples of these types of goods are: candy and drinks at a dry cleaning establishment, candy or small novelty items near the cash register at a gift shop, accessories or jewelry at the counter in a clothing store. These may be located within existing stores, but would not be a separate establishment.
RETAIL MARKET ANALYSIS
MAXFIELD RESEARCH INC. 99
Twin Cities Retail Market Conditions Maxfield Research analyzed retail market trends for the Twin Cities Metro Area, including total retail rentable area, vacancy rates, and absorption. The data is provided by Cushman & Wake‐field|NorthMarq. This information is useful in assessing the retail potential of the TCAAP Site as the overall health of the local retail market will influence the development potential of the Site. The data includes information for multi‐tenant retail buildings greater than 20,000 square feet in size. Retail properties have been classified into five major categories as established by Cushman & Wakefield|NorthMarq. These classifications are defined below. Community Center: Community Centers are greater than 100,000 square feet and have at least two anchor tenants which may include a general merchandise store in addition to a supermar‐ket or drug store. Limited small shop space is occupied by a mix of service‐oriented tenants and soft‐goods retailers. This classification also includes power centers which are built around large format category killers such as electronic, home improvement and sporting goods stores. Neighborhood Center: Neighborhood centers are usually anchored by a grocery store or a drug store. This type of center fulfills the day‐to‐day needs of the surrounding neighborhood, is located at major street intersections, and is roughly 30,000 to 100,000 square feet in size. Regional Center: A regional center is a major shopping area generally with two or more anchor department stores and a variety of additional shops. These centers draw customers from a broad geographical area. Specialty Center: Specialty centers are unanchored and have a theme or specialty tenants with a different character than the other center types. These centers are not located in CBD’s and they may be a part of a larger, community center development. Minneapolis or St. Paul CBD: Centers located in the Central Business District (CBD) of Minneap‐olis and St. Paul. This includes space located on the skyway or street fronts. To properly reflect the status of these submarkets, some of these centers may be smaller than 20,000 square feet due to the smaller size and scope of this market. Outlet Mall: Outlet malls are located along major freeways within a 100‐mile radius of the Twin Cities in the outer suburbs or Outstate Minnesota. Tenants are typically large retailers or manufacturers that use these locations to sell directly to consumers. Outlet malls have tradi‐tionally been designed to appeal to the value‐conscious shopper who wants brand‐name merchandise at off‐retail prices. Table F‐3 shows the growth of retail space and changes in vacancy in the various submarkets covered by Cushman & Wakefield|NorthMarq from July 2011 to July 2012. The points follow‐ing the table summarize key points from the Cushman & Wakefield|NorthMarq mid‐year 2012 Compass report.

RETAIL MARKET ANALYSIS
MAXFIELD RESEARCH INC. 100
The market experienced 110,610 square feet of negative absorption through the first half of 2012, generating a 0.5 percentage point increase in vacancy to 8.9%. Despite the uptick in vacancy, development activity is increasing as there is currently 1.07 million square feet un‐der construction, most notably at Shingle Creek Crossing – a 800‐000‐square foot Walmart‐anchored redevelopment of the former Brookdale Center in Brooklyn Center. In total, this project will include a 180,000‐square foot Walmart, the renovation of 150,000 square feet of the existing mall including Sears, an existing 75,000‐square foot Kohl’s, approximately 110,000 square feet of new junior box anchor sites, 105,000 square feet in nine retail pad sites, and over 20,000 square feet in three restaurant pads.
Developers are investing in new projects throughout the market that focus on answering the four main needs of future shoppers; convenience, experience, service, and community. National tenants such as Starbucks, Caribou Coffee, Noodles & Co. and Chipotle are cau‐tiously expanding.
Submarket
# of Retail
Centers
Total
Rentable SF
Total
Vacant SF
Percent
Vacant
1st Half 2012
Absorption
Last 12 Months
Absorption
Community 121 31,263,155 2,467,143 7.9% 139,246 (977)
Minneapolis CBD 17 1,574,001 341,402 21.7% 1,413 (9,048)
Neighborhood 306 19,706,033 2,461,598 12.5% (33,254) 159,064
Outlet Mall 3 788,440 19,500 2.5% 14,500 8,500
Regional 8 10,716,064 348,926 3.3% (208,638) (60,138)
Specialty 17 2,063,969 253,372 12.3% (26,236) (11,605)
St. Paul CBD 9 368,737 33,020 9.0% 2,359 2,359
Total Market 481 66,480,399 5,924,961 8.9% (110,610) 88,155
Submarket
# of Retail
Centers
Total
Rentable SF
Total
Vacant SF
Percent
Vacant
1st Half 2011
Absorption
Prev 12 Months
Absorption
Community 120 30,822,688 2,202,735 7.1% 210,594 369,563
Minneapolis CBD 17 1,574,001 355,448 22.6% (24,174) (83,554)
Neighborhood 308 19,995,658 2,690,238 13.5% (66,846) 60,582
Outlet Mall 3 788,440 28,000 3.6% 4,350 9,850
Regional 9 10,966,554 353,788 3.2% 52,600 131,935
Specialty 17 2,031,054 223,006 11.0% (41,739) 21,846
St. Paul CBD 9 368,737 35,379 9.6% 0 (1,274)
Total Market 483 66,547,132 5,888,594 8.8% 134,785 508,948
Sources: Cushman & Wakefield | NorthMarq; Maxfield Research, Inc.
2012
2011
TABLE F‐3
RETAIL VACANCY AND ABSORPTION
TWIN CITIES
2011 ‐ 2012

RETAIL MARKET ANALYSIS
MAXFIELD RESEARCH INC. 101
Several new retail concepts are looking to expand in neighborhood centers throughout the Twin Cities. Self‐serve frozen yogurt shops have regained popularity and are attracting at‐tention from landlords throughout the nation. Concepts such as Freeziac, Cherry Berry, Red Mango, Tutti Frutti, Menchie’s, FreeStyle Yogurt, and Yogurt Lab have all opened stores in the past year locally and have plans for more in the second half of 2012 and into 2013. The Twin Cities is also seeing an increase in fast‐casual sandwich shops such as Firehouse Subs, Which Wich, and Jersey Mike's. These users are generally attracted to strong existing trade areas or trade areas experiencing strong household and income growth.
Home furnishings and improvement stores have experienced improved performance recently. Locally, Becker Furniture World is expanding its smaller‐format stores in the Twin Cities suburbs. In Edina, Arhaus, a home design and furniture store, will open a 15,000‐sf store at the Galleria and Andrew Martin, a British furniture dealer, will join newly opened Kohler at Rue de France in the fall. In addition, Uptown Minneapolis is becoming a hub for home design and decor with the recent opening of Jonathan Adler joining CB2, Design with‐in Reach, Go Home and ROAM.
Warehouse clubs and supercenters continue to expand. Walmart, which is opening an 182,000‐square foot store at Shingle Creek Crossing in Brooklyn Center in the second half of 2012, has stores under construction in Blaine, Burnsville, Lakeville, Princeton and St. Cloud, and is proposing stores in Andover and Cottage Grove. Menards has a store under con‐struction in Richfield and is planning to relocate its existing Apple Valley store across the street to a larger, freestanding site.
Several landlords made moves to reposition existing retail space by leasing space to non‐traditional retail uses, such as medical users. HealthEast Care System opened a 26,000‐sf clinic in the former Borders space at Midway Marketplace in St. Paul. They also plan to
0.0%
5.0%
10.0%
15.0%
20.0%
25.0%
Community
Minneapolis CBD
Neighborhood
Outlet M
all
Regional
Specialty
St. Pau
l CBD
Total M
arket
Retail Vacancy Comparison
2012
2011

RETAIL MARKET ANALYSIS
MAXFIELD RESEARCH INC. 102
open a clinic in an old Gander Mountain store in Maplewood this fall. North Memorial is opening a clinic at Victory Village in Blaine in late 2012.
Other notable activity during early 2012 included: Gordmans opened a 60,000‐sf location at Crossroads of Roseville; Sports Authority and Office Depot closed at Northtown Village in Coon Rapids; HomeGoods and Charming Charlie took a combined 38,000 sf at the Fountains at Arbor Lakes in Maple Grove; Fratallone’s ACE Hardware opened a 23,000‐sf store at Burnhill Plaza in Burnsville; and Old Navy leased 14,000 sf at Rosedale Commons in Rose‐ville.
Healthy growth during the second half of 2012 is expected, with a projected 450,000 to 550,000 square feet of positive absorption. Much of this activity will occur in regional malls and community centers. The Twin Cities continues to be viewed as a highly‐desirable mar‐ket for new retailers and investors.
Retail Development Potential Demand for additional retail space, measured in gross leasable space in square feet, is calculat‐ed in the following table which combines demand information with supply to calculate the amount of retail space supportable at the Site. Sources of data used in the calculations include the Metropolitan Council and Maxfield Research Inc. (household growth trends), and ESRI (consumer expenditure). The demand calculation begins with an estimation of the total ex‐penditures for retail goods and services by PMA residents, excluding expenditures for automo‐biles, homes, finance and insurance, education, and travel. The following points summarize the retail demand methodology.
Because of growth in the PMA household base and accounting for inflation, PMA residents are expected to increase their overall retail expenditures from $3.1 billion in 2012 to over $4.0 billion in 2020.
As of 2012, total leakage of retail expenditures (including food and drink) from the PMA was estimated to be at 14%, indicating a substantial loss of potential retail sales. The subject property will likely attract stores in the previously‐mentioned retail categories where there is existing leakage. The most likely way to reduce leakage is to strengthen neighborhood goods and services sales in the categories where leakage currently exists.
The household base in the PMA is expected to grow by 4,714 households between 2012 and 2017 and another 2,217 households between 2017 and 2020. The result will be growth in retail expenditures by PMA residents of $458.0 million over the next five years and $441 million between 2017 and 2020.

RETAIL MARKET ANALYSIS
MAXFIELD RESEARCH INC. 103
Accounting for inflation along with the decline in consumer spending activity that resulted from the economic recession, we estimate that the average retail sales per square foot will increase from $266 in 2012 to $304 in 2020. The 2012 retail sales per square foot number reflects an average across neighborhood shopping centers in the Midwest and is based on information published in the “Dollars & Cents of Shopping Centers” prepared by the Inter‐national Council of Shopping Centers and the Urban Land Institute.
Dividing purchasing power by average retail sales per square foot equates to total demand for about 10.1 million square feet of retail space in the PMA in 2012, increasing to about 10.5 million square feet in 2017 and 11.4 million square feet in 2020 for a net gain of rough‐ly 1.3 million square feet from 2012 to 2020.
Because of the relatively large size of the PMA and the Site’s location within the PMA along I‐35W and Highway 10, we estimate that the subject property could capture roughly 15% to 20% of the growth in retail demand, resulting in demand from PMA households for approx‐imately 195,000 to 259,000 square feet of retail space between 2012 and 2020. Utilizing a floor area ratio range of 0.20 to 0.25 results in land area demand for between 18 and 30 acres to support the necessary retail development to meet projected demand on the Site.
Additional retail space could be supported on the Site if the tenant mix consisted of destina‐tion‐oriented retailers that are unique to the Market Area and would draw customers from a larger trade area.
2012 2017 2020
Retail Demand from Trade Area
Trade Area Households 121,783 126,497 128,714
(times) Annual Household Expenditures1
x $25,590 $28,253 $31,194
(equals ) Tota l Trade Area Expenditures = $3,116,426,970 $3,573,973,851 $4,015,113,167
(plus ) Approx. % Leakage Outs ide the Trade Area2
+ 14% 14% 14%
(equals ) Leakage Outs ide of Trade Area = $420,717,641 $482,486,470 $542,040,277
(equals ) Tota l Purchas ing Power $2,695,709,329 $3,091,487,381 $3,473,072,889
(divided by) Average sa les per Sq. Ft. / $266 $294 $304
(equals) Total Retail Space Demand (Sq. Ft.) = 10,134,246 10,515,263 11,431,282
Growth in reta i l demand 2012 to 2020
(times) % of PMA demand growth capturable by Si te x ‐‐ to ‐‐
(equals) Retail space supportable on subject Site (sq. ft.) = ‐‐ to ‐‐
2 Leakage i s the estimated amount of reta i l dol lars spent outs ide the PMA.
Sources : ESRI; Maxfield Research, Inc.
TABLE F‐4
DEMAND FOR RETAIL SPACE
TCAAP SITE PRIMARY MARKET AREA
2012 to 2020
1,297,036
15% 20%
Note: The 2012 leakage factor i s derived from subtracting the estimated reta i l sa les in the PMA from the tota l
reta i l expenditures by PMA res idents .
1 Excluding expenditures for home buying, finance & insurance, travel , vehicle sa les .
194,555 259,407

OFFICE MARKET ANALYSIS
MAXFIELD RESEARCH INC. 104
Introduction This section of the report analyzes the office market in the Market Area and calculates the potential for office development. Included in the analysis are a review of market conditions in the Twin Cities and an examination of employment and business growth trends. The potential for new office development in Arden Hills is greatly influenced by overall market conditions.
Twin Cities Office Market Conditions Maxfield Research analyzed office market trends for the Twin Cities Metro Area, including total rentable area, vacancy rates, and absorption. The data is provided by Cushman & Wake‐field|NorthMarq. This information is useful in assessing the potential for additional office space at the TCAAP Site as the overall health of the local office market will influence the devel‐opment potential of the Site. The data includes information for multi‐tenant office buildings greater than 20,000 square feet in size. The subject property and the PMA communities are situated in the Northeast Submarket as defined by Cushman & Wakefield|NorthMarq. Market statistics for the submarket are identified in the Office Vacancy and Absorption table on the following page. The following points summarize key findings from the Cushman & Wake‐field|NorthMarq mid‐year 2012 Compass report.
The market posted over 486,000 square feet of positive absorption during the first half of 2012, with five of the seven submarkets recording positive absorption.
Space absorption pushed the direct vacancy rate down 0.6 percentage point over the past year to 18.6% in the first half of 2012. Class A properties have the tightest vacancy rate, 14.1% across the market.
0.0%5.0%10.0%15.0%20.0%25.0%30.0%35.0%40.0%
Minneapolis CBD
Northeast
Northwest
South/Airport
Southwest
St. Pau
l CBD
West
Total M
arket
Office Vacancy Comparison
2012
2011

OFFICE MARKET ANALYSIS
MAXFIELD RESEARCH INC. 105
Recovery is most evident in the West submarket, where the direct space vacancy rate now stands at 14.8%, lower than any other submarket. The submarket posted roughly 69,000 square feet of positive first‐half absorption, including 53,000 square feet among class A properties. The direct vacancy rate in the submarket's class A buildings is 10.9%.
With a 34.7% direct vacancy rate, leasing conditions are softest in the Northwest submar‐ket. The submarket experienced over ‐60,000 square feet of negative absorption during the first half of 2012, putting it on track for a seventh consecutive year with negative absorp‐tion.
Rental rates are firming up, although concessions such as free rent and tenant improvement allowances are typical. A few landlords with high‐quality class A properties are gaining some pricing leverage, especially in the West and Southwest submarkets along with well‐located, higher‐floor space in the Minneapolis CBD. The average Net rental rate is $12.57 per square foot across the market, up 2.4% over the past year.
Submarket
# of Office
Buildings
Total
Rentable SF
Total
Vacant SF
Percent
Vacant
1st Half 2012
Absorption
Last 12 Months
Absorption
Minneapolis CBD 107 26,268,918 4,471,518 17.0% 248,251 444,520
Northeast 120 7,675,926 1,571,743 20.5% (38,967) (824)
Northwest 36 2,364,711 820,139 34.7% (60,412) (105,505)
South/Airport 81 5,770,573 1,023,170 17.7% 146,137 179,216
Southwest 144 14,362,470 2,500,171 17.4% 112,195 304,369
St. Paul CBD 45 6,950,402 1,720,101 24.7% 10,207 (98,951)
West 97 8,794,422 1,304,258 14.8% 68,968 (76,486)
Total Market 630 72,187,422 13,411,100 18.6% 486,379 646,339
Submarket
# of Office
Buildings
Total
Rentable SF
Total
Vacant SF
Percent
Vacant
1st Half 2011
Absorption
Prev 12 Months
Absorption
Minneapolis CBD 109 26,855,459 5,071,408 18.9% (80,141) 121,619
Northeast 120 7,683,586 1,595,656 20.8% 78,631 98,750
Northwest 36 2,364,711 714,634 30.2% 6,762 (126,180)
South/Airport 79 5,580,573 1,050,765 18.8% (4,904) 153,499
Southwest 146 14,281,085 2,635,896 18.5% 264,316 242,566
St. Paul CBD 44 6,895,206 1,641,638 23.8% (54,764) (126,981)
West 97 8,794,422 1,227,772 14.0% 114,117 163,005
Total Market 631 72,455,042 13,937,769 19.2% 324,017 526,278
Sources: Cushman & Wakefield | NorthMarq; Maxfield Research, Inc.
2012
2011
TABLE G‐1
OFFICE VACANCY AND ABSORPTION
TWIN CITIES
2011 ‐ 2012

OFFICE MARKET ANALYSIS
MAXFIELD RESEARCH INC. 106
In many submarkets, smaller space users remain sidelined due to the slow economic recovery and high moving costs which are estimated at $10‐$12 per square foot for a typical tenant. Those costs are hard to absorb for many smaller companies dealing with the effects of a slow economy.
Within the Northeast Submarket, many office users have been downsizing, resulting in negative absorption during the first half of 2012. Credit scoring agency FICO consolidated located from Arden Hills and Minneapolis and leased 93,000 sf at Rosedale Corporate Cen‐ter in Roseville. The National Marrow Transplant Program, located at Broadway Ridge Cor‐porate Center along I‐35W in northeast Minneapolis, is looking for 250,000 sf of space to lease and is considering locations in the Northeast submarket as well as Minneapolis.
Multi‐tenant office development has been minimal since the last of the developments launched pre‐recession were delivered in 2008 and 2009, and no new multi‐tenant projects are underway or expected to get underway until at least 2013. Opus Development Corp. recently announced plans to build a 212,000‐square foot office tower at Fourth Street and Nicollet Mall in Minneapolis for Xcel Energy which plans to take occupancy in 2016.
Approximately 470,000 square feet of positive absorption is projected for the second half of 2012. This level of absorption would result in 970,000 square feet of absorption in 2012, the market's highest annual absorption since 2006.
Business Growth by Type of Business The table on the following page presents the distribution of businesses that are typical users of office space by number of employees in Arden Hills in the years 2000 and 2010, the most recent data available. The data is extracted from the Business Register, a database of all known employer companies which is maintained and updated by the U.S. Census Bureau and is accu‐mulated based on Zip Code boundaries. For this analysis, we used the 55112 and 55126 Zip Codes for Arden Hills. These two Zip Codes also cover portions of Mounds View, New Brighton, and Shoreview. Growth in these sectors is an important indicator of total demand for office space and the size of businesses provides an indication of the type and sizes of office spaces required. In addition to businesses in these sectors, a small amount of office demand will be generated from other sectors, including government agencies. The following are key points.
The business categories include Information; Finance and Insurance; Real Estate; Profes‐sional, Scientific, and Technical Services; Management of Companies and Enterprises; Edu‐cation; and Health Care and Social Assistance. The number of businesses in these catego‐ries in the two Arden Hills Zip Codes increased from 699 businesses in 2000 to 776 busi‐nesses in 2010 (an increase of 11% over the ten‐year time period).

OFFICE MARKET ANALYSIS
MAXFIELD RESEARCH INC. 107
In 2010, the area had a total of 776 businesses which typically occupy office space, with 294 businesses (37.9%) in the Professional, Scientific, and Technical Services category. The Health Care and Social Assistance industry (includes child day cares, dentists, chiropractors and other medical doctors) comprised 205 businesses (26.4%) and the Finance and Insur‐ance sector had 118 businesses (15.2%). There were 90 businesses in the Real Estate sec‐tor, representing 11.6% of the total.
The Health Care and Social Assistance sector experienced the most dramatic growth during the decade, adding 63 businesses (+44%). Real estate added 12 companies for a 15% in‐crease. The only loss occurred in the Finance and Insurance sector which declined by ‐5% after losing six businesses.
Of the 776 businesses in the area, 65% had fewer than five employees, 14% had between five and nine workers, 12% had between 10 and 19 workers, 4% had 20 to 49 workers, and the remaining 5% had 50 or more workers.
The Health Care and Social Assistance industry had the highest number of large businesses with 18 companies having 50 or more workers (9%) while approximately 40% had fewer than five employees. Within the Professional, Scientific and Technical Services sector, 82% of the businesses had fewer than five employees while only 2% had 50 or more.
Real Estate Profess ional Mgmt of Heal th Care
Finance & & Rental Scienti fi c & Companies & Socia lInformation Insurance & Leas ing Tech. Services & Enterprises Education Ass i s tance No. Pct.
1 to 4 16 79 58 227 2 9 55 446 63.8
5 to 9 2 14 13 29 3 1 31 93 13.3
10 to 19 1 12 5 19 3 2 27 69 9.9
20 to 49 1 11 2 15 3 3 16 51 7.3
50 to 99 2 6 0 2 2 1 7 20 2.9
100 to 249 3 1 0 1 2 0 2 9 1.3
250 or more 1 1 0 1 3 1 4 11 1.6
Total 26 124 78 294 18 17 142 699 100.0
1 to 4 15 81 66 240 6 12 83 503 64.85 to 9 0 21 16 19 3 2 45 106 13.7
10 to 19 4 10 7 21 2 2 49 95 12.220 to 49 4 2 1 8 2 3 12 32 4.1
50 to 99 1 2 0 4 3 2 8 20 2.6 100 to 249 2 1 0 1 0 0 5 9 1.2
250 or more 0 1 0 1 5 1 3 11 1.4
Total 26 118 90 294 21 22 205 776 100.0
Sources: Bureau of the Census; County Business Patterns; Maxfield Research Inc.
2010
TABLE G‐2BUSINESSES BY INDUSTRY AND SIZE OF BUSINESSARDEN HILLS (55112 AND 55126 ZIP CODES)
2000 and 2010
Total
2000

OFFICE MARKET ANALYSIS
MAXFIELD RESEARCH INC. 108
Based on this information, it appears that the majority of office users in the area are likely to require smaller spaces. Assuming that office employees occupy an average of 200 square feet of office space, many companies in the area would need 1,000 square feet or less, and only a few would need more than 4,000 square feet. It should be noted that some, if not most, of these small businesses are likely to be located in home offices.
The following chart shows an estimate of the total amount of office space needed to accommodate the businesses listed in the table by size of business. The figures assume that employees occupy an average of 200 square feet of office space (including common areas).
503
106 95
3220 200
50
100
150
200
250
300
350
400
450
500
550
1 to 4 5 to 9 10 to 19 20 to 49 50 to 99 100 or more
Number of Businesses
Number of Employees
Office‐Using Businesses by Number of Employees55112 & 55126 Zip Codes ‐ 2010
956636
1,140896
1,200
4,600
0
500
1,000
1,500
2,000
2,500
3,000
3,500
4,000
4,500
5,000
1 to 4 5 to 9 10 to 19 20 to 49 50 to 99 100 or more
Number of Em
ployees
Size of Business (Employees)
Employees in Office Space by Business Size55112 & 55126 Zip Codes ‐ 2010

OFFICE MARKET ANALYSIS
MAXFIELD RESEARCH INC. 109
The chart shows that about 1.9 million square feet is needed to accommodate all of the businesses in 2010. However, many of the businesses with between one and four employ‐ees are likely operated from private homes, thereby reducing total office needs to about 1.7 million square feet.
Growth of Office‐Using Jobs The following table presents total employment growth trends and projections in the TCAAP Site Primary Market Area from 2000 to 2020, including the estimated percentage of total employ‐ment among jobs that typically occupy office space. The figures were compiled by Maxfield Research, based on data from the Minnesota DEED.
Between 2000 and 2010, the Primary Market Area lost over ‐8,000 jobs (‐5.0%) while the estimated number of jobs requiring office space increased by 5,803 (+15.2% growth).
According to long‐term industry projections provided by DEED for the Twin Cities Metro Area, the number of jobs in office‐using industries is expected to grow by 18.4% between 2010 and 2020. Office jobs accounted for 40.4% of total jobs in 2010 and are projected to increase to 42.7% of total jobs by 2020.
We expect that the presence of office jobs in the PMA will expand at a similar pace to the region during the current decade. Office jobs accounted for 23.4% of total PMA jobs in 2000, 28.4% of all jobs in 2010, and 29.2% as of the second quarter of 2012. We project that the proportion of office jobs to total jobs will increase to 30.9% by 2020.
191,140127,200
228,000179,200
240,000
920,000
0
100,000
200,000
300,000
400,000
500,000
600,000
700,000
800,000
900,000
1,000,000
1 to 4 5 to 9 10 to 19 20 to 49 50 to 99 100 or more
Square Feet
Size of Business (Employees)
Office Space Needed by Business Size55112 & 55126 Zip Codes ‐ 2010

OFFICE MARKET ANALYSIS
MAXFIELD RESEARCH INC. 110
An industry standard is that an average of 200 square feet of space is required for every office job. Therefore, with the addition of 7,671 office jobs between 2012 and 2020 in the PMA, it can be roughly estimated that approximately 1.5 million square feet of office space would be needed to accommodate these new employees. The actual amount of office space needed will be less however, because this figure includes people working from home offices and some professional businesses may prefer to locate in retail space.
Office Development Potential This section focuses on factors that influence the demand for office space, primarily business and employment growth. The amount (in square feet) of additional office space supportable in the Market Area is based on projected office employment growth and the amount of employ‐ment growth that would be capturable by suitable space located on the Site. Our demand calculations are shown in Table G‐4 and are summarized in the following points.
As of 2012, there were approximately 160,396 jobs in the PMA, 29.2% of which were in typical office‐using industries. This percentage is projected to increase modestly as the greatest job growth over the next several years, according to the Minnesota Department of Employment and Economic Development, is among industries that require office space, such as Education and Health Services, Professional and Business Services, and Financial Ac‐tivities.
We project that by 2020 about 30.9% of all jobs in the PMA will be in industries that typical‐ly require office space. To reach this percentage, approximately 7,671 office‐occupying jobs will need to be added in the PMA between 2012 and 2020.
Not all of the office‐type jobs created over the next eight years will seek or want space in office buildings. As shown earlier in this section, 65% of the office‐type businesses in the
Change
Estimate Forecast
2000 2005 2010 2012 2020 No. Pct. No. Pct. No. Pct.
Total Jobs 163,064 166,143 154,882 160,396 176,457 ‐8,182 ‐5.0% 5,514 3.6% 16,061 10.0%
Office Jobs* 38,136 34,572 43,939 46,854 54,525 5,803 15.2% 2,915 6.6% 7,671 16.4%
% Office jobs 23.4% 20.8% 28.4% 29.2% 30.9% ‐‐ ‐‐ ‐‐ ‐‐ ‐‐ ‐‐
Sources: Minnesota Department of Employment & Economic Development; Maxfield Research Inc.
*Office jobs include jobs primarily in the Information, Financial Activities, Professional and Business Services, and a
portion of the Educational and Health Services.
2000 to 2010 2012 to 2020
TABLE G‐3
2010 to 2012
EMPLOYMENT GROWTH TRENDS AND PROJECTIONS
TCAAP SITE PRIMARY MARKET AREA
2000 to 2020
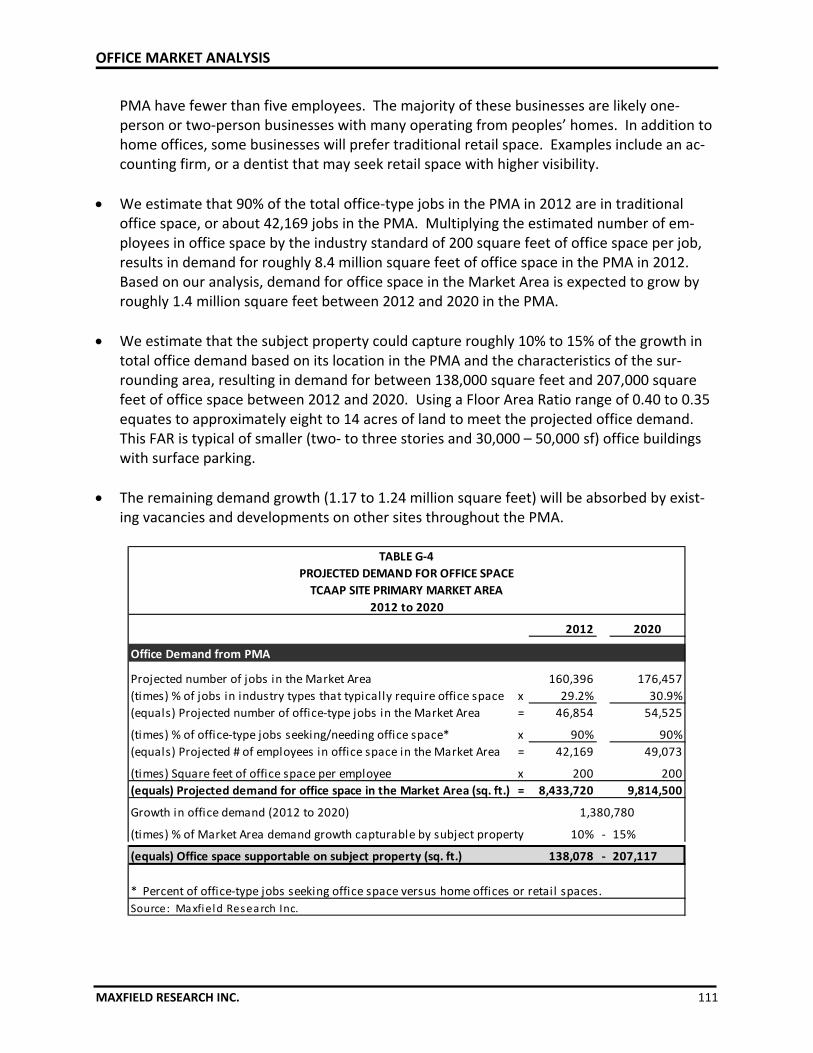
OFFICE MARKET ANALYSIS
MAXFIELD RESEARCH INC. 111
PMA have fewer than five employees. The majority of these businesses are likely one‐person or two‐person businesses with many operating from peoples’ homes. In addition to home offices, some businesses will prefer traditional retail space. Examples include an ac‐counting firm, or a dentist that may seek retail space with higher visibility.
We estimate that 90% of the total office‐type jobs in the PMA in 2012 are in traditional office space, or about 42,169 jobs in the PMA. Multiplying the estimated number of em‐ployees in office space by the industry standard of 200 square feet of office space per job, results in demand for roughly 8.4 million square feet of office space in the PMA in 2012. Based on our analysis, demand for office space in the Market Area is expected to grow by roughly 1.4 million square feet between 2012 and 2020 in the PMA.
We estimate that the subject property could capture roughly 10% to 15% of the growth in total office demand based on its location in the PMA and the characteristics of the sur‐rounding area, resulting in demand for between 138,000 square feet and 207,000 square feet of office space between 2012 and 2020. Using a Floor Area Ratio range of 0.40 to 0.35 equates to approximately eight to 14 acres of land to meet the projected office demand. This FAR is typical of smaller (two‐ to three stories and 30,000 – 50,000 sf) office buildings with surface parking.
The remaining demand growth (1.17 to 1.24 million square feet) will be absorbed by exist‐ing vacancies and developments on other sites throughout the PMA.
2012
Projected number of jobs in the Market Area 160,396
(times) % of jobs in industry types that typically require office space x 29.2%
(equals) Projected number of office‐type jobs in the Market Area = 46,854
(times) % of office‐type jobs seeking/needing office space* x 90%
(equals) Projected # of employees in office space in the Market Area = 42,169
(times) Square feet of office space per employee x 200
(equals) Projected demand for office space in the Market Area (sq. ft.) = 8,433,720
Growth in office demand (2012 to 2020)
(times) % of Market Area demand growth capturable by subject property 10% ‐ 15%
(equals) Office space supportable on subject property (sq. ft.) 138,078 ‐
* Percent of office‐type jobs seeking office space versus home offices or retail spaces.
Source: Maxfield Research Inc.
TABLE G‐4
PROJECTED DEMAND FOR OFFICE SPACE
TCAAP SITE PRIMARY MARKET AREA
2012 to 2020
207,117
2020
176,457
30.9%
Office Demand from PMA
54,525
9,814,500
1,380,780
90%
49,073
200

OFFICE MARKET ANALYSIS
MAXFIELD RESEARCH INC. 112
Corporate Campus
The office demand calculation presented above is based primarily on business and employ‐ment growth factors. Demand for office space on a particular site can also result from exist‐ing companies seeking opportunities to relocate or consolidate their employees and opera‐tions into a corporate campus. These real estate decisions can be generated by the need to expand to support additional employees or increase productivity, but they are often driven by a desire to become more operationally efficient.
A corporate campus consists of buildings in close proximity to each other with centralized support, amenities, and other internal functions. A company will often make the decision to move into a campus setting based on operational, business performance and cultural is‐sues. Operational issues address how real estate supports day‐to‐day functions and shifting space requirements. Business performance issues consider the effects of the different ways employees communicate and collaborate, and cultural issues relate to how employees feel about the company. Financial considerations will also drive a decision to locate into a cor‐porate campus.
Corporate campus development has played a significant role in the Twin Cities suburban office market over the past decade as many large corporate office users have developed campuses. A few of these projects are summarized below.
– UnitedHealth Group initiated construction of an office campus during 2011 on 72 acres near the intersection of Shady Oak Road and Highway 62 in Eden Prairie. When complete in roughly five years, this $200 million project will house 6,700 employees in 1.5 million square feet of office space.
– Target recently broke ground on two eight‐story buildings totaling 650,000 square feet at their campus located near the intersection of Highway 169 and Highway 610 in Brooklyn Park. When the project opens in 2014, the campus will house roughly 4,400 employees in 1.2 million square feet of office space.
– In 2010, Opus Northwest completed Excelsior Crossings, a 740,000‐square foot office campus for Cargill. The project houses 3,300 employees in three separate buildings on roughly 30 acres at the intersection of Highway 169 and Excelsior Boulevard in Hopkins. Cargill has since sold all three buildings in sale‐leaseback transactions, meaning they will remain in the buildings under long‐term leases.
– Located just north of the subject property at the intersection of I‐35W and Highway 10 in Mounds View, Medtronic recently consolidated about 3,000 em‐ployees into one $95 million project consisting of three eight‐story office build‐ings totaling 1.2 million square feet on 84 acres. This project was completed in 2008.

OFFICE MARKET ANALYSIS
MAXFIELD RESEARCH INC. 113
These developments all involved a significant public financing commitment in the form of Tax Increment Financing, tax abatements, or grant money.
The subject property has the potential to attract large corporate users, but securing a major corporate user is a competitive process and would likely require some form of public financ‐ing. Additionally, a corporate campus would consume a significant portion of the TCAAP Site land area and there is no guarantee that a campus development would ever occur. As a result, planning specifically for a corporate campus could delay development, so we rec‐ommend a development concept that could support a corporate campus but is flexible to accommodate changes in real estate demand over time.

HOTEL MARKET ANALYSIS
MAXFIELD RESEARCH INC. 114
Introduction This section provides initial research to examine the potential to develop a hotel in Arden Hills, Minnesota. Maxfield Research Inc. analyzed supply and demand characteristics of lodging in the Twin Cities region to provide insight on the performance of the hospitality industry. Also included in this analysis is an overview of attractions and room‐night generators in Arden Hills and the surrounding communities.
Regional Conditions According to information provided by Explore Minnesota, which utilized data from Smith Travel Research Inc., Minnesota’s lodging industry ended the third quarter of 2012 with year‐over‐year growth for occupancy, demand, revenue, room rate, and revenue per available room (RevPAR). A ‐0.5% decline in room supply occurred. These categories are the key metrics when considering performance of the lodging industry. Table H‐1 displays the year‐over‐year per‐centage change for each of these six metrics. The Minneapolis North area is highlighted as Arden Hills is located in this submarket of the Minneapolis/St. Paul region.
Occupancy Revenue Supply Room Rate Demand RevPAR
United States 2.6% 7.3% 0.4% 4.2% 3.0% 6.9%
Minnesota 1.1% 3.0% ‐0.5% 2.4% 0.6% 3.5%
Minneapolis/St. Paul ‐0.4% 1.8% ‐0.9% 3.1% ‐1.3% 2.8%
Minneapolis North Area 2.2% 3.3% ‐3.2% 4.4% ‐1.1% 6.7%
Duluth MSA 0.5% 3.3% ‐0.3% 3.1% 0.2% 3.6%
St. Cloud/I‐94 Corridor 4.7% 7.3% ‐0.1% 2.5% 4.6% 7.4%
Minnesota North 5.1% 7.9% ‐0.1% 2.8% 5.0% 8.1%
Rochester MSA ‐2.7% ‐0.9% 0.8% 1.0% ‐1.9% ‐1.7%
Minnesota South 3.9% 4.1% 0.6% ‐0.5% 4.6% 3.4%
United States 4.6% 9.1% 0.7% 3.6% 5.3% 8.3%
Minnesota 4.7% 9.7% 0.5% 4.3% 5.2% 9.1%
Minneapolis/St. Paul 6.6% 12.0% 0.3% 4.8% 6.9% 11.7%
Minneapolis North Area 9.7% 11.3% ‐1.2% 2.6% 8.5% 12.6%
Duluth MSA 4.9% 9.8% 1.7% 3.0% 6.7% 8.0%
St. Cloud/I‐94 Corridor 4.7% 4.8% ‐0.6% 0.7% 4.1% 5.5%
Minnesota North 1.9% 6.3% 0.9% 3.3% 2.9% 5.3%
Rochester MSA 3.7% 8.9% 0.0% 5.1% 3.7% 8.9%
Minnesota South 0.9% 4.5% 0.7% 2.9% 1.5% 3.8%
Note: Supply reflects rooms available while Demand is a reflection of rooms sold.
Sources: Explore Minnesota; Smith Travel Research, Inc.; Maxfield Research, Inc.
3rd Quarter 2011 compared to 3rd Quarter 2010
TABLE H‐1
LODGING INDUSTRY PERFORMANCE
YEAR‐OVER YEAR PERCENT CHANGE
3rd Quarter 2012 compared to 3rd Quarter 2011

HOTEL MARKET ANALYSIS
MAXFIELD RESEARCH INC. 115
The year‐over‐year change for all six metrics was lower than the change that occurred in the previous year (third quarter 2010 to third quarter 2011).
Minnesota’s lodging industry experienced slower growth than the United States in all six metric categories. Occupancy grew at a 1.1% pace over the past year in Minnesota, com‐pared to 2.6% growth in the United States. Revenue growth was at 3.0% in Minnesota (7.3% in the United States) while the supply of available rooms dropped ‐0.5% in the State as the United States experienced 0.4% growth. Room rates increased a modest 2.4% in Minnesota, compared to 4.2% growth across the Nation. Demand and RevPAR growth of 0.6% and 3.5%, respectively, in Minnesota were also lower than the rest of the Country (3.0% demand growth and 6.9% growth in RevPAR).
Within Minnesota, nearly all of the State’s market areas experienced annual growth in revenue, room rates, and RevPAR. The occupancy, supply, and demand metrics experi‐enced declines, particularly in the Minneapolis/St. Paul Metro Area.
Greater Minnesota’s lodging metrics outperformed the Minneapolis/St. Paul market in 2012, which was in direct contrast to 2011 when the Metro Area outperformed the rest of the State.
The Minneapolis/St. Paul market experienced declines in occupancy (‐0.4%), supply (‐0.9%), and demand (‐1.3%). Most of the Minneapolis North submarket metrics outperformed the Metro Area as occupancy increased 2.2%, revenue increased 3.3% (compared to 1.8% in the Metro Area), room rate increased 4.4% (3.1% in the Metro), and RevPAR jumped 6.7% (2.8% in the Metro). Demand in the Minneapolis North submarket declined ‐1.1% while the sup‐ply of available rooms dropped ‐3.2%.
‐5.0% 0.0% 5.0% 10.0% 15.0%
United States
Minnesota
Minneapolis/St. Paul
Minneapolis North Area
Duluth MSA
St. Cloud/I‐94 Corridor
Minnesota North
Rochester MSA
Minnesota South
Annual RevPAR Growth Comparison
2012
2011

HOTEL MARKET ANALYSIS
MAXFIELD RESEARCH INC. 116
According to information from the Cushman & Wakefield|NorthMarq mid‐year 2012 Compass report, occupancy in the Minneapolis/St. Paul Metro Area was at 58.2% through May 2012, compared to 53.3% in Minnesota and 59.1% in the United States.
Regional Attractions Regional entertainment and recreation destinations are made up of a wide variety of business‐es and attractions, such as lodging accommodations, restaurants, amusement parks, historic sites, museums, state parks, wineries, and live entertainment venues. As reflected in the table on the following page, the most popular attractions in Minnesota cover a range of uses, includ‐ing; shopping centers, sport facilities, casinos, museums, zoo, and parks.
The Metro Area contains 60.0% of Minnesota’s 35 most popular attractions, including eight of the top ten.
The Mall of America in Bloomington is, by far, the most frequently visited attraction in the State. Attendance in 2010 topped 42 million. Other destinations in the Metro Area round‐ing out the top ten include: National Sports Center in Blaine; Target Field, home to the Minnesota Twins, in Minneapolis; Como Park Zoo & Conservatory in St. Paul; Minnesota State Fair; Minnesota Zoo in Apple Valley; Target Center, home to the Minnesota Timber‐wolves and Lynx, in Minneapolis; and, Fort Snelling State Park.
Metro Area attractions range from: Retail (Mall of America); Sport facilities (National Sports Center, Target Field, Target Center, Metrodome); Zoos (Como Zoo, Minnesota Zoo); Events (State Fair, Renaissance Festival); and, Museums (Science Museum of Minnesota, Minneso‐ta Children’s Museum).
‐4.0%
‐2.0%
0.0%
2.0%
4.0%
6.0%
8.0%
10.0%
12.0%
14.0%
Minneapolis North Area Lodging Performance
2011
2012

HOTEL MARKET ANALYSIS
MAXFIELD RESEARCH INC. 117
As the second most popular attraction in the State and the only attraction located within the PMA, the National Sports Center in Blaine will be one of the major room‐night genera‐tors for a possible new hotel on the Site.
Rank MN Region Attraction Attendance
1 Metro Mall of America 42,500,000
2 Metro National Sports Center, Blaine 3,800,000
3 Metro Target Field 3,233,640
4 Northeast Grand Casino Hinckley 2,852,055
5 Central Grand Casino Mille Lacs 2,415,394
6 Metro Como Park Zoo & Conservatory 2,200,000
7 Metro Minnesota State Fair 1,776,211
8 Metro Minnesota Zoo 1,338,581
9 Metro Target Center 1,057,000
10 Metro Fort Snelling State Park 911,435
11 Metro HHH Metrodome 809,509
12 Metro Science Museum of Minnesota 749,619
13 Northeast Gooseberry Falls State Park 630,269
14 Metro Walker Art Center & Minneapolis Sculpture Garden 610,990
15 Northwest Itasca State Park 550,599
16 Northeast Lake Superior Maritime Visitor Center 503,597
17 Metro Historic State, Orpheum, Pantagus Theaters 500,000
18 Metro Minneapolis Institute of Arts 462,376
19 Metro Minnesota Children's Museum 411,439
20 Northeast Tettegouche State Park 390,208
21 Metro Ordway Center for the Performing Arts 336,269
22 Metro Interstate State Park 329,159
23 Northeast Split Rock Lighthouse State Park 327,626
24 Metro Minnesota Landscape Arboretum 317,939
25 Central Sibley State Park 308,136
26 Northeast Jay Cooke State Park 302,052
27 Metro Children's Theatre Company 300,000
28 Metro Landmark Center 287,000
29 Metro Minnesota Renaissance Festival 280,000
30 Northeast Spirit Mountain Recreation Area 279,013
31 Northeast Temperance River State Park 275,931
32 Southern Whitewater State Park 256,218
33 Northeast Voyageurs National Park 253,891
34 Metro Minnesota History Center 250,000
35 Southern Flandrau State Park 247,665
Sources: Explore Minnesota Tourism; Maxfield Research, Inc
TABLE H‐2
MOST POPULAR TOURIST ATTRACTIONS IN MINNESOTA
2010 ATTENDANCE
Notes: Ranked by actual or estimated visitors for 2010, including both local visitors and
tourists. This l ist includes only those attractions for which attendance was monitored and
reported to Explore Minnesota Tourism.

HOTEL MARKET ANALYSIS
MAXFIELD RESEARCH INC. 118
Metro Area Visitor Profile The following points summarize key findings from a September 2012 report titled “Twin Cities Metropolitan Area Summer Visitor Profile” which was prepared for the Metro Tourism Associa‐tion by the University of Minnesota Tourism Center. The findings of the study were formulated through the delivery of on‐site, in‐person questionnaires to Metro Area visitors between June 22 and August 19, 2012. A total of 4,358 parties were contacted and 1,294 usable question‐naires were obtained.
The average age of Metro Area visitors was 44 years, with 23% in the 41 to 50 age group. Approximately 21% were in the 31 to 40 age group, 20% were in the 18 to 30 cohort, 17% were between 51 and 60 and 17% were age 61 or older. Based on this age distribution, roughly one‐third of the respondents were from the “Baby Boom” generation and another third were from “Generation X”. Roughly one‐quarter were from “Generation Y”, also known as the “Echo Boom”.
Approximately 40% of the respondents reported an annual household income range of between $50,000 and $99,999 while 31% report incomes of $100,000 or more. Roughly 26% reported annual incomes of $50,000 or less.
Nearly 89% of area visitors were from the United States. Of these domestic visitors, over 29% were from Minnesota, followed by Wisconsin (12%), Iowa (7%), and Illinois (6%). Cali‐fornia (5%), North Dakota (4%), South Dakota (3%), Michigan (3%), Colorado (2%), and Ohio (2%) round out the ten most common States of residence.
International travelers represented 11% of the total respondents; approximately 5% were from Canada, 3% were from Europe and 1% was from Asia.
On average, respondents were traveling in a group of four people. Nearly 53% of the respondents were traveling with family and nearly half (49%) traveling with children under age 18. One‐third of these travel groups had children under the age of 12, while almost one‐quarter of the travel groups had children aged 12 to 17.
Roughly 22% of the respondents were traveling with a couple or partner and 10% were with a group consisting of family and friends. Travel groups comprised of friends represented 9% of all respondents, while 6% were traveling alone.
Most of the respondents (86%) were spending at least one night in the area while the remaining 14% were on a daytrip. Approximately 30% of the respondents were staying for two nights and 21% were staying for three nights. One‐night stays represented 14% of the trips, 12% were staying four nights, and 7% were staying for five nights.

HOTEL MARKET ANALYSIS
MAXFIELD RESEARCH INC. 119
The majority of respondents were staying overnight in a hotel, motel or historic inn (62%), while nearly one‐third were staying in the home of a family member or friends. Almost 4% were staying in a campground with a fee.
Location was the key factor in choosing overnight lodging as 43% listed it as the primary reason for their lodging choice. Roughly 22% identified price as their primary reason while 12% identified the hotel amenities as their reason. Other factors include special offers (10%), reward programs (5%), hotel brand (4%), free parking (3%), and sustainable/green practices (1%).
Visitors participated in a wide range of activities during their trip to the Twin Cities, but the most common trip purpose was to visit family or friends (35% of all responses). Visiting at‐tractions was a close second, at 30%. Attending sporting events (7%), shopping (5%), and visiting museums or historic sites (5%) were also frequently cited as the trip purpose.
General visitor activities included dining out (88%), sightseeing (45%), nightlife (21%), driving on designated scenic byways (18%), and guided tours (9%).
Many respondents identified shopping as an activity, with 43% shopping at Mall of America, 26% shopping at other malls, 14% were shopping for gifts/souvenirs, and 12% were shop‐ping for arts/crafts/antiques.
In addition to visiting family and friends, many respondents were visiting amusement parks (23%), art museums (21%), or other museums (23%).
Approximately 9% of the respondents were attending a professional sports event, 7% were attending a fair or festival, and 6% were attending a popular music concert.
Outdoor activities were a common interest among survey respondents (43%) with 21% swimming or participating in other water sports, 12% hiking, and 10% biking.
Hotel Demand In general, demand for hotel rooms comes primarily from the following sources: Leisure travelers (including the transient segment); Visitors to the area for meetings, conventions, or special gatherings; and, Commercial travelers (i.e. regular business travelers).
Commercial Segment – This demand generally includes individuals traveling on business. Commercial demand is generally strongest Monday through Thursday nights, while declin‐ing significantly on Friday and Saturday nights. The typical length of stay ranges from one to three days and demand is generally consistent year‐round. Business travelers tend not to

HOTEL MARKET ANALYSIS
MAXFIELD RESEARCH INC. 120
be as price‐sensitive as leisure travelers, and tend to utilize a property’s food and beverage amenities when available.
Group/Convention Segment – This source of room night demand would be generated by visitors traveling to the area to attend conventions, conferences, seminars, trade shows, training session, sporting events, or other activities that generally include ten or more peo‐ple. A large proportion of this activity occurs during the commercial week, Monday through Friday. However, the SMERF segment (social, military, educational, religious, and fraternal groups) is more rate sensitive and often chooses weekends and holiday seasons to manage costs. Most group travelers require full‐service accommodations, quality meeting space and banquet facilities, and an adequately trained staff to deliver efficient meeting coordina‐tion.
Leisure (Transient) Segment – A substantial source of room night demand in Minnesota is generated by the leisure market segment. Leisure demand is generated by people visiting the area for non‐business reasons and travelers passing through the area en‐route to an‐other destination. Leisure demand is generally strongest Friday and Saturday nights and during the holiday seasons. Due to seasonal factors, this demand is strongest overall in the summer months. The leisure traveler tends to be the most price‐sensitive segment of the lodging industry. Limited‐service properties serve this segment well as tourists select their accommodations based on location, price, and ease of access to outdoor and other recrea‐tional activities.
According to published data, the Minneapolis‐St. Paul Metro Area has experienced flat occu‐pancies over the past year (58.2%), but experienced growth in average daily rates (ADR) and in revenue per available room (RevPar). Generally, a 65% occupancy rate is considered the equilibrium for a hotel to be profitable. To remain competitive, hotel operators have been reinvesting in their portfolios and properties by refurbishing units and increasing amenities. Hotel construction is slowly picking‐up after the slowdown in the economy, however most new product is located along the I‐494/694 corridors on site’s with high traffic counts and good access and visibility. Due to the Site’s close proximity to several major employers and employment centers, as well as the National Sports Center in Blaine, the subject property would likely be a suitable location for a hotel. The development of additional retail and entertainment uses on the Site would increase the attractiveness of the Site to a hotel operator. There appears to be a market from leisure travelers, but the ability to support a hotel on the site is going to be dependent on the ability to attract weekday business which will come from developing office and industrial uses that will have business travelers requiring overnight hotel space. Also, there are several large employers in the surrounding area, such as Medtronic, Land O’Lakes, and Deluxe, which will likely generate demand for overnight hotel stays from business travelers.
INDUSTRIAL MARKET ANALYSIS
MAXFIELD RESEARCH INC. 121
Introduction This memorandum presents our analysis of the industrial potential at the TCAAP Site in Arden Hills, Minnesota. Included in the analysis are an examination of industrial market conditions in the Twin Cities and employment and business growth trends.
Multi‐Tenant Industrial Market Conditions Maxfield Research analyzed industrial market trends for the Twin Cities Metro Area, including total rentable area, vacancy rates, and absorption for the various submarkets in the Twin Cities as well as property subtypes in the Northeast Submarket compared to the Metro Area. The data is provided by Cushman & Wakefield|NorthMarq. This information is useful in assessing the potential for additional industrial space at the TCAAP Site as the overall health of the local industrial market will influence the development potential of the Site. The subject property and the PMA communities are situated in the Northeast Submarket as defined by Cushman & Wakefield|NorthMarq. Market statistics for the submarket are identi‐fied in the two tables on the following pages. The following points summarize key findings from the Cushman & Wakefield|NorthMarq mid‐year 2012 Compass report. Definitions of the various industrial product types are as follows:
Office Showroom: One‐story multi‐tenant projects over 20,000 rentable square feet with more than 30% finished office space. Typical clear height ceilings are below 16 feet and these properties generally offer smaller bay sizes and heavier than normal finishes and landscaping.
Office Warehouse: Multi‐tenant facilities of 20,000 rentable square feet or larger which generally offer 10% to 20% office finish and have 16‐ to 24‐foot clear height ceilings.
Bulk Warehouse (Distribution): Multi‐tenant buildings with 20,000 rentable square feet or larger which typically offer 5% to 10% office finish and have 24‐foot or greater clear height ceilings. Bulk Warehouse is also frequently referred to as Distribution.
Twin Cities Industrial Market
According to the report, the Twin Cities multi‐tenant industrial market continued a slow, steady path to recovery, posting the most positive absorption since 2007 and vacancy of 14.7%, the lowest since 2008. The market posted 1,278,665 square feet (sf) of absorption during the first half of 2012 for a total of 1,358,112 sf over the past 12 months, the most absorption since 2007. Although the market still lags pre‐recession absorption levels, mo‐mentum is moving in the right direction.

INDUSTRIAL MARKET ANALYSIS
MAXFIELD RESEARCH INC. 122
Industrial vacancy is down from the end of 2011 in every submarket. The Northwest submarket remained the tightest with a 12.8% vacancy rate and boasted the tightest bulk/warehouse market at 9.6% vacancy. The Northeast submarket reported the most overall absorption at 458,516 sf and a 15.0% vacancy rate. The Southwest has the highest vacancy, at 16.0%, while the Southeast submarket is 15.4% vacant.
Limited options exist for users seeking large, functional space; however, users seeking spaces smaller than 50,000 sf still have many options. A “flight to quality” is occurring for both leased space and user‐sale buildings. Today’s users want newer, more efficient 24‐foot or 32‐foot‐clear, state‐of‐the‐art buildings.
Larger available contiguous spaces are harder to find, especially buildings with 60,000 square feet or more and 30‐foot clear height ceilings. Many users may have to construct custom build‐to‐suit to meet their company’s space needs.
The scarce supply of large, quality Bulk Distribution and Office Warehouse properties is driving the demand for build‐to‐suits and speculative development in select submarkets be‐cause users cannot find the space they need to meet their space requirements. There are several build‐to‐suit projects about to commence or underway in the market, including a 580,000 sf warehouse for SanMar in Shakopee, a 179,000 sf warehouse for Trystar also in Shakopee, and a 93,000 sf manufacturing facility for Teamvantage in Forest Lake. Several other groups are scouting build‐to‐suit locations in the Metro Area.
The industrial market could see an additional 775,000 sf of positive absorption by the end of 2012 which would result in annual absorption of approximately 2.0 million square feet which would be the highest annual absorption since 2006. The lack of large, quality spaces will continue to spur build‐to‐suit activity as users look to satisfy space requirements.
0.0%
5.0%
10.0%
15.0%
20.0%
25.0%Northeast
Northwest
Southeast
Southwest
Total
Industrial Vacancy Comparison
2012
2011

INDUSTRIAL MARKET ANALYSIS
MAXFIELD RESEARCH INC. 123
Rents are expected to continue stabilizing and landlords of premium Office Warehouse and Bulk Distribution space should gain some leverage and be able to push rents higher. Across all submarkets, landlords are able to push rents on the newer, well‐located 24‐foot‐clear Office Warehouse and 32‐foot clear Bulk Warehouse properties while older, less functional properties continue to be offered at a discount.
While there are a limited number of infill sites inside the I‐494/I‐694 loop, the highest user demand continues to be for locations within the loop, making the TCAAP Site a highly desir‐able location for industrial uses. Suburban locations in tertiary markets located off major transportation corridors will be the slowest to recover from the real estate downturn.
The properties in highest demand have the following characteristics: functionally well‐designed, energy efficient, ample parking, well‐landscaped, and good lighting. Traditionally, most industrial spaces were designed with 24‐foot clear height ceilings. Today’s tenants are seeking 32‐foot clear height ceilings. Office Showroom space has suffered from the reces‐sion; whereas Office Warehouse is in higher demand today. Office Showroom often com‐petes against Class B office space in good locations.
Most real estate activity has been driven by larger companies “trading up” real estate holdings while small to mid‐sized companies are waiting out economic uncertainties before making real estate decisions.
Total Total Direct Last 12
Market Number of Rentable Amount Percent 1st Half Months
Sector Buildings Area Vacant Vacant Absorption Absorption
Northeast 381 35,063,627 5,263,558 15.0% 458,516 608,236
Northwest 297 25,891,280 3,313,772 12.8% 261,171 393,473
Southeast 206 16,841,487 2,588,809 15.4% 347,429 365,222
Southwest 288 23,526,196 3,760,848 16.0% 211,549 ‐8,819
Market 1,172 101,322,590 14,926,987 14.7% 1,278,665 1,358,112
Northeast 382 35,132,904 5,785,422 16.5% ‐34,085 115,635
Northwest 298 25,931,308 3,667,862 14.1% 134,040 266,342
Southeast 208 16,927,552 3,100,528 18.3% 167,102 184,895
Southwest 290 23,686,896 3,862,247 16.3% 289,791 69,423
Market 1,178 101,678,660 16,416,059 16.1% 556,848 636,295
Note: Data includes multi‐tenant industrial buildings larger than 20,000 square feet
Sources: Cushman & Wakefield | NorthMarq; Maxfield Research, Inc.
TABLE I‐1
INDUSTRIAL SPACE VACANCY AND ABSORPTION
TWIN CITIES
2011 ‐ 2012
2011
2012

INDUSTRIAL MARKET ANALYSIS
MAXFIELD RESEARCH INC. 124
Northeast Submarket
With 381 buildings totaling 35.1 million sf, the Northeast multi‐tenant industrial submarket is the largest Twin Cities submarket. Following 458,516 sf of positive absorption during the first half of 2012, vacancy dropped 1.5 percentage points to 15.0%.
Two lease deals larger than 70,000 sf were reported during the first half of 2012 in the PMA. Notable transactions are summarized below.
– Delkor Systems signed a seven‐year lease for 113,130 sf of office warehouse
space at Arden Hills Gateway Center in Arden Hills. – MinnPar will be relocating from a facility in Minneapolis into 82,717 sf of bulk
warehouse space at Mounds View Business Center. – In addition to these lease transactions, Taylor Machine purchased three acres in
Blaine to build a 24,000‐sf warehouse building.
Well‐located vacancies of 24‐foot or higher clear height space are difficult to find in the submarket. As of mid‐year 2012, there were only two available spaces 100,000 sf in size or larger with 24‐foot clear heights or higher. Of the available space in the Northeast, roughly 1.3 million sf (25% of the vacancy) is considered obsolete. Obsolete properties typically have some or all of the following characteristics; constructed in the 1950s, multiple floors, low ceiling heights, and not enough docks or parking spaces.
The Northeast is expected to experience approximately 150,000 sf of positive absorption during the second half of 2012, for a total of 600,000 sf for the year. Demand is likely strong enough to support additional activity, but the lack of functional space will restrain absorption.
15.5%14.5% 14.8% 15.0%
13.7%
16.2%14.9% 14.7%
0.0%
5.0%
10.0%
15.0%
20.0%
25.0%
Bulk Warehouse Office Showroom Office Warehouse Total
2012 Industrial Vacancy Comparison
Northeast
Twin Cities

INDUSTRIAL MARKET ANALYSIS
MAXFIELD RESEARCH INC. 125
Office Warehouse space represents over 53% of the inventory in the Northeast submarket, compared to 47% in the Metro Area. The proportion of Office Showroom space is much smaller in the Northeast (13% of the inventory) than the Metro (20%). The Bulk Warehouse proportions are similar at 34% in the Northeast and 33% across the Metro.
Vacancy in the Northeast Submarket is lower than the Metro average in all product types except Bulk Warehouse. Northeast vacancies are lowest in Office Showroom properties at 14.5% compared to 16.2% across the Metro Area. Office Warehouse properties are 14.8% vacant in the Northeast and 14.9% throughout the Metro while Bulk Warehouse properties are 15.5% vacant in the Northeast compared to 13.7% across the Metro Area.
Total Total Direct
Market Number of Rentable Amount Percent Net
Sector Period Buildings Area Vacant Vacant Absorption
Bulk Warehouse 2011 50 11,978,139 2,024,377 16.9% 94,044
2012 50 11,978,139 1,860,836 15.5% 77,661
Office Showroom 2011 71 4,555,951 758,470 16.6% 2,855
2012 70 4,459,204 647,074 14.5% 39,055
Office Warehouse 2011 261 18,598,814 3,002,575 16.1% 18,736
2012 261 18,626,284 2,755,648 14.8% 341,800
Total 2011 382 35,132,904 5,785,422 16.5% 115,635
2012 381 35,063,627 5,263,558 15.0% 458,516
Bulk Warehouse 2011 196 33,684,829 4,864,864 14.4% 484,829
2012 194 33,532,117 4,595,391 13.7% 342,217
Office Showroom 2011 306 20,257,470 3,613,633 17.8% 176,045
2012 307 20,294,725 3,278,125 16.2% 213,619
Office Warehouse 2011 676 47,736,361 7,937,562 16.6% ‐24,579
2012 671 47,495,748 7,053,471 14.9% 722,829
Total 2011 1,178 101,678,660 16,416,059 16.1% 636,295
2012 1,172 101,322,590 14,926,987 14.7% 1,278,665
Sources: Cushman & Wakefield | NorthMarq; Maxfield Research, Inc.
Notes: 2012 absorption through the first half of the year. Data includes multi‐tenant industrial
buildings larger than 20,000 square feet.
Northeast Submarket
Twin Cities Market
TABLE I‐2
INDUSTRIAL SPACE VACANCY AND ABSORPTION BY PROPERTY TYPE
NORTHEAST SUBMARKET AND TWIN CITIES MARKET
2011 through 1st half 2012

INDUSTRIAL MARKET ANALYSIS
MAXFIELD RESEARCH INC. 126
Business Growth by Type of Business In order to estimate demand for industrial space on the subject property, Maxfield Research Inc. examines demand and supply trends affecting the industrial real estate market. In this section, we focus on demand trends – namely, the existing industrial labor market and em‐ployment projections. The primary business sectors impacting demand for industrial real estate include Construction, Manufacturing, Wholesale Trade, and Transportation and Warehousing. The following defini‐tions for these sectors come directly from the U.S. Census Bureau 2007 NAICS definitions.
Construction The construction sector comprises establishments primarily engaged in the construction of buildings or engineering projects (e.g., highways and utility systems). Establishments primarily engaged in the preparation of sites for new construction and establishments primarily engaged in subdividing land for sale as building sites also are included in this sector. There are substantial differences in the types of equipment and work force skills required by establishments in this sector. To highlight these differences and variations in the underlying production functions, this sector is divided into three subsectors. – Construction of Buildings, comprises establishments of the general contractor type
and operative builders involved in the construction of buildings. – Heavy and Civil Engineering Construction, comprises establishments involved in the
construction of engineering projects. – Specialty Trade Contractors, comprises establishments engaged in specialty trade
activities generally needed in the construction of all types of buildings.
Manufacturing The Manufacturing sector comprises establishments engaged in the mechanical, physi‐cal, or chemical transformation of materials, substances, or components into new prod‐ucts. The assembling of component parts of manufactured products is considered man‐ufacturing. Establishments in the Manufacturing sector are often described as plants, factories, or mills and characteristically use power‐driven machines and materials‐handling equipment. However, establishments that transform materials or substances into new products by hand or in the worker's home and those engaged in selling to the general public products made on the same premises from which they are sold, such as bakeries, candy stores, and custom tailors, may also be included in this sector. Manu‐facturing establishments may process materials or may contract with other establish‐ments to process their materials for them. Both types of establishments are included in manufacturing.

INDUSTRIAL MARKET ANALYSIS
MAXFIELD RESEARCH INC. 127
The materials, substances, or components transformed by manufacturing establish‐ments are raw materials that are products of agriculture, forestry, fishing, mining, or quarrying as well as products of other manufacturing establishments. The materials used may be purchased directly from producers, obtained through customary trade channels, or secured without recourse to the market by transferring the product from one establishment to another, under the same ownership. The new product of a manu‐facturing establishment may be finished in the sense that it is ready for utilization or consumption, or it may be semi‐finished to become an input for an establishment en‐gaged in further manufacturing.
Wholesale Trade The Wholesale Trade sector comprises establishments engaged in wholesaling mer‐chandise, generally without transformation, and rendering services incidental to the sale of merchandise. The merchandise described in this sector includes the outputs of agri‐culture, mining, manufacturing, and certain information industries. The wholesaling process is an intermediate step in the distribution of merchandise. Wholesalers are or‐ganized to sell or arrange the purchase or sale of the following: Goods for resale (i.e., goods sold to other wholesalers or retailers); Capital or durable nonconsumer goods; and, Raw and intermediate materials and supplies used in production. Wholesalers sell merchandise to other businesses and normally operate from a ware‐house or office. These warehouses and offices are characterized by having little or no display of merchandise. In addition, neither the design nor the location of the premises is intended to solicit walk‐in traffic. Wholesalers do not normally use advertising di‐rected to the general public. Customers are generally reached initially via telephone, in‐person marketing, or by specialized advertising that may include Internet and other electronic means. Follow‐up orders are either vendor‐initiated or client‐initiated, gen‐erally based on previous sales, and typically exhibit strong ties between sellers and buy‐ers. In fact, transactions are often conducted between wholesalers and clients that have long‐standing business relationships. This sector comprises two main types of whole‐salers: Merchant wholesalers that sell goods on their own account; and, Business to business electronic markets, agents, and brokers that arrange sales and purchases for others generally for a commission or fee. Transportation and Warehousing The Transportation and Warehousing sector includes industries providing transportation of passengers and cargo, warehousing and storage for goods, scenic and sightseeing transportation, and support activities related to modes of transportation. Establish‐ments in these industries use transportation equipment or transportation related facili‐ties as a productive asset. The type of equipment depends on the mode of transporta‐tion (air, rail, water, road, or pipeline).

INDUSTRIAL MARKET ANALYSIS
MAXFIELD RESEARCH INC. 128
The Transportation and Warehousing sector distinguishes three basic types of activities: Subsectors for each mode of transportation; A subsector for warehousing and storage; and, A subsector for establishments providing support activities for transportation. In addition, there are subsectors for establishments that provide passenger transportation for scenic and sightseeing purposes, postal services, and courier services. A separate subsector for support activities is established in the sector because, first, support activi‐ties for transportation are inherently multimodal, such as freight transportation ar‐rangement, or have multimodal aspects. Secondly, there are production process simi‐larities among the support activity industries. Warehousing establishments in this sec‐tor are distinguished from merchant wholesaling in that the warehouse establishments do not sell the goods
The following table presents the distribution of typical industrial space‐using businesses by number of employees in Arden Hills in the years 2000 and 2010. The data is extracted from the Business Register, a database of all known employer companies which is maintained and updated by the U.S. Census Bureau and is accumulated based on Zip Code boundaries. For this analysis, we used the 55112 and 55126 Zip Codes for Arden Hills. These two Zip Codes also cover portions of Mounds View, New Brighton, and Shoreview. While the industries shown do not represent all users of industrial space, these industries account for the majority of users. Growth in these sectors is an important indicator of total demand for industrial space and the size of businesses provides an indication of the type and sizes of spaces required.
The number of businesses in these categories in Arden Hills decreased from 482 in 2000 to 422 businesses in 2010 (a ‐12.4% decline over that ten‐year time period). By comparison, the total number of business establishments operating in the area dropped from 1,718 in 2000 to 1,687 in 2010 for a ‐2% decline (‐31 businesses).
Business growth occurred in several industry sectors, including; Health Care and Social Assistance sector (+63 businesses), Accommodation and Food Services (+14), Real Estate (+12), Administrative/Support/Waste Management (+8), Educational Services (+5), and Management of Companies and Enterprises (+3).
In 2010, the area had a total of 422 businesses which typically occupy industrial space. There were 138 businesses in the Construction sector, representing 32.7% of all of the busi‐nesses that would likely occupy industrial real estate. The Manufacturing sector comprised 106 business establishments (25.1%). Wholesale Trade accounted for 132 companies (31.3%), and the Transportation and Warehousing sector comprised 46 business establish‐ments (10.9%).
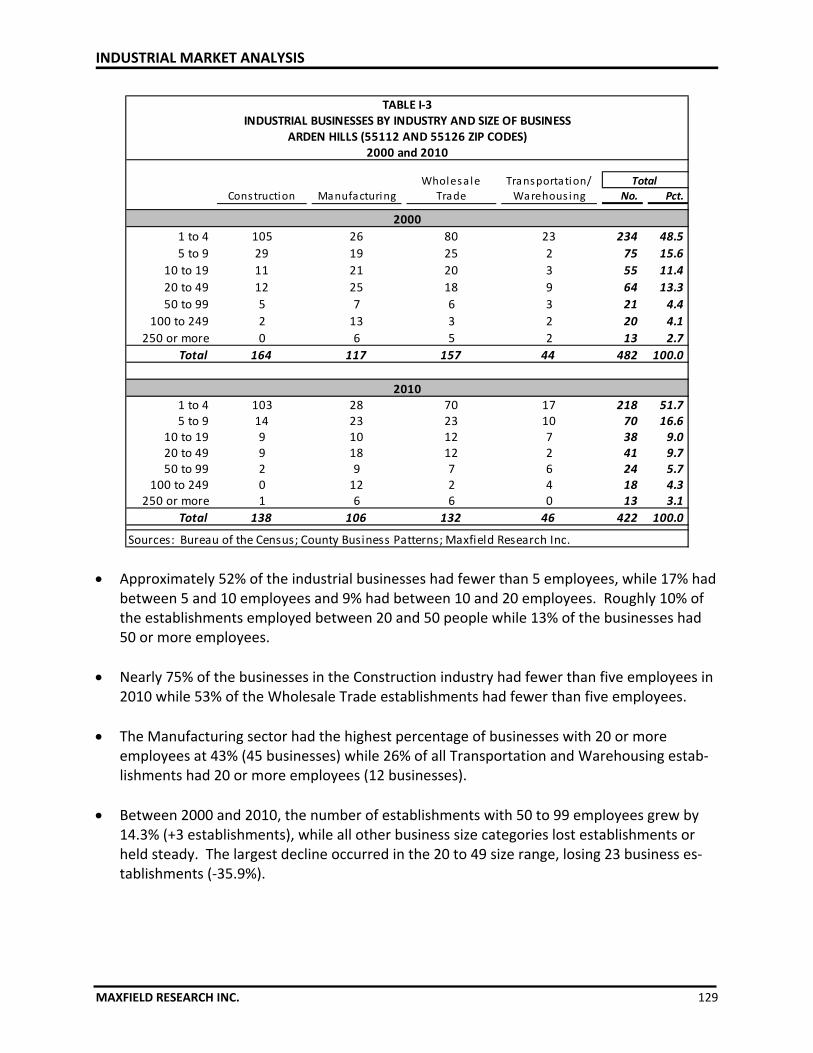
INDUSTRIAL MARKET ANALYSIS
MAXFIELD RESEARCH INC. 129
Approximately 52% of the industrial businesses had fewer than 5 employees, while 17% had between 5 and 10 employees and 9% had between 10 and 20 employees. Roughly 10% of the establishments employed between 20 and 50 people while 13% of the businesses had 50 or more employees.
Nearly 75% of the businesses in the Construction industry had fewer than five employees in 2010 while 53% of the Wholesale Trade establishments had fewer than five employees.
The Manufacturing sector had the highest percentage of businesses with 20 or more employees at 43% (45 businesses) while 26% of all Transportation and Warehousing estab‐lishments had 20 or more employees (12 businesses).
Between 2000 and 2010, the number of establishments with 50 to 99 employees grew by 14.3% (+3 establishments), while all other business size categories lost establishments or held steady. The largest decline occurred in the 20 to 49 size range, losing 23 business es‐tablishments (‐35.9%).
Wholesale Transportation/
Construction Manufacturing Trade Warehous ing No. Pct.
1 to 4 105 26 80 23 234 48.5
5 to 9 29 19 25 2 75 15.6
10 to 19 11 21 20 3 55 11.4
20 to 49 12 25 18 9 64 13.3
50 to 99 5 7 6 3 21 4.4
100 to 249 2 13 3 2 20 4.1
250 or more 0 6 5 2 13 2.7
Total 164 117 157 44 482 100.0
1 to 4 103 28 70 17 218 51.75 to 9 14 23 23 10 70 16.6
10 to 19 9 10 12 7 38 9.020 to 49 9 18 12 2 41 9.7
50 to 99 2 9 7 6 24 5.7 100 to 249 0 12 2 4 18 4.3
250 or more 1 6 6 0 13 3.1
Total 138 106 132 46 422 100.0
Sources: Bureau of the Census; County Business Patterns; Maxfield Research Inc.
2010
TABLE I‐3INDUSTRIAL BUSINESSES BY INDUSTRY AND SIZE OF BUSINESS
ARDEN HILLS (55112 AND 55126 ZIP CODES)2000 and 2010
Total
2000

INDUSTRIAL MARKET ANALYSIS
MAXFIELD RESEARCH INC. 130
Of the sectors that typically utilize industrial space, the Transportation and Warehousing sector was the only industry to grow between 2000 and 2010, adding two businesses (+4.5%). The Manufacturing sector experienced a ‐9.4% decline in the number of business establishments (‐11 businesses), while Construction and Wholesale Trade both experienced declines of ‐15.9% after losing ‐26 and ‐25 establishments, respectively.
234
7555 64
21 20 13
218
70
38 4124 18 13
0
50
100
150
200
250
300
1 to 4 5 to 9 10 to 19 20 to 49 50 to 99 100 to 249 250 ormore
Number of Industrial Businessesby Size of Business
2000
2010
164
117
157
44
138
106132
46
0
50
100
150
200
250
300
Construction Manufacturing Wholesale Trade Transportation/Warehousing
Number of Industrial Businessesby Industry
2000
2010

INDUSTRIAL MARKET ANALYSIS
MAXFIELD RESEARCH INC. 131
Growth of Industrial‐Type Jobs The following table presents total employment growth trends and projections in the Market Area from 2000 to 2020, including the estimated percentage of total employment among jobs that typically occupy industrial space. The figures were compiled by Maxfield Research, based on data from the Minnesota Department of Trade and Economic Development (DEED). The 2012 estimate is based on second quarter data.
Between 2000 and 2010, the TCAAP Site PMA lost more than ‐8,000 jobs (‐6.8%) due, in large part, to the economic recession while the estimated number of jobs requiring indus‐trial space decreased by ‐13,610 jobs (‐22.1%). Over half of these jobs losses occurred in the Manufacturing sector which experienced a ‐22% decline in jobs during the decade (‐7,908 jobs).
The 2020 forecast is based on the 2010‐2020 industry projections for the Twin Cities pub‐lished by DEED, the most recent forecast data available. By 2020, there are expected to be over 1.7 million jobs in the Metro Area. The PMA represented 10.1% of the Metro Area’s employment in 2000 and 10.0% in 2010. Because of the PMA’s location along several major transportation corridors and the residential growth that is projected to occur north of the PMA, we project that the PMA’s proportion of Metro Area employment will grow to approx‐imately 10.2% by 2020, resulting in 176,457 PMA jobs in 2020.
According to long‐term industry projections provided by DEED for the Twin Cities, the number of jobs in the region is expected to expand by 12.0% between 2010 and 2020. The number of jobs in the industry sectors that typically locate in industrial space is expected to increase by 9.6% (+33,600 jobs). Much of this growth is expected to occur in the Wholesale Trade sector (+10,432 jobs) and the Transportation and Warehousing industry (+6,719 jobs). The Construction sector is projected to add nearly 18,000 jobs while Manufacturing jobs grow by only 1,627 (+1%). Statewide, the manufacturing sector is projected to grow 4.9%. Much of this growth will occur outside the Metro Area due to the presence of lower‐cost real estate and sizeable labor pools from which to draw employees.
Based on DEED’s forecast for the Twin Cities Metro Area, jobs in the sectors that typically occupy industrial space accounted for 20.9% of total jobs in 2010. This proportion is pro‐jected to decrease to 20.5% of total jobs by 2020 (a ‐2.2% decrease).
We expect that the industrial job growth in the PMA will trend similar to the Metro Area during the current decade. Industrial jobs accounted for 37.8% of total jobs in 2000, 34.4% in 2005, 31.0% in 2010, and 30.8% in 2012. Based on the shrinking proportion of industrial jobs expected to occur throughout the Twin Cities, we project that the percentage of indus‐trial jobs in the PMA will decline to 30.3% of total jobs by 2020. While the ratio of industrial jobs to total jobs will likely decline during the decade, we expect that the total number of industrial jobs will grow by approximately 5,485, representing an 11.4% increase.

INDUSTRIAL MARKET ANALYSIS
MAXFIELD RESEARCH INC. 132
This growth will make up for some of the job losses that occurred during the recession, particularly in the Construction sector as residential and commercial building activity recov‐ers over the next several years. The Construction sector lost nearly 50% (‐2,341) of its jobs in the PMA between 2005 and 2010. Market Area jobs in the Manufacturing sector de‐clined by ‐13% (‐4,087 jobs), while the Trade, Transportation, and Utilities sector lost ap‐proximately ‐5,434 jobs (‐13.7%). However, we do not anticipate that there will be enough growth to make up for all the industrial jobs lost between 2005 and 2010.
Industrial Demand Estimates Maxfield Research Inc. projects demand for industrial space based on forecasted employment growth trends in the industrial‐using industries. Table I‐5 shows projected industrial absorption in Arden Hills from 2012 to 2020 based on the Market Area employment growth forecast in the industrial‐using industries which include: Construction; Manufacturing; and, Trade, Transporta‐tion, and Utilities. It should be noted that we use only use 50% of jobs in the Trade, Transporta‐tion, and Utilities sector to leave out jobs in the Retail Trade sector.
As of 2012, there are approximately 49,422 PMA jobs in the industry sectors that typically occupy industrial space, 30.8% of all jobs. This percentage is projected to decrease modest‐ly by 2020 as the greatest job growth over the next several years, according to the Minneso‐ta Department of Employment and Economic Development, is among industries that would require office space, such as Education and Health Services, Professional and Business Ser‐vices, and Financial Activities.
We project that by 2020 about 30.3% of all jobs in the PMA will be in industries that typical‐ly require industrial space. To reach this percentage, approximately 4,044 industrial jobs will be added in the PMA between 2012 and 2020.
Estimate Forecast
2000 2005 2010 2012 2020 No. Pct. No. Pct. No. Pct.
Total Jobs 163,064 166,143 154,882 160,396 176,457 ‐8,182 ‐5.0% ‐11,261 ‐6.8% 21,575 13.9%
Industrial Jobs* 61,591 57,125 47,981 49,422 53,466 ‐13,610 ‐22.1% ‐9,144 ‐16.0% 5,485 11.4%
% Industrial jobs 37.8% 34.4% 31.0% 30.8% 30.3% ‐‐ ‐‐ ‐‐ ‐‐ ‐‐ ‐‐
Sources: Minnesota Department of Employment & Economic Development; Maxfield Research Inc.
*Industrial jobs include jobs primarily in the Construction, Manufacturing, Wholesale Trade and Transportation/
Warehousing sectors.
2000 to 2010 2010 to 2020
TABLE I‐4
2005 to 2010
EMPLOYMENT GROWTH TRENDS AND PROJECTIONS
TCAAP SITE PRIMARY MARKET AREA
2000 to 2020
Change

INDUSTRIAL MARKET ANALYSIS
MAXFIELD RESEARCH INC. 133
We estimate that approximately 1,000 to 1,100 square feet of new industrial space will be required to accommodate every new industrial job. This estimate is based on information in a September 2009 report prepared for the NAIOP (National Association of Industrial and Office Professionals) Research Foundation titled: “Assessing Changing Employment Trends Driving Commercial Real Estate Development.” The report states that, as of 2007, there were 1,063 square feet of occupied industrial space per industrial employee in the Minne‐apolis/St. Paul Metro Area.
Multiplying the average space required per industrial employee results in demand for roughly 4.0 to 4.5 million square feet of newly‐occupied industrial space in the Market Area by 2020. Using an estimated floor area ratio range of 0.2 to 0.35 results in approximately 265 to 511 acres of industrial land absorption in the area by 2020.
Due to the Site’s potential access to Highway 10 and I‐35W and the central location of the Site within the Northeast industrial submarket, we project that the TCAAP Site could cap‐ture 10% of the demand growth, resulting in approximately 400,000 to 445,000 square feet of industrial space supportable on the Site.
Based on the floor area ratio range, these projections translate into roughly 27 to 51 acres of land absorption by 2020. The remaining 90% of the demand growth will be captured by filling vacancies in existing buildings and new development elsewhere in the PMA.
Projected industrial employment growth in Market Area1
= Employees
(times) Avg. space required per employee2
x 1,000 ‐ 1,100 Square Feet
(equals) Total industrial building space required in Market Area = 4,044,000 ‐ 4,448,400 Square Feet
(times) Projected land absorption (at 20%‐35% FAR3) x 0.35 ‐ 0.20 FAR
(equals) Total acres required to accommodate industrial demand = 265 ‐ 511 Acres
(times) Percent Capturable on Subject Site x
(equals) Total industrial building space capturable on Site = 404,400 ‐ 444,840 Square Feet
(equals) Total acres required to accommodate industrial demand = 27 ‐ 51 Acres
1 Covered employment projections.
2 Average for Minneapolis/St. Paul per a 2009 NAIOP Research Foundation report
3 Typical Floor Area Ratio range for industrial buildings
Source: Maxfield Research Inc.
TABLE I‐5
PROJECTED DEMAND FOR ADDITIONAL INDUSTRIAL SPACE
TCAPP SITE PRIMARY MARKET AREA
2012 TO 2020
4,044
10%
2012 to 2020

CONCLUSIONS & RECOMMENDATIONS
MAXFIELD RESEARCH INC. 134
Introduction The previous sections focused on the “demand” and “supply” factors for various real estate sectors, including residential, commercial, and industrial. For each real estate sector, we calculated the Market Area demand and estimated the proportion of that demand capturable on the TCAAP Site in Arden Hills. This section summarizes demand calculated for specific housing products, as well as commercial and industrial property types on the TCAAP Site and recommends general uses that have the potential to succeed on the Site. The following tables and charts illustrate the level of demand by property type capturable on the Site along with an estimate of the amount of land required to support the projected demand.
Residential Demand
Table J‐1 summarizes demand for general occupancy market rate rental and for‐sale housing, as well as senior housing demand capturable on the TCAAP Site over the next five years. The land area requirements are based on the high range of demand capturable on the Site for each property type. Additionally, the density (units/acre) calculations used in the table are based on a sampling of recent development projects around the Metro Area. The market rate rental and senior housing density calculation is exclusive of right‐of‐way while the for‐sale housing density calculation includes right‐of‐way for an internal road network.
Housing Type
General‐Occupancy Housing
Market Rate Rental 20.0 ‐ 30.0 21 ‐ 32
For‐Sale Housing 190 ‐ 225
Single‐Family, Detached 1.7 ‐ 2.0 175 ‐ 206
Multifamily 8.0 ‐ 10.0 15 ‐ 19
Total General Occupancy Housing 211 ‐ 256
Market Rate Senior Housing
Senior Housing Total 193 ‐ 256 204 ‐ 272 20.0 ‐ 30.0 9 ‐ 14
Active Adult ‐ Owner 4 ‐ 5 6 ‐ 9
Active Adult ‐ Rental 63 ‐ 84 66 ‐ 88
Congregate 32 ‐ 42 32 ‐ 43
Assisted Living 47 ‐ 63 48 ‐ 63
Memory Care 47 ‐ 62 52 ‐ 69
Source: Maxfield Research Inc.
TABLE J‐1
TCAAP SITE MARKET AREA
December 2012
Demand Capturable
on a Site (Units)
HOUSING DEMAND SUMMARY
Maximum Land Area
Requirements*
Units/Acre Acres
*Maximum land area requirements based on the high range of demand capturable on a site for
each property type
Units/Acre Acres
634
20172012
350
150
500
1,134
2012 ‐ 2017
CONCLUSIONS & RECOMMENDATIONS
MAXFIELD RESEARCH INC. 135
Based on the findings of our analysis and demand calculations, the following points provide a summary of demand for for‐sale and rental housing. It is important to note that these pro‐posed concepts are intended to act as a guide to best meet the housing needs of existing and future households in the area over the next five years.
In total, we find demand to support approximately 1,134 units of general occupancy hous‐ing between 2012 and 2017. Highest demand will likely be for rental housing, representing roughly 56% of the total general occupancy housing demand. This is due in large part to changing demographics and a shift in home ownership psychology. Many first‐time home buyers remain on the fence as they await clearer indication the economy is recovering be‐fore deciding to purchase and strong demographics from the echo boom generation will generate strong demand for rental housing over the next several years. We also found de‐mand for between 193 and 256 market rate senior housing units in 2012, growing to be‐tween 204 and 272 units by 2017.
In total, we expect that general occupancy residential development could consume approx‐imately 211 to 256 acres of the TCAAP Site between 2012 and 2017. At a range of 1.7 to 2.0 units per acre, the detached single‐family units would be developed at the lowest density and require the highest amount of land area (175 to 206 acres). For‐sale multifamily hous‐ing would likely be developed at a density of eight to ten units per acre and require be‐tween 15 and 19 acres of land. At a density of 20 to 30 units per acre, senior housing and general occupancy rental development would require up to 46 acres of land. The general occupancy rental units would consume between 21 and 32 acres while senior housing would require between nine and 14 acres.
Residential uses developed on the property should be situated away from the surrounding highway network and be oriented in a manner that takes advantage of the Site’s natural amenities to maximize the marketability of the property. Although, the higher density rent‐al and senior housing facilities could be located closer to the major access points to the property and serve as a buffer between commercial and single‐family residential uses.
General Occupancy Rental Housing
We estimate that a development on the subject property could capture approximately 10% to 15% of the general occupancy market rate rental housing demand in the Market Area. This capture rate is based on the Site location in the PMA and considers its potential draw from the PMA and SMA. It also accounts for the number and location of other develop‐ments that would satisfy demand.
We anticipate that the subject property could support approximately 423 to 634 units of new market rate general occupancy rental housing between 2012 and 2017. The strongest sources of demand for housing at the subject location will be professionals in their late‐20s and early‐30s who work in Minneapolis, St. Paul, or in nearby suburban communities. Younger households, those in their early and mid‐20s, will likely account for a smaller por‐

CONCLUSIONS & RECOMMENDATIONS
MAXFIELD RESEARCH INC. 136
tion of demand for housing at the subject development and will be more price sensitive, although the nearby colleges will generate some demand from the younger cohort.
We suggest that a general occupancy rental housing development be developed in phases, with the first phase consisting of a project containing between 100 and 150 units, with addi‐tional units being developed depending on the rate of absorption and leasing activity in the initial phase(s).
Based on current market conditions, we project that an apartment project on the Site would open with approximately 15% to 20% of the units preleased with the remaining units leasing at an average rate of 10 to 12 units per month. This estimate assumes the project would open for occupancy during the peak leasing season beginning in mid to late spring to allow for the maximum exposure to prospective renters and that an effective marketing campaign will be undertaken to generate awareness of the project.
For‐Sale Housing
Based on recent new construction sales trends and the age distribution of Market Area households, we estimate that 70% of the householders seeking new housing will desire sin‐gle‐family detached residential units, while the remaining 30% will be seeking multifamily units.
We anticipate that there will be demand potential for 1,577 single‐family and 676 multifam‐ily units from the PMA along with 341 single‐family and 146 multifamily units from the SMA over the next five years.
Due to the Site’s desirability as a residential location, we estimate that the subject property could capture roughly 15% to 20% of the PMA demand and 10% of the SMA demand, equat‐ing to a total of 271 to 350 detached single‐family units and 116 to 150 multifamily units between 2012 and 2017. Because the detached single‐family housing market recovery seems to be ahead of a multifamily housing recovery, we suggest that the for‐sale housing units be developed in phases, beginning with single‐family housing units. Multifamily units should not be considered until the market exhibits signs of a sustained recovery.
Senior Housing
A growing older adult and senior population should maintain long‐term demand for senior housing alternatives in the PMA, although pending growth in the supply of senior housing in the PMA will limit demand growth between 2012 and 2017.
There appears to be pent‐up demand for 422 active adult rental units in the PMA. Based on a capture rate of 15% to 20%, we estimate that the subject property could support between 63 and 84 active adult rental units in 2012, increasing to a range of 66 to 88 active adult

CONCLUSIONS & RECOMMENDATIONS
MAXFIELD RESEARCH INC. 137
rental units in 2017. Due, in large part, to the large supply of active adult ownership units in the PMA, we found little demand for new active adult ownership housing. There is current‐ly demand to support an additional 32 to 42 congregate and 47 to 63 assisted living units on the Site in 2012, with little change in demand expected by 2017. We also find demand for 47 to 62 memory care units. By 2017, memory care demand is expected to grow to be‐tween 52 and 69 units. This level of senior housing demand (particularly active adult) may not be realized in the short‐term as many seniors prefer to age in place and delay moving to senior housing until they need services.
Commercial/Industrial Demand
Table J‐2 summarizes demand for retail, office and industrial space on the subject property in the 2012 to 2020 time period. The land area requirements are based on the high range of demand capturable on the Site for each property type. Additionally, the density (FAR) calcula‐tions used in the table are based on a sampling of recent development projects around the Metro Area and excludes right‐of‐way.
In total, we find demand to support between 194,000 and 260,000 square feet of retail space, 138,000 to 207,000 square feet of office space, and approximately 404,000 to 445,000 square feet of industrial space.
In total, we expect that commercial/industrial development could consume approximately 65 to 94 acres of the TCAAP Site between 2012 and 2020. At a floor area ratio (FAR) of 0.20 to 0.25, retail development would require between 24 and 30 acres of land. An office de‐velopment would be developed at the highest density, at a FAR ranging from 0.35 to 0.40, which would consume roughly 12 to 14 acres of land. An industrial project developed at a
Property Type
Retail ‐ 0.25 ‐ 0.20 24 ‐ 30
Office ‐ 0.40 ‐ 0.35 12 ‐ 14
Industrial ‐ 0.35 ‐ 0.20 29 ‐ 51
Commercial/Industrial ‐ 65 ‐ 94
Source: Maxfield Research Inc.
138,078 207,117
404,400 444,840
*Maximum land area requirements based on the high range of demand (square feet)
capturable on a site for each property type.
2012 ‐ 2020
Maximum Land Area
Requirements*
FAR Acres
TABLE J‐2
TCAAP SITE MARKET AREA
December 2012
Demand Capturable
on a Site (Square Feet)
COMMERCIAL/INDUSTRIAL DEMAND SUMMARY
194,555 259,407
737,033 911,364

CONCLUSIONS & RECOMMENDATIONS
MAXFIELD RESEARCH INC. 138
FAR of 0.20 to 0.35 would require approximately 29 to 51 acres of land. Additionally, newer suburban hotels around the Metro Area have been developed at a density of approximately 35 to 40 rooms per acre, so a 120‐ to 130‐room hotel on the Site would require between three and four acres of land.
Commercial/industrial uses should be located on the Site in a manner that maximizes visibility and access from the surrounding highway network. Commercial uses will most likely desire a location with visibility from I‐35W and should be oriented around the inter‐change of I‐35W and County Road H. Industrial users will want convenient access to the highway network and do not necessarily require the visibility of the commercial uses. As such, industrial uses would be well‐suited adjacent to Highway 10.
Retail Development
Total leakage of retail expenditures (including food and drink) from the PMA was estimated to be at 14%, indicating a substantial loss of potential retail sales. The subject property will likely attract stores in the retail categories where there is existing leakage. By dollar vol‐ume, retail leakage was greatest in Automobile Dealers, Grocery Stores, Food Services and Drinking Places, and General Merchandise Stores.
Retail businesses with the greatest potential are neighborhood/community‐oriented retailers serving the local population, such as grocery, full‐service restaurants, and health and personal care stores. Because many big box retailers are already located in the trade area, the potential to draw a big box store to the Site unless there is limited competition may be difficult. While exhibiting signs of improvement, the local retail market has not yet fully‐recovered from the recession. As such, the demand for retail on the Site will not likely be realized until the second half of the decade.
Office Development
The FAR used to project demand for office space is typical of smaller (two‐ to three stories and 30,000 – 50,000 sf) office buildings with surface parking which are common in suburban settings.
Because of the relatively high office vacancy rate in the submarket surrounding the TCAAP Site, we do not anticipate much demand for new office development in the short‐term. Sustained job growth in the Market Area will be needed to generate the demand necessary to absorb the existing vacancy in the market. We expect that market conditions will sup‐port a new office development on the Site during the second half of the decade.
The most likely target markets for office space on the Site would be businesses in the industry sectors that are projected to grow and have an existing presence in the Market Ar‐ea. The PMA has a large employment base in the Professional and Business Services sector

CONCLUSIONS & RECOMMENDATIONS
MAXFIELD RESEARCH INC. 139
as well as the Education and Health Services industry, both of which are expected to experi‐ence substantial growth by 2020. In addition to traditional multi‐tenant office space, the Site would also likely be an attractive location for a corporate campus as well as less‐traditional office users such as governmental agencies and medical services.
Industrial Development
Due to the Site’s access to Highway 10 and I‐35W and the central location of the property within the Northeast industrial submarket, we project that the TCAAP Site could capture approximately 400,000 to 445,000 square feet of industrial space on the property.
Bulk Warehouse properties with 32‐foot clear height ceilings appear to be in highest de‐mand currently and forecasted job growth in the Transportation and Warehousing subsec‐tor will continue to support demand for this product type. Functionally well‐designed Office Warehouse facilities that have 24‐foot or higher clear height ceilings, are energy efficient, have ample parking and good lighting are also in demand.
While Office Showroom properties in the Northeast submarket have a relatively low vacan‐cy rate (14.5% compared to 16.2% across the Twin Cities), this product type was hit hard by the recession and often competes with class B office space for tenants. As such, we do not recommend the development of Office Showroom space at this time. However, a sustained recovery could generate demand for additional Office Showroom space in the submarket during the second half of the decade.
Final Conclusions
The following points summarize our recommendations for development of the TCAAP Site based on the findings of this market analysis.
As one of the largest tracts of undeveloped land near the Metro core, the subject property has several positive attributes that make it an attractive location for redevelopment. It is situated along a major north‐south commuter route and has convenient access to I‐35W and the surrounding road network. There are several large employers and employment centers located nearby, and the property contains many natural amenities and features.
We expect that residential development could consume up to approximately 270 acres of the Site by 2017. In addition, we project that commercial/industrial development would require roughly 94 acres of the Site by 2020. In total, our demand projections equate to the build‐out of roughly 85% of the TCAAP Site by 2020. We anticipate that there will continue to be demand potential on the Site after 2020, so extending the time‐frame for build‐out beyond 2020 would allow for a greater mix of uses to be developed on the Site.

CONCLUSIONS & RECOMMENDATIONS
MAXFIELD RESEARCH INC. 140
General occupancy market rate rental housing offers the most immediate opportunity for development on the Site. Area vacancy rates are below equilibrium and strengthening job growth coupled with strong population growth from the echo boom generation is driving demand for rental housing.
A recovery in the single‐family detached residential market appears to be well‐underway as indicated by improving home sales and residential building permit activity. A single‐family development located in the higher‐elevation, eastern portion of the property would likely be attractive to potential home buyers.
Residential development on the Site could create positive momentum for the property and help stimulate additional development.
Bulk Warehouse properties with 32‐foot clear height ceilings appear to be in demand currently and projected job growth in the Transportation and Warehousing subsector will support continued demand for this product type. Functionally well‐designed Office Ware‐house facilities that have 24‐foot or higher clear height ceilings are also in demand. Due to the mixed‐use nature of the subject property, we recommend that industrial uses be ori‐ented along Highway 10, away from any future housing. Incorporating landscape screening and other design features into the layout of any industrial development will help separate industrial uses from residential uses and alleviate noise and safety concerns from potential residential buyers and tenants.
While the subject property provides an excellent location for retail and office uses, current market conditions do not support new development in the short term. The addition of resi‐dential uses on the Site will help stimulate demand for commercial development but not until the second half of the decade. The subject property has the potential to attract large corporate users, but securing a major corporate user is a competitive process and would likely require some form of public financing. Additionally, a corporate campus would con‐sume a significant portion of the TCAAP Site land area and there is no guarantee that a campus development would ever occur. As a result, planning specifically for a corporate campus could delay development, so we recommend a development concept that could support a corporate campus but is flexible to accommodate changes in real estate demand over time.