a life-cycle analysis model and decision-support tool...
TRANSCRIPT
A Life-Cycle Analysis Model and Decision-Support Tool for Selecting Recycled Versus Virgin Materials for Highway Applications
Final Report for RMRC Research Project No. 23
Prepared for the RMRC by
Dr. Arpad Horvath
University of California at Berkeley
March 2004
This material is based on work supported by the Federal Highway Administration under Cooperative Agreement No. DTFH61-98-X-00095 through the Recycled Materials Resource Center at the University of New Hampshire, Durham, New Hampshire.
1

Acronyms
AC – Asphalt concrete
CARB – California Air Resources Board
EIO-LCA - Economic input-output life-cycle assessment
EPA – Environmental Protection Agency
FIRE - Factor Information Retrieval
HTP – Human toxic potential
LCA - Life-cycle assessment
NIOSH - National Institute for Occupational Safety and Health
PAH - Polycyclic aromatic hydrocarbons
PaLATE - Pavement Life-cycle Assessment Tool for Environmental and Economic Effects
PCC – Portland cement concrete
RAP – Recycled asphalt pavement
RCM – Reclaimed concrete materials
RCRA - Resource Conservation and Recovery Act
RMRC – Recycled Materials Resource Center, University of New Hampshire
S-PAC - Sulfur-polycyclic aromatic compounds
2

Table of Contents
1. Background ............................................................................................................................... 4
2. Pavement Live-cycle Assessment Tool for Environmental and Economic
Effects (PaLATE) ..................................................................................................................... 4
2.1 Modeling ............................................................................................................................ 6
2.2 Audience ............................................................................................................................. 6
2.3 User Interface ..................................................................................................................... 7
2.4 Tool Structure ..................................................................................................................... 7
2.5 Modeling Environmental Effects of Using Traditional Highway Materials Information . 10
2.6 Modeling of Environmental Effects of Using Recycled Materials for Highway
Applications ...................................................................................................................... 18
2.7 Modeling of Economic Costs of Using Traditional Highway Materials............................ 24
2.8 Modeling of Economic Costs of Using Recycled Materials for Highway
Applications ...................................................................................................................... 27
3. Literature Cited ....................................................................................................................... 34
3

1. Background
The objective of this project was the development of a life-cycle assessment (LCA) framework and
computer-based tool, which draws on environmental and economic parameters, and assists decision-
makers in evaluating the use of recycled materials in highway construction and maintenance
activities. The initial proposal suggested a list of tasks, and significant progress has been
accomplished in each one.
Task 1. Develop a model of economic costs of using traditional highway materials.
Task 2. Develop a model of economic costs of using recycled materials for highway applications.
Task 3. Develop a model of environmental effects of using traditional highway materials.
Task 4. Develop a model of environmental effects of using recycled materials for highway
applications.
Task 5. Develop a computer-based decision-support tool.
This report is organized according to the same division. Initially the report presents an overview of
the tool. Next, the tool structure is introduced followed by a discussion of the environmental
module, and a discussion of the economic module. The tool allows the comparison of traditional
materials and secondary materials for road construction, and includes information on maintenance,
recycling, and construction technologies. The final version of the model is highly comprehensive,
but it is also amenable to future additions and expansions.
2. Pavement Life-cycle Assessment Tool for Environmental and Economic Effects (PaLATE)
The Pavement Life-cycle Assessment Tool for Environmental and Economic Effects (PaLATE)
utilizes a life-cycle assessment framework that draws on engineering, environmental, and economic
information and data to evaluate the use of virgin and recycled materials in the construction and
maintenance of pavements that use different percentages of virgin and recycled materials in the
subgrade/subbase and wearing course layers. The tool takes user input for the design, initial
construction, maintenance, equipment use, and costs of a roadway, and characterizes the life-cycle
environmental effects and costs of a given project.
4
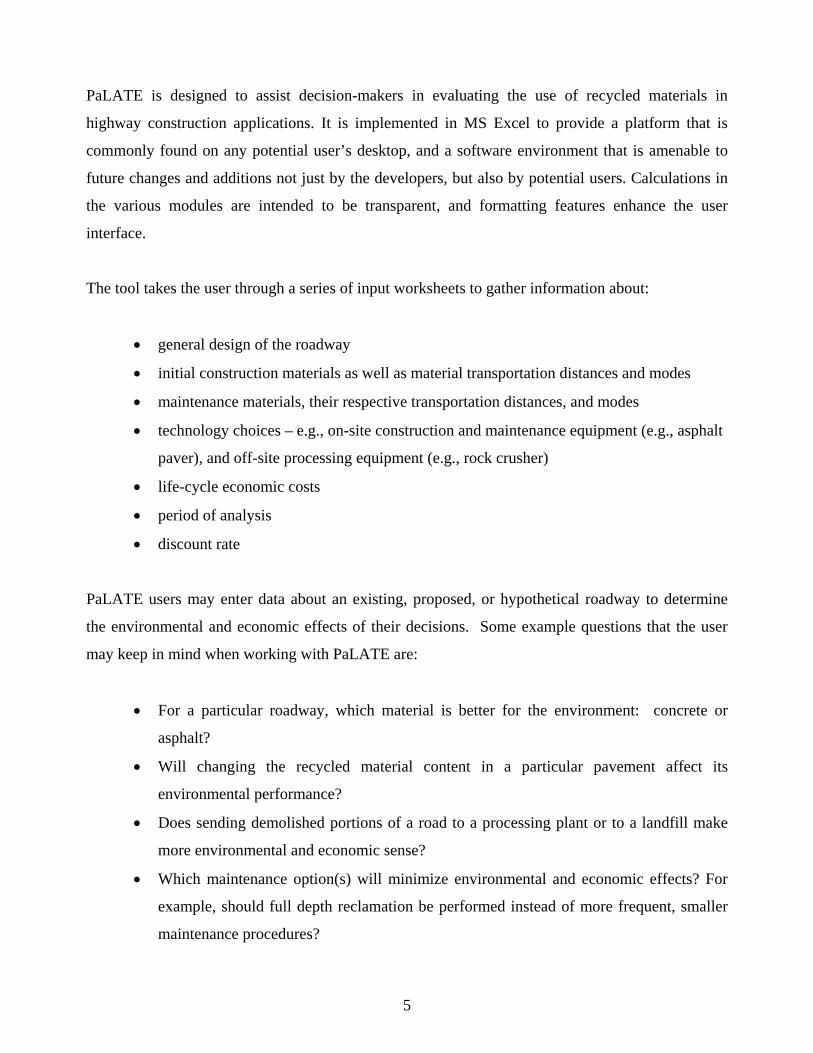
PaLATE is designed to assist decision-makers in evaluating the use of recycled materials in
highway construction applications. It is implemented in MS Excel to provide a platform that is
commonly found on any potential user’s desktop, and a software environment that is amenable to
future changes and additions not just by the developers, but also by potential users. Calculations in
the various modules are intended to be transparent, and formatting features enhance the user
interface.
The tool takes the user through a series of input worksheets to gather information about:
• general design of the roadway
• initial construction materials as well as material transportation distances and modes
• maintenance materials, their respective transportation distances, and modes
• technology choices – e.g., on-site construction and maintenance equipment (e.g., asphalt
paver), and off-site processing equipment (e.g., rock crusher)
• life-cycle economic costs
• period of analysis
• discount rate
PaLATE users may enter data about an existing, proposed, or hypothetical roadway to determine
the environmental and economic effects of their decisions. Some example questions that the user
may keep in mind when working with PaLATE are:
• For a particular roadway, which material is better for the environment: concrete or
asphalt?
• Will changing the recycled material content in a particular pavement affect its
environmental performance?
• Does sending demolished portions of a road to a processing plant or to a landfill make
more environmental and economic sense?
• Which maintenance option(s) will minimize environmental and economic effects? For
example, should full depth reclamation be performed instead of more frequent, smaller
maintenance procedures?
5

• Will changing the type and/or capacity of equipment used on-site affect emissions?
• How much of a difference do materials transportation distance and mode make for a case
study? For example, should materials from a local source be used to reduce emissions?
Is it better to transport via rail or truck?
2.1 Modeling
PaLATE is built on extensive data collection, analysis, and modeling efforts at the initial stages of
this research project. It uses the state-of-art LCA model, and it is a robust yet flexible modeling
framework. Robustness is achieved through the inclusion of all relevant roadway engineering
factors coupled to the most significant environmental variables known today. Flexibility is achieved
through the design of the model and transparency of the programming and user interface.
Not just variables! While one intention with creating PaLATE was to provide a modeling
framework that is independent of current or past technology and information that may become
obsolete quickly, we have achieved to incorporate not just the crucial variables of the model, but
also information and data that are as comprehensive as possible, as well as current and relevant. Our
literature surveys have been incorporated into the determination of the actual values for the
variables of the model. We provided default values for most of the variables in the model, but we
left it open to the users to add their own numbers if they deem them more accurate or relevant than
those provided by PaLATE.
2.2 Audience
PaLATE targets primarily pavement designers and engineers, transportation agency decision-
makers, civil engineers, and researchers. Users should have a working knowledge of pavements
and a desire to learn more about the environmental and economic implications of their choices.
6
2.3 User Interface
We have included with PaLATE a set of instructions that describes all modules of the software and
details their use. Every step in the software is integrated with a help file. User input is needed on
many variables, decisions need to be made many times during the software use, but this is the price
of being comprehensive. The user is required to have familiarity with pavement construction
activities in order to go through the set of options required in the analysis. However, the degree to
which the user interacts with PaLATE varies, e.g., the tool provides a set of default parameters that
may or may not be accepted by the analyst.
Web site: A dedicated web site explains the tool, its potentials, its structure, and its applications:
www.ce.berkeley.edu/~horvath/palate.html.
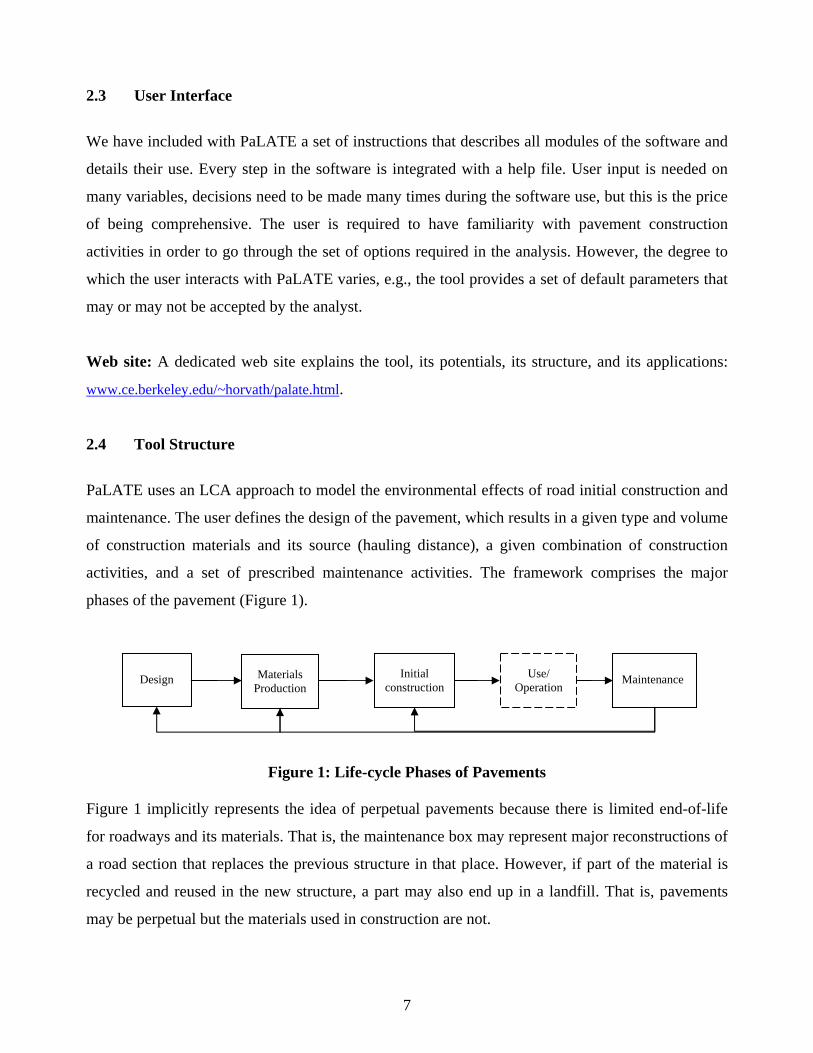
2.4 Tool Structure
PaLATE uses an LCA approach to model the environmental effects of road initial construction and
maintenance. The user defines the design of the pavement, which results in a given type and volume
of construction materials and its source (hauling distance), a given combination of construction
activities, and a set of prescribed maintenance activities. The framework comprises the major
phases of the pavement (Figure 1).
Initial
construction Use/ Design Maintenance
Operation Materials
Production
Figure 1: Life-cycle Phases of Pavements Figure 1 implicitly represents the idea of perpetual pavements because there is limited end-of-life
for roadways and its materials. That is, the maintenance box may represent major reconstructions of
a road section that replaces the previous structure in that place. However, if part of the material is
recycled and reused in the new structure, a part may also end up in a landfill. That is, pavements
may be perpetual but the materials used in construction are not.
7

The first module in the spreadsheet is the design module where the user defines the dimensions of
each layer, the density of the construction materials, and the period of analysis (Figure 2). The
period of analysis is used for discounting purposes as part of the economic assessment. The volume
of the layers combined with the density of the materials calculates the mass of each material, which
is used to determine the regime of operation of the construction equipment.
Figure 2: User Inputs in the Design Module Environmental effects of using recycled materials depend on the characteristics of the equipment
used to recover the materials, and the hauling of materials between processing facilities and the
construction site. Energy use and air emissions are based on typical productivity, fuel consumption
rate, and the engine size of the equipment used in each recycling activity. PaLATE allows for the
selection of different equipment brand/models amongst the ones used in the various recycling
activities (Figure 3). Besides the equipment used at the construction site, the tool includes choices
for larger fixed equipment such as crushing and asphalt plants. The analyst is encouraged to enter
his/her own values and/or equipment type for a given task whenever the default values are not
adequate.
8
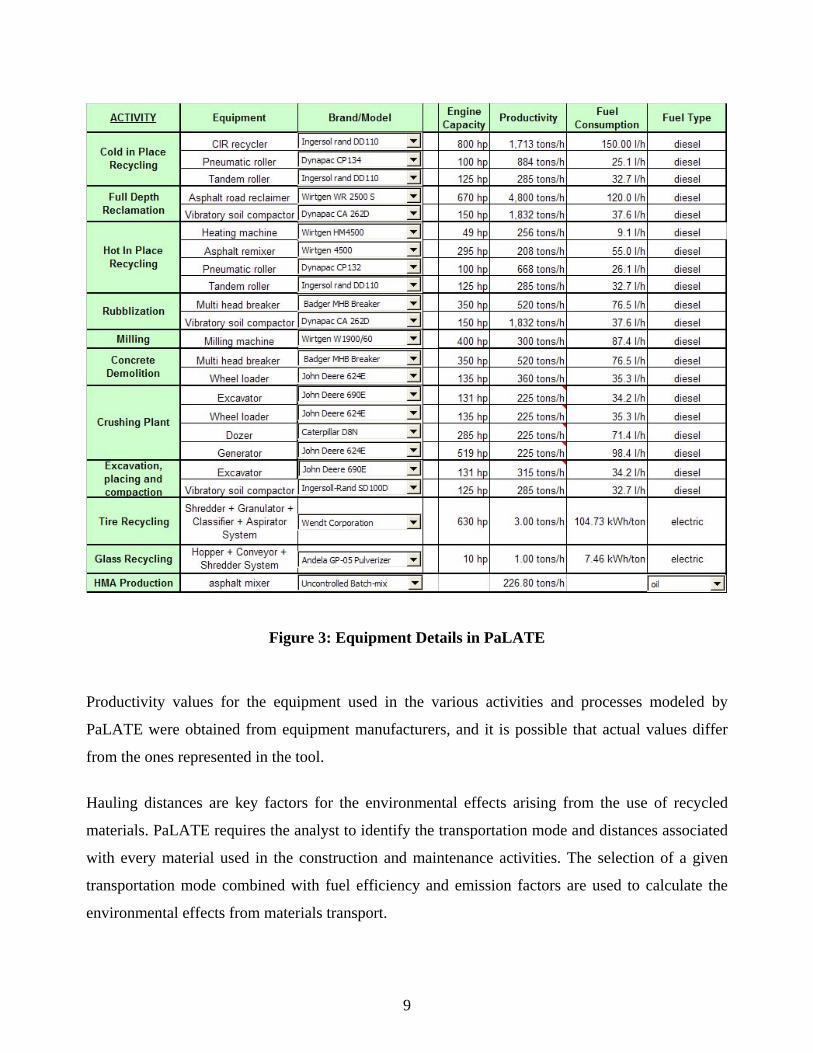
Figure 3: Equipment Details in PaLATE
Productivity values for the equipment used in the various activities and processes modeled by
PaLATE were obtained from equipment manufacturers, and it is possible that actual values differ
from the ones represented in the tool.
Hauling distances are key factors for the environmental effects arising from the use of recycled
materials. PaLATE requires the analyst to identify the transportation mode and distances associated
with every material used in the construction and maintenance activities. The selection of a given
transportation mode combined with fuel efficiency and emission factors are used to calculate the
environmental effects from materials transport.
9
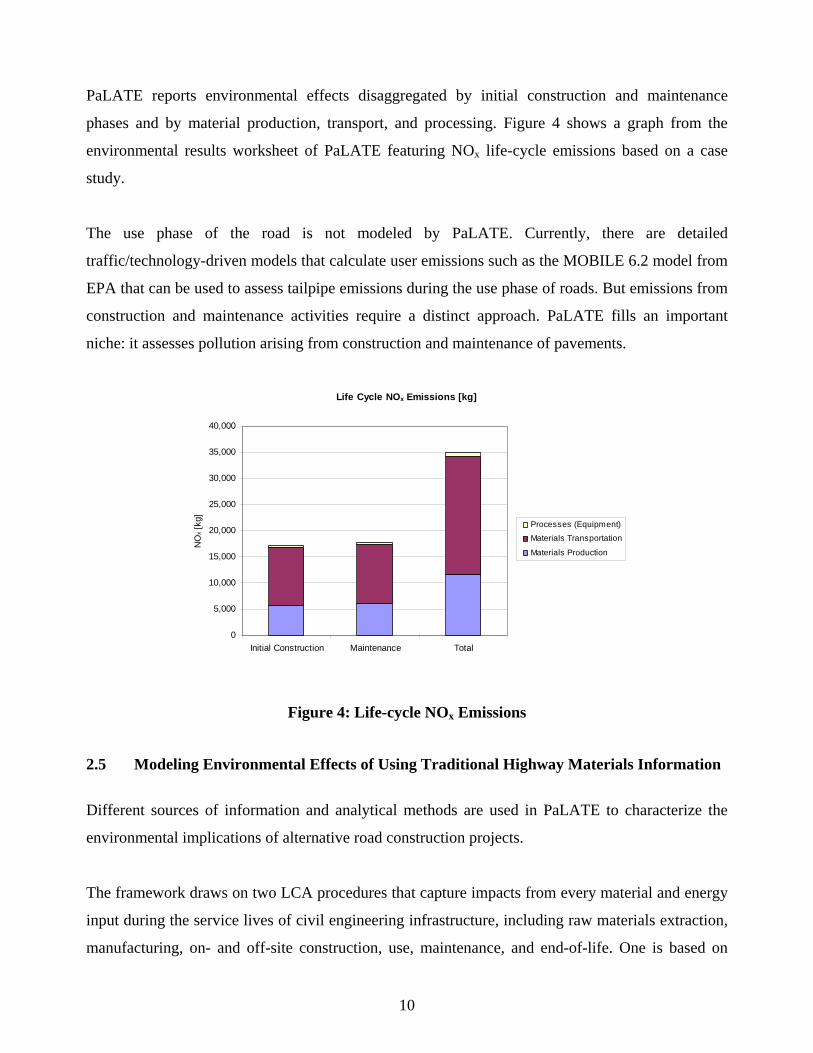
PaLATE reports environmental effects disaggregated by initial construction and maintenance
phases and by material production, transport, and processing. Figure 4 shows a graph from the
environmental results worksheet of PaLATE featuring NOx life-cycle emissions based on a case
study.
The use phase of the road is not modeled by PaLATE. Currently, there are detailed
traffic/technology-driven models that calculate user emissions such as the MOBILE 6.2 model from
EPA that can be used to assess tailpipe emissions during the use phase of roads. But emissions from
construction and maintenance activities require a distinct approach. PaLATE fills an important
niche: it assesses pollution arising from construction and maintenance of pavements.
Life Cycle NOx Emissions [kg]
0
5,000
10,000
15,000
20,000
25,000
30,000
35,000
40,000
Initial Construction Maintenance Total
NO
x [k
g] Processes (Equipment)
Materials Transportation
Materials Production
Figure 4: Life-cycle NOx Emissions 2.5 Modeling Environmental Effects of Using Traditional Highway Materials Information
Different sources of information and analytical methods are used in PaLATE to characterize the
environmental implications of alternative road construction projects.
The framework draws on two LCA procedures that capture impacts from every material and energy
input during the service lives of civil engineering infrastructure, including raw materials extraction,
manufacturing, on- and off-site construction, use, maintenance, and end-of-life. One is based on
10
environmentally augmented economic input-output analysis (EIO-LCA), a Leontief general
equilibrium model of the entire U.S. economy that has been used in a number of environmental and
economic systems analyses [Pacca 2002, Hendrickson 1998]. The economy is divided into a square
matrix of 480 commodity sectors. Each row and column represents a sector, and each cell represents
the economic transactions in dollars between two respective sectors. Thus the matrix presents total
sales from a sector to others, purchases from another sector or from the sector itself (circularity
effects in the economy) to produce a dollar of output. The economic model is augmented by a
number of environmental vectors in order to quantify energy (petroleum distillates, electricity, coal)
and material (ore, fertilizer) and water inputs, as well as emissions (greenhouse gas, toxic, ozone
depleting chemical, water) and wastes (hazardous). Input-output modeling is linear, so the effects of
a $1,000 purchase from a sector are ten times larger than the effects of a $100 purchase from the
same sector. Because EIO-LCA emission factors are available in metric tons per dollar of sector
output, the present framework uses average U.S. producer prices in $/metric ton for each material
(from [Means 1997] and other sources) in order to calculate emissions per mass of material used.
The tool calculates cumulative environmental effects such as:
• energy consumption • water consumption • CO2 emissions • NOx emissions • PM10 emissions • SO2 emissions • CO emissions • Lead emissions • Mercury emissions • Potential leachates • RCRA hazardous waste generated • Human Toxicity Potential (cancer and non-cancer)
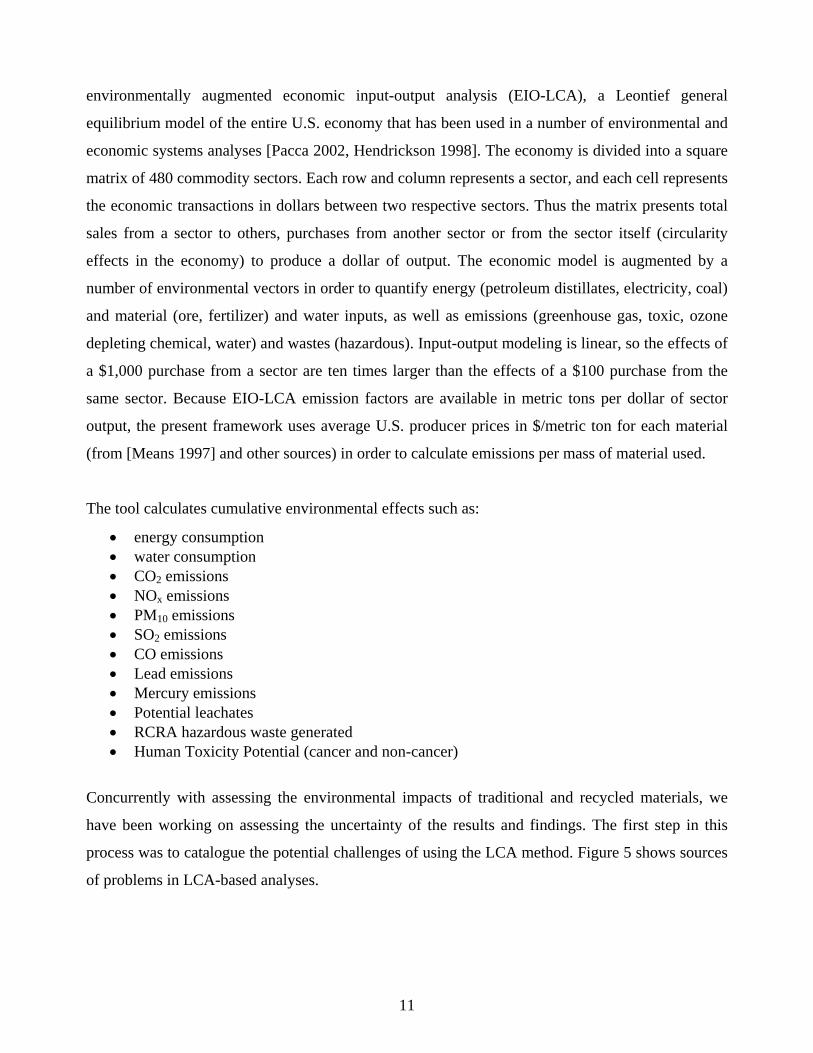
Concurrently with assessing the environmental impacts of traditional and recycled materials, we
have been working on assessing the uncertainty of the results and findings. The first step in this
process was to catalogue the potential challenges of using the LCA method. Figure 5 shows sources
of problems in LCA-based analyses.
11
Figure 5: Assessing uncertainty in results due to LCA [Pacca 2002].
The EIO-LCA database is a source for several emission factors associated with material production.
However, other sources are used for assessing environmental implications of other life cycle phases.
We have not found publications on the environmental effects of the different maintenance activities.
Preliminary results of our research on various asphalt recycling technologies (cold in-place, hot in-
place surfacing, hot in-place repaving, hot in-place remixing, and hot mix asphalt overlay) are
presented in Table 1.
Incomplete data
Collection
Missing data Data
Sources of problems Temporal constraint
Methodological constraint
Economic boundary
Imported goods
Indirect services
Constant technology
Constant returns to scale
No substitution effect
Old data
Interpretation
Inaccuracy
Other assumptions
Intra-sectoral resolution
National averages
Inventory method
12

PARAMETERS TOTAL EMISSIONS (g/m2) ANNUALIZED EMISSIONS
(g/m2/year)
Mainte-nance
Options Treated Depth (mm)
Over- lay
Depth (mm)
Emulsion
Amount (% wght)
Servi-ceabili-
ty (years)
Cost ($/m2) CO2 NOx SO2
PM-10 TOC CO2 NOx SO2
PM-10 TOC
CIR 101.6 50.8 1.5 10 3.09 23,599 16 4 6 4 2,360 2 0 1 0
HIR-Surfacing 25.0 5 172 5 0.30 0.3
2 0.4 34 1 0.06 0.06 0.07
HIR-Repaving 25.0 25.0 8 4.28 11,695 10.1 2.0 3.1 2.1 1,462 1.3 0.3 0.4 0.3
HIR-Remixing 40.0 19.0 8 3.58 8,964 7.9 1.6 2.4 1.6 1,121 1.0 0.2 0.3 0.2
HMA-Overlay 25.0 6 12,323 27.1 3.2 4.3 3.5 2,054 4.5 0.5 0.7 0.6
Table 1. Comparison of Different Maintenance Options for Asphalt Pavements
PaLATE uses an alternative approach for assessing impacts from pavements construction and
maintenance, which is based on the productivity and environmental implications caused by different
types of equipment and materials.
A database that served as an information source for PaLATE was EPA’s Factor Information
REtrieval (FIRE)1. FIRE is a database containing EPA’s recommended emission estimation factors
for criteria and hazardous air pollutants. Using data from FIRE, emissions of particulate matter with
a diameter smaller than 10 µm (PM10) from loading and unloading trucks, as well as emissions of
PM10 from transport, which are not fuel related, have been included in PaLATE.
PaLATE calculates PM10 emissions for aggregates unloading from trucks during the initial
construction and maintenance phases. In addition, calculations for truck loading are carried out for
initial construction and maintenance for the following materials:
• Virgin aggregates • RAP transportation • RCM from concrete plant
1 http://www.epa.gov/ttn/chief/software/fire/
13

For the initial construction and maintenance phases, PaLATE calculates PM10 emissions from truck
loading and truck unloading for the following activities:
• RAP to recycling plant • RAP from recycling plant to site (crushing) • RCM to recycling plant • RCM from recycling plant to site • RAP from site to landfill • RCM from site to landfill
Hauling distances are key factors for the environmental effects arising from the use of recycled
materials. PaLATE requires the analyst to identify the transportation mode and the distances
associated with every material. In addition to emissions from fuel combustion, emissions of PM10
due to truck hauling are assessed as well. Most particles in this case are generated due to the friction
between the truck wheels and the pavement. Therefore, independently of the material hauled,
particles are always produced and included in the assessment. The emission factor used assumes
average values and 90% of control.2
In addition to particles produced due to fuel combustion, which are calculated using EPA’s AP-42
and CARB’s offroad emissions model, other emissions are also part of the material production
phase. In the case of sand and gravel production, the following emission factors from FIRE were
aggregated and included:
• aggregate storage - construction sand and gravel • material transfer and conveying - construction sand and gravel • pile forming stacker - construction sand and gravel • bulk loading - construction sand and gravel • screening - construction sand and gravel
PaLATE includes health effects such as potential impacts of asphalt fumes. Such assessment is
based on information collected at the National Institute for Occupational Safety and Health
(NIOSH). NIOSH published a series of reports on emissions of asphalt fumes.3 The reports contain
emission factors and exposure estimates for the major air releases from asphalt storage and
2 Department of Natural Resources. Bureau of Air Management. Nonmetallic Mining Guidance for the Development of the 1998 Air Emissions Inventory. Publication #: PUBL-AM-268-98. January 1998. Department of Natural Resources. Bureau of Air Management. State of Wisconsin. Madison, WI. 3 http://www.cdc.gov/niosh/topics/asphalt/
14
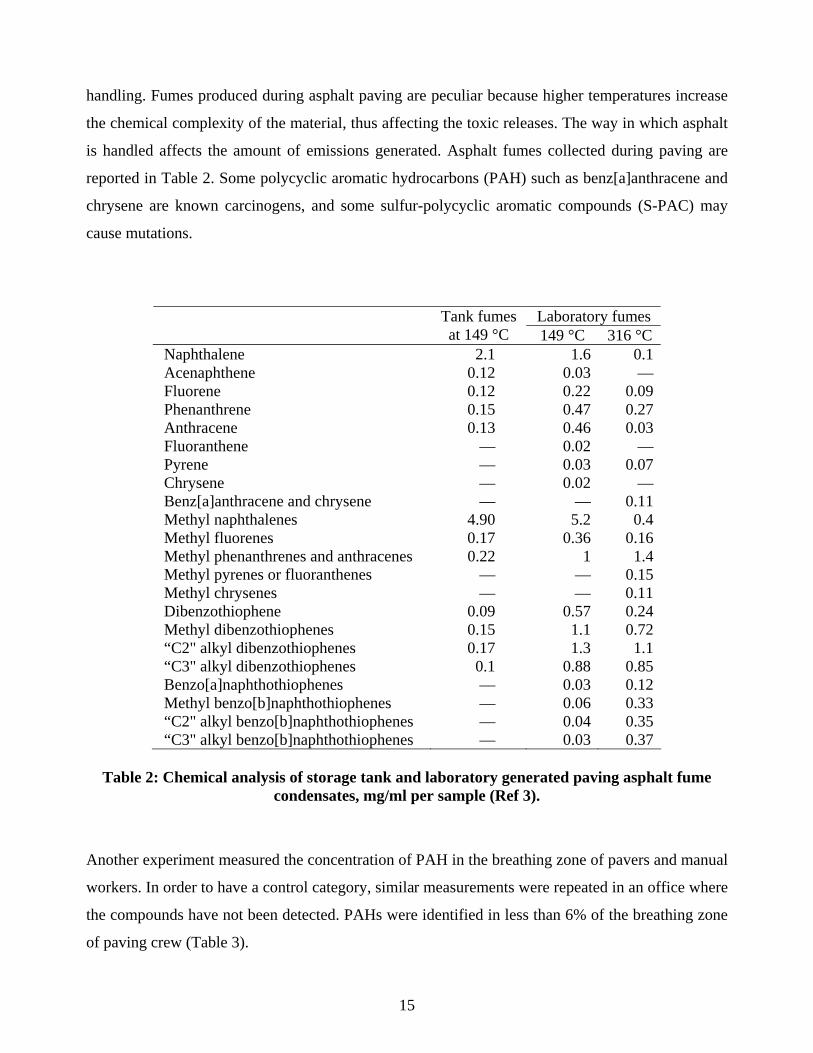
handling. Fumes produced during asphalt paving are peculiar because higher temperatures increase
the chemical complexity of the material, thus affecting the toxic releases. The way in which asphalt
is handled affects the amount of emissions generated. Asphalt fumes collected during paving are
reported in Table 2. Some polycyclic aromatic hydrocarbons (PAH) such as benz[a]anthracene and
chrysene are known carcinogens, and some sulfur-polycyclic aromatic compounds (S-PAC) may
cause mutations.
Laboratory fumes
Tank fumes at 149 °C 149 °C 316 °C
Naphthalene 2.1 1.6 0.1 Acenaphthene 0.12 0.03 — Fluorene 0.12 0.22 0.09 Phenanthrene 0.15 0.47 0.27 Anthracene 0.13 0.46 0.03 Fluoranthene — 0.02 — Pyrene — 0.03 0.07 Chrysene — 0.02 — Benz[a]anthracene and chrysene — — 0.11 Methyl naphthalenes 4.90 5.2 0.4 Methyl fluorenes 0.17 0.36 0.16 Methyl phenanthrenes and anthracenes 0.22 1 1.4 Methyl pyrenes or fluoranthenes — — 0.15 Methyl chrysenes — — 0.11 Dibenzothiophene 0.09 0.57 0.24 Methyl dibenzothiophenes 0.15 1.1 0.72 “C2" alkyl dibenzothiophenes 0.17 1.3 1.1 “C3" alkyl dibenzothiophenes 0.1 0.88 0.85 Benzo[a]naphthothiophenes — 0.03 0.12 Methyl benzo[b]naphthothiophenes — 0.06 0.33 “C2" alkyl benzo[b]naphthothiophenes — 0.04 0.35 “C3" alkyl benzo[b]naphthothiophenes — 0.03 0.37
Table 2: Chemical analysis of storage tank and laboratory generated paving asphalt fume
condensates, mg/ml per sample (Ref 3).
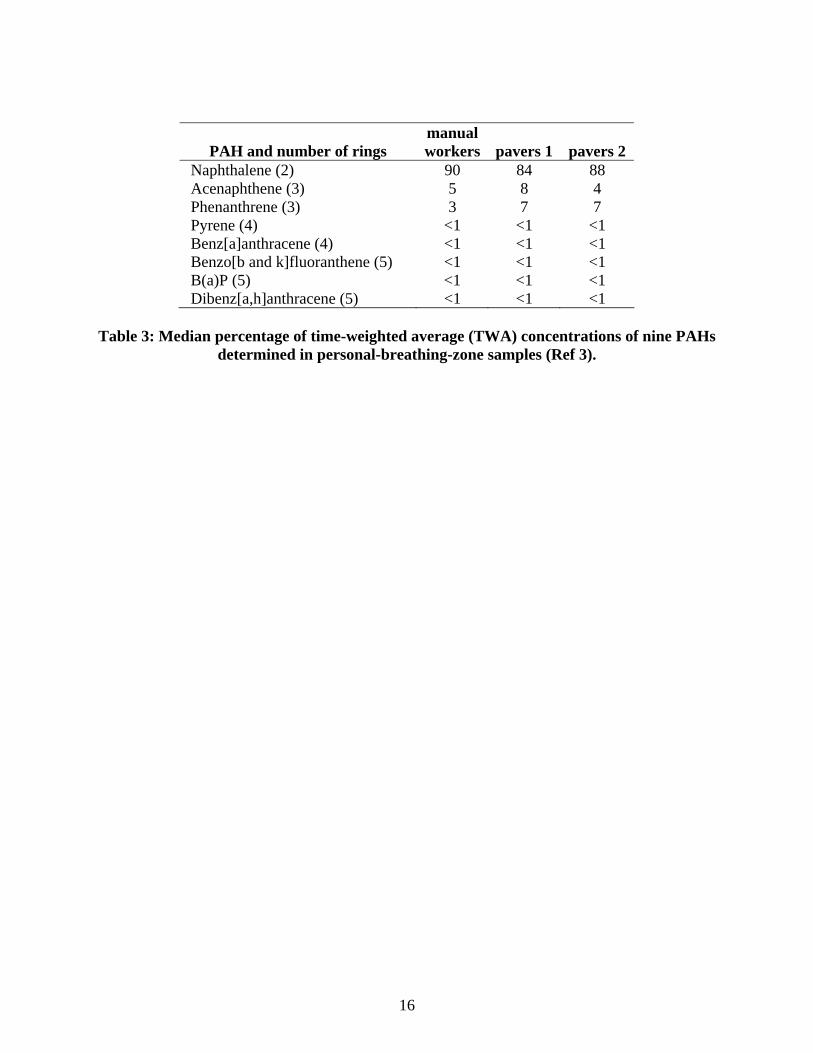
Another experiment measured the concentration of PAH in the breathing zone of pavers and manual
workers. In order to have a control category, similar measurements were repeated in an office where
the compounds have not been detected. PAHs were identified in less than 6% of the breathing zone
of paving crew (Table 3).
15
16
PAH and number of rings manual workers pavers 1 pavers 2
Naphthalene (2) 90 84 88 Acenaphthene (3) 5 8 4 Phenanthrene (3) 3 7 7 Pyrene (4) <1 <1 <1 Benz[a]anthracene (4) <1 <1 <1 Benzo[b and k]fluoranthene (5) <1 <1 <1 B(a)P (5) <1 <1 <1 Dibenz[a,h]anthracene (5) <1 <1 <1
Table 3: Median percentage of time-weighted average (TWA) concentrations of nine PAHs
determined in personal-breathing-zone samples (Ref 3).

17
Figure 6 summarizes various sources of information for the air emission calculations in the LCA of pavements.
PAVEMENT MAINTENANCE
MANUFACTURING OF PAVING MATERIALS
With Recycled
Aggregates
Without Recycled
Aggregates
EIO-LCA 1997
EIO-LCA 1997
Crushing Plant
(Turley 1998)
HMA Plant (EPA 2000)
EIO-LCA 1997
Crushing Plant
Truck Manufacturers
Landfilling Recycling
(BioCycle, Dec. 2001)
Means 1997 Means 1997
Means 1997
Industrial Engines (EPA
Heavy Duty Vehicles (EPA 1995)
Industrial Engines
(EPA 1996)
EIO-LCA 1997
HMA Plant (EPA 2000)
Means 1997
Industrial Engines
(EPA 1996)
Crushing Plant
(Turley 1998)
NIOSH
FIRE
END OF LIFE
Means 1997
Heavy Duty Vehicles
(EPA 1995)
Construction Equipment
Manufacturers
HMA Plant (EPA 2000)
NIOSH
FIRE
PAVEMENT CONSTRUCTION
Construction Equipment
Manufacturers
Industrial Engines (EPA
1996)
Truck Manufacturers
Heavy Duty Vehicles
(EPA 1995)
NIOSH
FIRE
Equipment Manufacturers
NIOSH
FIRE
NIOSH
FIRE
2.6 Modeling of Environmental Effects of Using Recycled Materials for Highway Applications
Aggregates constitute an important input into the production of pavements. About 95% by weight of
asphalt concrete (AC) are aggregates, whereas 87% of portland cement concrete (PCC) by weight
are aggregates [Wilburn 1998].
The use of reclaimed asphalt pavements (RAP) to substitute for virgin aggregates is a common
practice in the U.S., and over 200 million metric tons are generated annually [USGS 2000]. Still,
about 20% of all AC debris ends up in landfills and the rest is reused in AC pavements [Wilburn
1998]. PCC recycling is less typical and more than 50% of all debris is landfilled. Moreover, 85%
of all debris that is recycled is used as road base, with minor amounts used in AC and fill material,
which correspond to the initial use of the material [Wilburn 1998]. A survey indicated that the
annual amount of substitution of crushed cement concrete for construction aggregates (95 million
metric tons) is approximately 4.8% [Kelly 1998].
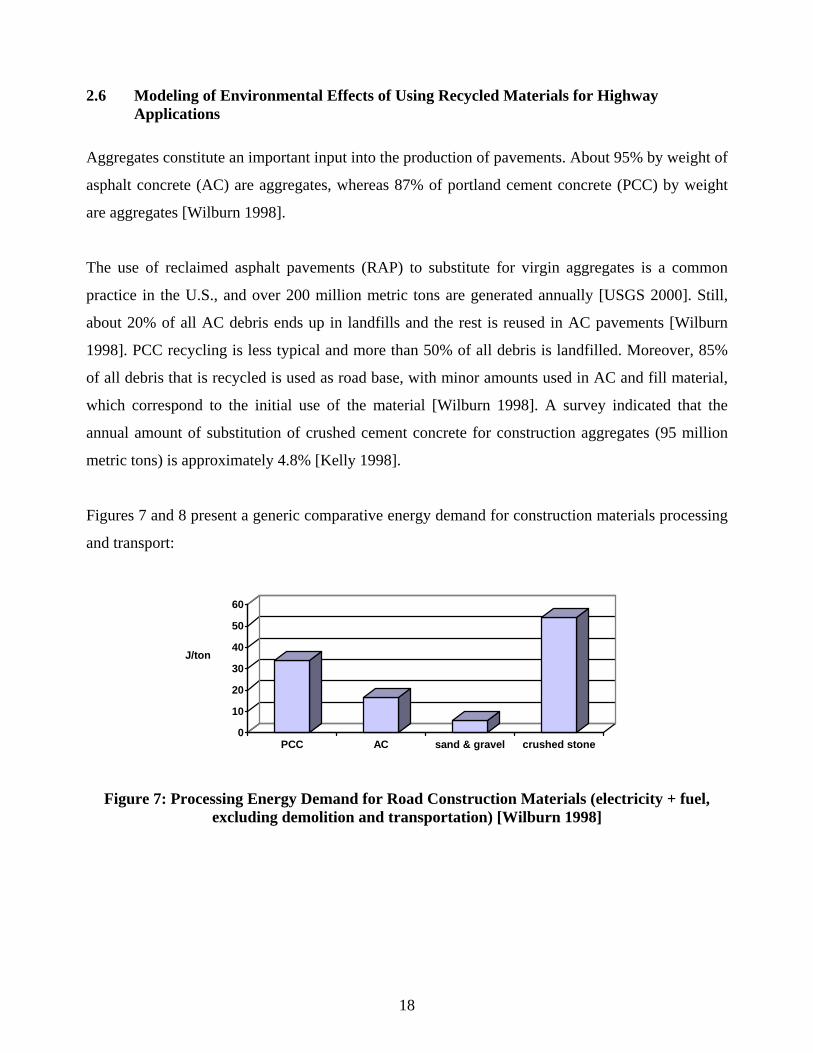
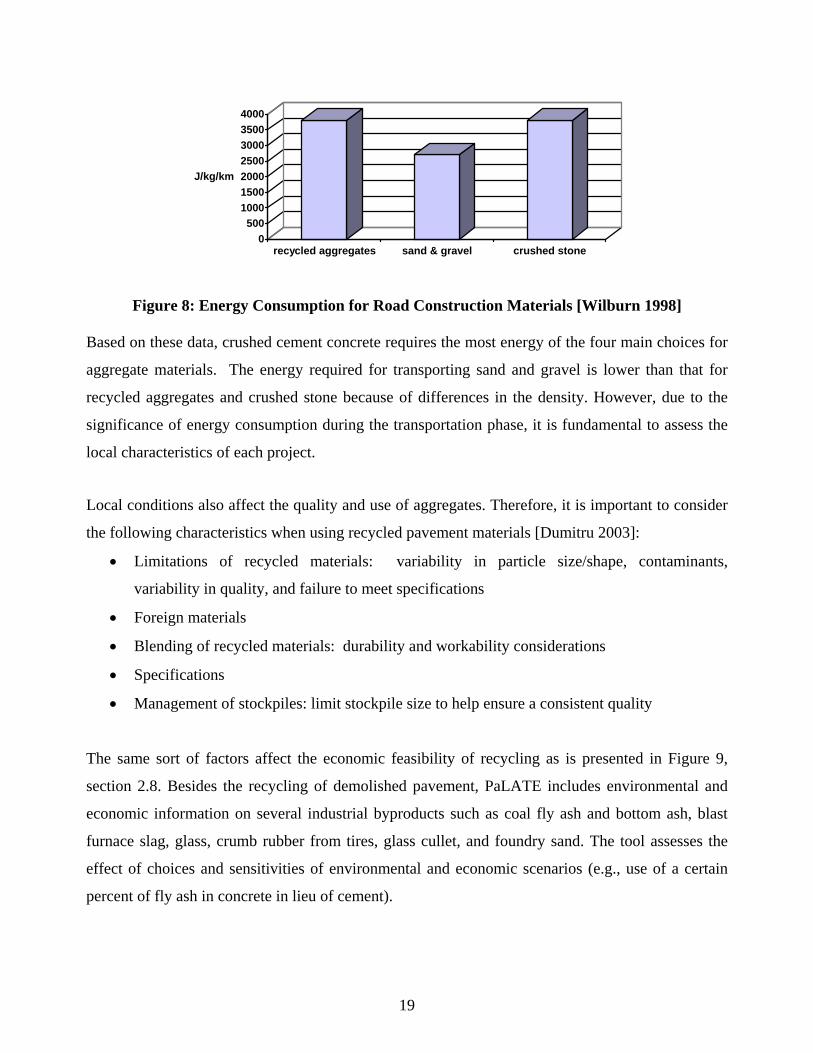
Figures 7 and 8 present a generic comparative energy demand for construction materials processing
and transport:
0
10
20
30
40
50
60
J/ton
PCC AC sand & gravel crushed stone
Figure 7: Processing Energy Demand for Road Construction Materials (electricity + fuel, excluding demolition and transportation) [Wilburn 1998]
18
0500
1000150020002500300035004000
J/kg/km
recycled aggregates sand & gravel crushed stone
Figure 8: Energy Consumption for Road Construction Materials [Wilburn 1998] Based on these data, crushed cement concrete requires the most energy of the four main choices for
aggregate materials. The energy required for transporting sand and gravel is lower than that for
recycled aggregates and crushed stone because of differences in the density. However, due to the
significance of energy consumption during the transportation phase, it is fundamental to assess the
local characteristics of each project.
Local conditions also affect the quality and use of aggregates. Therefore, it is important to consider
the following characteristics when using recycled pavement materials [Dumitru 2003]:
• Limitations of recycled materials: variability in particle size/shape, contaminants,
variability in quality, and failure to meet specifications
• Foreign materials
• Blending of recycled materials: durability and workability considerations
• Specifications
• Management of stockpiles: limit stockpile size to help ensure a consistent quality
The same sort of factors affect the economic feasibility of recycling as is presented in Figure 9,
section 2.8. Besides the recycling of demolished pavement, PaLATE includes environmental and
economic information on several industrial byproducts such as coal fly ash and bottom ash, blast
furnace slag, glass, crumb rubber from tires, glass cullet, and foundry sand. The tool assesses the
effect of choices and sensitivities of environmental and economic scenarios (e.g., use of a certain
percent of fly ash in concrete in lieu of cement).
19
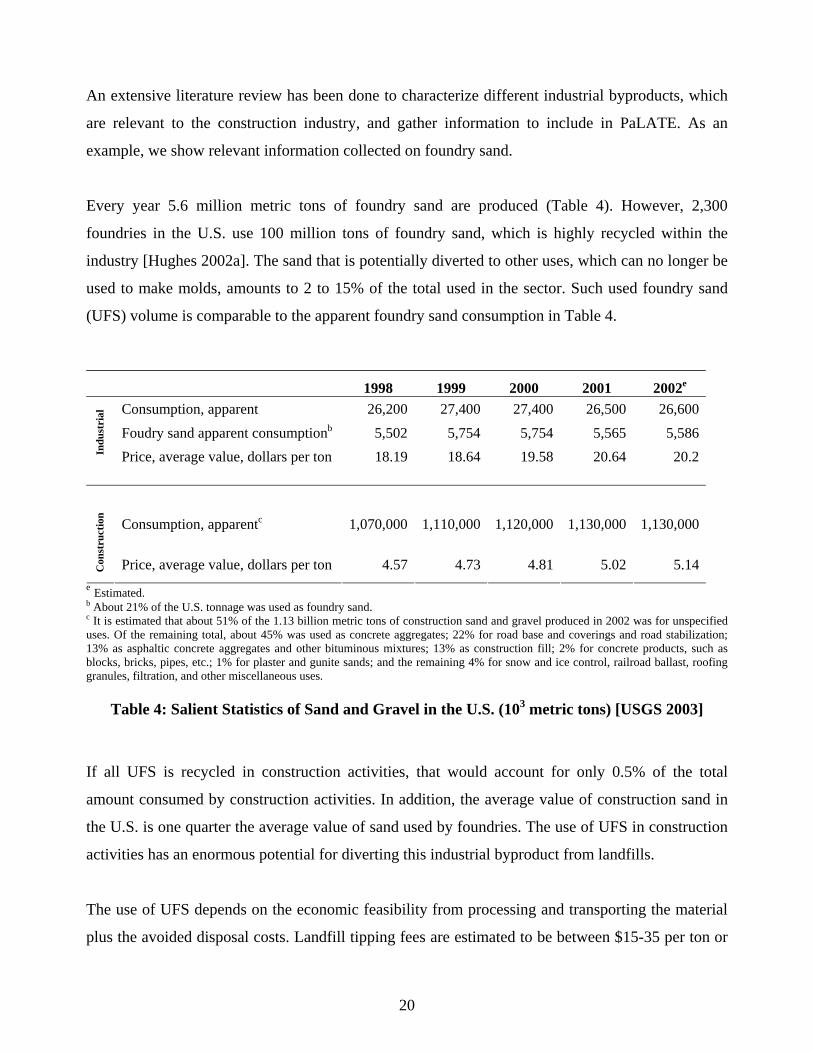
An extensive literature review has been done to characterize different industrial byproducts, which
are relevant to the construction industry, and gather information to include in PaLATE. As an
example, we show relevant information collected on foundry sand.
Every year 5.6 million metric tons of foundry sand are produced (Table 4). However, 2,300
foundries in the U.S. use 100 million tons of foundry sand, which is highly recycled within the
industry [Hughes 2002a]. The sand that is potentially diverted to other uses, which can no longer be
used to make molds, amounts to 2 to 15% of the total used in the sector. Such used foundry sand
(UFS) volume is comparable to the apparent foundry sand consumption in Table 4.
1998 1999 2000 2001 2002e
Consumption, apparent 26,200 27,400 27,400 26,500 26,600Foudry sand apparent consumptionb 5,502 5,754 5,754 5,565 5,586
Indu
stri
al
Price, average value, dollars per ton 18.19 18.64 19.58 20.64 20.2
Consumption, apparentc 1,070,000 1,110,000 1,120,000 1,130,000 1,130,000
Con
stru
ctio
n
Price, average value, dollars per ton 4.57 4.73 4.81 5.02 5.14e Estimated. b About 21% of the U.S. tonnage was used as foundry sand. c It is estimated that about 51% of the 1.13 billion metric tons of construction sand and gravel produced in 2002 was for unspecified uses. Of the remaining total, about 45% was used as concrete aggregates; 22% for road base and coverings and road stabilization; 13% as asphaltic concrete aggregates and other bituminous mixtures; 13% as construction fill; 2% for concrete products, such as blocks, bricks, pipes, etc.; 1% for plaster and gunite sands; and the remaining 4% for snow and ice control, railroad ballast, roofing granules, filtration, and other miscellaneous uses.
Table 4: Salient Statistics of Sand and Gravel in the U.S. (103 metric tons) [USGS 2003]
If all UFS is recycled in construction activities, that would account for only 0.5% of the total
amount consumed by construction activities. In addition, the average value of construction sand in
the U.S. is one quarter the average value of sand used by foundries. The use of UFS in construction
activities has an enormous potential for diverting this industrial byproduct from landfills.
The use of UFS depends on the economic feasibility from processing and transporting the material
plus the avoided disposal costs. Landfill tipping fees are estimated to be between $15-35 per ton or
20
even higher in urban areas (see Table 11, section 2.8). A foundry company in Tennessee pays $4
per ton for brokering its UFS, and the price of the material needs to be competitive with the cost of
traditional aggregates in the region [Hughes 2002b]. The average value of traditional aggregates in
the U.S. is $5.14 per ton (Table 4). A tight profit margin demands low hauling costs to make the use
of UFS competitive.
UFS can be used in road construction as filling material or as part of asphalt and concrete mixes.
The use of UFS as a substitute for virgin aggregates in hot mix asphalt (HMA) has been proven, and
states such as Pennsylvania, Michigan, and Tennessee allow such practice [Hughes 2002b].
Parameter ASTMa Sand 1 Sand 2 Sand 3
As received moisture content (%) C 566 0.39 0.19 0.25
Unit weight (kg/m3) R 29 1,840 1,730 1,784
Bulk specific gravity C 128 2.43 2.38 2.44
Bulk specific gravity, SSD C 128 2.47 2.50 2.57
Apparent specific gravity C 128 2.52 2.70 2.79
SSD absorption (%) C 128 1.00 4.90 5.00
Void (%) C 29 25.00 33.80 34.80
Fineness modulus C 136 3.57 2.33 2.32
Clay lumps and friable particles (%) C 136 0.20 0.10 0.40
Soundness of aggregates (%) C 88 10.00 10.50 54.90
Material finer than #200 (75 mm) sieve C 117 1.40 0.17 1.08 Note: Sand 1 = regular concrete sand; Sand 2 = clean foundry sand (FS1); Sand 3 = used foundry sand (FS2).
aAmerican Society for Testing and Materials (ASTM)
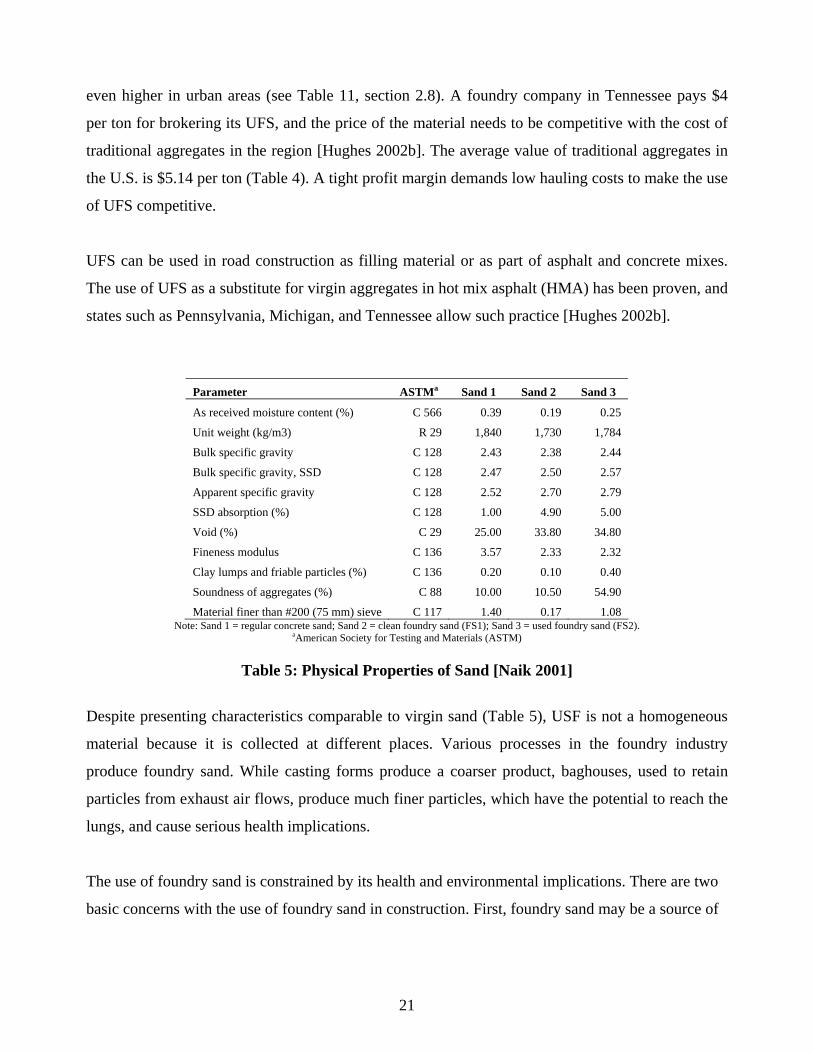
Table 5: Physical Properties of Sand [Naik 2001]
Despite presenting characteristics comparable to virgin sand (Table 5), USF is not a homogeneous
material because it is collected at different places. Various processes in the foundry industry
produce foundry sand. While casting forms produce a coarser product, baghouses, used to retain
particles from exhaust air flows, produce much finer particles, which have the potential to reach the
lungs, and cause serious health implications.
The use of foundry sand is constrained by its health and environmental implications. There are two
basic concerns with the use of foundry sand in construction. First, foundry sand may be a source of
21

air pollution [Afzal 2002]. Second foundry sand leacheates may contaminate watersheds with toxic
materials [Tikalsky 2001, Naik 2001, Morse 2003]. This information is included in PaLATE.
An assessment of worker exposure from pavements constructed using foundry sand was carried out
to check worker exposure to pollution. Because foundry sand is composed mainly of silica, there
were concerns that it would be a precursor for silicosis and lung cancer [Afzal 2002]. Even if a
preliminary health assessment was not conclusive, some management practices are recommended to
reduce worker exposure to UFS fine suspended particles:
• Implementing a standard calling for the elimination of baghouse residues in UFS • Wetting the material before its use, • Wetting the material after its application and compaction, • Using personal particles’ collection devices to check workers exposure.
In addition, recent studies have published results from analyses of leachate properties of foundry
sand. These studies are based on the Toxicity Characteristic Leaching Procedure (TCLP) used by
EPA to estimate the amount of compounds that would leach if the material is placed in the landfill.
Table 6 shows TCLP results for metals from 3 different references.
Parameter Naik 2001
Tikalsky 2001
Morse 2003
Aluminum (Al) 0.74 2.017 Antimony (Sb) 0.00698 Arsenic (As) 0.001 <.025 Barium (Ba) 0.053 0.161 <2 Beryllium (Be) 0.00114 Cadmium (Cd) 0.0002 BDL 0.00146 Chlorides (CI) 3 1.7 Chromium (Cr) 0.011 BDL 0.01187 Cobalt (Co) <0.1 Copper (Cu) BDL <0.2 Fluoride (F) 0.1 Iron (Fe) 0.93 0.3 Lead (Pb) 0.015 BDL 0.01523 Magnesium (Mg) 0.01 2.225 0.12 Manganese (Mn) 0.012 Mercury (Hg) <0.0002 BDL 0.0127 Molybdenum (Mo) BDL 0.06446 Nickel (Ni) BDL 0.38355 Selenium (Se) <0.001 BDL 0.1958 Silver (Ag) BDL <0.1 Sodium (Na) 7.84 <0.002 Sulfate (SO4) 5.2 <0.025 Vanadium (Va) BDL Zinc (Zn) 0.03 0.044 0.236
BDL: below detection level
Table 6: Comparison of Results of Different Leachate Analyses (mg/l).
22
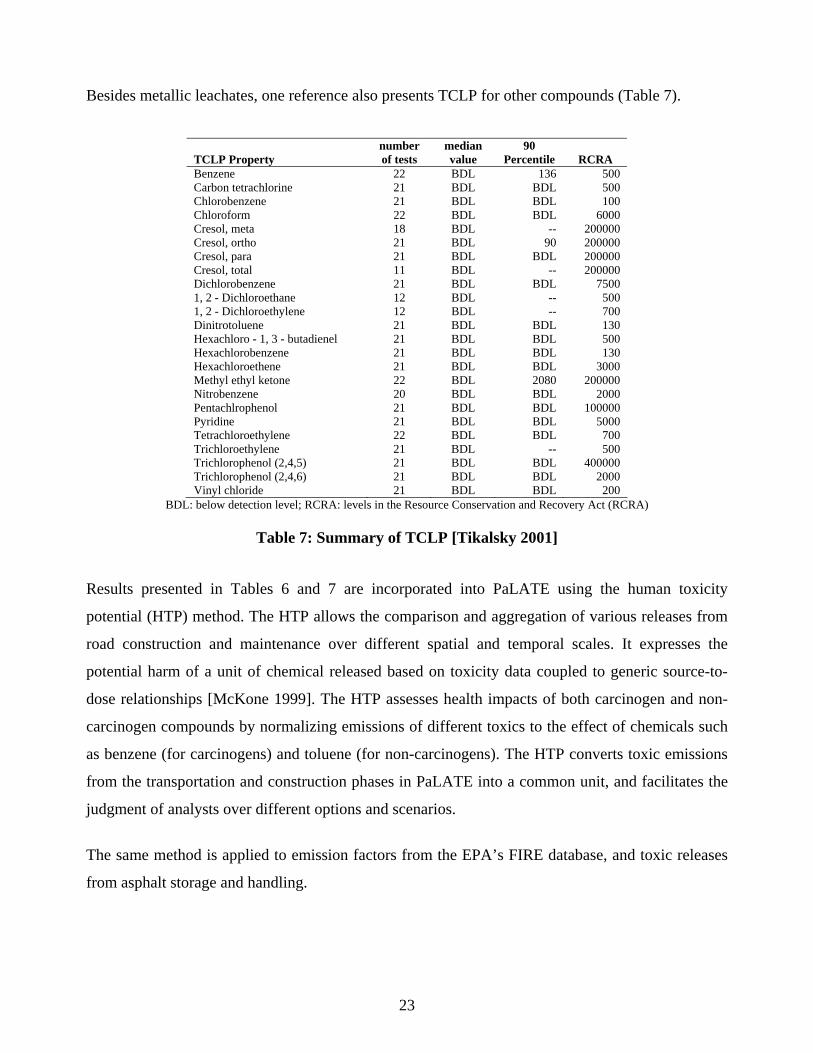
Besides metallic leachates, one reference also presents TCLP for other compounds (Table 7).
TCLP Property number of tests
median value
90 Percentile RCRA
Benzene 22 BDL 136 500 Carbon tetrachlorine 21 BDL BDL 500 Chlorobenzene 21 BDL BDL 100 Chloroform 22 BDL BDL 6000 Cresol, meta 18 BDL -- 200000 Cresol, ortho 21 BDL 90 200000 Cresol, para 21 BDL BDL 200000 Cresol, total 11 BDL -- 200000 Dichlorobenzene 21 BDL BDL 7500 1, 2 - Dichloroethane 12 BDL -- 500 1, 2 - Dichloroethylene 12 BDL -- 700 Dinitrotoluene 21 BDL BDL 130 Hexachloro - 1, 3 - butadienel 21 BDL BDL 500 Hexachlorobenzene 21 BDL BDL 130 Hexachloroethene 21 BDL BDL 3000 Methyl ethyl ketone 22 BDL 2080 200000 Nitrobenzene 20 BDL BDL 2000 Pentachlrophenol 21 BDL BDL 100000 Pyridine 21 BDL BDL 5000 Tetrachloroethylene 22 BDL BDL 700 Trichloroethylene 21 BDL -- 500 Trichlorophenol (2,4,5) 21 BDL BDL 400000 Trichlorophenol (2,4,6) 21 BDL BDL 2000 Vinyl chloride 21 BDL BDL 200
BDL: below detection level; RCRA: levels in the Resource Conservation and Recovery Act (RCRA)
Table 7: Summary of TCLP [Tikalsky 2001] Results presented in Tables 6 and 7 are incorporated into PaLATE using the human toxicity
potential (HTP) method. The HTP allows the comparison and aggregation of various releases from
road construction and maintenance over different spatial and temporal scales. It expresses the
potential harm of a unit of chemical released based on toxicity data coupled to generic source-to-
dose relationships [McKone 1999]. The HTP assesses health impacts of both carcinogen and non-
carcinogen compounds by normalizing emissions of different toxics to the effect of chemicals such
as benzene (for carcinogens) and toluene (for non-carcinogens). The HTP converts toxic emissions
from the transportation and construction phases in PaLATE into a common unit, and facilitates the
judgment of analysts over different options and scenarios.
The same method is applied to emission factors from the EPA’s FIRE database, and toxic releases
from asphalt storage and handling.
23

The environmental modules of PaLATE represent an original contribution to the assessment of road
construction projects. However, decision-making is mainly driven by economic appraisals. The next
section deals with economic analyses of pavements.
2.7 Modeling of Economic Costs of Using Traditional Highway Materials
We have studied the life-cycle costing (LCC) framework for pavements. Based on literature review,
we have found that LCC is still not the practice in every instance of decision-making about
pavements. Decisions about whether to build asphalt or concrete pavements, how often to maintain
them, and what maintenance technology to choose largely depend on first costs, experience of the
local agencies, and local climatic conditions. We have not found nationally applicable,
comprehensive, and robust models that would determine the life-cycle costs of using one pavement
material versus the other. However, there are efforts to formalize LCC. For example, a
comprehensive study has been published for Kansas [Cross 2002] that has described a regression-
based model utilizing more than 30 years worth of first and maintenance cost data. Figure 9 shows
that the model suggests somewhat higher costs for concrete pavements for the first 20 years of
projects, and significantly different and increasing costs after about 20 years of usage of concrete
pavements on the account of significantly higher maintenance needs than for asphalt pavements.
Naturally, experiences in other states and municipalities may be quite different.
Figure 9: Average expenditures per 4-lane mile for rural interstate pavements in Kansas [Cross 2002].
24
PaLATE includes an LCC module. LCC frameworks for pavements combine the cost of the
infrastructure, its maintenance, and salvage value (agency costs) with the cost of traffic delays,
damage to vehicles, accidents, etc. (user cost). PaLATE has a module that calculates the net present
value (NPV) of two pavement construction and maintenance alternatives and allows a comparison
between two different discount rates. Because the periods selected by the analyst may differ,
PaLATE also calculates the annualized cost for each of the alternatives.
The LCC framework integrated in PaLATE follows the recommendations of the Technical Bulletin
of the Federal Highway Administration (Publication No. FHWA-SA-98-079). PaLATE suggests
values surveyed in the literature for several items in the cost module (Tables 8, 9). Nevertheless, it
encourages user inputs such as:
• Installed Asphalt Paving Cost
• Installed Concrete Paving Cost
• Installed Subbase & Embankment Construction Cost
• Hot in place recycling (HIPR) Cost
• Cold in place recycling (CIR) Cost
• Patching Cost
• Microsurfacing Cost
• Crack Sealing Cost
• Whitetopping Cost
• Rubblization Cost
• Full-depth Reclamation Cost
25

Table 8: Cost Breakdown of Different Layers in a Roadway [Wilburn 1998]
Type of Natural Resource (Average Price
in 1997)
Application Used for
Amount Utilized (million tons in
1997)
% of Use of Total Annual Production
Asphaltic concrete
4.08 5% Crushed and broken limestone and Dolomite ($4.16/ton) Road construction/
Resurfacing 28.68 37%
Asphaltic concrete 4.14 14% Sand ($4.26/ton) Road construction/
resurfacing 7.34 25%
Asphaltic concrete 3.00 10% Gravel ($4.26/ton) Road construction/
Resurfacing 10.06 35%
Aggregate 0.32 13% Crushed Sandstone ($14.50/ton) Construction 0.24 10% Clay ($5.74/ton)
Construction
0.05 3%
Lightweight Aggregate
0.24 8% Shale ($1.82/ton) Construction 0.03 1%
Table 9 Comparative Construction Costs in Ohio [Butalia 2003]
26
The literature search has convinced us that LCC is also a very important measure in the
environmental characterization of pavements. For example, costs of maintenance may far outweigh
the initial material and construction costs of pavements, especially for “perpetual pavements” where
continuous maintenance is essential in extending the life-cycle of pavements.
2.8 Modeling of economic costs of using recycled materials for highway applications
The costs of recycling are not very clear in the literature, and usually some generic figures are
available without detailed information about local conditions and the equipment used.
Entry into the aggregates recycling business requires a capital investment of $4 to $8 per metric ton
of annual capacity. Processing costs for the aggregates recycler range from about $2.50 to $6 per
metric ton [Wilburn 1998]. This average range fluctuates, and processing costs for aggregate
recyclers range from $2.76 to $6.61 per metric ton [USGS 2000]. The average production capacity
for a fixed site recycling operation is about 150,000 mt per year, and economies of scale affect its
costs.
In Denver, the average price of recycled aggregates (ratio 60:40 asphalt – cement concrete) in 1996
was $5.23/ton [Wilburn 1998]. Transportation accounted for $0.13/ton/km, based on an average for
1995. Table 8 shows the cost breakdown of different layers in a roadway [Wilburn 1998]. Note the
large percentage attributed to the cost of transportation.
Cold in-place recycling can be cheaper than more traditional rehabilitation methods. Table 10
shows the life cycle cost for CIPR [Murphy 2003].
27
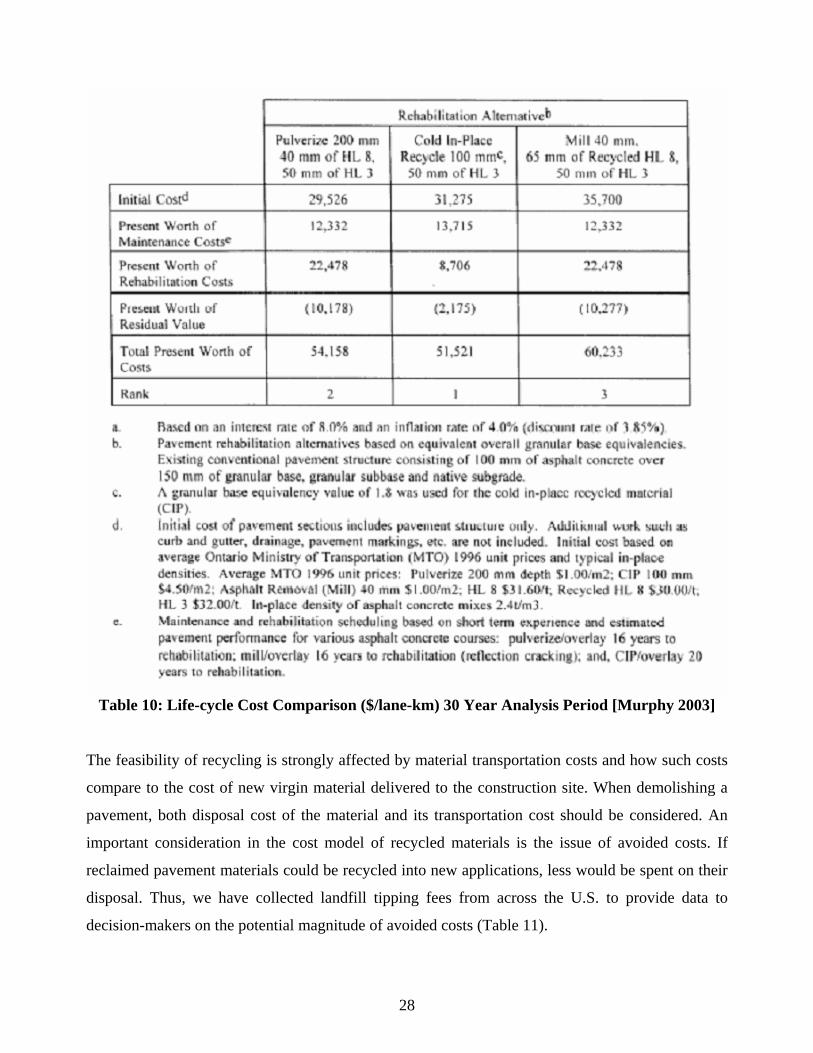
Table 10: Life-cycle Cost Comparison ($/lane-km) 30 Year Analysis Period [Murphy 2003]
The feasibility of recycling is strongly affected by material transportation costs and how such costs
compare to the cost of new virgin material delivered to the construction site. When demolishing a
pavement, both disposal cost of the material and its transportation cost should be considered. An
important consideration in the cost model of recycled materials is the issue of avoided costs. If
reclaimed pavement materials could be recycled into new applications, less would be spent on their
disposal. Thus, we have collected landfill tipping fees from across the U.S. to provide data to
decision-makers on the potential magnitude of avoided costs (Table 11).
28

State Number Average Tip Fee ($/ton)
Remaining Capacity (years)
Alabama 29 30 10Alaska 275 0-100Arizona 49 26.11Arkansas 23 30California 175 35.14 18Colorado 70 11Connecticut 2 3Delaware 3 58.5 30District of Columbia 0Florida 61 42.85Georgia 69 29.18 23.5Hawaii 9 50 1-15Idaho 29Illinois 52 30.68 15Indiana 36 29.92 13.5Iowa 61 33 60Kansas 51 20+Kentucky 26 27.24 15.2Louisiana 23 22.85Maine 8 65 12-15Maryland 23 49 >10Massachusetts 21 67 <2Michigan 54 15Minnesota 22 40 7Mississippi 20 25 20Missouri 25 29.53 9Montana Nebraska 23 25Nevada 24 18 >50New Hampshire 15 66 8New Jersey 12 55 12New Mexico 44 32 20New York 27 7North Carolina 42 31North Dakota 14 25 20Ohio 44 29 22Oklahoma 40 20 20Oregon 29 25 40Pennsylvania 49 12Rhode Island 4 40 10South Carolina 19 >13South Dakota 15 31 25-30Tennessee 48 28.76Texas 227 25.46 32Utah 37 100Vermont 5 75 6.3Virginia 67 20Washington 21 49.79 51West Virginia 18 42.37 30Wisconsin 44 38 5Wyoming 58Total 2,142
Table 11: Municipal solid waste landfills by state, average tipping fee, and remaining capacity
(BioCycle, Dec. 2001).
PaLATE suggests average landfill tipping fees for all U.S. states to give an idea of the costs arising
from the disposal of demolished material. The total disposal cost is compared to the cost of
demolishing and transporting the material to a recycling facility where after some handling and
29

processing the material is ready to substitute for virgin materials. It is evident that the cost of
recycled materials needs to be competitive with the cost of virgin materials.
Not only disposal costs but the objective and the technology used affect the economic performance
of aggregates recycling. For example, reclaimed asphalt pavement (RAP) is processed differently
depending on the type of facility and what the recycled aggregate will be used for. The following
describes various recycling methods applied to road construction and maintenance [Chesner 2001]:
• Hot Mix Asphalt (Central Processing Facility): Crushers, screeners, conveyors, and stackers produce and stockpile RAP. The RAP is later transported to a batch plant or drum-mix plant for use as an aggregate substitute in hot mix asphalt.
• Hot Mix Asphalt (In-Place Recycling): Specialized heating, scarifying, rejuvenating, laydown, and compaction equipment is used in one or more passes. No processing is required before recycling begins. One pass can remix up to 2 inches of existing pavement.
• Cold Mix Asphalt (Central Processing Facility): Same as for hot mix RAP processing except the RAP is used in an aggregate substitute in cold mix asphalt.
• Cold Mix Asphalt (In-Place Recycling): Specialized plants or processing trains are used to mill the existing pavement surface up to 6 inches, mix with asphalt emulsion (or foamed asphalt), and place and compact in one pass. As with HIPR, no processing is required before recycling begins.
• Granular Base Aggregate: RAP is crushed, screened, and blended with virgin granular aggregate or reclaimed concrete material (RCM).
• Stabilized Base or Subbase Aggregate: RAP is crushed, screened, and blended with stabilization reagents (for increased strength when compacted).
• Embankment or Fill: RAP is rarely used for embankment or fill unless the stockpiled material has been stockpiled for a long time and would otherwise be disposed of in a landfill.
• Full Depth Reclamation (FDR): FDR penetrates the entire flexible pavement section and a predetermined portion of the base material, uniformly pulverizing and blending them together to produce a stabilized base course, and can correct deficiencies in the base as well as the bound asphalt layers [Landers 2001].
• Rubblization: This maintenance technique breaks concrete pavement into pieces and then overlays the road with Hot Mix Asphalt. The concrete is broken into pieces ranging from 2 to 6 inches by either a multiple head breaker or a resonant breaker. The former piece of equipment uses large hammers to strike the pavement surface, while the latter piece of equipment uses vibratory hammers to break up the pavement. Rollers are used to further break up the concrete, and then an asphalt overlay is placed. The process is relatively quick (up to one mile per day), and costs less than some other options. Environmental savings occur because the concrete is not landfilled and transportation during construction is less [APA 2003].
30
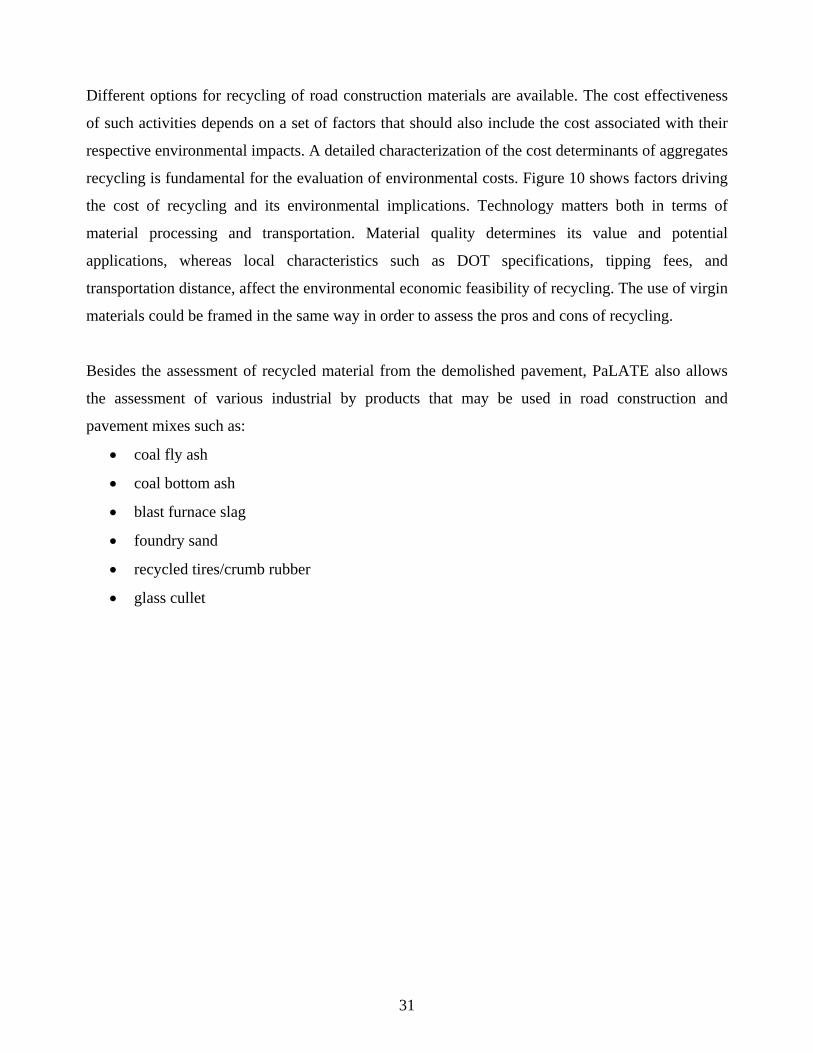
Different options for recycling of road construction materials are available. The cost effectiveness
of such activities depends on a set of factors that should also include the cost associated with their
respective environmental impacts. A detailed characterization of the cost determinants of aggregates
recycling is fundamental for the evaluation of environmental costs. Figure 10 shows factors driving
the cost of recycling and its environmental implications. Technology matters both in terms of
material processing and transportation. Material quality determines its value and potential
applications, whereas local characteristics such as DOT specifications, tipping fees, and
transportation distance, affect the environmental economic feasibility of recycling. The use of virgin
materials could be framed in the same way in order to assess the pros and cons of recycling.
Besides the assessment of recycled material from the demolished pavement, PaLATE also allows
the assessment of various industrial by products that may be used in road construction and
pavement mixes such as:
• coal fly ash
• coal bottom ash
• blast furnace slag
• foundry sand
• recycled tires/crumb rubber
• glass cullet
31

Figure 10: Environmental Cost Determinants for Aggregates Recycling
Jaw cone combination
Environmental
cost determinants
Transportation
Technology
Quality
Application
Local specifications
Base vs. pavement
Mode
Stockpiling
Contamination
Trip distance
Jaw roll combination Off site
On site
Horizontal-shaft impactor
Cold milling
Hot recycling
Full depth reclamation
Truck
Barges & ships
Rail
Uniform size & shape
Uniform moisture
Coarse vs. fine fractions
Blending properties
Rubblization
Disposal cost Tipping fee
Trip distance
Enbankment vs. fill
32

We have found that costs of recycled materials for highway applications vary greatly depending on
the type of material and the location. For example, asphalt materials generally are in demand due to
state requirements to include a certain percentage of RAP in new asphalt pavement materials.
Conversely, while there is some demand for recycled concrete, it is generally lower than for asphalt,
and most of the recycled concrete ends up in landfills. Of the alternative materials, coal fly ash is in
increasing demand, and its costs have increased substantially over the last few years due to
increased demand for fly ash by agencies that are required to substitute a percentage of fly ash for
cement in concrete.
It is possible that the value of recycled materials increases in the future as local aggregate shortages
are observed. For example, Table 12 shows the annual use rate of construction sand and gravel for
several states compared to the national average (sand and gravel use from [Bolen 2000], population
figures from [USCB 2001]). States such as Texas, California, Oregon, Michigan, Arizona, and
Nevada use substantially more aggregates per capita than the national average and local shortages
and increased procurement costs in California and Texas have been reported to us in personal
communications.
Location
(1)
Use rate (tons/person-year)
(2) U.S. 4.0
Texas 3.9 California 4.4
Oregon 4.8 Michigan 7.6 Arizona 11.5 Nevada 18.2
Table 12: Annual use rate of construction sand and gravel for several states compared to the
national average (sand and gravel use from [Bolen 2000], population figures from [USCB
2001])
The challenging part was the quantification and inclusion of recycled materials into PaLATE. How
much environmental “credit” should be given to recycled materials? Where should these credits be
counted? How should transportation be counted in the model, and which life-cycle stage should it
33

be assigned to? These were important and relevant questions for our work in order to generate
realistic, robust and scalable models.
Environmental credit is given to recycled asphalt and pavement materials through the effects of
their substituting for virgin material production by offsetting virgin material production by the
amount of recycled materials used. The “life” of recycled pavement materials starts at breaking up
the old pavement, followed by transportation to a depository place or asphalt/concrete plant,
crushing, mixing of new pavement material, and transportation to the site of the new pavement.
3. Literature Cited [Afzal 2002] Afzal, W. Jacko, R.B. (2002) “Worker Exposure To Airborne Contaminates When
Using Waste Foundry Sand In The Construction Of Road Embankments” Technical Report FHWA/IN/JTRP-2002/3. Purdue University/Indiana Dept of Transp West Lafayette, IN; Federal Highway Administration Washington, DC.
[APA 2003] Asphalt Pavement Alliance (2003a), “Rubblization-Asphalt’s Answer to Deteriorated Concrete Pavements: Questions and Answers” http://www.AsphaltAlliance.com, (accessed March 16, 2003).
[Braham 2001] Braham, A. Delage, K. and Bahia, H. (2001) “Performance Testing of Hot Mix Asphalt Produced with Recycled Foundry Sand” Beneficial Use of Recycled Materials in Transportation Applications Conference. http://www.rmrc.unh.edu/Presentations/2001Conference/bahia/bahia.htm (accessed 1/12/2004).
[Butalia 2003] Butalia, T.S. and Wolfe, W.E. (2003), “Utilization of Coal Combustion Products in Ohio for Construction and Repair of Highways,” Beneficial Use of Recycled Materials in Transportation Applications, November 13-15, 2001, sponsored by the Recycled Materials Resource Center, University of New Hampshire, Durham, New Hampshire, and the Air & Waste Management Association, published 2003.
[Chesner 2001] Chesner, W.H., Collins, R. J., MacKay, M.H. (2001c) “Reclaimed Asphalt Pavement,” Recycled Materials Resource Center, Publication FHWA-RO-97-148
[Dumitru 2003] Dumitru, I. And Walter, P. (2003) “The Use of Recycled Construction Materials in the Manufacture of Road Building Materials,” Beneficial Use of Recycled Materials in Transportation Applications, November 13-15, 2001, sponsored by the Recycled Materials Resource Center, University of New Hampshire, Durham, New Hampshire, and the Air & Waste Management Association, published 2003.
[EPA 2000] Hot Mix Asphalt Plants - Emission Assessment Report (EPA 454/R-00-019). Final report dated December 2000. Report body. Posting date: 12-22-00 http://www.epa.gov/ttn/emc/asphalt/ea-report.pdf
34
[Hendrickson 1998] Hendrickson, C., Horvath, A., Joshi, S., and L. Lave. Economic Input-Output Models for Environmental Life-Cycle Assessment. Environmental Science & Technology, ACS, April 1, 1998, pp. 184-191.
[Hughes 2002a] Hughes, C (2002a) Recycled Foundry Sand: Sources and Properties. Hot Mix Asphalt Technology, June 2002.
[Hughes 2002b] Hughes, C. (2002b) Recycled Foundry Sand in the Mix Hot Mix Asphalt Technology sept./oct. 2002.
[Kelly 1998] Kelly, T.D., 1998, The substitution of crushed cement concrete for construction aggregates: U.S. Geological Survey Circular 1177, 15 p. Available only online at URL http://greenwood.cr.usgs.gov/pub/circulars/c1177/
[Landers 2001] Landers, K., Stidger, R.W., Clines, K.L. in cooperation with the Asphalt Recycling and Reclaiming Association (2001) “What is Full-Depth Reclamation?” Better Roads, July 2001.
[McKone 1999] McKone TE and Hertwich EG. “The Human Toxicity Potential and a Strategy for Evaluating Model Performance in Life Cycle Impact Assessment.” International J. of Life Cycle Assessment. 6(2) 106-109.
[Means 1997] Means Building Construction Cost Data 1998, R.S. Means Co., Kingston, Mass., 1997.
[Morse 2003] Morse, A. Nash, P. Davio, R. A (2003) Review of Several States’ Environmental Policies for Using Traditional or Recycled Materials in Roadway Construction and Environmental Characteristics of Traditional Materials Used in Texas
[Murphy 2003] Murphy, D. and Emery, J., “Evaluation of Modified Cold In-Place Asphalt Recycling,” (accessed from http://www.msoconstructionusa.com/library.html on 3/16/2003)
[Naik 2001] Naik, T.R. Singh, S.S. Ramme, B.W. (2001) Performance And Leaching Assessment Of Flowable Slurry. Journal of Environmental Engineering. April 2001.
[Pacca 2002] Pacca, S., and A. Horvath. Greenhouse Gas Emissions from Building and Operating Electric Power Plants in the Upper Colorado River Basin. Environmental Science and Technology, ACS, 36(14), July 15, 2002, pp. 3194-3200.
[Tikalsky 2001] Tikalsky, P.J. (2001) “Summary of the Current State of Knowledge on the Toxicity of Foundry Sand” Beneficial Use of Recycled Materials in Transportation Applications Conference. http://www.rmrc.unh.edu/Presentations/2001Conference/tikalsky/tikalsky.htm (accessed 1/12/2004).
[USGS 2000] USGS (2000), “USGS: Recycled Aggregates—Profitable Resource Conservation” USGS Fact Sheet FS-181-99, February 2000.
[USGS 2003] U.S. Geological Survey. Open-File Report 01-006. “Historical Statistics for Mineral and Material Commodities in the United States”. Version 6.9. http://minerals.usgs.gov/minerals/pubs/of01-006/ (accessed 1/12/2004).
[Wilburn 1998] Wilburn, D.R., and Goonan, T.G., 1998, Aggregates from natural and recycled sources: U.S. Geological Survey circular 1176, 36 p. http://greenwood.cr.usgs.gov/pub/circulars/c1176/, accessed 3/16/2003
35