a joint report of the registrar general of india and the … general of india and the centre for...
TRANSCRIPT

A Joint Report of the
Registrar General of India
and the
Centre for Global Health Research

CAUSES OF DEATH STATISTICS 2010-2013

Sample ParticularsTable 1 Number of Sample Units & Population Covered under SRS: India, States and Union Territories 2005
Table 2Distribution of Deaths by EAG States & Assam and Other States by Age Group: Comparison of Percentage of Deaths in Verbal autopsy (2010 -2013) and Sample Registration System (SRS-2010 -2013)
Overall Causes of Death DistributionTable 1.3A Distribution of Deaths in India : 2010 -2013 PersonTable 1.3B Distribution of Deaths in India : 2010 -2013 MaleTable 1.3C Distribution of Deaths in India : 2010 -2013 Female
Major Cause GroupsTable 2.1A Distribution Of Deaths by Major Cause Groups in India 2010 -2013Table 2.1 B Distribution Of Deaths by Major Cause Groups in EAG States & Assam and Other States : 2010 -2013Table 2.1 C Distribution Of Deaths by Major Cause Groups in Rural and Urban Areas : 2010 -2013
Deaths by age and genderTable 2.2A Distribution Of Deaths by age and gender in India :2010 -2013Table 2.2B Distribution Of Deaths by age and gender in EAG States & Assam and Other States : 2010 -2013Table 2.2C Distribution Of Deaths by age and gender in Rural and Urban Areas : 2010 -2013
Top 10 causes All agesTable 2.3A Top 10 Causes of Death (all ages) in India: 2010 -2013Table 2.3B Top 10 Causes of Death (all ages) in EAG States & Assam and Other States : 2010 -2013Table 2.3C Top 10 Causes of Death (all ages) in Rural & Urban Areas : 2010 -2013
Age <29 daysTable 3.1 A Top 10 Causes of Death in age below 29 days in India : 2010 -2013Table 3.1B Top 10 Causes of Death in age below 29 days in EAG States & Assam and Other States: 2010 -2013Table 3.1C Top 10 Causes of Death in age below 29 days in Rural and Urban Areas : 2010 -2013
Age below 1 yearTable 3.2A Top 10 Causes of Death in age below 1 year in India : 2010 -2013Table 3.2B Top 10 Causes of Death in age below 1 year in EAG States & Assam and Other States: 2010 -2013Table 3.2C Top 10 Causes of Death in age below 1 year in Rural and Urban Areas : 2010 -2013
Age 1-4 yearsTable 3.3A Top 10 Causes of Death in age 1- 4year : in India 2010 -2013Table 3.3B Top 10 Causes of Death in age 1- 4year in EAG States & Assam And Other States : 2010 -2013 Table 3.3C Top 10 Causes of Death in age 1- 4year in Rural & Urban Areas : 2010 -2013
Age 0-4 yearsTable 3.4A Top 10 Causes of Death in age 0 to 4 years in India : 2010 -2013Table 3.4B Top 10 Causes of Death in age 0 to 4 years in EAG States & Assam And Other States : 2010 -2013 Table 3.4C Top 10 Causes of Death in age 0 to 4 years in Rural & Urban Areas : 2010 -2013
LIST OF TABLES
Table Description

Age 5-14 yearsTable 3.5A Top 10 Causes of Death in age 5-14 years in India : 2010 -2013Table 3.5B Top 10 Causes of Death in age 5-14 years in EAG States & Assam And Other States : 2010 -2013 Table 3.5C Top 10 Causes of Death in age 5-14 years in Rural & Urban Areas : 2010 -2013
Age 15- 29 yearsTable 3.6A Top 10 Causes of Death in age 15-29 years in India : 2010 -2013Table 3.6B Top 10 Causes of Death in age 15-29 years in EAG States & Assam And Other States : 2010 -2013 Table 3.6C Top 10 Causes of Death in age 15-29 years in Rural & Urban Areas : 2010 -2013
Age 30-69 yearsTable 3.7A Top 10 Causes of Death in age 30-69 years in India : 2010 -2013Table 3.7B Top 10 Causes of Death in age 30-69 years in EAG States & Assam And Other States : 2010 -2013 Table 3.7C Top 10 Causes of Death in age 30-69 years in Rural & Urban Areas : 2010 -2013
Age 70+ yearsTable 3.8A Top 10 Causes of Death in age 70 years and over adults in India : 2010 -2013Table 3.8B Top 10 Causes of Death in age 70 years and over adults in EAG States & Assam And Other States : 2010 -2013 Table 3.8C Top 10 Causes of Death in age 70 years and over adults in Rural & Urban Areas : 2010 -2013
Mortality from Special ConditionsTable 4.1 Proportion of Deaths from Specific medical causes in India : 2010 -2013Table 4.2 Proportion of Deaths from Specific medical causes in EAG States & Assam And Other States : 2010 -2013 Table 4.3 Proportion of Deaths from Specific medical causes in Rural & Urban Areas : 2010 -2013
Top 10 causes All ages- Major Regions
Table 5.1 ATop 10 Causes of Death (All Ages): 2010 -2013;Major Region- North : (Chandigarh,Delhi,Haryana,Himachal Pradesh, Jammu & Kashmir, Punjab and uttarakhand)
Table 5.1 BTop 10 Causes of Death (All Ages): 2010 -2013; Major Region- North East : (Arunachal Pradesh,Assam,Manipur,Meghalaya, Mizoram,Nagaland,Sikkim and Tripura)
Table 5.1 C Top 10 Causes of Death (All Ages): 2010 -2013; Major Region- East : (Bihar, Jharkhand,Orissa and West Bengal)
Table 5.1 D Top 10 Causes of Death (All Ages as %): 2010 -2013; Major Region- Central : (Chattisgarh,Madhya Pradesh,Rajasthan and Uttar Pradesh)
Table 5.1 ETop 10 Causes of Death (All Ages as %): 2010 -2013; Major Region- West : (Dadra & Nagar Haveli,Daman & Diu, Goa, Gujarat and Maharashtra)
Table 5.1 FTop 10 Causes of Death (All Ages): 2010 -2013; Major Region- South : (Andhra Pradesh,Andaman & Nicobar Islands,Karnataka,Kerala,Lakshadweep,Puducherry and Tamil Nadu)
Top 10 causes All ages-Major Regions
Table 5.2ADistribution of Deaths by Age and Gender, 2010 -2013; Major Region- North : (Chandigarh,Delhi,Haryana,Himachal Pradesh, Jammu & Kashmir, Punjab and uttarakhand)
Table 5.2BDistribution of Deaths by Age and Gender, 2010 -2013; Major Region- North East : (Arunachal Pradesh,Assam,Manipur,Meghalaya, Mizoram,Nagaland,Sikkim and Tripura)
Table 5.2C Distribution of Deaths by Age and Gender, 2010 -2013; Major Region- East : (Bihar, Jharkhand,Orissa and West Bengal)
Table 5.2D Distribution of Deaths by Age and Gender, 2010 -2013; Major Region- Central : (Chattisgarh,Madhya Pradesh,Rajasthan and Uttar Pradesh)
Table 5.2EDistribution of Deaths by Age and Gender, 2010 -2013; Major Region- West : (Dadra & nagar Haveli,Daman & Diu, Goa, Gujarat and Maharashtra)
Table 5.2FDistribution of Deaths by Age and Gender, 2010 -2013; Major Region- South : (Andhra Pradesh,Andaman & Nicobar Islands,Karnataka,Kerala,Lakshadweep,Puducherry and Tamil Nadu)
AnnexuresAnnexure 1 Classification List 2Annexure 2 Classification List 3Annexure 3 Classification List 1
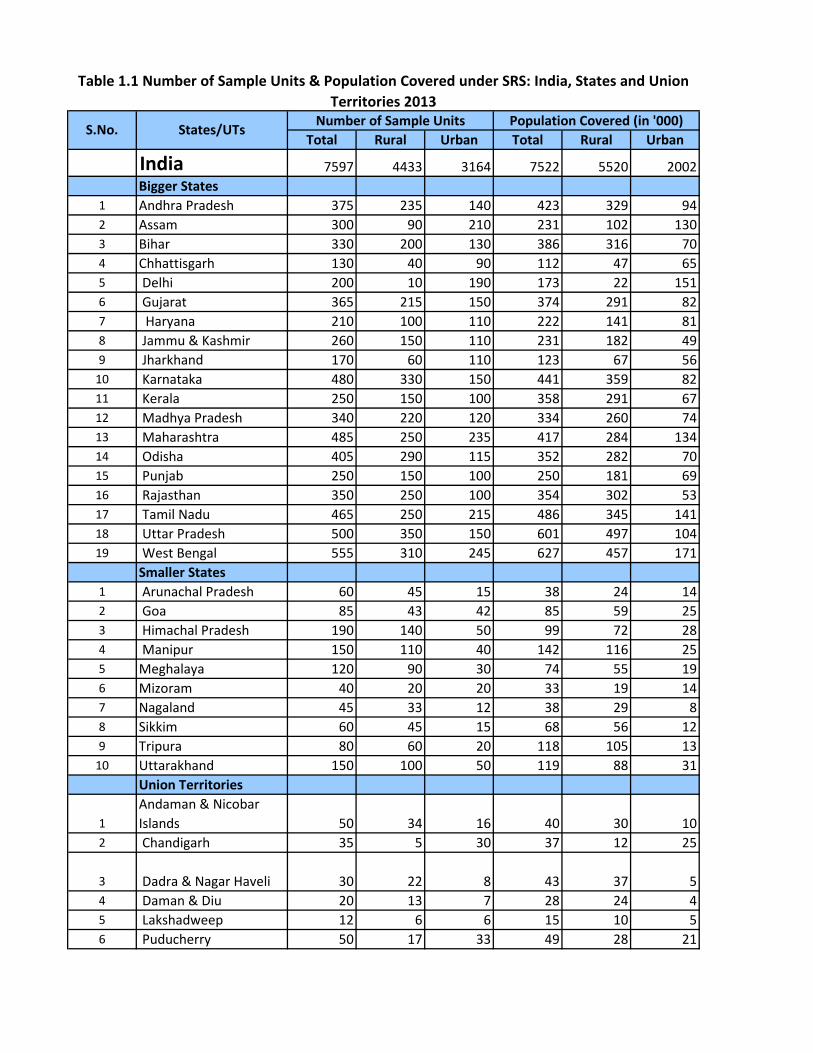
Total Rural Urban Total Rural Urban
India 7597 4433 3164 7522 5520 2002Bigger States
1 Andhra Pradesh 375 235 140 423 329 942 Assam 300 90 210 231 102 1303 Bihar 330 200 130 386 316 704 Chhattisgarh 130 40 90 112 47 655 Delhi 200 10 190 173 22 1516 Gujarat 365 215 150 374 291 827 Haryana 210 100 110 222 141 818 Jammu & Kashmir 260 150 110 231 182 499 Jharkhand 170 60 110 123 67 56
10 Karnataka 480 330 150 441 359 8211 Kerala 250 150 100 358 291 6712 Madhya Pradesh 340 220 120 334 260 7413 Maharashtra 485 250 235 417 284 13414 Odisha 405 290 115 352 282 7015 Punjab 250 150 100 250 181 6916 Rajasthan 350 250 100 354 302 5317 Tamil Nadu 465 250 215 486 345 14118 Uttar Pradesh 500 350 150 601 497 10419 West Bengal 555 310 245 627 457 171
Smaller States1 Arunachal Pradesh 60 45 15 38 24 142 Goa 85 43 42 85 59 253 Himachal Pradesh 190 140 50 99 72 284 Manipur 150 110 40 142 116 255 Meghalaya 120 90 30 74 55 196 Mizoram 40 20 20 33 19 147 Nagaland 45 33 12 38 29 88 Sikkim 60 45 15 68 56 129 Tripura 80 60 20 118 105 13
10 Uttarakhand 150 100 50 119 88 31Union Territories
1Andaman & Nicobar Islands 50 34 16 40 30 10
2 Chandigarh 35 5 30 37 12 25
3 Dadra & Nagar Haveli 30 22 8 43 37 54 Daman & Diu 20 13 7 28 24 45 Lakshadweep 12 6 6 15 10 56 Puducherry 50 17 33 49 28 21
Table 1.1 Number of Sample Units & Population Covered under SRS: India, States and Union Territories 2013
S.No. States/UTs Number of Sample Units Population Covered (in '000)

SRS VA SRS VA0-4 20.1 19.3 9.3 8.7
5-14 2.9 2.9 1.4 1.315-29 7.1 7.4 6.1 6.130-34 2.5 2.5 2.5 2.635-44 6.0 6.1 6.8 6.845-54 8.3 8.3 10.0 10.255-69 22.8 22.4 26.0 26.170+ 30.3 31.0 37.9 38.3
Table 1.2 : Distribution of Deaths by EAG States & Assam and Other States by Age Group: Comparison of Percentage of Deaths in
Verbal autopsy (2010-2013) and Sample Registration System (SRS-2010-2013)
Age Group EAG States & Assam Other States
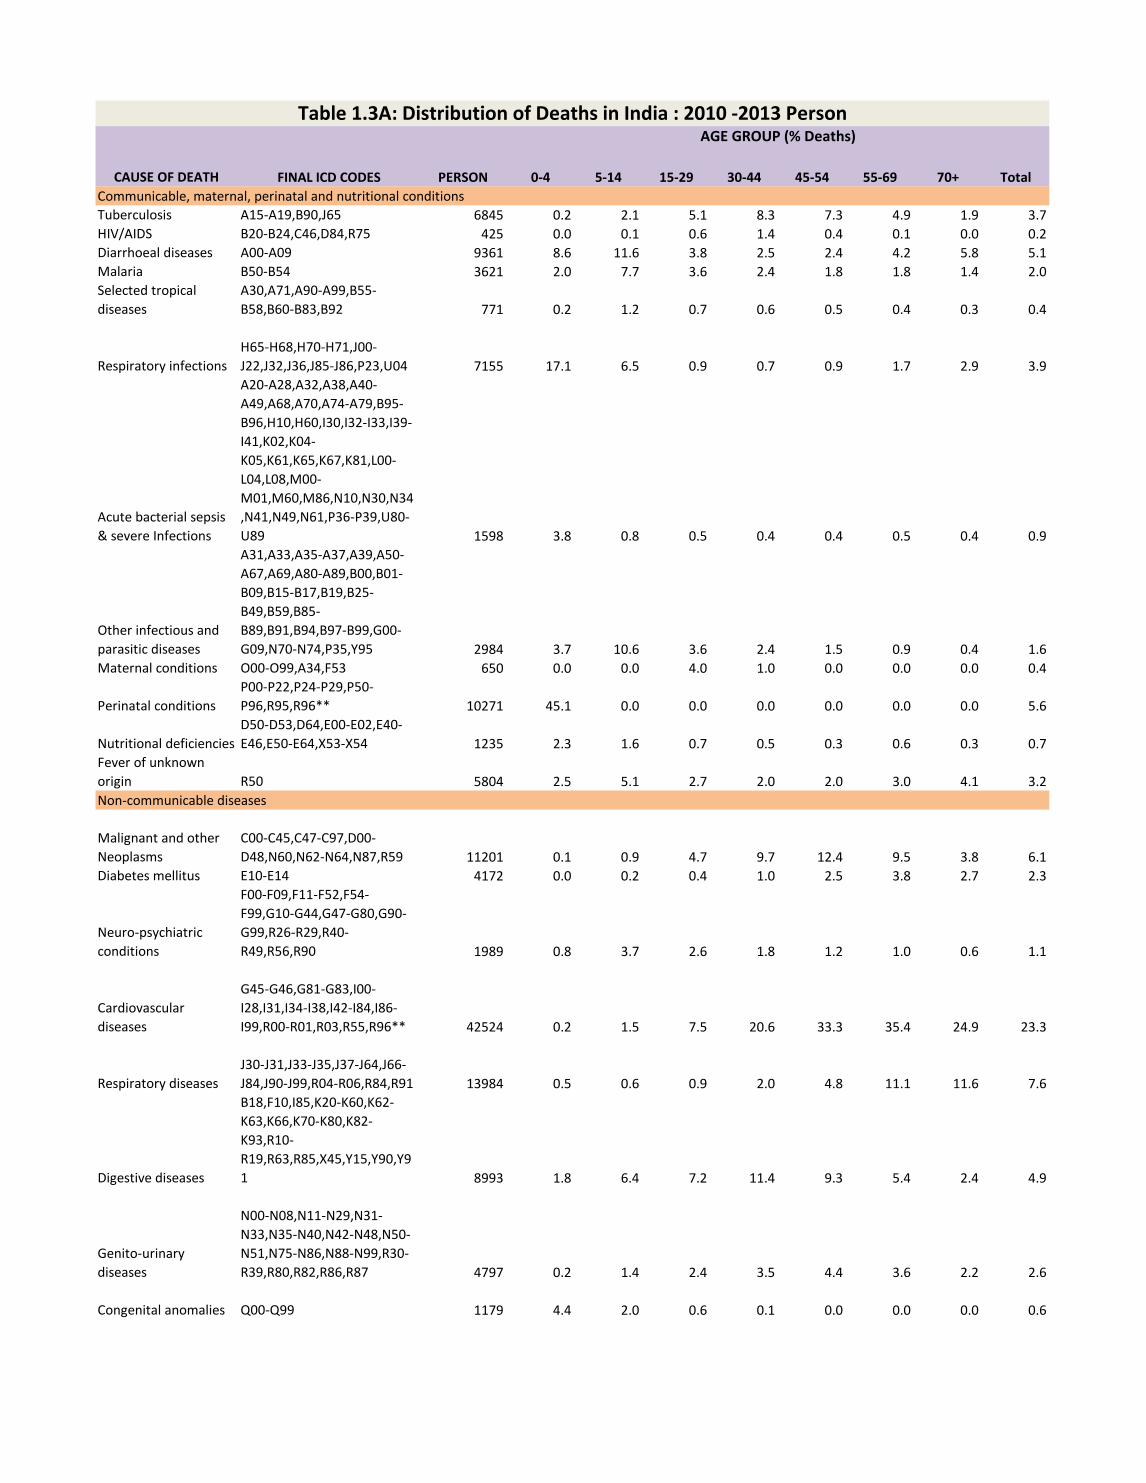
CAUSE OF DEATH FINAL ICD CODES PERSON 0-4 5-14 15-29 30-44 45-54 55-69 70+ TotalCommunicable, maternal, perinatal and nutritional conditionsTuberculosis A15-A19,B90,J65 6845 0.2 2.1 5.1 8.3 7.3 4.9 1.9 3.7HIV/AIDS B20-B24,C46,D84,R75 425 0.0 0.1 0.6 1.4 0.4 0.1 0.0 0.2Diarrhoeal diseases A00-A09 9361 8.6 11.6 3.8 2.5 2.4 4.2 5.8 5.1Malaria B50-B54 3621 2.0 7.7 3.6 2.4 1.8 1.8 1.4 2.0Selected tropical diseases
A30,A71,A90-A99,B55-B58,B60-B83,B92 771 0.2 1.2 0.7 0.6 0.5 0.4 0.3 0.4
Respiratory infectionsH65-H68,H70-H71,J00-J22,J32,J36,J85-J86,P23,U04 7155 17.1 6.5 0.9 0.7 0.9 1.7 2.9 3.9
Acute bacterial sepsis & severe Infections
A20-A28,A32,A38,A40-A49,A68,A70,A74-A79,B95-B96,H10,H60,I30,I32-I33,I39-I41,K02,K04-K05,K61,K65,K67,K81,L00-L04,L08,M00-M01,M60,M86,N10,N30,N34,N41,N49,N61,P36-P39,U80-U89 1598 3.8 0.8 0.5 0.4 0.4 0.5 0.4 0.9
Other infectious and parasitic diseases
A31,A33,A35-A37,A39,A50-A67,A69,A80-A89,B00,B01-B09,B15-B17,B19,B25-B49,B59,B85-B89,B91,B94,B97-B99,G00-G09,N70-N74,P35,Y95 2984 3.7 10.6 3.6 2.4 1.5 0.9 0.4 1.6
Maternal conditions O00-O99,A34,F53 650 0.0 0.0 4.0 1.0 0.0 0.0 0.0 0.4
Perinatal conditionsP00-P22,P24-P29,P50-P96,R95,R96** 10271 45.1 0.0 0.0 0.0 0.0 0.0 0.0 5.6
Nutritional deficienciesD50-D53,D64,E00-E02,E40-E46,E50-E64,X53-X54 1235 2.3 1.6 0.7 0.5 0.3 0.6 0.3 0.7
Fever of unknown origin R50 5804 2.5 5.1 2.7 2.0 2.0 3.0 4.1 3.2Non-communicable diseases
Malignant and other Neoplasms
C00-C45,C47-C97,D00-D48,N60,N62-N64,N87,R59 11201 0.1 0.9 4.7 9.7 12.4 9.5 3.8 6.1
Diabetes mellitus E10-E14 4172 0.0 0.2 0.4 1.0 2.5 3.8 2.7 2.3
Neuro-psychiatric conditions
F00-F09,F11-F52,F54-F99,G10-G44,G47-G80,G90-G99,R26-R29,R40-R49,R56,R90 1989 0.8 3.7 2.6 1.8 1.2 1.0 0.6 1.1
Cardiovascular diseases
G45-G46,G81-G83,I00-I28,I31,I34-I38,I42-I84,I86-I99,R00-R01,R03,R55,R96** 42524 0.2 1.5 7.5 20.6 33.3 35.4 24.9 23.3
Respiratory diseasesJ30-J31,J33-J35,J37-J64,J66-J84,J90-J99,R04-R06,R84,R91 13984 0.5 0.6 0.9 2.0 4.8 11.1 11.6 7.6
Digestive diseases
B18,F10,I85,K20-K60,K62-K63,K66,K70-K80,K82-K93,R10-R19,R63,R85,X45,Y15,Y90,Y91 8993 1.8 6.4 7.2 11.4 9.3 5.4 2.4 4.9
Genito-urinary diseases
N00-N08,N11-N29,N31-N33,N35-N40,N42-N48,N50-N51,N75-N86,N88-N99,R30-R39,R80,R82,R86,R87 4797 0.2 1.4 2.4 3.5 4.4 3.6 2.2 2.6
Congenital anomalies Q00-Q99 1179 4.4 2.0 0.6 0.1 0.0 0.0 0.0 0.6
Table 1.3A: Distribution of Deaths in India : 2010 -2013 PersonAGE GROUP (% Deaths)

Other Non-Communicable Diseases
D55-D63,D65-D83,D86-D89,E03-E07,E15-E16,E20-E35,E65-E90,H00-H06,H11-H59,H61-H62,H69,H72-H95,K00-K01,K03,K06-K14,L05,L10-L99,M02-M54,M61-M85,M87-M99,R20-R23,R70-R74,R76-R77,R81 1122 0.7 3.7 0.5 0.4 0.5 0.5 0.6 0.6
InjuriesUnintentional injuries: Motor Vehicle Accidents V01-V89 5373 0.5 6.1 13.7 9.0 4.6 1.6 0.6 2.9
Unintentional injuries: Other Than Motor Vehicle Accidents
V90-V98,W00-W99,X00-X44,X46-X52,X57-X59,Y40-Y89 8625 4.0 20.5 10.9 7.0 4.0 3.3 3.6 4.7
Intentional injuries: Suicide X60-X84 4812 0.0 2.3 18.0 8.2 3.1 1.0 0.3 2.6Intentional injuries: Other Than Suicide X85-Y09,Y35,Y36 558 0.1 0.6 1.5 1.2 0.4 0.1 0.0 0.3
Injuries of Undetermined Intent Y10-Y14,Y16-Y34,Y96-Y98 195 0.0 0.4 0.6 0.3 0.1 0.1 0.0 0.1
Symptoms, signs and Ill-defined conditions
Ill-defined/ All other symptoms,signs and abnormal clinical and laboratory findings
R02,R07-R09,R25,R51-R54,R57-R58,R60-R62,R64-R69,R78-R79,R83,R89,R92-R94,R96**,R98-R99 22583 0.9 2.5 2.2 1.6 1.7 5.6 29.0 12.4
Total 182827 100.0 100.0 100.0 100.0 100.0 100.0 100.0 100.0
Note: ** R96 - Sudden deaths are in 'perinatal conditions' (when age<1 year),in 'Cardiovascular diseases' (when age>30 year) and else in 'ill-defined conditions'
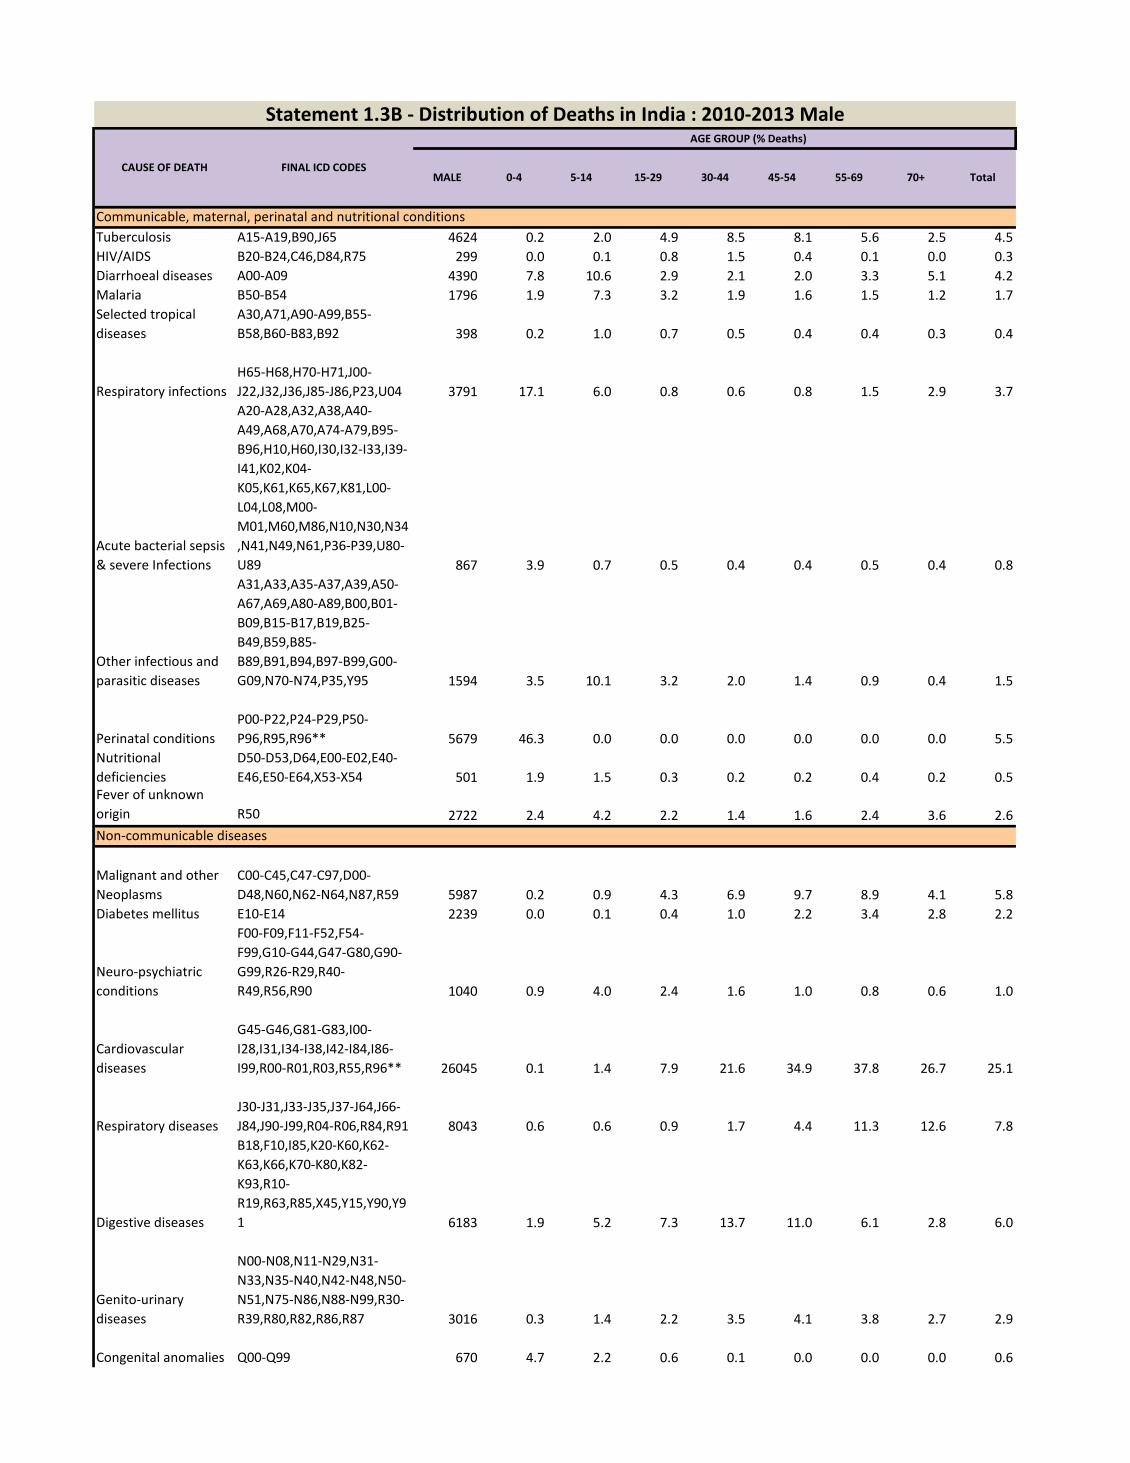
Tuberculosis A15-A19,B90,J65 4624 0.2 2.0 4.9 8.5 8.1 5.6 2.5 4.5HIV/AIDS B20-B24,C46,D84,R75 299 0.0 0.1 0.8 1.5 0.4 0.1 0.0 0.3Diarrhoeal diseases A00-A09 4390 7.8 10.6 2.9 2.1 2.0 3.3 5.1 4.2Malaria B50-B54 1796 1.9 7.3 3.2 1.9 1.6 1.5 1.2 1.7Selected tropical diseases
A30,A71,A90-A99,B55-B58,B60-B83,B92 398 0.2 1.0 0.7 0.5 0.4 0.4 0.3 0.4
Respiratory infectionsH65-H68,H70-H71,J00-J22,J32,J36,J85-J86,P23,U04 3791 17.1 6.0 0.8 0.6 0.8 1.5 2.9 3.7
Acute bacterial sepsis & severe Infections
A20-A28,A32,A38,A40-A49,A68,A70,A74-A79,B95-B96,H10,H60,I30,I32-I33,I39-I41,K02,K04-K05,K61,K65,K67,K81,L00-L04,L08,M00-M01,M60,M86,N10,N30,N34,N41,N49,N61,P36-P39,U80-U89 867 3.9 0.7 0.5 0.4 0.4 0.5 0.4 0.8
Other infectious and parasitic diseases
A31,A33,A35-A37,A39,A50-A67,A69,A80-A89,B00,B01-B09,B15-B17,B19,B25-B49,B59,B85-B89,B91,B94,B97-B99,G00-G09,N70-N74,P35,Y95 1594 3.5 10.1 3.2 2.0 1.4 0.9 0.4 1.5
Perinatal conditionsP00-P22,P24-P29,P50-P96,R95,R96** 5679 46.3 0.0 0.0 0.0 0.0 0.0 0.0 5.5
Nutritional deficiencies
D50-D53,D64,E00-E02,E40-E46,E50-E64,X53-X54 501 1.9 1.5 0.3 0.2 0.2 0.4 0.2 0.5
Fever of unknown origin R50 2722 2.4 4.2 2.2 1.4 1.6 2.4 3.6 2.6
Malignant and other Neoplasms
C00-C45,C47-C97,D00-D48,N60,N62-N64,N87,R59 5987 0.2 0.9 4.3 6.9 9.7 8.9 4.1 5.8
Diabetes mellitus E10-E14 2239 0.0 0.1 0.4 1.0 2.2 3.4 2.8 2.2
Neuro-psychiatric conditions
F00-F09,F11-F52,F54-F99,G10-G44,G47-G80,G90-G99,R26-R29,R40-R49,R56,R90 1040 0.9 4.0 2.4 1.6 1.0 0.8 0.6 1.0
Cardiovascular diseases
G45-G46,G81-G83,I00-I28,I31,I34-I38,I42-I84,I86-I99,R00-R01,R03,R55,R96** 26045 0.1 1.4 7.9 21.6 34.9 37.8 26.7 25.1
Respiratory diseasesJ30-J31,J33-J35,J37-J64,J66-J84,J90-J99,R04-R06,R84,R91 8043 0.6 0.6 0.9 1.7 4.4 11.3 12.6 7.8
Digestive diseases
B18,F10,I85,K20-K60,K62-K63,K66,K70-K80,K82-K93,R10-R19,R63,R85,X45,Y15,Y90,Y91 6183 1.9 5.2 7.3 13.7 11.0 6.1 2.8 6.0
Genito-urinary diseases
N00-N08,N11-N29,N31-N33,N35-N40,N42-N48,N50-N51,N75-N86,N88-N99,R30-R39,R80,R82,R86,R87 3016 0.3 1.4 2.2 3.5 4.1 3.8 2.7 2.9
Congenital anomalies Q00-Q99 670 4.7 2.2 0.6 0.1 0.0 0.0 0.0 0.6
Statement 1.3B - Distribution of Deaths in India : 2010-2013 MaleAGE GROUP (% Deaths)
CAUSE OF DEATH FINAL ICD CODESMALE 0-4 5-14 15-29 30-44 45-54 55-69 70+ Total
Communicable, maternal, perinatal and nutritional conditions
Non-communicable diseases

Other Non-Communicable Diseases
D55-D63,D65-D83,D86-D89,E03-E07,E15-E16,E20-E35,E65-E90,H00-H06,H11-H59,H61-H62,H69,H72-H95,K00-K01,K03,K06-K14,L05,L10-L99,M02-M54,M61-M85,M87-M99,R20-R23,R70-R74,R76-R77,R81 499 0.7 3.9 0.4 0.2 0.2 0.4 0.4 0.5
Unintentional injuries: Motor Vehicle Accidents V01-V89 4512 0.5 8.1 21.9 11.7 5.6 2.1 0.8 4.4
Unintentional injuries: Other Than Motor Vehicle Accidents
V90-V98,W00-W99,X00-X44,X46-X52,X57-X59,Y40-Y89 4981 4.0 23.7 12.3 7.3 4.3 3.0 3.4 4.8
Intentional injuries: Suicide X60-X84 2815 0.0 1.6 15.0 8.4 3.4 1.2 0.4 2.7Intentional injuries: Other Than Suicide X85-Y09,Y35,Y36 441 0.1 0.6 2.2 1.4 0.5 0.1 0.1 0.4
Injuries of Undetermined Intent Y10-Y14,Y16-Y34,Y96-Y98 137 0.0 0.5 0.7 0.3 0.1 0.1 0.0 0.1
Ill-defined/ All other symptoms,signs and abnormal clinical and laboratory findings
R02,R07-R09,R25,R51-R54,R57-R58,R60-R62,R64-R69,R78-R79,R83,R89,R92-R94,R96**,R98-R99 10398 0.7 2.5 2.1 1.3 1.6 4.4 25.9 10.0
Injuries
Symptoms, signs and Ill-defined conditions

Tuberculosis A15-A19,B90,J65 2221 0.2 2.1 5.3 7.9 5.6 3.8 1.4 2.8HIV/AIDS B20-B24,C46,D84,R75 126 0.0 0.1 0.4 1.2 0.4 0.0 0.0 0.2Diarrhoeal diseases A00-A09 4971 9.5 12.8 5.1 3.5 3.2 5.4 6.6 6.3Malaria B50-B54 1825 2.1 8.2 4.0 3.4 2.1 2.4 1.6 2.3Selected tropical diseases
A30,A71,A90-A99,B55-B58,B60-B83,B92 373 0.3 1.3 0.7 0.6 0.7 0.5 0.4 0.5
Respiratory infectionsH65-H68,H70-H71,J00-J22,J32,J36,J85-J86,P23,U04 3364 17.2 7.1 1.1 1.0 1.1 2.0 2.8 4.2
Acute bacterial sepsis & severe Infections
A20-A28,A32,A38,A40-A49,A68,A70,A74-A79,B95-B96,H10,H60,I30,I32-I33,I39-I41,K02,K04-K05,K61,K65,K67,K81,L00-L04,L08,M00-M01,M60,M86,N10,N30,N34,N41,N49,N61,P36-P39,U80-U89 731 3.8 1.0 0.5 0.5 0.3 0.5 0.5 0.9
Other infectious and parasitic diseases
A31,A33,A35-A37,A39,A50-A67,A69,A80-A89,B00,B01-B09,B15-B17,B19,B25-B49,B59,B85-B89,B91,B94,B97-B99,G00-G09,N70-N74,P35,Y95 1390 3.9 11.3 4.1 3.0 1.7 1.0 0.4 1.8
Maternal conditions O00-O99,A34,F53 650 0.0 0.0 9.0 3.0 0.1 0.0 0.0 0.8
Perinatal conditionsP00-P22,P24-P29,P50-P96,R95,R96** 4592 43.8 0.0 0.0 0.0 0.0 0.0 0.0 5.8
Nutritional deficiencies
D50-D53,D64,E00-E02,E40-E46,E50-E64,X53-X54 734 2.7 1.8 1.3 1.1 0.6 0.8 0.3 0.9
Fever of unknown origin R50 3082 2.6 6.1 3.4 3.1 2.7 3.8 4.7 3.9
Malignant and other Neoplasms
C00-C45,C47-C97,D00-D48,N60,N62-N64,N87,R59 5214 0.1 0.8 5.2 15.5 18.3 10.3 3.5 6.6
Diabetes mellitus E10-E14 1933 0.0 0.4 0.5 1.1 3.4 4.3 2.7 2.4
Neuro-psychiatric conditions
F00-F09,F11-F52,F54-F99,G10-G44,G47-G80,G90-G99,R26-R29,R40-R49,R56,R90 949 0.7 3.4 2.9 2.3 1.8 1.3 0.6 1.2
Cardiovascular diseases
G45-G46,G81-G83,I00-I28,I31,I34-I38,I42-I84,I86-I99,R00-R01,R03,R55,R96** 16479 0.2 1.7 7.0 18.6 29.8 32.0 23.0 20.8
Respiratory diseasesJ30-J31,J33-J35,J37-J64,J66-J84,J90-J99,R04-R06,R84,R91 5941 0.4 0.6 0.9 2.5 5.7 10.7 10.5 7.5
Digestive diseases
B18,F10,I85,K20-K60,K62-K63,K66,K70-K80,K82-K93,R10-R19,R63,R85,X45,Y15,Y90,Y91 2810 1.8 7.8 7.0 6.7 5.7 4.4 2.0 3.5
Genito-urinary diseases
N00-N08,N11-N29,N31-N33,N35-N40,N42-N48,N50-N51,N75-N86,N88-N99,R30-R39,R80,R82,R86,R87 1781 0.2 1.3 2.7 3.5 4.9 3.3 1.6 2.2
Congenital anomalies Q00-Q99 509 4.1 1.8 0.6 0.3 0.0 0.0 0.0 0.6
Statement 1.3C - Distribution of Deaths in India : 2010 - 2013 FemaleAGE GROUP (% Deaths)
CAUSE OF DEATH FINAL ICD CODESFEMALE 0-4 5-14 15-29 30-44 45-54 55-69 70+ Total
Communicable, maternal, perinatal and nutritional conditions
Non-communicable diseases

Other Non-Communicable Diseases
D55-D63,D65-D83,D86-D89,E03-E07,E15-E16,E20-E35,E65-E90,H00-H06,H11-H59,H61-H62,H69,H72-H95,K00-K01,K03,K06-K14,L05,L10-L99,M02-M54,M61-M85,M87-M99,R20-R23,R70-R74,R76-R77,R81 623 0.8 3.4 0.7 0.6 1.0 0.7 0.7 0.8
Unintentional injuries: Motor Vehicle Accidents V01-V89 861 0.4 3.9 3.3 3.3 2.3 0.9 0.3 1.1
Unintentional injuries: Other Than Motor Vehicle Accidents
V90-V98,W00-W99,X00-X44,X46-X52,X57-X59,Y40-Y89 3644 4.0 16.8 9.0 6.4 3.5 3.7 3.9 4.6
Intentional injuries: Suicide X60-X84 1997 0.0 3.1 21.8 7.9 2.6 0.8 0.2 2.5Intentional injuries: Other Than Suicide X85-Y09,Y35,Y36 117 0.1 0.6 0.6 0.6 0.3 0.0 0.0 0.1
Injuries of Undetermined Intent Y10-Y14,Y16-Y34,Y96-Y98 58 0.0 0.2 0.4 0.2 0.1 0.1 0.0 0.1
Ill-defined/ All other symptoms,signs and abnormal clinical and laboratory findings
R02,R07-R09,R25,R51-R54,R57-R58,R60-R62,R64-R69,R78-R79,R83,R89,R92-R94,R96**,R98-R99 12185 1.1 2.5 2.5 2.0 1.9 7.3 32.2 15.4
Injuries
Symptoms, signs and Ill-defined conditions

Male Male % Female Female % Person Person %Communicable, maternal, perinatal and nutritional conditions 26661 25.7 24059 30.4 50720 27.74Noncommunicable diseases 53722 51.8 36239 45.8 89961 49.21Injuries 12886 12.4 6677 8.4 19563 10.70Symptoms, signs and Ill-defined conditions 10398 10.0 12185 15.4 22583 12.35Total 103667 100.0 79160 100.0 182827 100.0
Male Male % Female Female % Person Person %
Communicable, maternal, perinatal and nutritional conditions 13142 36.1 12023 41.7 25165 38.5Noncommunicable diseases 15095 41.4 10333 35.8 25428 39.0Injuries 4229 11.6 2345 8.1 6574 10.1Symptoms, signs and Ill-defined conditions 3964 10.9 4161 14.4 8125 12.4Total 36430 100.0 28862 100.0 65292 100.0
Communicable, maternal, perinatal and nutritional conditions 13519 20.1 12036 23.9 25555 21.7Noncommunicable diseases 38627 57.4 25906 51.5 64533 54.9Injuries 8657 12.9 4332 8.6 12989 11.1Symptoms, signs and Ill-defined conditions 6434 9.6 8024 16.0 14458 12.3Total 67237 100.0 50298 100.0 117535 100.0
Table 2.1A : Distribution of Deaths by Major Cause Groups in India : 2010-2013
Major cause groups Deaths (%)
Table 2.1B : Distribution of Deaths by Major Cause Groups in EAG States & Assam and Other States : 2010-2013
Major cause groups Deaths (%)
EAG States & Assam
Other States

Male Male % Female Female % Person Person %
Communicable, maternal, perinatal and nutritional conditions 21925 27.4 19731 32.0 41656 29.4Noncommunicable diseases 39519 49.4 26984 43.8 66503 46.9Injuries 10256 12.8 5301 8.6 15557 11.0Symptoms, signs and Ill-defined conditions 8333 10.4 9611 15.6 17944 12.7Total 80033 100.0 61627 100.0 141660 100.0
Communicable, maternal, perinatal and nutritional conditions 4736 20.0 4328 24.7 9064.0 22.0Noncommunicable diseases 14203 60.1 9255 52.8 23458.0 57.0Injuries 2630 11.1 1376 7.8 4006.0 9.7Symptoms, signs and Ill-defined conditions 2065 8.7 2574 14.7 4639.0 11.3Total 23634 100.0 17533 100.0 41167.0 100.0
Urban Area
Table 2.1C : Distribution of Deaths by Major Cause Groups in Rural and Urban Areas : 2010-2013
Major cause groups Deaths (%)
Rural Area

Male Male % Female Female % Person Person %0-1 10353 10.0 8532 10.8 18885 10.31-4 1920 1.9 1961 2.5 3881 2.10-4 12273 11.8 10493 13.3 22766 12.5
5-14 1812 1.7 1570 2.0 3382 1.915-29 6693 6.5 5308 6.7 12001 6.630-34 3074 3.0 1609 2.0 4683 2.635-44 8175 7.9 3783 4.8 11958 6.545-54 11905 11.5 5489 6.9 17394 9.555-69 26426 25.5 18929 23.9 45355 24.870+ 33309 32.1 31979 40.4 65288 35.7
Total 103667 100.0 79160 100.0 182827 100.0
Male Male % Female Female % Person Person % Male Male % Female Female % Person Person %0-1 5525 15.2 4732 16.4 10257 15.7 4828 7.2 3800 7.6 8628 7.31-4 1119 3.1 1195 4.1 2314 3.5 801 1.2 766 1.5 1567 1.30-4 6644 18.2 5927 20.5 12571 19.3 5629 8.4 4566 9.1 10195 8.7
5-14 988 2.7 882 3.1 1870 2.9 824 1.2 688 1.4 1512 1.315-29 2538 7.0 2277 7.9 4815 7.4 4155 6.2 3031 6.0 7186 6.130-34 1010 2.8 653 2.3 1663 2.5 2064 3.1 956 1.9 3020 2.635-44 2604 7.1 1404 4.9 4008 6.1 5571 8.3 2379 4.7 7950 6.845-54 3576 9.8 1870 6.5 5446 8.3 8329 12.4 3619 7.2 11948 10.255-69 8450 23.2 6207 21.5 14657 22.4 17976 26.7 12722 25.3 30698 26.170+ 10620 29.2 9642 33.4 20262 31.0 22689 33.7 22337 44.4 45026 38.3
Total 36430 100.0 28862 100.0 65292 100.0 67237 100.0 50298 100.0 117535 100.0
Male Male % Female Female % Person Person % Male Male % Female Female % Person Person %0-1 8675 10.8 7117 11.5 15792 11.1 1678 7.1 1415 8.1 3093 7.51-4 1606 2.0 1643 2.7 3249 2.3 314 1.3 318 1.8 632 1.50-4 10281 12.8 8760 14.2 19041 13.4 1992 8.4 1733 9.9 3725 9.0
5-14 1516 1.9 1301 2.1 2817 2.0 296 1.3 269 1.5 565 1.415-29 5149 6.4 4138 6.7 9287 6.6 1544 6.5 1170 6.7 2714 6.630-34 2263 2.8 1262 2.0 3525 2.5 811 3.4 347 2.0 1158 2.835-44 6094 7.6 2939 4.8 9033 6.4 2081 8.8 844 4.8 2925 7.145-54 8722 10.9 4023 6.5 12745 9.0 3183 13.5 1466 8.4 4649 11.355-69 20121 25.1 14527 23.6 34648 24.5 6305 26.7 4402 25.1 10707 26.070+ 25887 32.3 24677 40.0 50564 35.7 7422 31.4 7302 41.6 14724 35.8
Total 80033 100.0 61627 100.0 141660 100.0 23634 100.0 17533 100.0 41167 100.0
Table 2.2A: Distribution of Deaths by age and gender in India : 2010-2013
Age GroupDeaths (%)
Table 2.2B: Distribution of Deaths by age and gender in EAG States & Assam and Other States :2010-2013
Age GroupDeaths (%)
EAG States & Assam Other States
Table 2.2C: Distribution of Deaths by age and gender in Rural & Urban Areas: 2010-2013
Age GroupDeaths (%)
Rural Area Urban Area

Male Female Person1 Cardiovascular diseases 25.1 20.8 23.3
2Ill-defined/ All other symptoms,signs and abnormal clinical and laboratory findings
10.0 15.4 12.4
3 Respiratory diseases 7.8 7.5 7.6
4 Malignant and other Neoplasms 5.8 6.6 6.1
5 Perinatal conditions 5.5 5.8 5.66 Diarrhoeal diseases 4.2 6.3 5.17 Digestive diseases 6.0 3.5 4.9
8Unintentional injuries: Other Than Motor Vehicle Accidents
4.8 4.6 4.7
9 Respiratory infections 3.7 4.2 3.910 Tuberculosis 4.5 2.8 3.7
All Other Remaining Causes 22.7 22.4 22.6Total 100.0 100.0 100.0
Table 2.3A: Top 10 Causes of Death in India (all ages): 2010-2013
Rank Causes of DeathDeaths (%)

Male Female Person
1 Cardiovascular diseases 17.2 13.6 15.6
2
Ill-defined/ All other symptoms,signs and abnormal clinical and laboratory findings 10.9 14.4 12.4
3 Perinatal conditions 8.4 8.7 8.54 Respiratory diseases 8.6 7.7 8.25 Diarrhoeal diseases 6.8 9.0 7.86 Respiratory infections 5.2 5.8 5.47 Digestive diseases 5.7 4.8 5.3
8Unintentional injuries: Other Than Motor Vehicle Accidents 5.4 5.2 5.3
9 Malignant and other Neoplasms 4.3 4.7 4.510 Tuberculosis 5.4 3.2 4.4
All Other Remaining Causes 22.2 22.9 22.5Total 100.0 100.0 100.0
1 Cardiovascular diseases 29.4 24.9 27.5
2
Ill-defined/ All other symptoms,signs and abnormal clinical and laboratory findings 9.6 16.0 12.3
3 Respiratory diseases 7.3 7.4 7.3
4 Malignant and other Neoplasms 6.6 7.7 7.05 Digestive diseases 6.1 2.8 4.7
6Unintentional injuries: Other Than Motor Vehicle Accidents 4.5 4.3 4.4
7 Perinatal conditions 3.9 4.2 4.08 Diarrhoeal diseases 2.8 4.7 3.69 Tuberculosis 4.0 2.6 3.4
10 Intentional injuries: Suicide 3.4 3.1 3.2All Other Remaining Causes 22.5 22.5 22.5Total 100.0 100.0 100.0
Rank Causes of Death Deaths (%)
Table 2.3B: Top 10 Causes of Death in EAG States & Assam and Other States (all ages): 2010-2013
EAG States & Assam
Other States
Male Female Person
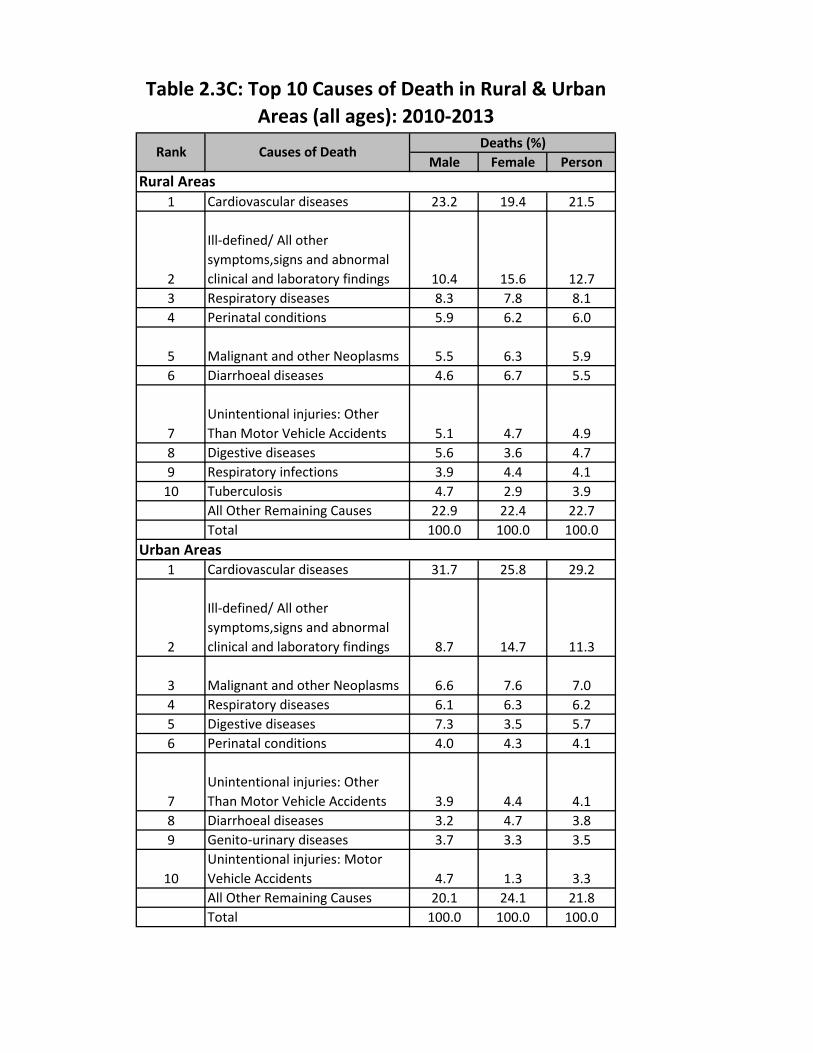
1 Cardiovascular diseases 23.2 19.4 21.5
2
Ill-defined/ All other symptoms,signs and abnormal clinical and laboratory findings 10.4 15.6 12.7
3 Respiratory diseases 8.3 7.8 8.14 Perinatal conditions 5.9 6.2 6.0
5 Malignant and other Neoplasms 5.5 6.3 5.96 Diarrhoeal diseases 4.6 6.7 5.5
7Unintentional injuries: Other Than Motor Vehicle Accidents 5.1 4.7 4.9
8 Digestive diseases 5.6 3.6 4.79 Respiratory infections 3.9 4.4 4.1
10 Tuberculosis 4.7 2.9 3.9All Other Remaining Causes 22.9 22.4 22.7Total 100.0 100.0 100.0
1 Cardiovascular diseases 31.7 25.8 29.2
2
Ill-defined/ All other symptoms,signs and abnormal clinical and laboratory findings 8.7 14.7 11.3
3 Malignant and other Neoplasms 6.6 7.6 7.04 Respiratory diseases 6.1 6.3 6.25 Digestive diseases 7.3 3.5 5.76 Perinatal conditions 4.0 4.3 4.1
7Unintentional injuries: Other Than Motor Vehicle Accidents 3.9 4.4 4.1
8 Diarrhoeal diseases 3.2 4.7 3.89 Genito-urinary diseases 3.7 3.3 3.5
10Unintentional injuries: Motor Vehicle Accidents 4.7 1.3 3.3All Other Remaining Causes 20.1 24.1 21.8Total 100.0 100.0 100.0
Rural Areas
Urban Areas
Table 2.3C: Top 10 Causes of Death in Rural & Urban Areas (all ages): 2010-2013
Rank Causes of Death Deaths (%)
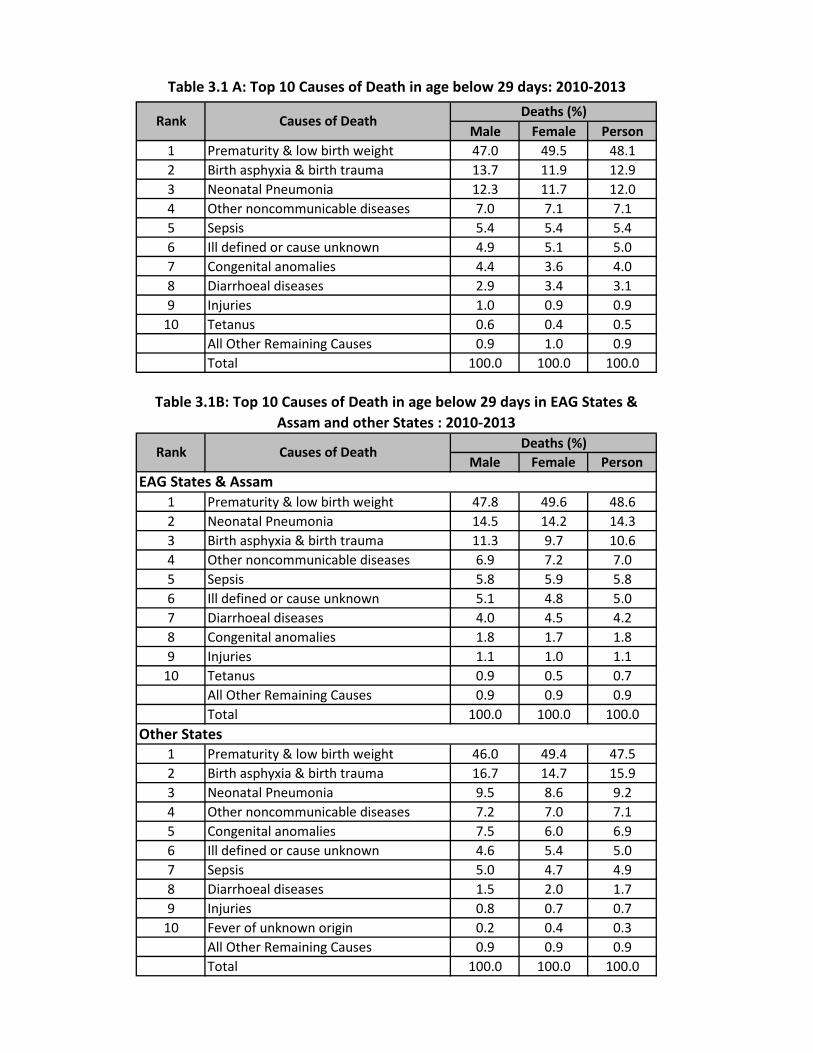
Male Female Person1 Prematurity & low birth weight 47.0 49.5 48.12 Birth asphyxia & birth trauma 13.7 11.9 12.93 Neonatal Pneumonia 12.3 11.7 12.04 Other noncommunicable diseases 7.0 7.1 7.15 Sepsis 5.4 5.4 5.46 Ill defined or cause unknown 4.9 5.1 5.07 Congenital anomalies 4.4 3.6 4.08 Diarrhoeal diseases 2.9 3.4 3.19 Injuries 1.0 0.9 0.9
10 Tetanus 0.6 0.4 0.5All Other Remaining Causes 0.9 1.0 0.9Total 100.0 100.0 100.0
Male Female Person
1 Prematurity & low birth weight 47.8 49.6 48.62 Neonatal Pneumonia 14.5 14.2 14.33 Birth asphyxia & birth trauma 11.3 9.7 10.64 Other noncommunicable diseases 6.9 7.2 7.05 Sepsis 5.8 5.9 5.86 Ill defined or cause unknown 5.1 4.8 5.07 Diarrhoeal diseases 4.0 4.5 4.28 Congenital anomalies 1.8 1.7 1.89 Injuries 1.1 1.0 1.1
10 Tetanus 0.9 0.5 0.7All Other Remaining Causes 0.9 0.9 0.9Total 100.0 100.0 100.0
1 Prematurity & low birth weight 46.0 49.4 47.52 Birth asphyxia & birth trauma 16.7 14.7 15.93 Neonatal Pneumonia 9.5 8.6 9.24 Other noncommunicable diseases 7.2 7.0 7.15 Congenital anomalies 7.5 6.0 6.96 Ill defined or cause unknown 4.6 5.4 5.07 Sepsis 5.0 4.7 4.98 Diarrhoeal diseases 1.5 2.0 1.79 Injuries 0.8 0.7 0.7
10 Fever of unknown origin 0.2 0.4 0.3All Other Remaining Causes 0.9 0.9 0.9Total 100.0 100.0 100.0
EAG States & Assam
Other States
Table 3.1 A: Top 10 Causes of Death in age below 29 days: 2010-2013
Rank Causes of DeathDeaths (%)
Table 3.1B: Top 10 Causes of Death in age below 29 days in EAG States & Assam and other States : 2010-2013
Rank Causes of Death Deaths (%)

Male Female Person
1 Prematurity & low birth weight 47.3 49.4 48.32 Birth asphyxia & birth trauma 13.3 11.6 12.53 Neonatal Pneumonia 12.6 12.2 12.44 Other noncommunicable diseases 6.8 7.2 7.05 Sepsis 5.6 5.5 5.56 Ill defined or cause unknown 4.8 5.0 4.97 Congenital anomalies 4.0 3.3 3.78 Diarrhoeal diseases 3.1 3.6 3.39 Injuries 1.0 0.8 0.9
10 Tetanus 0.6 0.4 0.5All Other Remaining Causes 0.8 1.0 0.9Total 100.0 100.0 100.0
1 Prematurity & low birth weight 45.0 50.1 47.32 Birth asphyxia & birth trauma 16.0 13.7 15.03 Neonatal Pneumonia 10.4 9.2 9.94 Other noncommunicable diseases 7.9 6.4 7.35 Congenital anomalies 6.4 4.9 5.86 Ill defined or cause unknown 5.5 5.8 5.67 Sepsis 4.6 4.9 4.88 Diarrhoeal diseases 1.7 2.5 2.09 Injuries 0.8 1.3 1.0
10 Tetanus 0.5 0.3 0.4All Other Remaining Causes 1.2 0.9 1.1Total 100.0 100.0 100.0
Table 3.1C: Top 10 Causes of Death in age below 29 days in Rural and Urban Areas : 2010-2013
Rural Areas
Urban Areas
Deaths (%)Cause of DeathRank

Male Female Person1 Prematurity & low birth weight 35.6 36.4 35.92 Pneumonia 17.0 16.8 16.93 Birth asphyxia & birth trauma 10.7 9.1 9.94 Other noncommunicable diseases 8.2 7.5 7.95 Diarrhoeal diseases 6.2 7.3 6.76 Ill defined or cause unknown 4.4 4.9 4.67 Congenital anomalies 4.8 4.3 4.68 Acute bacterial sepsis and severe infections 4.2 4.3 4.29 Injuries 2.0 2.1 2.1
10 Fever of unknown origin 1.7 1.8 1.7All Other Remaining Causes 5.2 5.7 5.4Total 100.0 100.0 100.0
Male Female Person
1 Prematurity & low birth weight 37.1 36.8 37.02 Pneumonia 19.0 18.7 18.83 Birth asphyxia & birth trauma 9.1 7.6 8.44 Diarrhoeal diseases 7.8 8.6 8.25 Other noncommunicable diseases 7.1 7.4 7.36 Ill defined or cause unknown 4.6 4.7 4.67 Acute bacterial sepsis and severe infections 4.4 4.7 4.68 Injuries 2.3 2.4 2.49 Congenital anomalies 2.0 2.0 2.0
10 Fever of unknown origin 1.6 1.7 1.6All Other Remaining Causes 5.0 5.5 5.2Total 100.0 100.0 100.0
1 Prematurity & low birth weight 33.8 35.9 34.72 Pneumonia 14.8 14.3 14.63 Birth asphyxia & birth trauma 12.4 10.9 11.84 Other noncommunicable diseases 9.3 7.6 8.65 Congenital anomalies 8.1 7.2 7.76 Diarrhoeal diseases 4.4 5.7 5.07 Ill defined or cause unknown 4.2 5.1 4.68 Acute bacterial sepsis and severe infections 3.9 3.8 3.99 Fever of unknown origin 1.8 1.9 1.8
10 Injuries 1.6 1.8 1.7All Other Remaining Causes 5.4 5.9 5.6Total 100.0 100.0 100.0
Rank Causes of Death Deaths (%)
Table 3.2A: Top 10 Causes of Death in age below 1 year in India : 2010-2013
Rank Cause of Death Deaths (%)
Table 3.2B: Top 10 Causes of Death in age below 1 year in EAG States & Assam And other States : 2010-2013
EAG States & Assam
Other States

Male Female Person
1 Prematurity & low birth weight 35.8 36.5 36.22 Pneumonia 17.4 17.1 17.33 Birth asphyxia & birth trauma 10.3 8.8 9.64 Other noncommunicable diseases 7.9 7.6 7.75 Diarrhoeal diseases 6.4 7.5 6.96 Ill defined or cause unknown 4.3 4.7 4.57 Acute bacterial sepsis and severe infections 4.3 4.3 4.38 Congenital anomalies 4.4 3.9 4.29 Injuries 2.1 2.1 2.1
10 Fever of unknown origin 1.8 1.8 1.8All Other Remaining Causes 5.3 5.6 5.4Total 100.0 100.0 100.0
1 Prematurity & low birth weight 34.3 35.5 34.92 Pneumonia 15.1 14.8 15.03 Birth asphyxia & birth trauma 12.5 10.2 11.44 Other noncommunicable diseases 9.7 7.3 8.65 Congenital anomalies 6.9 6.4 6.66 Diarrhoeal diseases 5.4 6.1 5.87 Ill defined or cause unknown 5.0 5.7 5.38 Acute bacterial sepsis and severe infections 3.6 4.1 3.89 Injuries 1.7 2.3 1.9
10 Fever of unknown origin 0.9 1.8 1.3All Other Remaining Causes 4.9 5.7 5.3Total 100.0 100.0 100.0
Rural Areas
Urban Areas
Table 3.2C: Top 10 Causes of Death in age below 1 year in Rural & Urban Areas : 2010-2013
Rank Cause of Death Deaths (%)
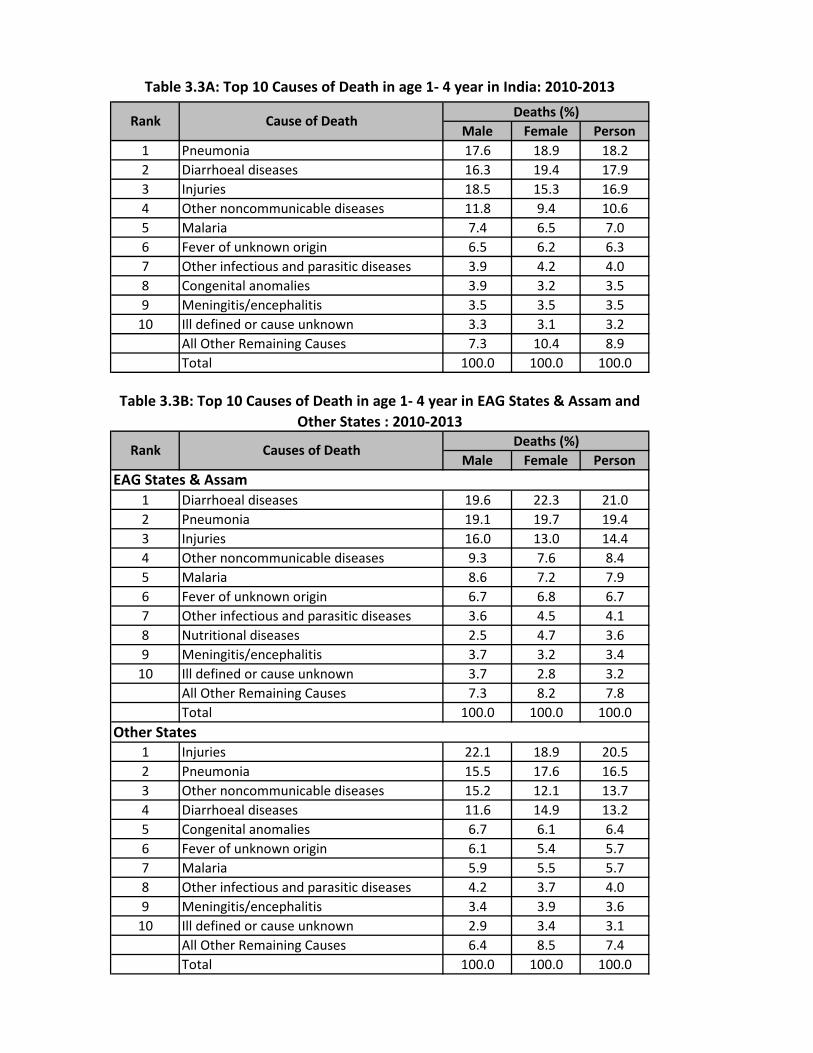
Male Female Person1 Pneumonia 17.6 18.9 18.22 Diarrhoeal diseases 16.3 19.4 17.93 Injuries 18.5 15.3 16.94 Other noncommunicable diseases 11.8 9.4 10.65 Malaria 7.4 6.5 7.06 Fever of unknown origin 6.5 6.2 6.37 Other infectious and parasitic diseases 3.9 4.2 4.08 Congenital anomalies 3.9 3.2 3.59 Meningitis/encephalitis 3.5 3.5 3.5
10 Ill defined or cause unknown 3.3 3.1 3.2All Other Remaining Causes 7.3 10.4 8.9Total 100.0 100.0 100.0
Male Female Person
1 Diarrhoeal diseases 19.6 22.3 21.02 Pneumonia 19.1 19.7 19.43 Injuries 16.0 13.0 14.44 Other noncommunicable diseases 9.3 7.6 8.45 Malaria 8.6 7.2 7.96 Fever of unknown origin 6.7 6.8 6.77 Other infectious and parasitic diseases 3.6 4.5 4.18 Nutritional diseases 2.5 4.7 3.69 Meningitis/encephalitis 3.7 3.2 3.4
10 Ill defined or cause unknown 3.7 2.8 3.2All Other Remaining Causes 7.3 8.2 7.8Total 100.0 100.0 100.0
1 Injuries 22.1 18.9 20.52 Pneumonia 15.5 17.6 16.53 Other noncommunicable diseases 15.2 12.1 13.74 Diarrhoeal diseases 11.6 14.9 13.25 Congenital anomalies 6.7 6.1 6.46 Fever of unknown origin 6.1 5.4 5.77 Malaria 5.9 5.5 5.78 Other infectious and parasitic diseases 4.2 3.7 4.09 Meningitis/encephalitis 3.4 3.9 3.6
10 Ill defined or cause unknown 2.9 3.4 3.1All Other Remaining Causes 6.4 8.5 7.4Total 100.0 100.0 100.0
Rank Causes of Death Deaths (%)
Table 3.3A: Top 10 Causes of Death in age 1- 4 year in India: 2010-2013
Rank Cause of Death Deaths (%)
Table 3.3B: Top 10 Causes of Death in age 1- 4 year in EAG States & Assam and Other States : 2010-2013
EAG States & Assam
Other States

Male Female Person
1 Pneumonia 18.1 18.8 18.42 Diarrhoeal diseases 15.8 19.5 17.73 Injuries 18.4 15.5 16.94 Other noncommunicable diseases 12.0 9.2 10.65 Malaria 7.8 6.9 7.36 Fever of unknown origin 6.7 6.3 6.57 Other infectious and parasitic diseases 4.0 4.1 4.08 Meningitis/encephalitis 3.8 3.5 3.79 Congenital anomalies 3.5 3.0 3.3
10 Ill defined or cause unknown 3.3 2.8 3.0All Other Remaining Causes 6.8 10.4 8.6Total 100.0 100.0 100.0
1 Diarrhoeal diseases 18.8 18.9 18.82 Pneumonia 15.3 19.2 17.23 Injuries 19.4 14.2 16.84 Other noncommunicable diseases 10.8 10.4 10.65 Fever of unknown origin 5.4 6.0 5.76 Malaria 5.7 4.7 5.27 Congenital anomalies 5.7 4.1 4.98 Ill defined or cause unknown 3.5 4.4 4.09 Other infectious and parasitic diseases 3.2 4.7 4.0
10 Nutritional diseases 3.5 2.8 3.2All Other Remaining Causes 8.6 10.7 9.7Total 100.0 100.0 100.0
Rural Areas
Urban Areas
Table 3.3C: Top 10 Causes of Death in age 1- 4 year in Rural & Urban Areas : 2010-2013
Rank Cause of Death Deaths (%)

Male Female Person1 Prematurity & low birth weight 30.0 29.6 29.82 Pneumonia 17.1 17.2 17.13 Diarrhoeal diseases 7.8 9.5 8.64 Other noncommunicable diseases 8.7 7.9 8.35 Birth asphyxia & birth trauma 9.0 7.4 8.26 Injuries 4.6 4.6 4.67 Congenital anomalies 4.7 4.1 4.48 Ill defined or cause unknown 4.2 4.5 4.49 Acute bacterial sepsis and severe infections 3.6 3.6 3.6
10 Fever of unknown origin 2.4 2.6 2.5All Other Remaining Causes 7.8 9.1 8.4Total 100.0 100.0 100.0
Male Female PersonEAG States & Assam
1 Prematurity & low birth weight 30.9 29.4 30.22 Pneumonia 19.0 18.9 19.03 Diarrhoeal diseases 9.8 11.3 10.54 Other noncommunicable diseases 7.5 7.5 7.55 Birth asphyxia & birth trauma 7.6 6.0 6.96 Injuries 4.6 4.5 4.67 Ill defined or cause unknown 4.4 4.3 4.48 Acute bacterial sepsis and severe infections 3.7 3.9 3.89 Fever of unknown origin 2.4 2.7 2.6
10 Malaria 2.2 2.1 2.1All Other Remaining Causes 7.9 9.3 8.5Total 100.0 100.0 100.0
Other States 1 Prematurity & low birth weight 29.0 29.9 29.42 Pneumonia 14.9 14.9 14.93 Birth asphyxia & birth trauma 10.7 9.1 10.04 Other noncommunicable diseases 10.2 8.4 9.45 Congenital anomalies 7.9 7.0 7.56 Diarrhoeal diseases 5.5 7.2 6.37 Injuries 4.6 4.6 4.68 Ill defined or cause unknown 4.0 4.8 4.49 Acute bacterial sepsis and severe infections 3.4 3.2 3.3
10 Fever of unknown origin 2.4 2.5 2.4All Other Remaining Causes 7.4 8.4 7.9Total 100.0 100.0 100.0
Table 3.4A- Top 10 Causes of Death in age 0 - 4 years in India : 2010-2013
Rank Cause of Death Deaths (%)
Table 3.4B: Top 10 Causes of Death in age 0 - 4 years in EAG States & Assam and Other States : 2010-2013
Rank Cause of Death Deaths (%)

Male Female Person
1 Prematurity & low birth weight 30.2 29.7 30.02 Pneumonia 17.5 17.5 17.53 Diarrhoeal diseases 7.9 9.8 8.74 Other noncommunicable diseases 8.5 7.9 8.25 Birth asphyxia & birth trauma 8.7 7.2 8.06 Injuries 4.6 4.6 4.67 Ill defined or cause unknown 4.1 4.3 4.28 Congenital anomalies 4.3 3.7 4.09 Acute bacterial sepsis and severe infections 3.7 3.7 3.7
10 Fever of unknown origin 2.6 2.6 2.6All Other Remaining Causes 7.9 9.1 8.4Total 100.0 100.0 100.0
1 Prematurity & low birth weight 28.9 29.0 28.92 Pneumonia 15.2 15.6 15.43 Birth asphyxia & birth trauma 10.5 8.3 9.54 Other noncommunicable diseases 9.9 7.9 9.05 Diarrhoeal diseases 7.5 8.5 8.06 Congenital anomalies 6.7 5.9 6.37 Ill defined or cause unknown 4.8 5.4 5.18 Injuries 4.5 4.4 4.59 Acute bacterial sepsis and severe infections 3.2 3.4 3.3
10 Fever of unknown origin 1.6 2.6 2.1All Other Remaining Causes 7.3 8.8 8.0Total 100.0 100.0 100.0
Urban Areas
Table 3.4C: Top 10 Causes of Death in age 0 - 4 years in Rural & Urban Areas : 2010-2013
Rank Cause of Death Deaths (%)
Rural Areas

Male Female Person
1Unintentional injuries: Other Than Motor Vehicle Accidents 23.7 16.8 20.5
2 Diarrhoeal diseases 10.6 12.8 11.63 Other infectious and parasitic diseases 10.1 11.3 10.64 Malaria 7.3 8.2 7.75 Respiratory infections 6.0 7.1 6.56 Digestive diseases 5.2 7.8 6.4
7Unintentional injuries: Motor Vehicle Accidents 8.1 3.9 6.1
8 Fever of unknown origin 4.2 6.1 5.19 Neuro-psychiatric conditions 4.0 3.4 3.7
10 Other Non-Communicable Diseases 3.9 3.4 3.7All Other Remaining Causes 17.0 19.2 18.0Total 100.0 100.0 100.0
Table 3.5A-Top 10 Causes of Death in age 5-14 years in India : 2010-2013
Rank Cause of Death Deaths (%)

Male Female PersonEAG States & Assam
1Unintentional injuries: Other Than Motor Vehicle Accidents 23.6 17.6 20.8
2 Diarrhoeal diseases 13.8 14.4 14.13 Other infectious and parasitic diseases 9.3 12.4 10.84 Digestive diseases 6.2 9.9 7.95 Malaria 7.2 8.4 7.86 Respiratory infections 6.6 7.7 7.1
7Unintentional injuries: Motor Vehicle Accidents 7.9 3.2 5.7
8 Fever of unknown origin 4.4 5.6 4.99 Other Non-Communicable Diseases 3.0 3.9 3.4
10Ill-defined/ All other symptoms,signs and abnormal clinical and laboratory findings 3.0 2.6 2.8All Other Remaining Causes 15.1 14.5 14.8Total 100.0 100.0 100.0
Other States
1Unintentional injuries: Other Than Motor Vehicle Accidents 23.9 15.8 20.2
2 Other infectious and parasitic diseases 11.0 9.9 10.53 Diarrhoeal diseases 6.8 10.8 8.64 Malaria 7.4 8.0 7.7
5Unintentional injuries: Motor Vehicle Accidents 8.3 4.8 6.7
6 Respiratory infections 5.2 6.3 5.77 Fever of unknown origin 4.0 6.8 5.38 Neuro-psychiatric conditions 4.6 5.2 4.99 Digestive diseases 4.0 5.1 4.5
10 Other Non-Communicable Diseases 5.0 2.9 4.0All Other Remaining Causes 19.8 24.4 21.9Total 100.0 100.0 100.0
Table 3.5B: Top 10 Causes of Death in age 5-14 years in EAG States & Assam and Other States : 2010-2013
Rank Cause of Death Deaths (%)

Male Female PersonRural Areas
1Unintentional injuries: Other Than Motor Vehicle Accidents 24.4 17.1 21.0
2 Diarrhoeal diseases 10.9 13.0 11.93 Other infectious and parasitic diseases 10.8 11.2 11.04 Malaria 7.7 9.0 8.35 Digestive diseases 5.2 8.2 6.56 Respiratory infections 5.7 6.9 6.3
7Unintentional injuries: Motor Vehicle Accidents 7.8 3.5 5.8
8 Fever of unknown origin 3.8 6.7 5.29 Neuro-psychiatric conditions 4.1 3.4 3.8
10 Other Non-Communicable Diseases 3.6 3.1 3.4All Other Remaining Causes 16.0 18.1 17.0Total 100.0 100.0 100.0
Urban Areas
1Unintentional injuries: Other Than Motor Vehicle Accidents 20.3 15.6 18.1
2 Diarrhoeal diseases 9.1 11.9 10.43 Other infectious and parasitic diseases 6.4 11.9 9.0
4Unintentional injuries: Motor Vehicle Accidents 9.5 6.0 7.8
5 Respiratory infections 7.1 7.8 7.46 Digestive diseases 5.4 6.0 5.77 Other Non-Communicable Diseases 5.4 5.2 5.38 Fever of unknown origin 6.1 3.4 4.89 Malaria 5.1 4.5 4.8
10 Intentional injuries: Suicide 3.4 4.1 3.7All Other Remaining Causes 22.3 23.8 23.0Total 100.0 100.0 100.0
Table 3.5C: Top 10 Causes of Death in age 5-14 years in Rural & Urban Areas : 2010-2013
Rank Cause of Death Deaths (%)

Male Female Person1 Intentional injuries: Suicide 15.0 21.8 18.0
2Unintentional injuries: Motor Vehicle Accidents 21.9 3.3 13.7
3Unintentional injuries: Other Than Motor Vehicle Accidents 12.3 9.0 10.9
4 Cardiovascular diseases 7.9 7.0 7.55 Digestive diseases 7.3 7.0 7.26 Tuberculosis 4.9 5.3 5.17 Malignant and other Neoplasms 4.3 5.2 4.78 Maternal conditions 0.0 9.0 4.09 Diarrhoeal diseases 2.9 5.1 3.8
10 Other infectious and parasitic diseases 3.2 4.1 3.6All Other Remaining Causes 20.3 23.2 21.6Total 100.0 100.0 100.0
Table 3.6A: Top 10 Causes of Death in age 15-29 years in India : 2010-2013
Rank Cause of Death Deaths (%)

Male Female PersonEAG States & Assam
1Unintentional injuries: Motor Vehicle Accidents 20.9 3.3 12.6
2Unintentional injuries: Other Than Motor Vehicle Accidents 12.8 11.1 12.0
3 Intentional injuries: Suicide 10.2 13.0 11.54 Digestive diseases 8.4 9.4 8.95 Tuberculosis 6.4 6.0 6.26 Cardiovascular diseases 5.5 5.3 5.47 Diarrhoeal diseases 4.4 6.3 5.38 Other infectious and parasitic diseases 4.9 5.6 5.29 Maternal conditions 0.0 10.8 5.1
10 Malaria 4.6 5.4 5.0All Other Remaining Causes 22.0 23.7 22.8Total 100.0 100.0 100.0
Other States 1 Intentional injuries: Suicide 17.9 28.3 22.3
2Unintentional injuries: Motor Vehicle Accidents 22.6 3.3 14.4
3Unintentional injuries: Other Than Motor Vehicle Accidents 12.0 7.5 10.1
4 Cardiovascular diseases 9.4 8.3 8.95 Digestive diseases 6.7 5.2 6.16 Malignant and other Neoplasms 4.4 6.1 5.17 Tuberculosis 4.0 4.8 4.38 Maternal conditions 0.0 7.6 3.29 Diarrhoeal diseases 2.0 4.2 2.9
10 Neuro-psychiatric conditions 2.4 3.1 2.7All Other Remaining Causes 18.7 21.7 20.0Total 100.0 100.0 100.0
Table 3.6B: Top 10 Causes of Death in age 15-29 years in EAG States & Assam and Other States: 2010-2013
Rank Cause of Death Deaths (%)

Male Female PersonRural Areas
1 Intentional injuries: Suicide 16.0 22.6 18.9
2Unintentional injuries: Motor Vehicle Accidents 21.4 3.0 13.2
3Unintentional injuries: Other Than Motor Vehicle Accidents 12.9 9.6 11.5
4 Cardiovascular diseases 7.4 6.8 7.25 Digestive diseases 6.7 6.8 6.76 Tuberculosis 4.8 5.0 4.97 Malignant and other Neoplasms 4.3 5.2 4.78 Maternal conditions 0.0 9.2 4.19 Diarrhoeal diseases 2.8 5.1 3.8
10 Malaria 3.4 4.2 3.7All Other Remaining Causes 20.3 22.5 21.3Total 100.0 100.0 100.0
Urban Areas
1Unintentional injuries: Motor Vehicle Accidents 23.6 4.4 15.3
2 Intentional injuries: Suicide 11.6 18.7 14.7
3Unintentional injuries: Other Than Motor Vehicle Accidents 10.3 6.8 8.8
4 Digestive diseases 9.3 7.9 8.75 Cardiovascular diseases 9.5 7.5 8.76 Tuberculosis 5.4 6.5 5.97 Malignant and other Neoplasms 4.4 5.4 4.88 Diarrhoeal diseases 3.0 5.0 3.99 Maternal conditions 0.0 8.1 3.5
10 Other infectious and parasitic diseases 2.8 4.1 3.4All Other Remaining Causes 20.0 25.6 22.4Total 100.0 100.0 100.0
Table 3.6C: Top 10 Causes of Death in age 15-29 years in Rural & Urban Areas : 2010-2013
Rank Cause of Death Deaths (%)
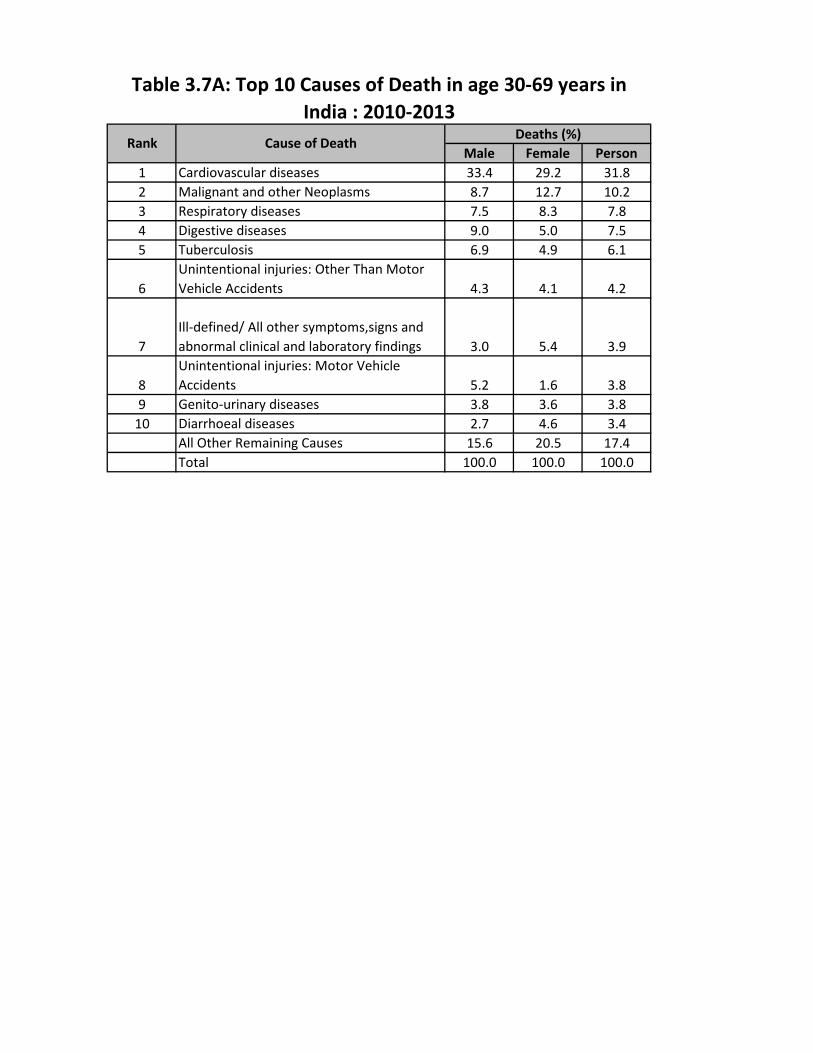
Male Female Person1 Cardiovascular diseases 33.4 29.2 31.82 Malignant and other Neoplasms 8.7 12.7 10.23 Respiratory diseases 7.5 8.3 7.84 Digestive diseases 9.0 5.0 7.55 Tuberculosis 6.9 4.9 6.1
6Unintentional injuries: Other Than Motor Vehicle Accidents 4.3 4.1 4.2
7Ill-defined/ All other symptoms,signs and abnormal clinical and laboratory findings 3.0 5.4 3.9
8Unintentional injuries: Motor Vehicle Accidents 5.2 1.6 3.8
9 Genito-urinary diseases 3.8 3.6 3.810 Diarrhoeal diseases 2.7 4.6 3.4
All Other Remaining Causes 15.6 20.5 17.4Total 100.0 100.0 100.0
Table 3.7A: Top 10 Causes of Death in age 30-69 years in India : 2010-2013
Rank Cause of Death Deaths (%)

Male Female PersonEAG States & Assam
1 Cardiovascular diseases 25.9 22.2 24.42 Respiratory diseases 9.9 9.5 9.83 Malignant and other Neoplasms 7.4 9.8 8.34 Digestive diseases 8.8 7.2 8.25 Tuberculosis 9.4 6.0 8.06 Diarrhoeal diseases 4.8 6.6 5.5
7Ill-defined/ All other symptoms,signs and abnormal clinical and laboratory findings 4.2 7.2 5.4
8Unintentional injuries: Other Than Motor Vehicle Accidents 4.8 5.2 4.9
9Unintentional injuries: Motor Vehicle Accidents 5.0 1.7 3.7
10 Malaria 3.0 4.2 3.5All Other Remaining Causes 16.9 20.5 18.3Total 100.0 100.0 100.0
Other States 1 Cardiovascular diseases 36.9 32.8 35.42 Malignant and other Neoplasms 9.3 14.3 11.13 Digestive diseases 9.1 3.9 7.24 Respiratory diseases 6.4 7.7 6.95 Tuberculosis 5.7 4.3 5.26 Genito-urinary diseases 4.3 4.2 4.2
7Unintentional injuries: Motor Vehicle Accidents 5.3 1.6 3.9
8Unintentional injuries: Other Than Motor Vehicle Accidents 4.0 3.6 3.9
9 Intentional injuries: Suicide 4.1 2.9 3.7
10Ill-defined/ All other symptoms,signs and abnormal clinical and laboratory findings 2.5 4.4 3.2All Other Remaining Causes 12.6 20.4 15.5Total 100.0 100.0 100.0
Table 3.7B: Top 10 Causes of Death in age 30-69 years in EAG States & Assam and Other States: 2010-2013
Rank Cause of Death Deaths (%)

Male Female PersonRural Areas
1 Cardiovascular diseases 31.6 27.7 30.12 Malignant and other Neoplasms 8.6 12.5 10.13 Respiratory diseases 8.1 8.9 8.44 Digestive diseases 8.5 5.1 7.25 Tuberculosis 7.4 5.2 6.6
6Unintentional injuries: Other Than Motor Vehicle Accidents 4.7 4.3 4.5
7Ill-defined/ All other symptoms,signs and abnormal clinical and laboratory findings 3.2 5.6 4.1
8Unintentional injuries: Motor Vehicle Accidents 5.1 1.5 3.8
9 Diarrhoeal diseases 3.0 5.0 3.710 Genito-urinary diseases 3.6 3.2 3.5
All Other Remaining Causes 16.3 21.1 18.1Total 100.0 100.0 100.0
Urban Areas1 Cardiovascular diseases 38.9 34.1 37.22 Malignant and other Neoplasms 9.0 13.4 10.63 Digestive diseases 10.5 4.9 8.54 Respiratory diseases 5.6 6.3 5.95 Tuberculosis 5.3 3.9 4.86 Genito-urinary diseases 4.4 5.2 4.7
7Unintentional injuries: Motor Vehicle Accidents 5.2 1.9 4.0
8 Diabetes mellitus 2.9 4.7 3.5
9Unintentional injuries: Other Than Motor Vehicle Accidents 3.0 3.6 3.3
10Ill-defined/ All other symptoms,signs and abnormal clinical and laboratory findings 2.5 4.5 3.2All Other Remaining Causes 12.6 17.6 14.4Total 100.0 100.0 100.0
Table 3.7C: Top 10 Causes of Death in age 30-69 years in Rural & Urban Areas : 2010-2013
Rank Cause of Death Deaths (%)
Male Female Person
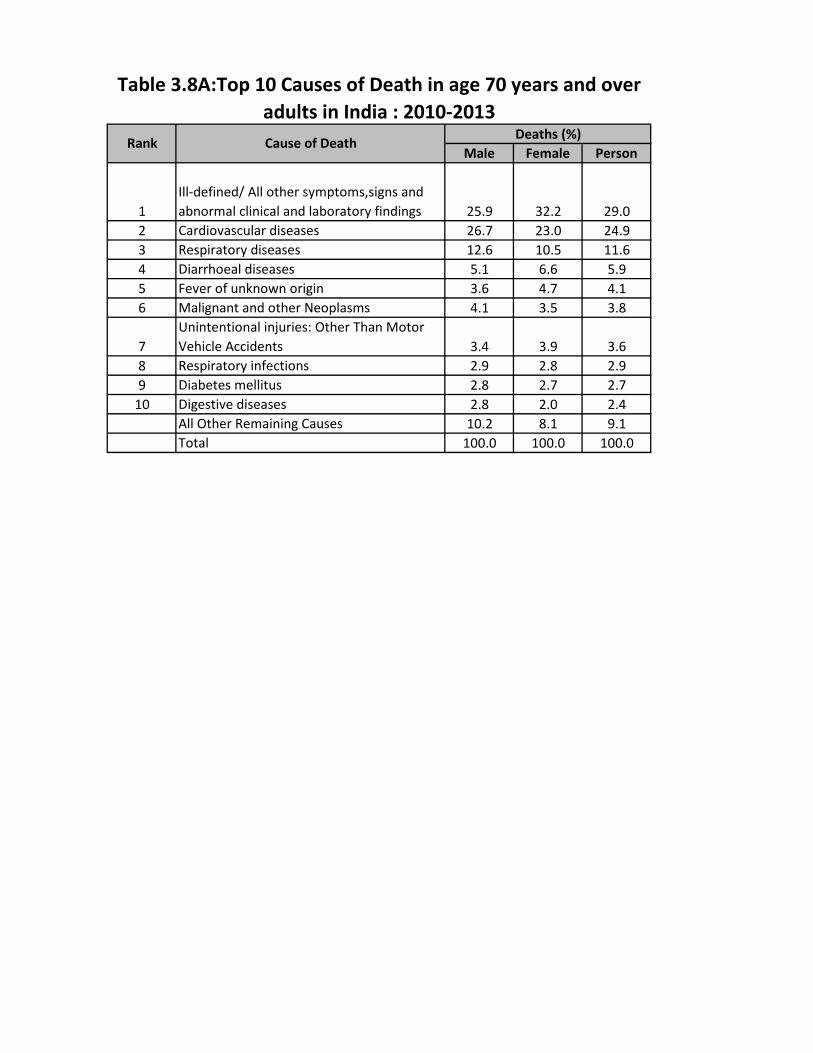
1Ill-defined/ All other symptoms,signs and abnormal clinical and laboratory findings 25.9 32.2 29.0
2 Cardiovascular diseases 26.7 23.0 24.93 Respiratory diseases 12.6 10.5 11.64 Diarrhoeal diseases 5.1 6.6 5.95 Fever of unknown origin 3.6 4.7 4.16 Malignant and other Neoplasms 4.1 3.5 3.8
7Unintentional injuries: Other Than Motor Vehicle Accidents 3.4 3.9 3.6
8 Respiratory infections 2.9 2.8 2.99 Diabetes mellitus 2.8 2.7 2.7
10 Digestive diseases 2.8 2.0 2.4All Other Remaining Causes 10.2 8.1 9.1Total 100.0 100.0 100.0
Table 3.8A:Top 10 Causes of Death in age 70 years and over adults in India : 2010-2013
Rank Cause of Death Deaths (%)
Male Female PersonEAG States & Assam
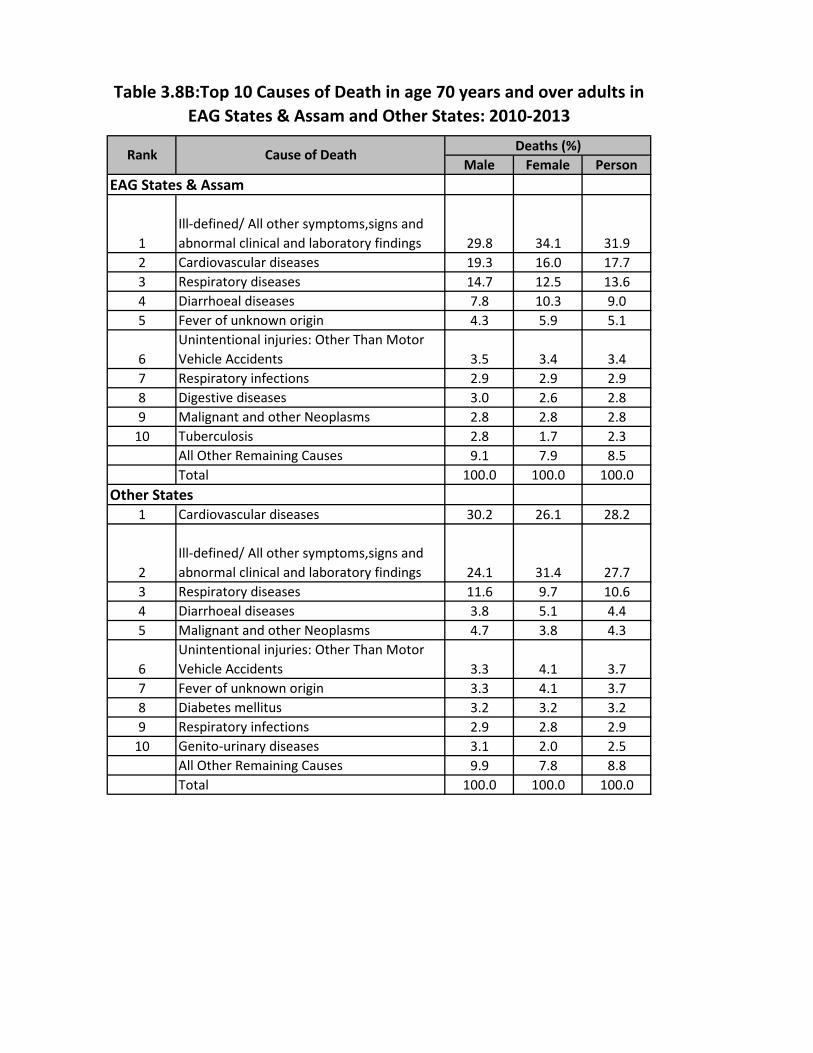
1Ill-defined/ All other symptoms,signs and abnormal clinical and laboratory findings 29.8 34.1 31.9
2 Cardiovascular diseases 19.3 16.0 17.73 Respiratory diseases 14.7 12.5 13.64 Diarrhoeal diseases 7.8 10.3 9.05 Fever of unknown origin 4.3 5.9 5.1
6Unintentional injuries: Other Than Motor Vehicle Accidents 3.5 3.4 3.4
7 Respiratory infections 2.9 2.9 2.98 Digestive diseases 3.0 2.6 2.89 Malignant and other Neoplasms 2.8 2.8 2.8
10 Tuberculosis 2.8 1.7 2.3All Other Remaining Causes 9.1 7.9 8.5Total 100.0 100.0 100.0
Other States 1 Cardiovascular diseases 30.2 26.1 28.2
2Ill-defined/ All other symptoms,signs and abnormal clinical and laboratory findings 24.1 31.4 27.7
3 Respiratory diseases 11.6 9.7 10.64 Diarrhoeal diseases 3.8 5.1 4.45 Malignant and other Neoplasms 4.7 3.8 4.3
6Unintentional injuries: Other Than Motor Vehicle Accidents 3.3 4.1 3.7
7 Fever of unknown origin 3.3 4.1 3.78 Diabetes mellitus 3.2 3.2 3.29 Respiratory infections 2.9 2.8 2.9
10 Genito-urinary diseases 3.1 2.0 2.5All Other Remaining Causes 9.9 7.8 8.8Total 100.0 100.0 100.0
Table 3.8B:Top 10 Causes of Death in age 70 years and over adults in EAG States & Assam and Other States: 2010-2013
Rank Cause of Death Deaths (%)

Male Female PersonRural Areas
1 Ill-defined/ All other symptoms,signs and abn 26.8 32.9 29.82 Cardiovascular diseases 24.7 21.7 23.23 Respiratory diseases 13.4 11.1 12.24 Diarrhoeal diseases 5.5 7.2 6.35 Fever of unknown origin 3.8 4.9 4.36 Malignant and other Neoplasms 3.9 3.3 3.67 Unintentional injuries: Other Than Motor Ve 3.4 3.8 3.68 Respiratory infections 3.0 2.9 2.99 Diabetes mellitus 2.6 2.4 2.5
10 Digestive diseases 2.7 2.0 2.3All Other Remaining Causes 10.3 8.1 9.2Total 100.0 100.0 100.0
Urban Areas1 Cardiovascular diseases 33.9 27.7 30.82 Ill-defined/ All other symptoms,signs and abn 22.7 29.9 26.33 Respiratory diseases 9.7 8.7 9.24 Malignant and other Neoplasms 4.8 4.3 4.55 Diarrhoeal diseases 3.6 4.7 4.16 Unintentional injuries: Other Than Motor Ve 3.4 4.4 3.97 Diabetes mellitus 3.6 3.6 3.68 Fever of unknown origin 2.9 4.0 3.59 Genito-urinary diseases 3.7 2.3 3.0
10 Respiratory infections 2.7 2.8 2.7All Other Remaining Causes 8.9 7.7 8.3Total 100.0 100.0 100.0
Table 3.8C-Top 10 Causes of Death in age 70 years and over adults in Rural & Urban Areas : 2010-2013
Rank Cause of Death Deaths (%)

Male Female PersonAll AgesCardiovascular diseases 25.1 20.8 23.3Malignant and other Neoplasms 5.8 6.6 6.1Diabetes mellitus 2.2 2.4 2.3Tuberculosis 4.5 2.8 3.7Malaria 1.7 2.3 2.0Maternal conditions 0.0 0.8 0.4HIV/AIDS 0.3 0.2 0.2Ages 30-69Cardiovascular diseases 33.4 29.2 31.8Malignant and other Neoplasms 8.7 12.7 10.2Diabetes mellitus 2.6 3.5 2.9Tuberculosis 6.9 4.9 6.1Malaria 1.6 2.5 2.0Maternal conditions 0.0 0.6 0.2HIV/AIDS 0.5 0.3 0.4
Table 4.1-Proportion of Deaths from Specific medical causes in India : 2010-2013
Cause of Death Deaths (%)

Male Female PersonEAG States & AssamAll AgesCardiovascular diseases 17.2 13.6 15.6Malignant and other Neoplasms 4.3 4.7 4.5Diabetes mellitus 1.7 1.4 1.5Tuberculosis 5.4 3.2 4.4Malaria 2.7 3.4 3.0Maternal conditions 0.0 1.3 0.6HIV/AIDS 0.1 0.1 0.1
Ages 30-69Cardiovascular diseases 25.9 22.2 24.4Malignant and other Neoplasms 7.4 9.8 8.3Diabetes mellitus 2.4 2.5 2.4Tuberculosis 9.4 6.0 8.0Malaria 3.0 4.2 3.5Maternal conditions 0.0 1.1 0.4HIV/AIDS 0.2 0.1 0.2
Other States All AgesCardiovascular diseases 29.4 24.9 27.5Malignant and other Neoplasms 6.6 7.7 7.0Diabetes mellitus 2.4 3.1 2.7Tuberculosis 4.0 2.6 3.4Malaria 1.2 1.7 1.4Maternal conditions 0.0 0.6 0.2HIV/AIDS 0.4 0.2 0.3
Ages 30-69Cardiovascular diseases 36.9 32.8 35.4Malignant and other Neoplasms 9.3 14.2 11.1Diabetes mellitus 2.6 4.1 3.2Tuberculosis 5.7 4.3 5.2Malaria 1.0 1.7 1.2Maternal conditions 0.0 0.3 0.1HIV/AIDS 0.6 0.4 0.5
Table 4.2- Proportion of Deaths from Specific medical causes in EAG States & Assam and Other States : 2010-2013
Cause of Death Deaths (%)

Male Female PersonRural AreasAll AgesCardiovascular diseases 23.2 19.4 21.5Malignant and other Neoplasms 5.5 6.3 5.9Diabetes mellitus 2.0 2.2 2.1Tuberculosis 4.7 2.9 3.9Malaria 1.9 2.5 2.1Maternal conditions 0.0 0.8 0.4HIV/AIDS 0.3 0.2 0.3
Ages 30-69Cardiovascular diseases 31.6 27.7 30.1Malignant and other Neoplasms 8.5 12.5 10.1Diabetes mellitus 2.5 3.2 2.7Tuberculosis 7.4 5.2 6.6Malaria 1.7 2.8 2.1Maternal conditions 0.0 0.6 0.2HIV/AIDS 0.5 0.4 0.5
Urban AreasAll AgesCardiovascular diseases 31.7 25.8 29.2Malignant and other Neoplasms 6.6 7.6 7.0Diabetes mellitus 2.7 3.4 3.0Tuberculosis 3.7 2.6 3.2Malaria 1.3 1.7 1.4Maternal conditions 0.0 0.7 0.3HIV/AIDS 0.2 0.1 0.2
Ages 30-69Cardiovascular diseases 38.9 34.1 37.2Malignant and other Neoplasms 9.0 13.4 10.6Diabetes mellitus 2.9 4.7 3.5Tuberculosis 5.3 3.9 4.8Malaria 1.2 1.6 1.3Maternal conditions 0.0 0.5 0.2HIV/AIDS 0.3 0.2 0.3
Table 4.3-Proportion of Deaths from Specific medical causes in Rural & Urban Areas : 2010-2013
Cause of Death Deaths (%)

Male Female Person1 Cardiovascular diseases 28.3 23.1 26.1
2
Ill-defined/ All other symptoms,signs and abnormal clinical and laboratory findings 9.3 14.7 11.6
3 Respiratory diseases 9.4 9.2 9.34 Malignant and other Neoplasms 6.6 7.9 7.25 Perinatal conditions 4.7 4.9 4.86 Digestive diseases 5.5 3.2 4.5
7Unintentional injuries: Motor Vehicle Accidents 6.1 1.4 4.1
8Unintentional injuries: Other Than Motor Vehicle Accidents 4.1 3.7 3.9
9 Respiratory infections 3.2 4.5 3.810 Diarrhoeal diseases 2.9 4.9 3.7
All Other Remaining Causes 20.0 22.6 21.1Total 100.0 100.0 100.0
Male Female Person1 Cardiovascular diseases 20.4 18.3 19.5
2
Ill-defined/ All other symptoms,signs and abnormal clinical and laboratory findings 8.5 12.4 10.1
3 Digestive diseases 10.8 5.4 8.64 Malignant and other Neoplasms 8.1 8.1 8.15 Respiratory diseases 5.5 5.9 5.76 Respiratory infections 4.9 6.3 5.57 Diarrhoeal diseases 4.4 6.5 5.38 Perinatal conditions 5.1 5.3 5.29 Tuberculosis 4.2 3.8 4.1
10 Malaria 3.7 4.0 3.8All Other Remaining Causes 24.6 24.0 24.3Total 100.0 100.0 100.0
Rank Cause of Death Deaths (%)
Table 5.1 A : Top 10 Causes of Death (All Ages): 2010-2013
Rank Cause of Death Deaths (%)
Table 5.1B : Top 10 Causes of Death (All Ages): 2010-2013

Male Female Person1 Cardiovascular diseases 25.1 22.4 23.9
2
Ill-defined/ All other symptoms,signs and abnormal clinical and laboratory findings 10.1 13.2 11.5
3 Diarrhoeal diseases 7.1 9.3 8.14 Perinatal conditions 6.9 7.1 7.05 Respiratory diseases 5.4 6.4 5.8
6Unintentional injuries: Other Than Motor Vehicle Accidents 5.4 5.1 5.3
7 Digestive diseases 5.6 4.8 5.28 Malignant and other Neoplasms 4.7 5.1 4.99 Respiratory infections 4.2 4.2 4.2
10 Tuberculosis 4.3 2.6 3.5All Other Remaining Causes 21.1 19.9 20.5Total 100.0 100.0 100.0
Male Female Person1 Cardiovascular diseases 15.5 11.6 13.8
2
Ill-defined/ All other symptoms,signs and abnormal clinical and laboratory findings 11.8 16.4 13.8
3 Diarrhoeal diseases 11.4 9.1 10.44 Perinatal conditions 8.8 9.2 9.05 Respiratory diseases 5.7 6.8 6.2
6Unintentional injuries: Other Than Motor Vehicle Accidents 4.9 6.4 5.6
7 Digestive diseases 5.1 5.0 5.08 Malignant and other Neoplasms 4.6 4.9 4.79 Respiratory infections 5.6 3.4 4.6
10 Tuberculosis 3.8 5.6 4.6All Other Remaining Causes 22.9 21.7 22.4Total 100.0 100.0 100.0
Table 5.1C : Top 10 Causes of Death (All Ages): 2010-2013
Rank Cause of Death Deaths (%)
Table 5.1D : Top 10 Causes of Death (All Ages): 2010-2013
Rank Cause of Death Deaths (%)

Male Female Person1 Cardiovascular diseases 26.2 21.5 24.2
2
Ill-defined/ All other symptoms,signs and abnormal clinical and laboratory findings 9.3 16.8 12.5
3 Respiratory diseases 8.0 8.5 8.24 Malignant and other Neoplasms 5.8 7.1 6.35 Digestive diseases 7.2 2.8 5.36 Tuberculosis 5.7 3.8 4.97 Perinatal conditions 4.6 4.8 4.7
8Unintentional injuries: Other Than Motor Vehicle Accidents 4.8 4.4 4.6
9 Respiratory infections 3.4 4.1 3.710 Diarrhoeal diseases 3.0 4.2 3.5
All Other Remaining Causes 22.1 22.0 22.1Total 100.0 100.0 100.0
Male Female Person1 Cardiovascular diseases 31.1 25.3 28.6
2
Ill-defined/ All other symptoms,signs and abnormal clinical and laboratory findings 9.9 16.9 12.9
3 Malignant and other Neoplasms 6.3 7.8 6.94 Respiratory diseases 6.8 6.5 6.7
5Unintentional injuries: Other Than Motor Vehicle Accidents 4.8 4.8 4.8
6 Intentional injuries: Suicide 4.8 4.2 4.57 Digestive diseases 5.3 2.3 4.08 Diarrhoeal diseases 2.9 5.3 3.99 Genito-urinary diseases 3.8 3.0 3.5
10 Diabetes mellitus 3.0 3.8 3.3All Other Remaining Causes 21.5 20.2 20.9Total 100.0 100.0 100.0
Rank Cause of Death Deaths (%)
Table 5.1E : Top 10 Causes of Death (All Ages): 2010-2013
Rank Cause of Death Deaths (%)
Table 5.1F : Top 10 Causes of Death (All Ages): 2010-2013

Male Male % Female Female % Person Person %0-1 1197 8.7 971 10.1 2168 9.31-4 198 1.4 221 2.3 419 1.80-4 1395 10.2 1192 12.4 2587 11.1
5-14 181 1.3 158 1.6 339 1.515-29 1006 7.3 697 7.2 1703 7.330-34 441 3.2 193 2.0 634 2.735-44 1102 8.0 452 4.7 1554 6.745-54 1656 12.1 697 7.2 2353 10.155-69 3223 23.5 2151 22.3 5374 23.070+ 4709 34.3 4089 42.5 8798 37.7
Total 13713 100.0 9629 100.0 23342 100.0
Male Male % Female Female % Person Person %0-1 826 10.4 629 11.2 1455 10.71-4 147 1.9 152 2.7 299 2.20-4 973 12.3 781 13.9 1754 13.0
5-14 176 2.2 147 2.6 323 2.415-29 601 7.6 461 8.2 1062 7.830-34 325 4.1 160 2.8 485 3.635-44 775 9.8 357 6.4 1132 8.445-54 1033 13.0 511 9.1 1544 11.455-69 1799 22.7 1211 21.6 3010 22.270+ 2243 28.3 1990 35.4 4233 31.3
Total 7925 100.0 5618 100.0 13543 100.0
Male Male % Female Female % Person Person %0-1 2561 12.4 2151 12.4 4712 12.41-4 460 2.2 470 2.7 930 2.40-4 3021 14.6 2621 15.1 5642 14.8
5-14 488 2.4 407 2.3 895 2.415-29 1196 5.8 1139 6.5 2335 6.130-34 520 2.5 351 2.0 871 2.335-44 1392 6.7 840 4.8 2232 5.945-54 2077 10.0 1212 7.0 3289 8.655-69 5283 25.5 4304 24.7 9587 25.270+ 6718 32.5 6523 37.5 13241 34.8
Total 20695 100.0 17397 100.0 38092 100.0
Table 5.2A: Distribution of Deaths by Age and Gender , 2010-2013;
Age Group Deaths (%)
Table 5.2C: Distribution of Deaths by Age and Gender, 2010-2013;
Age Group Deaths (%)
Table 5.2B: Distribution of Deaths by Age and Gender , 2010-2013;
Age Group Deaths (%)

Male Male % Female Female % Person Person %0-1 3171 16.2 2732 18.3 5903 17.11-4 682 3.5 734 4.9 1416 4.10-4 3853 19.6 3466 23.3 7319 21.2
5-14 535 2.7 503 3.4 1038 3.015-29 1488 7.6 1269 8.5 2757 8.030-34 549 2.8 331 2.2 880 2.635-44 1423 7.2 718 4.8 2141 6.245-54 1898 9.7 855 5.7 2753 8.055-69 4391 22.4 2960 19.9 7351 21.370+ 5495 28.0 4801 32.2 10296 29.8
Total 19632 100.0 14903 100.0 34535 100.0
Male Male % Female Female % Person Person %0-1 1105 8.4 842 8.4 1947 8.41-4 192 1.5 160 1.6 352 1.50-4 1297 9.8 1002 10.0 2299 9.9
5-14 182 1.4 150 1.5 332 1.415-29 834 6.3 585 5.9 1419 6.130-34 415 3.1 174 1.7 589 2.535-44 1147 8.7 432 4.3 1579 6.845-54 1585 12.0 688 6.9 2273 9.855-69 3400 25.8 2431 24.4 5831 25.270+ 4330 32.8 4515 45.3 8845 38.2
Total 13190 100.0 9977 100.0 23167 100.0
Male Male % Female Female % Person Person %0-1 1493 5.2 1207 5.6 2700 5.41-4 241 0.8 224 1.0 465 0.90-4 1734 6.1 1431 6.6 3165 6.3
5-14 250 0.9 205 0.9 455 0.915-29 1568 5.5 1157 5.3 2725 5.430-34 824 2.9 400 1.8 1224 2.435-44 2336 8.2 984 4.5 3320 6.645-54 3656 12.8 1526 7.1 5182 10.355-69 8330 29.2 5872 27.1 14202 28.370+ 9814 34.4 10061 46.5 19875 39.6
Total 28512 100.0 21636 100.0 50148 100.0
Table 5.2D: Distribution of Deaths by Age and Gender, 2010-2013;
Age Group Deaths (%)
Table 5.2F: Distribution of Deaths by Age and Gender , 2010-2013;
Age Group Deaths (%)
Table 5.2E: Distribution of Deaths by Age and Gender , 2010-2013;
Age Group Deaths (%)

ANNEXURE - 1Neonatal Classification (Deaths in Age 0-28 Days) (Classification List 2)
Disease ICD 10 rangeCommunicable, perinatal and nutritional conditions
Neonatal_Infections:Neonatal Pneumonia A37, H65-H68, H70, H71, J00-J22, J32, J36, J85, J86, P23, U04Sepsis A20-A28, A32, A38, A40-A44, A46, A48, A49, A68-A70, A74, A75, A77-A79, B95, B96, H10, H60, I30, I32-I33, I39-I41, K65, K67, K81, L00-L04,L08, M00-M01, M60,
M86, N10, N30, N34, N41, N49, N61, P35-P39Meningitis/encephalitis A39, A81-A89, G00-G09
Other communicable diseasesDiarrhoeal diseases A00-A09Tetanus A33-A35Poliomyelitis A80, B91Measles B01, B05Malaria B50-B54Other infectious and parasitic diseases A15-A19, A30-A31, A36, A50-A67, A71, A90-A99, B00, B02-B04, B06-B09, B15-B27, B30, B33-B49, B55--B60, B64-B83,B85-B90, B92, B94, B97, B99, J65, K04, K05,
K61, N70-N74, R75, U00, Y95Fever of unknown origin R50
Perinatal conditionsPrematurity & low birthweight P01, P05, P07, P22, P25-P28, P52, P61, P77, R04Birth asphyxia & birth trauma P00, P02, P03. P10-P15, P20, P21, P24, P29, P50, P90, P91
Other conditionsCongenital anomalies G10-G99, Q00-Q99Nutritional diseases D50-D53, E00-E02, E40-E46, E50-E56, E59-E61, E63, E64, X53-X54
Non Communicable diseasesOther noncommunicable diseases
Other noncommunicable diseases C00-C97, D01-D48, D55-D89, E03-E35, E65-E90, F00-F99, H00-H06, H11-H59, H61-H62, H69, H72-H95, I00-I28, I31, I34-I38, I42-I99, J30, J31, J33-J35, J37-J47, J60, J64, J66-J70, J80-J82, J84, J90-J99, K00-K03, K06-K60, K62-K63, K70-K80, K82-K93, L05, L10-L99, M02-M54, M61-M85, M87-M99, N00-N08, N11-N29, N31-N33, N35-N40, N42-N48, N50-N51, N60, N62-N64, N75-N99, P04, P08, P51, P53-P60, P70-P72, P74-P76, P78, P80-P83, P92-P94, R00, R01, R03, R05, R06, R11-R23,R26, R27, R29-R36, R39-R49, R55, R56, R59, R63, R70-R74, R76-R77, R80-R82, R84-R87, R90, R91
InjuriesInjuries
Injuries S00-S99, T00-T98, V01-V99, W00-W99, X00-X52, X57-X99, Y00-Y91, Y97-Y98Ill-defined conditions
Ill defined or cause unknown Ill defined or cause unknown P96, R02, R07, R09, R10, R25, R51-R54, R57-R58, R60-R62, R64, R68, R69, R78, R79, R83, R89, R92-R99
Child age <29 days Neonatal mortality Classification (Deaths in Age < 29 days)

ANNEXURE - 2Child age 1-59 month mortality (Classification list 3)
Disease ICD 10 range
Pneumonia A37, H65-H68, H70, H71, J00-J22, J32, J36, J85, J86, P23, U04Acute bacterial sepsis and severe infections A20-A28, A32, A38, A40-A44, A46, A48, A49, A68-A70, A74, A75, A77-A79, B95, B96, H10, H60, I30, I32, I33, I39-I41, K65, K67, K81, L00-
L04,L08, M00-M01, M60, M86, N10, N30, N34, N41, N49, N61, P36, P38Meningitis/encephalitis A39, A81-A89, G00-G09
Diarrhoeal diseases A00-A09Tuberculosis A15-A19, B90, J65Tetanus A33-A35Poliomyelitis A80, B91Measles B01, B05HIV/AIDS B20-B24, R75Malaria B50-B54Other infectious and parasitic diseases A30, A31, A36, A50-A67, A71, A90-A99, B00, B02-B04, B06-B09, B15-B19, B25-B27, B30, B33-B49, B55--B60, B64-B83,B85-B89, B92, B94,
B97, B99, K02, K04, K05, K61, N70-N74, P35, P37, P39, U00, Y95Fever of unknown origin R50
Prematurity & low birth weight P01, P05, P07, P22, P25-P28, P52, P61, P77Birth asphyxia & birth trauma P00, P02, P03. P10-P15, P20, P21, P24, P29, P50, P90, P91
Nutritional diseases D50-D53, E00-E02, E40-E46, E50-E56, E59-E61, E63, E64, X53-X54Congenital anomalies Q00-Q07, Q10-18, Q20-Q28, Q30-Q45, Q50-56, Q60-Q87, Q89-Q93, Q95, Q96-Q99
Other noncommunicable diseases C00-C97, D01-D48, D55-D89, E03-E35, E65-E90, F00-F99, G10-G99, H00-H06, H11-H59, H61-H62, H69, H72-H95, I00-I28, I31, I34-I38, I42-I99, J30, J31, J33-J35, J37-J47, J60, J64, J66-J70, J80-J82, J84, J90-J99, K00-K01,K03, K06-K60, K62-K63, K70-K80, K82-K93, L05, L10-L99, M02-M54, M61-M85, M87-M99, N00-N08, N11-N29, N31-N33, N35-N40, N42-N48, N50-N51, N60, N62-N64, N75-N99, P04, P08, P51,P53-P60, P70-P72, P74-P76, P78, P80-P83, P92-P94, R00, R01, R03-R05, R06, R11-R23, R26, R27, R29-R49, R55-R56, R59, R63,R70-R74, R76-R77, R80-R82, R84-R87, R90-R91
Injuries S00-S99, T00-T98, V01-V99, W00-W99, X00-X52, X57-X99, Y00-Y91, Y97-Y98.
Ill defined or cause unknown P96, R02, R07, R09, R25, R51-R54, R57-R58, R60-R62, R64, R68, R69, R78, R79, R83, R89, R92-R99
Other communicable diseases
Child age 1-59 month Classification (Deaths in Age 1-59 month)
Communicable, perinatal and nutritional conditionsEarly childhood infections
Ill-defined conditionsIll defined or cause unknown
Perinatal conditions
Other conditions
Non Communicable diseasesOther noncommunicable diseases
InjuriesInjuries

Classification List- 1 (Deaths in age 5 year and above)Disease ICD 10 range
Communicable, maternal, perinatal and nutritional conditionsTuberculosis A15-A19,B90,J65HIV/AIDS B20-B24,C46,D84,R75Diarrhoeal diseases A00-A09Malaria B50-B54Selected tropical diseases A30,A71,A90-A99,B55-B58,B60-B83,B92Respiratory infections H65-H68,H70-H71,J00-J22,J32,J36,J85-J86,P23,U04
Acute bacterial sepsis & severe InfectionsA20-A28,A32,A38,A40-A49,A68,A70,A74-A79,B95-B96,H10,H60,I30,I32-I33,I39-I41,K02,K04-K05,K61,K65,K67,K81,L00-L04,L08,M00-M01,M60,M86,N10,N30,N34,N41,N49,N61,P36-P39,U80-U89
Other infectious and parasitic diseases A31,A33,A35-A37,A39,A50-A67,A69,A80-A89,B00,B01-B09,B15-B17,B19,B25-B49,B59,B85-B89,B91,B94,B97-B99,G00-G09,N70-N74,P35,Y95Maternal conditions O00-O99,A34,F53Perinatal conditions P00-P22,P24-P29,P50-P96,R95,R96**Nutritional deficiencies D50-D53,D64,E00-E02,E40-E46,E50-E64,X53-X54Fever of unknown origin R50
Non-communicable diseasesMalignant and other Neoplasms C00-C45,C47-C97,D00-D48,N60,N62-N64,N87,R59Diabetes mellitus E10-E14Neuro-psychiatric conditions F00-F09,F11-F52,F54-F99,G10-G44,G47-G80,G90-G99,R26-R29,R40-R49,R56,R90Cardiovascular diseases G45-G46,G81-G83,I00-I28,I31,I34-I38,I42-I84,I86-I99,R00-R01,R03,R55,R96**Respiratory diseases J30-J31,J33-J35,J37-J64,J66-J84,J90-J99,R04-R06,R84,R91Digestive diseases B18,F10,I85,K20-K60,K62-K63,K66,K70-K80,K82-K93,R10-R19,R63,R85,X45,Y15,Y90,Y91Genito-urinary diseases N00-N08,N11-N29,N31-N33,N35-N40,N42-N48,N50-N51,N75-N86,N88-N99,R30-R39,R80,R82,R86,R87Congenital anomalies Q00-Q99
Other Non-Communicable DiseasesD55-D63,D65-D83,D86-D89,E03-E07,E15-E16,E20-E35,E65-E90,H00-H06,H11-H59,H61-H62,H69,H72-H95,K00-K01,K03,K06-K14,L05,L10-L99,M02-M54,M61-M85,M87-M99,R20-R23,R70-R74,R76-R77,R81
InjuriesUnintentional injuries: Motor Vehicle Accidents V01-V89Unintentional injuries: Other Than Motor Vehicle Accidents V90-V98,W00-W99,X00-X44,X46-X52,X57-X59,Y40-Y89Intentional injuries: Suicide X60-X84Intentional injuries: Other Than Suicide X85-Y09,Y35,Y36Injuries of Undetermined Intent Y10-Y14,Y16-Y34,Y96-Y98
Ill-defined/ All other symptoms,signs and abnormal clinical and laboratory findings R02,R07-R09,R25,R51-R54,R57-R58,R60-R62,R64-R69,R78-R79,R83,R89,R92-R94,R96**,R98-R99
Note: ** R96 - Sudden deaths are in 'perinatal conditions' (when age<1 year),in 'Cardiovascular diseases' (when age>30 year) and else in 'ill-defined conditions'
ANNEXURE-3
Symptoms, signs and Ill-defined conditions