a hybrid wavelet and time plane based method for qt...
TRANSCRIPT

J. Biomedical Science and Engineering, 2009, 2, 280-286 doi: 10.4236/jbise.2009.24042 Published Online August 2009 (http://www.SciRP.org/journal/jbise/
JBiSE ).
Published Online August 2009 in SciRes. http://www.scirp.org/journal/jbise
A hybrid wavelet and time plane based method for QT interval measurement in ECG signals
Swanirbhar Majumder1, Saurabh Pal2, Sidhartha Dhar1, Abhijit Sinha1, Abhijit Roy1 1Dept of ECE, NERIST (Deemed University), Arunachal Pradesh, India, 2Haldia Institute of Technology, Haldia, West Bengal, India. Email: [email protected], [email protected], [email protected], [email protected], [email protected] Received 29 March 2009; revised 25 April 2009; accepted 6 May 2009.
ABSTRACT
Here we present a method of QT interval meas-urement for Physionet's online QT Challenge ECG database using the combination of wavelet and time plane feature extraction mechanisms. For this we mainly combined two previous works one done using the Daubechies 6 wavelet and one time plane based with modifications in their algorithms and inclusion of two more wavelets (Daubechies 8 and Symlet 6). But found that out of these three wavelets Daube-chies 6 and 8 gives the best output and when averaged with the interval of time plane feature extraction method it gives least percentage of error with respect to the median reference QT interval as specified by Physionet. Our modified time plane feature extraction scheme along with the wavelet method together produces best re-sults for automated QT wave measurement as its regular verification is important for analyzing cardiac health. For the V2 chest lead particularly whose QT wave is of tremendous significance we have tested on 530 recordings of Physionet. This is because delay in cardiac repolarization causes ventricular tachyarrhythmias as well as Torsade de pointes (TdP). A feature of TdP is pronounced prolongation of the QT interval in the supraventricular beat preceding the ar-rhythmia. TdP can degenerate into ventricular fibrillation, leading to sudden death. Keywords: ECG; QT; Physionet; TdP
1. INTRODUCTION
The QT interval is measured as the time interval be-tween the onset of the QRS complex and the end of the T wave. At the end of the T wave repolarisation is com-pleted and the T wave voltage amplitude returns to the baseline [1]. The QT interval is thus a measure of the duration of the ventricular depolarisation and repolariza-
tion. Some error may introduce in the QT interval meas-urement due to the fact that it may not return back to the base line or it may go below the base line along with the onset of U wave occasionally.
Many drugs prolong cardiac repolarization which in turn increases the QT interval. This might lead to ven-tricular arrhythmia as severe as torsade de pointes (TdP) in some critical cases [2,3]. Hence accurate measurement of the QT interval is very important for intensive cardiac care and also for pharmaceutical in-dustry. A statistically significant increase in the mean QT interval (corrected for heart rate) as small as 6 mil-liseconds between baseline and maximal drug effect may be important as a signal of repolarization abnor-mality [4]. QT intervals can be detected manually, but these are not so accurate as well as not repeatable in general. Still we compare our results with the ‘gold standard’ reference QT measurements taken from the Physionet challenge 2006 because these were very precisely taken to build the database for the challenge so that the participants could compare their algorithms with the manual methods. Rather automatic QT inter-val measurement techniques are more accurate and reproducible, except for the experience of the physi-cian/doctor giving some extra suggestions which may be beneficial in some particular special cases on ne-glecting the time factor [5,6]. Moreover if a bit of adaptiveness can be added to it via trained neural net-work it might be a great effort. Many researchers have performed several fundamental works on determina-tion of QT interval along with other characteristic waves. Yan Sun et al. have proposed a multiscale morphological derivative (MMD) transform-based singularity detector for the detection of fiducial points in ECG signal, where these points are related to the characteristic waves such as the QRS complex, P wave and T wave [7]. Laguna P, Jane R, Caminal P have developed a method where the intervals of clinical importance can be detected by a multilead QRS detec-tor that locates each beat, using a differentiated and low-pass filtered ECG signal as input and the wave-form boundaries are located in each lead.

S. Majumder et al. / J. Biomedical Science and Engineering 2 (2009) 280-286 281
SciRes Copyright © 2009 JBiSE
Later in their wavelet based method of QT interval measurement Mahmoodabadi et al [8] evaluated the MIT-BIH database using the multiresolution wavelet for the modified lead II (MLII) and found that Daubechies 6 works the best. Here a slightly modified wavelet algo-rithm was applied on the V2 chest lead specifically, for 530 recording of the Physionet database using wavelets daubechies 6 and 8 as well as symlet 6. The choices of these wavelets were based on a huge amount of trial and error carried out on the group of inbuilt wavelets present under MATLAB® and comparing their mean square error with those of ‘gold standard’. Later we found that Daubechies 6 gives the least error of the three and for the time plane features we found that using our modified time plane feature detection [9] method we have ap-proximately similar percentage of error as the Daube-chies 6 but in the opposite direction. So averaging both of these methods and combining we have less than 1% error in total while for the case of individual data the error percentage is within +10% to -7% from the ad-justed reference herewith.
2. WAVELET FEATURE EXTRACTION The flowchart for the wavelet analysis is shown in Fig-ure 1. Here, we have used the technique devised by Mahmoodabadi et al. [8], for the automated feature ex-traction of the ECG Signals using Wavelet Domain. The algorithms are applied directly at one run over the whole digitized ECG signal which are saved as .mat files pro-vided by Physionet as in Figure 2.
There are actually four separate algorithms, each of which is designated to extract certain features of the ECG signal. The description of the ECG feature extrac-
tion algorithm is shown in the Figure 2. First, the peak of the QRS complex with its high dominated amplitude in the signal is detected. Then Q and S waves are de-tected. The Zero voltage level of the signal is found next. The last step includes the calculation of the onset and offset of the P wave.
Peak of the R waves in signals from the lead have the largest amplitudes among other leads. In order to detect the peaks, specific details of the signal were selected. Details D3-D5 were kept and all the other details were removed. This procedure removes low frequencies and high frequencies. The attained signal samples were then squared. High amplitude transitions of the signal were then more noticeable, even if R peaks are deformed.
Then a practically lower limit is applied on the signal to remove unrelated noisy peaks. Because no subsequent beats happen less than 25 second, pseudo-beats are also removed. Detection of R peaks is very important be-cause they define the cardiac beats and the exactness of all forthcoming detections is dependent on this.
Q and S peaks occur about the R peak with in 0.1 second. In order to make the peaks noticeable, all the details of the signal were removed up to detail D5. The approximation signal remained, was searched for ex-tremum points about the R peaks formerly detected. The left point denoted the Q peak and the right one denotes the S peak. A normal QRS complex indicates that the electrical impulse has progressed normally from the bundle of His to the Purkinje network through the right and left bundle branches and that normal de-polarization of the right and left ventricles has oc-curred.
Figure 1. Wavelet feature extraction method.

282 S. Majumder et al. / J. Biomedical Science and Engineering 2 (2009) 280-286
SciRes Copyright © 2009 JBiSE
Figure 2. ECG feature extraction algorithm.
Although one might think that the electrocardiograph machines for recording electrocardiograms could deter-mine when no current is flowing around the heart. However, many stray currents exist in the body, such as currents resulting from skin potentials and from differ-ences in ionic concentrations in different parts of the body. These stray currents make it impossible for one to predetermine the exact zero reference level in the elec-trocardiogram. At the end of the QRS complex, no cur-rent is flowing around the heart. Even the current of in-jury disappears at this point and the potential of the elec-trocardiogram at this instant is zero.
This point is known as the J point. Most people, how-ever, are conditioned to consider the TP segment of the electrocardiogram as the reference level rather than the J point which is much easier to be found correctly. By experiment we found that the voltage at this level is
closely equal to the zero crossing of the approximation signal, keeping details D1-D5, before the Q peak. There is another zero crossing after the S peak. Comparing these two points is essential for detecting current of in-jury and ST segment shift.
These waves are more noticeable when keeping de-tails D4-D8. At these levels, lower frequencies and high frequency ripples of the signal are removed. The ex-tremes of the signal before and after the zero crossings about each R peak which are formerly detected denote P and T peaks. Zero crossings of the signal about the P and T peaks which were detected are the onset and offset points of the waves, respectively.
3. TIME PLANE FEATURE EXTRACTION
The flowchart for the time plane analysis is shown below. Here, we have used the techniques devised by Mitra M, Pal S and Majumder S [2], for the automated feature extraction of the ECG Signals using time domain analy-sis after some amount of modification in their algorithm which was not robust. The algorithms are applied di-rectly at one run over the whole digitized ECG signal which are saved as. mat files provided by Physionet. Like the Wavelet Analysis here also we have four dif-ferent steps for the different features for extraction. The flow diagrams of the steps are given in Figure 3. So we take one feature at a time to go for the extraction.
Figure 3. Time plane based feature extraction method.

S. Majumder et al. / J. Biomedical Science and Engineering 2 (2009) 280-286 283
SciRes Copyright © 2009 JBiSE
The R wave detection step is the first and the most
important step of the entire analysis procedure. First from the many R peaks available one in the middle has to be detected. For this a part of the absolute differenti-ated wave [12,13] is taken and the maximum point in that interval is calculated using the MATLAB® sorting. Here for differentiation we use the fivepoint differentia-tion equation given in Equation (1). The interval should be chosen such that it is smaller than the value of the RR interval. The corresponding value of the differentiated wave at this point is calculated and a conditional loop is initiated to find out whether it is negative or positive. This step is the very important as the rest of the analysis depends on it. Depending upon what the value comes out to be, the lowest point to the left or to the right of the peak is calculated. This point is the R point.
' ( 2 ) 8 ( ) 8 ( ) ( 2 )( )
12
f x h f x h f x h f x hf x
h
(1) Then we go for the detection of the Q point. The
proper detection of the R peak above step is very impor-tant here. After getting the R peak point, the highest point to the left of the R value in the absolute differenti-ated wave is found out. This point is stored in the mem-ory as the temporary Q point. From this point as a refer-
ence the lowest point to the left of this point is again calculated. This point is the Q point.
For the detection of the S point on the wave the pro-cedure is the same as that for the Q wave detection. Here too the proper detection of the R peak is very important. After getting the R peak point, the highest point to the right of the R value in the absolute differentiated wave is found out. This point is stored in the memory as tempo-rary S point. From this point as a reference the lowest point to the right of this point is again calculated. This point is the S point.
The final step is the detection of the T wave peak and the T wave offset points. For this step to be successful, the correct S point detection is a must. Taking the S point detected above, the highest point on the differenti-ated wave to the right of the signal is calculated. This point is marked as the T wave peak point. To get the point of T peak offset, the value of the differentiated wave at each point to the right of the T peak point is found out and that point where the value becomes less than 0.1 is taken as the T peak offset point.
4. SIMULATION OF THE METHODS
Both the methods of wavelet and time plane based were programmatically linked with a GUI (Figure 4) where
Figure 4. Graphical User Interface (GUI).
284 S. Majumder et al. / J. Biomedical Science and Engineering 2 (2009) 280-286
SciRes Copyright © 2009 JBiSE
for wavelet analysis we can select the wavelet and then get the values of the intervals of RR and QT.
Later using Eqs. (2) and (3) get QTc from QT interval and the heart rate from RR interval. Here firstly the “Load Data” button presents the user with a dialog to select the appropriate signal from the database. The “Clear Data” Button clears the cache after the execution of the program is complete. After the data is loaded the control can be passed to either the Wavelet or the Time Analysis. The Wavelet part contains additional buttons for selecting the different wavelet families “db6” for Daubechies 6, “db8” for Daubechies 8 and “sym6” for Symlet 6. Pressing any one of them starts the analysis procedure and after the completion of the analysis the original waveform is displayed.
To get the value of the QT Interval the button “QT In-terval” is pressed. The QT waveform is displayed and the value of the interval is made available at the corre-sponding text box. The “QTc Interval” button displays the value of the modified QT according to the regression based approach.
The exact method which has been implemented here is that developed by Sagie et al., [14] as given in Eq. (2) below.
QTc= QT + 0.154(1 − RR) (2)
The RR Interval which is important in the sense that it defines the cardiac beat cycle can be obtained by press-ing the “RR Interval” button on the GUI which displays the R to R waveform. Along with that the value of the interval is displayed in the corresponding text box of wavelet based or time plane based side as per the tech-nique selected. To get the heart rate of the patient the button “Heart Rate” is pressed and the calculated value of the heart rate of the patient is displayed in the corre-sponding text box using Eq. (3) [15] below.
Heart Rate = 60
RR (3)
The final button is the “Full Wave Graph” display but-ton. This button displays the entire ECG wave over a full cardiac cycle.
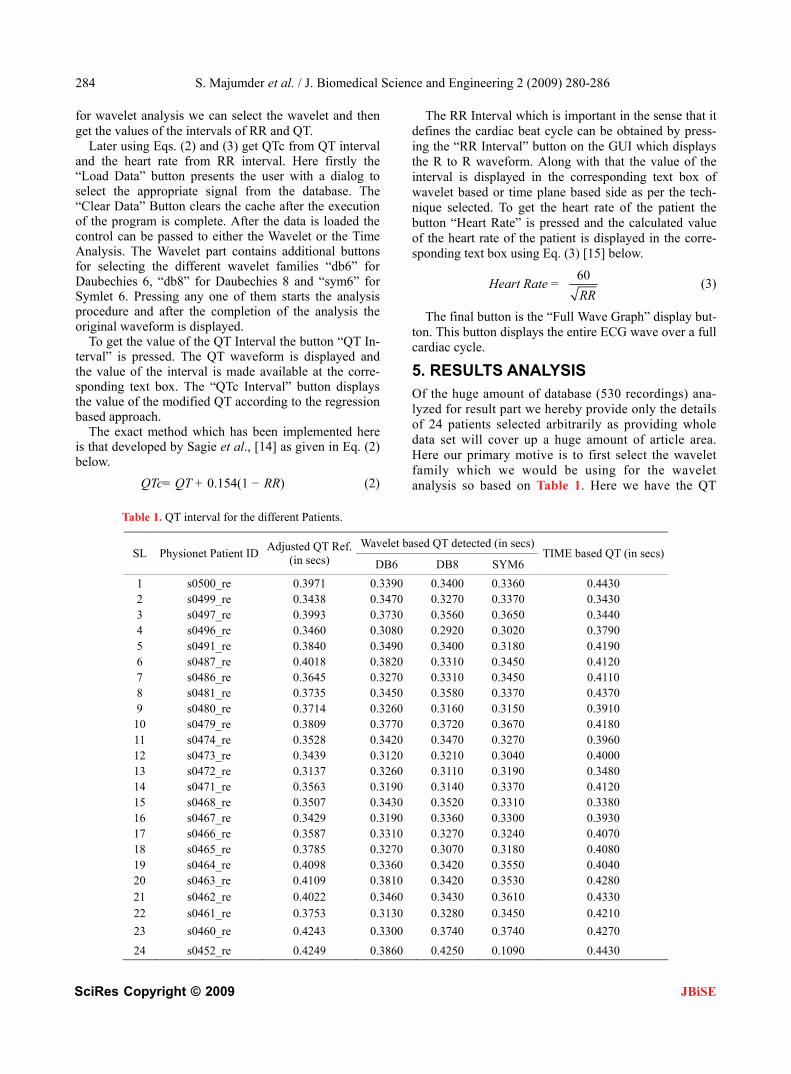
5. RESULTS ANALYSIS Of the huge amount of database (530 recordings) ana-lyzed for result part we hereby provide only the details of 24 patients selected arbitrarily as providing whole data set will cover up a huge amount of article area. Here our primary motive is to first select the wavelet family which we would be using for the wavelet analysis so based on Table 1. Here we have the QT
Table 1. QT interval for the different Patients.
Wavelet based QT detected (in secs)SL Physionet Patient ID
Adjusted QT Ref. (in secs) DB6 DB8 SYM6
TIME based QT (in secs)
1 s0500_re 0.3971 0.3390 0.3400 0.3360 0.4430 2 s0499_re 0.3438 0.3470 0.3270 0.3370 0.3430 3 s0497_re 0.3993 0.3730 0.3560 0.3650 0.3440 4 s0496_re 0.3460 0.3080 0.2920 0.3020 0.3790 5 s0491_re 0.3840 0.3490 0.3400 0.3180 0.4190 6 s0487_re 0.4018 0.3820 0.3310 0.3450 0.4120 7 s0486_re 0.3645 0.3270 0.3310 0.3450 0.4110 8 s0481_re 0.3735 0.3450 0.3580 0.3370 0.4370 9 s0480_re 0.3714 0.3260 0.3160 0.3150 0.3910
10 s0479_re 0.3809 0.3770 0.3720 0.3670 0.4180 11 s0474_re 0.3528 0.3420 0.3470 0.3270 0.3960 12 s0473_re 0.3439 0.3120 0.3210 0.3040 0.4000 13 s0472_re 0.3137 0.3260 0.3110 0.3190 0.3480 14 s0471_re 0.3563 0.3190 0.3140 0.3370 0.4120 15 s0468_re 0.3507 0.3430 0.3520 0.3310 0.3380 16 s0467_re 0.3429 0.3190 0.3360 0.3300 0.3930 17 s0466_re 0.3587 0.3310 0.3270 0.3240 0.4070 18 s0465_re 0.3785 0.3270 0.3070 0.3180 0.4080 19 s0464_re 0.4098 0.3360 0.3420 0.3550 0.4040 20 s0463_re 0.4109 0.3810 0.3420 0.3530 0.4280 21 s0462_re 0.4022 0.3460 0.3430 0.3610 0.4330 22 s0461_re 0.3753 0.3130 0.3280 0.3450 0.4210
23 s0460_re 0.4243 0.3300 0.3740 0.3740 0.4270
24 s0452_re 0.4249 0.3860 0.4250 0.1090 0.4430

S. Majumder et al. / J. Biomedical Science and Engineering 2 (2009) 280-286 285
SciRes Copyright © 2009 JBiSE
interval for 24 patients as detected by the three wave-lets and the time plane. As per error calculations we found that the average error with respect to the ad-justed reference [11] we have for “db6” 8.8%, “db8” 9.51%, for “sym6” 12.23% and for “time” -7.43% as per the data of 24 patients given in Table 1 while for the whole set of 530 patients we have for “db6”, “db8”, “sym6” and “time” error percentages 8.7483%, 8.9034%, 10.7794% and -7.157% respectively. Thus among the wavelet family “db6” gives least error strengthening findings of Mahmoodabadi et al along with it is “db8” but inspite of the nearby percentage of error as its type 6 variant still the fluctuations are more in this case as it can be viewed from the graphical representation. But the main important part of the analysis of Table 1 is that the time plane error and db6/db8 error complement each other very well so we average them and use the value.
50 100 150 200 250 300 350 400 450 500
-10
0
10
20
30
40
50
Patient recordings
% o
f er
ror
db6 % of error
db8 % of errorsym6 % of error
time plane % of error
Figure 5. QT interval Percentage of error for the different tech-niques employed.
50 100 150 200 250 300 350 400 450 500
0.25
0.3
0.35
0.4
0.45
Patient Recordings
QT
Int
erva
ls in
sec
onds
Reference QT Intervals
Average QT Intervals
Figure 6. Reference QT interval and averaged QT interval of wavelet (db6) and time plane method.
50 100 150 200 250 300 350 400 450 500-4
-3
-2
-1
0
1
2
3
4
5
6
Patient Recordings
% o
f er
ror
% of error variation
Average error ) 0.96%
Figure 7. Percentage of error variation for the averaged Time and Wavelet based methods.
The error percentages for extended set of 530 readings
similar to the 24 data as in Table 1 are plotted in Figure 5. When we plot the averaged time and wavelet (db6) based QT intervals with the adjusted reference as in Fig-ure 6 we see that we are having about 0.96% of average error in total with variation from 6.2487% to -4.2% for the given data but except for some skewed cases it lies within ±5% for the whole data analyzed.
But on taking the whole data into account we have to-tal average error as only 0.72%. The percentage of error variation for the averaged wavelet and time plane based QT interval data and total average of 0.96% are shown in Figure 7.
The Daubechies 8 “db8” based results were also good but not as good as Daubechies 6 “db6” while the sym6 results were up to the mark except for some special cases where the Symlet “sym6” regularly gave some fluctua-tions when compared with the measured values. Thus as it can be seen from the Figure 5 we have some high peaks (30-50%) errors in case of Symlet “sym6”.
6. CONCLUSION
In this paper, therefore proves that Daubechies 6 is the best wavelet for wavelet based QT interval detection sup-porting Mahmoodabadi et al. and the clubbing together of a novel time plane based method [9] along with the wave-let based method [8] has hereby produced considerably better results compared to the wavelet and time plane based method when used separately. Moreover this is an extension of our work [16] where we have increased the data set on which the algorithm has been tested.
REFERENCES
[1] A. J. Moss, et al., (2001) ISHNE guidelines for electro-cardiographic evaluation of drug-related QT prolongation and other alterations in ventricular repolarisation: Task force summary, Ann Noninvasive Electrocardiol.

286 S. Majumder et al. / J. Biomedical Science and Engineering 2 (2009) 280-286
SciRes Copyright © 2009 JBiSE
[2] R. J. Myerburg, et al., (2001) Cardiac arrest and sudden death, In: Peter Libby., editor. Braunwald's Heart Disease: A Textbook of Cardiovascular Disease. 6. Saunders (W. B.) Co Ltd, 899-900.
[3] Haverkamp et al., (2000) The potential for QT prolonga-tion and proarrhythmia by non-antiarrhythmic drugs: Clinical and regulatory implications, European Heart Journal.
[4] C. M. Pratt, et al., (1996) Dose response relation between terfenidine and the QTc interval on the scalar electrocar-diogram: Distinguishing a drug effect from spontaneous variability, American Heart Journal.
[5] I. Salvelieva, et al., (1998) Agreement and reproducibil-ity of automatic versus manual measurement of QT in-terval and QT dispersion, Ame J Cardiol., 81, 471-477.
[6] J. Kautzner, et al., (1994) Short and long-term repro-ducibility of QT, QTc and QT dispersion measurements in healthy subjects, PACE Pacing and Clinical Electro-physiology, 17, 928-940.
[7] Y. Sun, et al, Characteristic wave detection in ECG sig-nal using morphological transform, BMC Cardiovascular Disorder, 5, 2005.
[8] Mahmoodabadi, et al., ECG feature extraction using Daubechies wavelets, Proceedings of fifth IASTED In-ternational Conference on Visualization, Imaging and Image Processing, Spain.
[9] M. Mitra et al, ECG signal processing for analysis of abnormalities based on QT interval-A novel approach,
Proceedings of AMSE International Conference on Model-ing and Simulation MS’07, Kolkata, India, 216-218.
[10] S. Majumder, et al Wavelet and time plane based feature extraction of ECG signal, Proceedings of National Con-ference on Communication & Networking (NCCN’08) Punjab, India, 99-103.
[11] Reference txt, (2006) Reference QT interval measure-ments used as the basis for calculating final scores in the PhysioNet/Computers in Cardiology Challenge, http:// www.physionet.org.
[12] P. Laguna et al., (1994) Automatic detection of wave boundaries in multilead ECG signals: validation with the CSE database, Comput Biomed Res, Feb, 27(1), 45-60.
[13] F. B. Hilderbrand, Introduction to numerical analysis, TMH edn, 82-84.
[14] A. Sagie, et al., An improved method for adjusting the QT interval for heart rate (the Framingham Heart Study), Am J Cardiol, 70 (7).
[15] G. S. Wagner, Marriott’s Practical ECG, 10th Edition, Copyright ©2001 Lippincott Williams & Wilkins.
[16] (2008) A hybrid wavelet and time plane based method for QT interval measurement in ECG dignals, 9th International Conference on Signal Processing, Publication Date: 26-29 Oct., On page(s): 2120-2123, Location: Beijing, China, ISBN: 978-1-4244-2178-7, DOI: 10.1109/ICSP.4697564.