a hedonic house price index for turkey - unece.org · a hedonic house price index for turkey ... we...
TRANSCRIPT
WORKING PAPER NO: 16/03
A Hedonic House Price Index for Turkey
February 2016
Timur HÜLAGÜ Erdi KIZILKAYA
Ali Gencay ÖZBEKLER Pınar TUNAR

The views expressed in this working paper are those of the
author(s) and do not necessarily represent the official views of the
Central Bank of the Republic of Turkey. The Working Paper Series
are externally refereed. The refereeing process is managed by the
Research and Monetary Policy Department.
© Central Bank of the Republic of Turkey 2016
Address:
Central Bank of the Republic of Turkey
Head Office
Research and Monetary Policy Department
İstiklal Caddesi No: 10
Ulus, 06100 Ankara, Turkey
Phone:
+90 312 507 54 02
Facsimile:
+90 312 507 57 33

A Hedonic House Price Index for Turkey∗
Timur Hulagu, Erdi Kızılkaya, Ali Gencay Ozbekler, Pınar Tunar
Statistics Department
Central Bank of the Republic of Turkey
Istiklal Caddesi No: 10
06100 Ankara, Turkey
Abstract
In the 2010Q1-2015Q1 period, housing prices increased 78.8 percent in
Turkey, which raises a need to monitor the housing market dynamics
carefully. This increase is widespread across the country where prices
have even doubled in some regions. Our study performs a hedonic price
adjustment for the housing market in Turkey, where we control for the
price effects of improvements in observed house characteristics in time.
Results show significant increases in the quality of houses sold, which in
turn suggests that attributing all the price increase to a real appreciation
may be misleading. In particular, we estimate that one fourth of nominal
changes and one half of relative changes in house prices stem from quality
improvements in general.
Keywords: House price index, Hedonic regression, Characteristic price
approach, Quality adjusted price index.
∗We would like to thank the participants at the Turkish Statistical Institute seminar, EuropeanReal Estate Society 22nd Annual Conference, ISI 60th World Statistics Congress and NarodowyBank Polski ‘Recent trends in the real estate market and its analysis’ Workshop. All errors areours. The views expressed in this paper are those of the authors’ and do not necessarily reflectthe official view of the Central Bank of the Republic of Turkey. Corresponding email address:timur.hulagu(at)tcmb.gov.tr. Telephone number: +90 312 507 6919.
1

1 Introduction
Houses are the most important wealth component of most households and property
prices influence economic dynamics. Therefore, it is crucial for authorities including
central banks to have a reliable index for monitoring the fluctuations in house prices.
However, many countries including Turkey did not have an official house price index
until the recent global financial crisis. In an effort to fill this gap, the Central Bank of
the Republic of Turkey (CBRT) started to publish a monthly house price index from
January 2010 by using the median price method.1 It measures nominal price changes
for the whole Turkish housing market and according to this official statistic, nominal
house prices in 2015Q1 are 78.8 percent higher on average than in 2010. When
deflated by the consumer price index for Turkey (CPI), the increase is 25.0 percent
in relative terms. This significant rise in house prices raises a need to monitor the
housing market dynamics carefully.
The housing market is inherently heterogeneous in terms of its characteristics
such as location, number of bedrooms, age, size, etc. On the other hand, differences
in quality across such properties may be challenging to control because of the high
degree of heterogeneity. Therefore, changes in property prices can reflect pure price
changes as well as changes in the quality of houses. Increase in a property price index
might result from at least one of these two factors, hence identifying big changes as
a bubble may be misleading if the main driver of the increase is the latter. Several
approaches have been proposed in the literature to distinguish these two factors, such
as the hedonic method, the repeat-sales method and hybrid methods. In an extensive
literature survey paper, Hill (2013) discusses advantages and disadvantages of these
methods and concludes that hedonic indices have been increasingly preferred due
to the weaknesses of alternatives. The hedonic regression method makes it possible
1See Kaya et al. (2012) and the CBRT website, www.tcmb.gov.tr.
2
to control for many observed characteristics of a property and measures pure price
changes as well as price effects of quality changes. In fact, hedonic regression is the
only method that enables us to create an index, taking into account the characteristics
of houses (Kunovac et al., 2008). Besides, the unavailability of unique identifiers of
houses in Turkey makes the repeat-sales method inapplicable in our case. These
considerations lead us to opt for the hedonic regression method.2
The hedonic regression method, on the other hand, includes time dummy and
characteristic prices approaches, where the former performs a single regression for
the full time horizon assuming that quality improves in time and is indifferent in
characteristics while the latter uses sequential regressions and computes intertemporal
differences in quality. The former has the advantage of pooling data and this leads
to lower standard errors in estimation. On the other hand, one disadvantage of
the former is that the assumption of no structural change in parameters over time
might be too restrictive (Shimizu and Nishimura, 2006, 2007; and Shimizu et al.,
2010). Moreover, official statistics providers prefer the characteristics prices approach
mainly because of its simplicity as well as the fact that the former approach needs
revisions in past data every time new data arrive (Eurostat, 2011). As a result,
we propose a residential property price index in this study by using the hedonic
method with characteristics prices approach. Our results show that the house prices
increased 60.6 percent in nominal terms and 12.3 percent relative to consumer price
index when we hold their characteristics fixed, and that an 11.3 percent increase is
estimated to have stemmed from the quality changes from January 2010 to March
2There are some criticisms of the repeat-sales indices in the literature. For example, Clappand Giaccotto (1992) provide evidences that houses sold repeatedly are mostly “lemons” and havedifferent characteristics compared to other houses traded in the market. Since lemons dominatethe transactions in the sample, the data used to produce the house price index may not representall the transactions well enough, causing sample selection bias or the so-called “lemon bias” issue.Moreover, houses traded at least twice are in the scope in this approach and this leads to huge loss ofinformation. Yet, the underlying assumption is constant quality, ignoring the quality improvements(or depreciation) which often occur for the exact same house.
3
2015. Equivalently, 18.2 percentage points of the 78.8 percent nominal increase and
12.7 of the 25.0 percent relative increase in property prices in Turkey can be attributed
to quality improvements and the rest was caused by pure price changes. Although
some discrepancies across regions are observed, one fourth of nominal price increases
and one half of relative appreciation can be attributed to quality improvements in
general.3
The hedonic method was first developed and applied to land characteristics by
Waugh (1928) while the term “hedonic pricing method” was first used by Court (1939)
in the context of developing price measures for automobiles. On the other hand, the
method was popularized by Griliches (1961, 1971) and Rosen (1974). Following these
seminal papers, several early studies discuss mainly location effects on house prices.
Later, hedonic quality adjustments in house prices have been extensively used.4 The
first official hedonic house price index was US Census Bureau’s “One-Family Houses
Index” which was first published in 1968 (Triplett, 2004). In the Turkish case, Kaya
(2012) employs the time dummy approach to the same dataset as we do in this paper
and finds that pure property price changes contribute to 6.2 percent from December
2010 to June 2012 whereas we compute that figure as 14.5 percent for the same
period by using the characteristic prices approach. There are also a few other papers
applying hedonic adjustment to prices in the Turkish housing market.5 However,
3Increases observed in the components of houses should not always be considered as quality im-provements. For instance, it may not be correct to state that two bedroom apartments are certainlybetter in quality than one bedroom ones. As a matter of fact, it is very common these days that onebedroom apartments (and also smaller ones) are preferred more compared to two bedroom ones insome districts in Istanbul. Yet, it may not be correct to interpret this as a decrease in quality. There-fore, it could be better to use the term “composition change” rather than “quality change”. However,we opt to use the term “quality” in this study to have the similar terminology with other studiesin this field. See, for example, http://ec.europa.eu/eurostat/cache/metadata/en/prc_hps_esms.htmfor the European Union Harmonised Indices of Housing Price Statistics.
4See, for example, Straszheim (1973, 1974). For more recent studies, see Wilhelmsson (2008) andWidlak and Tomczyk (2010). Hill (2013) documents a wide literature survey in this topic.
5An extensive list of studies for Turkey includes Ucdogruk (2001), Yankaya and Celik (2005),Cingoz (2010), Baldemir et al. (2008), Karagol (2007), Mutluer (2008), Kordis et al. (2014).
4
they mostly use regional or local data, or analyze cross sectional data to estimate the
determinants of house prices (see Selim, 2008). Our paper, on the other hand, covers
the whole country and uses the time dimension to construct a hedonic house price
index. Nevertheless, our results are in line with the common findings in the literature
analyzing the Turkish market regarding the importance of house characteristics.
The rest of the paper is organized as follows. Next, we explain our data source,
scope and methodology of the hedonic price index model used in the study. Section
3 provides our estimation and index results and conclusions are drawn in section 4.
2 Data and Methodology
In this study, we use monthly House Price Index for Turkey (THPI) data compiled
by the CBRT, which covers the period from January 2010 to March 2015. The THPI
is compiled from valuation reports prepared by real estate appraisal companies at
the stage of approval of individual housing loans extended by banks. The actual
sale or utilization of the loan is not required and all appraised residential properties
are included in the scope.6 On the other hand, our dataset is rich in variety of
observable property characteristics. In particular, it has information on properties,
including location (city, sub-city, neighborhood and block information), the year of
construction, build quality, availability of an elevator and whether the building resides
in a gated community where security staff protect the site 24/7. Moreover, it also has
information about the apartment such as gross area of use, heating type, and number
of bedrooms, bathrooms and balconies. This rich dataset enables us to identify the
shadow prices of each quality component and to compute pure price changes by
keeping average characteristics constant.
6For detailed information, see the “Methodological Information on the House Price Index” atwww.tcmb.gov.tr.
5

The THPI uses the (geographically) stratified median price method to measure
price movements in the Turkish housing market. In the current THPI implementation,
properties are grouped together to form homogenous strata and the median unit price
for each stratum is weighted by the number of residential properties sold to reach the
overall price index. Specifically, the previous year house sales statistics from the
General Directorate of Land and Cadastre are used to determine the weights. In
the geographical stratification, sub-cities with sufficient number of observations are
determined as strata.7 The THPI relies on the assumption that the median unit price
of appraised properties is indicative of the median unit price of all properties sold.
In that, a unit price is the appraisal value divided by its gross area of use and the
median unit price is calculated -excluding extreme values- for each stratum.
The THPI is calculated by using the Chain Laspeyres Index method:
I ty =
∑iw
yi p
tyi∑
iwyi p
12(y−1)i
I12(y−1), (1)
where I ty is the price index for the reference month t in year y, wyi is the weight
for stratum i, ptyi is the median price of all properties in i. We denote the reference
month as ty while 12(y − 1) denotes 12th month of the previous year.8
In this paper, we use characteristic-prices-based hedonic regression method. The
basis of the hedonic hypothesis is that a good is characterized by the set of all its
characteristics. The high heterogeneity of the housing market necessitates this ap-
proach. In this context, regression methods can be used to estimate shadow prices of
the features of a property.9
7In case of insufficient number of observations for sub-cities, NUTS-Level 2 regions constituteone stratum. If any stratum has a sample size smaller than 50 appraisal reports in a period, thisstratum is excluded and its weight is distributed to other strata in the geographical region.
8In fact, THPI uses quarterly data where one quarter data consist of valuation reports of thereference, preceding and succeeding months. We adopt the same approach in our hedonic index.
9According to the “Residential Property Price Index Handbook” (Eurostat, 2011), the hedonicprices approach can be used to obtain estimates of willingness to pay the different characteristics
6

In particular, our log-linear regression model is as follows:
lnptn = βt0 +
∑k
βtkz
tnk + εtn, (2)
where ptn is the price of property n and ztnk is the characteristic k of the property.
In order to avoid adverse effects of potentially problematic initial data points on
the whole index, we carefully choose January 2012 as the base period (t = 0) to
construct our Hedonic House Price Index for Turkey (THHPI).10 Then, we run sepa-
rate regressions for each period and compute the estimates of regression coefficients,
βtk. To compute fixed-characteristics prices, we use βt
k along with the average char-
acteristics for the base period, z0nk. From this perspective, average characteristics for
the base period resembles “standardized property with fixed characteristics”. Our
Laspeyres-type index for each stratum i is as following:
P ti =
exp(βt0)exp[
∑k β
tkz
0nk]
exp(β00)exp[
∑k β
0kz
0nk], (3)
where P ti is the hedonic house price index.11 Equation (3) gives the quality adjusted
property price index because characteristics are kept constant in time.
2.1 Model selection
By its nature, the hedonic regression, which considers the price of each good as
a bundle of characteristics, may suffer from two different and interrelated statistical
problems, namely the omitted variable bias and multicollinearity. The former is a
and to construct quality-adjusted price indices.10As a robustness check, we also computed a similar index with 2012=100 but differences are
negligible.11Since the THPI is a Laspeyres index, we also follow the same methodology. However, for a
robustness check, we compute Paasche and Fisher indices -as in Eurostat (2011)- but they show nosignificant differences. Results are available from the authors upon request.
7
common problem in such studies because all characteristics that have an effect on
house prices could not be included in the regression model due to data limitations.
In general, characteristics of a house can be divided into three categories; structural,
neighborhood and location characteristics (see, for example, Chin and Chau, 2003).
In our dataset, we do not have neighborhood characteristics such as the income level
of residents or the air quality in the region, but we have observable structural features
as well as location information of an appraised house. However, using location in-
formation itself can not provide fully homogeneous data on the market because even
houses in the same building have different values. Moreover, there is a trade-off in
stratifying the market with respect to location, i.e. the more you homogenize the less
data you will have in each strata. On top of these, obtaining the full set of structural
characteristics in practice is almost impossible. Therefore, we can say that, similar
to other studies using hedonic regression, our model may also be subject to omit-
ted variable bias to some extent. While hedonic price indices potentially suffer from
this problem, well-constructed models that use the characteristic prices approach or
double imputation indices significantly reduce the sensitivity to omitted variable bias
(Triplett, 2004; Hill and Melser, 2008; and Hill, 2011).
A second potential statistical problem is the existence of multicollinearity among
explanatory variables. This is a common issue in applying hedonic methods to houses
because there can be statistical dependencies among characteristics of a house. For
example, a larger house probably has more bedrooms and a regression might suffer
from multicollinearity if it has both variables on the right hand side. In this case,
high correlation among these variables makes coefficient estimates unstable and com-
plicates the interpretation of variable importance in price determination. However,
according to Eurostat (2011), indices created with this method will not suffer too
much from this issue. In particular, multicollinearity does not interfere with the
8
characteristics price interpretation in the sense that the value of an estimated co-
efficient will converge on the true characteristics price in repeated samples. Thus,
the estimates are consistent in econometric terms and the hedonic index is still valid
under the presence of multicollinearity. Furthermore, there is a trade-off between the
omitted variable bias and the multicollinearity issues, i.e. excluding a relevant vari-
able due to high correlation with other might increase the former bias. As a result,
we opt to include such highly correlated variables in our regression models.
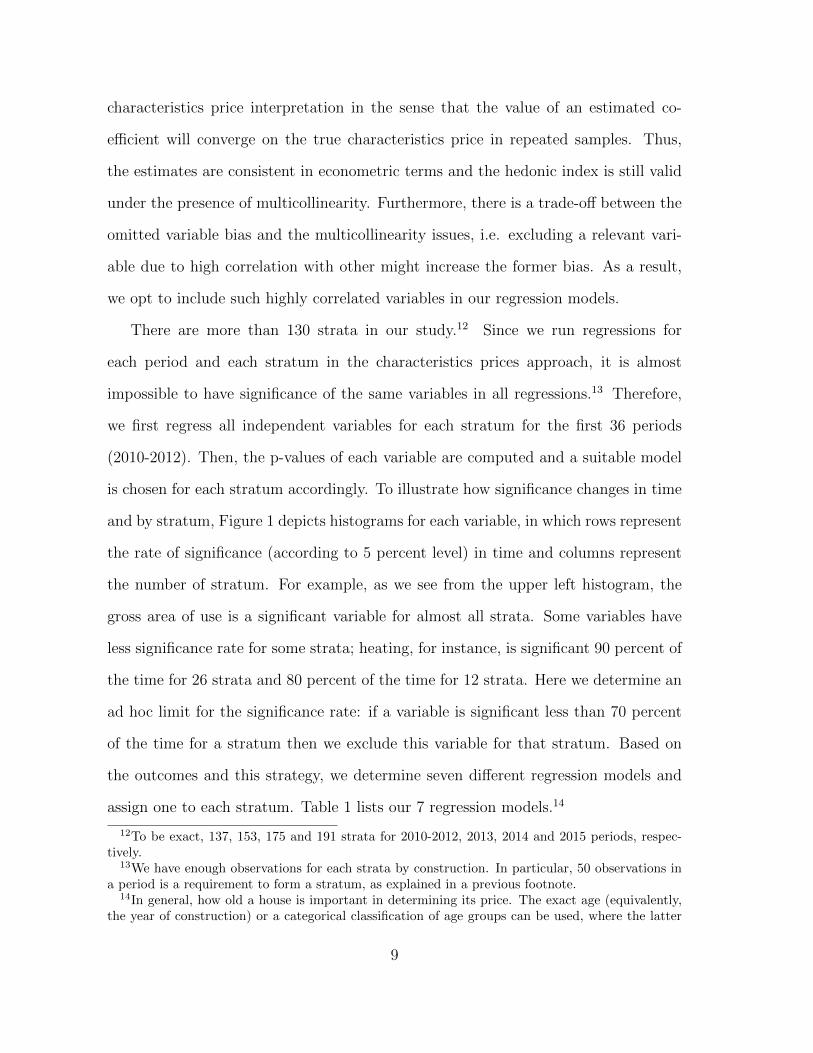
There are more than 130 strata in our study.12 Since we run regressions for
each period and each stratum in the characteristics prices approach, it is almost
impossible to have significance of the same variables in all regressions.13 Therefore,
we first regress all independent variables for each stratum for the first 36 periods
(2010-2012). Then, the p-values of each variable are computed and a suitable model
is chosen for each stratum accordingly. To illustrate how significance changes in time
and by stratum, Figure 1 depicts histograms for each variable, in which rows represent
the rate of significance (according to 5 percent level) in time and columns represent
the number of stratum. For example, as we see from the upper left histogram, the
gross area of use is a significant variable for almost all strata. Some variables have
less significance rate for some strata; heating, for instance, is significant 90 percent of
the time for 26 strata and 80 percent of the time for 12 strata. Here we determine an
ad hoc limit for the significance rate: if a variable is significant less than 70 percent
of the time for a stratum then we exclude this variable for that stratum. Based on
the outcomes and this strategy, we determine seven different regression models and
assign one to each stratum. Table 1 lists our 7 regression models.14
12To be exact, 137, 153, 175 and 191 strata for 2010-2012, 2013, 2014 and 2015 periods, respec-tively.
13We have enough observations for each strata by construction. In particular, 50 observations ina period is a requirement to form a stratum, as explained in a previous footnote.
14In general, how old a house is important in determining its price. The exact age (equivalently,the year of construction) or a categorical classification of age groups can be used, where the latter
9

Figure 1: Histogram of Variable Significance
Note: Histograms show the number of strata (on y-axis) that the variable (each histogram) issignificant -at 5 percent level- while x-axis represents the percentage of times the variable issignificant for the stratum.
covers nonlinearity effects of age in price. We computed both alternatives and observed negligibledifferences. Therefore, for simplicity purposes, we prefer using the year of construction.
10

Table 1: Regression Models
Variables (1) (2) (3) (4) (5) (6) (7)Gross area of use 3 3 3 3 3 3 3Quality of construction 3 3 3 3 3 3 3Year of construction 3 3 3 3 3 3 3Number of bedrooms 3 3 3 3 3 3 3Number of bathrooms 3 7 3 3 3 3 7Number of balconies 3 3 7 3 3 3 7Security service 3 3 3 7 3 3 7Heating 3 3 3 3 7 3 7Elevator 3 3 3 3 3 7 7
Notes: (1) See the appendix for variable explanations. (2) Checkmarks show inclusion of the variable in therespective model while crossmarks represent exclusion.
3 Results
According to a sample regression result given in Table 2, all independent variables
used in this regression are statistically significant and signs of all coefficients are
consistent with economic theory. In other words, all shadow prices, i.e. the additional
contribution of a coefficient to appraisal value, result in increasing the house price. For
example, keeping other physical characteristics constant, a 100 square-meter larger
house is 50 percent more expensive than average. Higher quality houses are valued
at a 10.9 percent higher price on average while an elevator in the building adds 13.3
percent to its value. Security is another important characteristic for this stratum,
meaning that if a house receives a 24/7 security service within a gated community
then one would expect its price to be 33.3 percent higher on average.15
Following the methodology described above, we first compute regional indices and
then aggregate them to reach the index for Turkey. The THHPI shows an increasing
trend starting from the first period, similar to the THPI. Figure 2 shows that, the
THHPI increased by 60.6 percent in nominal terms (and 12.3 percent in relative terms)
while the THPI increased nominally by 78.8 percent (25.0 percent in relative terms)
15Average R-squared values across all strata and all months for each year are 0.511, 0.586, 0.637,0.629 and 0.667 for 2010-2014, respectively.
11

Table 2: House Price Estimation Results
Characteristic EstimatesGross area of use (Sq. m.) 0.005
(0.000)∗∗∗
Quality of construction 0.109(0.022)∗∗∗
Year of construction 0.003(0.001)∗∗
Number of bedrooms 0.033(0.017)∗∗
Number of bathrooms 0.084(0.029)∗∗∗
Number of balconies 0.071(0.017)∗∗∗
Security service 0.333(0.032)∗∗∗
Heating 0.118(0.045)∗∗∗
Elevator 0.133(0.028)∗∗∗
Constant 5.655(2.040)∗∗∗
Number of observations 621R-squared 0.641
Notes: (1) Dependent variable lnP ti is the logarithm of total appraisal value of the house in Turkish Liras. (2)
The numbers in parenthesis are standard errors while (**) and (***) denotes significance at 5% and 1% level,respectively. (3) Quality of construction is a dummy variable equal to 1 for higher quality houses and 0 for lower.(4) Security service is a dummy variable equal to 1 if the house resides in a gated community. (5) Heating denotescentral heating and wall hung gas boiler systems. (6) Elevator denotes whether the building has an elevator ornot. (7) Sample regression covers one of the sub-cities of Istanbul with one quarter data. More regression resultsare available upon request.
in almost five years.16 These findings suggest that, an 11.3 percent increase was due
to quality improvements in housing characteristics in the given period.17 In order
to analyze what form these improvements are taking, one can see from Table 3 that
there are more than one house characteristic which improved over time. Particularly,
on average, houses sold in 2015 have better quality of construction, more bathrooms,
elevators and security service compared to houses sold in 2010. On the other hand,
we can see that smaller houses with less number of rooms and balconies are generally
sold recently but their diminishing effects are dominated. Although there exist some
16The THHPI is rebased into 2010 from January 2012 to make a comparison with the THPI.17This figure can be found by dividing the THPI (178.8) by THHPI (160.6), or similarly relative
increases in these two indices (dividing 125.0 by 112.3).
12
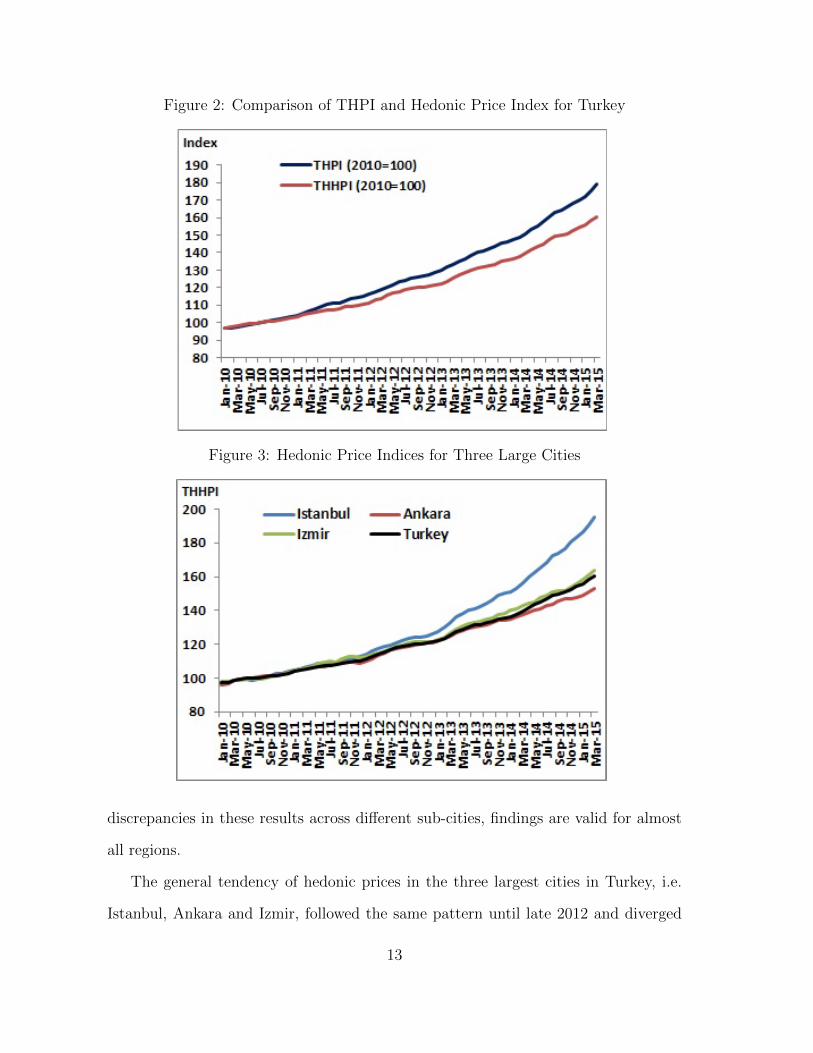
Figure 2: Comparison of THPI and Hedonic Price Index for Turkey
Figure 3: Hedonic Price Indices for Three Large Cities
discrepancies in these results across different sub-cities, findings are valid for almost
all regions.
The general tendency of hedonic prices in the three largest cities in Turkey, i.e.
Istanbul, Ankara and Izmir, followed the same pattern until late 2012 and diverged
13
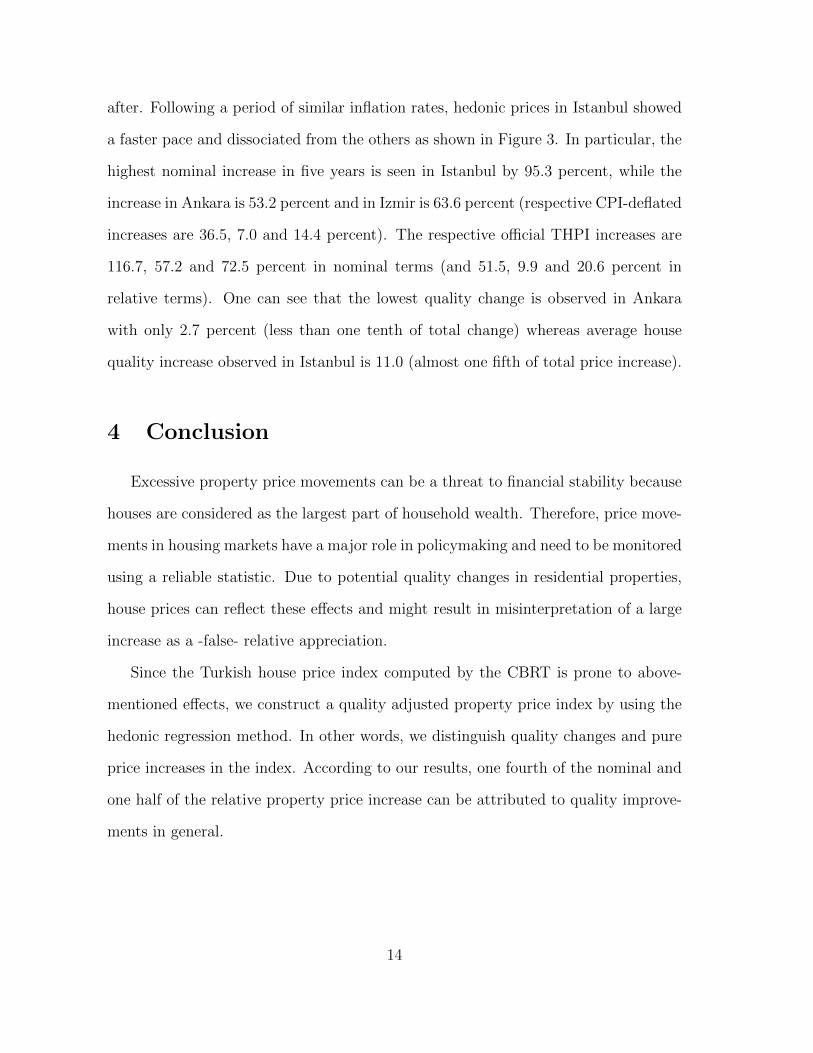
after. Following a period of similar inflation rates, hedonic prices in Istanbul showed
a faster pace and dissociated from the others as shown in Figure 3. In particular, the
highest nominal increase in five years is seen in Istanbul by 95.3 percent, while the
increase in Ankara is 53.2 percent and in Izmir is 63.6 percent (respective CPI-deflated
increases are 36.5, 7.0 and 14.4 percent). The respective official THPI increases are
116.7, 57.2 and 72.5 percent in nominal terms (and 51.5, 9.9 and 20.6 percent in
relative terms). One can see that the lowest quality change is observed in Ankara
with only 2.7 percent (less than one tenth of total change) whereas average house
quality increase observed in Istanbul is 11.0 (almost one fifth of total price increase).
4 Conclusion
Excessive property price movements can be a threat to financial stability because
houses are considered as the largest part of household wealth. Therefore, price move-
ments in housing markets have a major role in policymaking and need to be monitored
using a reliable statistic. Due to potential quality changes in residential properties,
house prices can reflect these effects and might result in misinterpretation of a large
increase as a -false- relative appreciation.
Since the Turkish house price index computed by the CBRT is prone to above-
mentioned effects, we construct a quality adjusted property price index by using the
hedonic regression method. In other words, we distinguish quality changes and pure
price increases in the index. According to our results, one fourth of the nominal and
one half of the relative property price increase can be attributed to quality improve-
ments in general.
14

References
Baldemir, E., Kesbic, C. Y., and Inci, M. (2008). Estimating Hedonic Demand Pa-
rameters in Real Estate Market: The Case of Mugla. Sosyal Bilimler Enstitusu Der-
gisi, 20, 4166.
Chin, T.L., and Chau, K.W. (2003). A critical review of literature on the he-
donic price model. International Journal for Housing Science and Its Applications,
27(2),145-165.
Cingoz, A. (2010). Istanbul’da Kapalı Site Konut Fiyatlarının Analizi (in Turk-
ish). Sosyal Bilimler Dergisi, 2, 129139.
Clapp, J. M., and Giaccotto, C. (1992). Estimating Price Trends for Residential
Property: A Comparison of Repeat Sales and Assessed Value Methods. The Journal
of Real Estate Finance and Economics, 5(4), 357-374.
Court, A. (1939). Hedonic Price Indexes with Automotive Examples. The Dy-
namics of Automobile Demand, 99-117.
Eurostat (2011). Handbook on Residential Property Price Indices.
http://ec.europa.eu/eurostat/en/web/products-manuals-and-guidelines/-/KS-RA-12-
022 (last accessed June 13, 2015).
Griliches, Z. (1961). Hedonic Price Indexes for Automobiles: An Econometric
Analysis of Quality Change. National Bureau of Economic Research and University
of Chicago.
Griliches, Z. (1971). Price Indexes and Quality Change. Harvard University Press,
Cambridge, Massachusetts.
Hill, R. J. (2011). Hedonic Price Indexes for Housing. OECD Statistics Working
paper 2011/1, OECD Publishing, Paris.
Hill, R. J. (2013). Hedonic Price Indexes for Residential Housing: A Survey,
15

Evaluation and Taxonomy. Journal of Economic Surveys, 27(5), 879-914.
Hill, R. J., and Melser, D. (2008). Hedonic Imputation the Price Index Problem:
An Application to Housing. Economic Inquiry, 46(4), 593-609. Karagol, T. (2007).
A Study of Housing Prices in Ankara. Masters Thesis. Middle East Technical Uni-
versity, Ankara.
Kaya, A., Bozkurt, A. T., Bastan, E. M., and Ayanoglu, O. A. (2012). Construct-
ing a House Price Index for Turkey. IFC Bulletin, 36, 153-171.
Kaya, A. (2012). Turkiye’de Konut Fiyatlarını Etkileyen Faktorlerin Hedonik
Fiyat Modeli ile Belirlenmesi. CBRT Expert Thesis (in Turkish), Ankara.
Kordis, G., Isık, S., and Mert, M. (2014). Antalya’da Konut Fiyatlarını Etkileyen
Faktorlerin Hedonik Fiyat Modeli ile Tahmin Edilmesi. Akdeniz University Faculty of
Economics & Administrative Sciences Faculty Journal/Akdeniz Universitesi Iktisadi
ve Idari Bilimler Fakultesi Dergisi, 14(28), 103-132.
Kunovac, D., Dozovic, E., Lukinic, G., and Pufnik, A. (2008). Use of the Hedonic
Method to Calculate an Index of Real Estate Prices in Croatia. Croatian National
Bank Working Paper, W-19.
Mutluer, D. (2008). Gayrimenkul Fiyatlarının Derlenmesi Ulke Ornekleri ve
Turkiye icin Bir Uygulama (in Turkish). TISK Akademi, 3(6), 240-278.
Rosen, S. (1974). Hedonic Prices and Implicit Markets: Product Differentiation
in Pure Competition. The Journal of Political Economy, 82, 34-55.
Selim, S. (2008). Determinants of House Prices in Turkey: A Hedonic Regression
Model. Dogus Universitesi Dergisi, 9(1), 6576.
Shimizu, C., and Nishimura, K. G. (2006). Biases in Appraisal Land Price In-
formation: The Case of Japan. Journal of Property Investment and Finance, 26(2),
150-175.
Shimizu, C., and Nishimura, K. G. (2007). Pricing Structure in Tokyo Metropoli-
16

tan Land Markets and Its Structural Changes: Pre-bubble, Bubble, and Post-bubble
Periods. Journal of Real EstateFinance and Economics, 35(4), 475-496.
Shimizu, C., Nishimura, K. G., and Watanabe, T. (2010). Housing Prices in
Tokyo: A Comparison of Hedonic and Repeat Sales Measures. Hitotsubashi Univer-
sity.
Straszheim, M. R. (1973). Estimation of the Demand for Urban Housing Services
from Household Interview Data. Review of Economics and Statistics, 55(1), 1-8.
Straszheim, M. R. (1974). Hedonic Estimation of Urban Housing Market Prices:
A Further Comment. Review of Economics and Statistics, 56(3), 404-406.
Triplett, J. (2004). Handbook on Hedonic Indexes and Quality Adjustments in
Price Indexes: Special Application to Information Technology Products. STI Working
Paper, 2004/9.
Ucdogruk, S. (2001). Izmir Ilinde Emlak Fiyatlarına Etki Eden Faktorler-Hedonik
Yaklasım (in Turkish). Dokuz Eylul Universitesi Iktisadi ve Idari Bilimler Fakultesi
Dergisi, 16(2), 149161.
Waugh, F. W. (1928). Quality Factors Influencing Vegetable Prices. Journal of
Farm Economics, 10/2, 185-196.
Widlak, M., and Tomczyk, E. (2010). Measuring Price Dynamics: Evidence from
The Warsaw Housing Market. Journal of European Real Estate Research, 3(3), 203-
227.
Wilhelmsson, M. (2008). Construction and Updating of Property Price Index
Series: The Case of Segmented Markets in Stockholm. Property Management, 27(2),
119-137.
Yankaya, U., and Celik, H. M. (2005). Izmir Metrosunun Konut Fiyatları Uzerindeki
Etkilerinin Hedonik Fiyat Yontemi ile Modellenmesi (in Turkish). Dokuz Eylul
Universitesi Iktisadi ve Idari Bilimler Fakultesi Dergisi, 20(2), 6179.
17
A Data Appendix
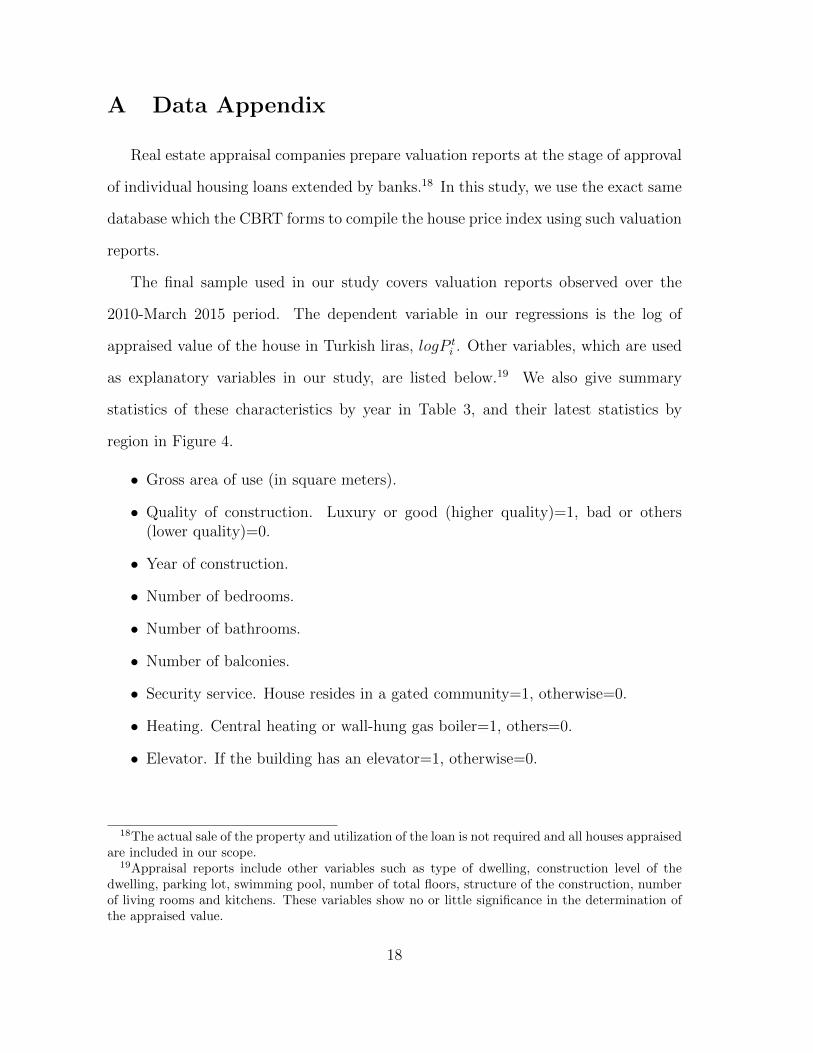
Real estate appraisal companies prepare valuation reports at the stage of approval
of individual housing loans extended by banks.18 In this study, we use the exact same
database which the CBRT forms to compile the house price index using such valuation
reports.
The final sample used in our study covers valuation reports observed over the
2010-March 2015 period. The dependent variable in our regressions is the log of
appraised value of the house in Turkish liras, logP ti . Other variables, which are used
as explanatory variables in our study, are listed below.19 We also give summary
statistics of these characteristics by year in Table 3, and their latest statistics by
region in Figure 4.
• Gross area of use (in square meters).
• Quality of construction. Luxury or good (higher quality)=1, bad or others(lower quality)=0.
• Year of construction.
• Number of bedrooms.
• Number of bathrooms.
• Number of balconies.
• Security service. House resides in a gated community=1, otherwise=0.
• Heating. Central heating or wall-hung gas boiler=1, others=0.
• Elevator. If the building has an elevator=1, otherwise=0.
18The actual sale of the property and utilization of the loan is not required and all houses appraisedare included in our scope.
19Appraisal reports include other variables such as type of dwelling, construction level of thedwelling, parking lot, swimming pool, number of total floors, structure of the construction, numberof living rooms and kitchens. These variables show no or little significance in the determination ofthe appraised value.
18

Tab
le3:
Sum
mar
ySta
tist
ics
ofH
ouse
Pri
cean
dC
har
acte
rist
ics
2010
2011
2012
2013
2014
2015
Vari
ab
les
Mea
nM
edia
nM
ean
Med
ian
Mea
nM
edia
nM
ean
Med
ian
Mea
nM
edia
nM
ean
Med
ian
Pri
ce100,1
24
95,0
00
106,0
54
100,0
00
115,9
81
110,0
00
127,4
26
120,0
00
141,0
81
135,0
00
151,5
79
145,0
00
Gro
ssare
aof
use
123.0
0110.0
0117.6
0110.0
0113.9
5108.0
0114.3
3109.0
0112.1
4106.0
0111.4
8106.0
0Q
uality
of
con
stru
ctio
n0.5
91.0
00.6
01.0
00.6
01.0
00.6
11.0
00.6
21.0
00.6
11.0
0Y
ear
of
con
stru
ctio
n2000.8
62006.0
02001.6
82007.0
02002.8
92008.0
02004.2
12010.0
02005.6
22011.0
02005.9
52011.0
0N
um
ber
of
bed
room
s2.8
13.0
02.7
93.0
02.7
43.0
02.7
73.0
02.7
33.0
02.7
23.0
0N
um
ber
of
bath
room
s1.2
21.0
01.2
21.0
01.2
31.0
01.2
41.0
01.2
51.0
01.2
51.0
0N
um
ber
of
balc
on
ies
1.5
92.0
01.6
12.0
01.6
02.0
01.5
92.0
01.5
52.0
01.5
42.0
0S
ecu
rity
serv
ice
0.0
90.0
00.0
80.0
00.0
90.0
00.0
90.0
00.1
00.0
00.1
00.0
0H
eati
ng
0.7
31.0
00.7
41.0
00.7
61.0
00.7
41.0
00.7
21.0
00.7
21.0
0E
levato
r0.3
80.0
00.4
00.0
00.4
60.0
00.4
70.0
00.4
70.0
00.4
90.0
0
Note
s:(1
)2015
data
cover
Janu
ary
-Marc
hm
onth
s.
19
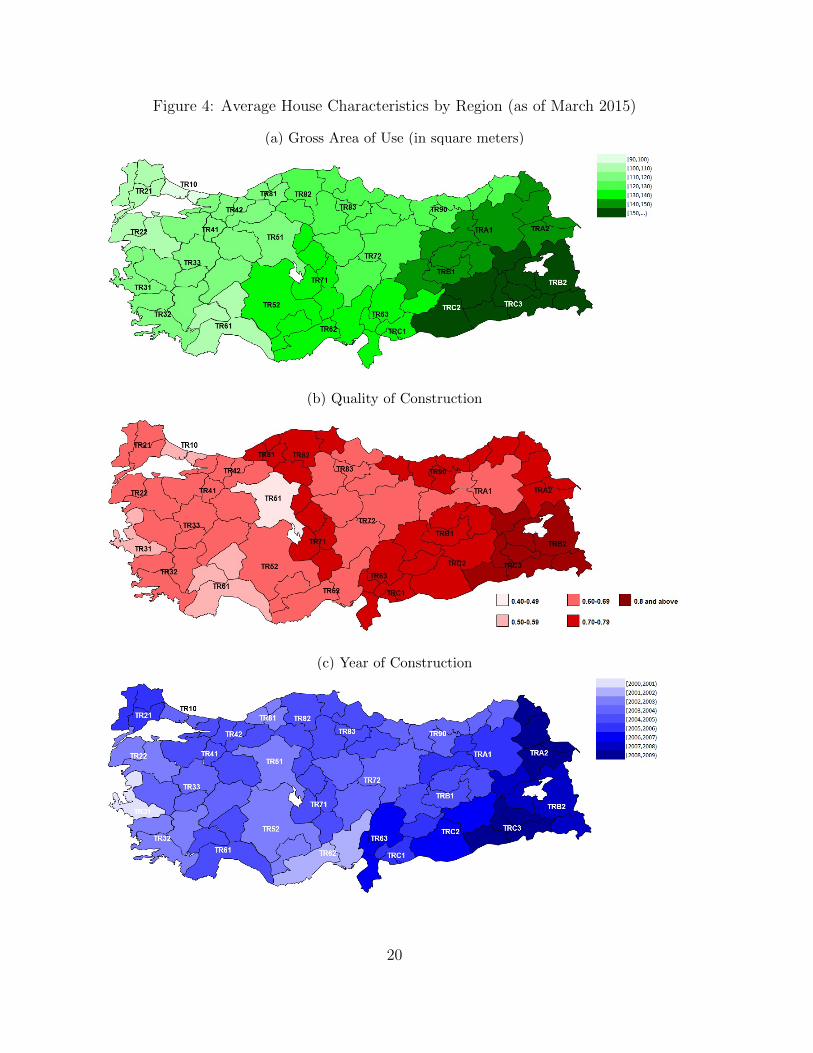
Figure 4: Average House Characteristics by Region (as of March 2015)
(a) Gross Area of Use (in square meters)
(b) Quality of Construction
(c) Year of Construction
20

(d) Number of Bedrooms
(e) Number of Bathrooms
(f) Number of Balconies
21
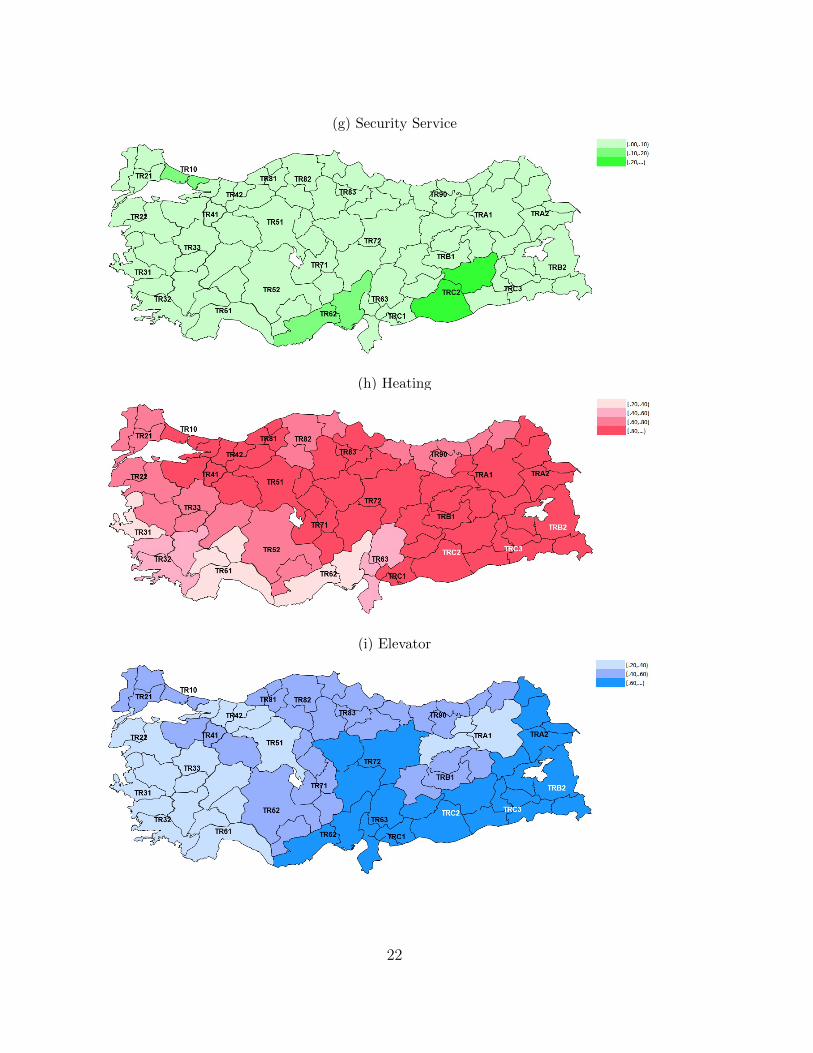
(g) Security Service
(h) Heating
(i) Elevator
22

Central Bank of the Republic of Turkey
Recent Working Papers
The complete list of Working Paper series can be found at Bank’s website
(http://www.tcmb.gov.tr).
In Pursuit of Understanding Markups in Restaurant Services Prices (Mustafa Utku Özmen Working Paper No. 16/02 January 2016)
Immigration and Prices: Quasi-Experimental Evidence from Syrian Refugees in Turkey (Binnur Balkan Konuk, Semih Tümen Working Paper No. 16/01 January 2016)
Tüketici Güvenini Belirleyen Unsurlar Üzerine Ampirik Bir Çalışma: Türkiye Örneği (Tuğrul Gürgür , Zübeyir Kılınç Working Paper No. 15/38 December 2015)
Imported Intermediate Goods and Product Innovation: Evidence from India (Murat Şeker, Daniel Rodriguez-Delgado, Mehmet Fatih Ulu Working Paper No. 15/37 December 2015)
Liquidity Crises, Liquidity Lines and Sovereign Risk (Yasin Kürşat Önder Working Paper No. 15/36 December 2015)
Quantifying the Effects of Loan-to-Value Restrictions: Evidence from Turkey (Yavuz Arslan, Gazi Kabaş, Ahmet Ali Taşkın Working Paper No. 15/35 December 2015)
Compulsory Schooling and Early Labor Market Outcomes in a Middle-Income Country (Huzeyfe Torun Working Paper No. 15/34 November 2015)
“I Just Ran four Million Regressions” for Backcasting Turkish GDP Growth (Mahmut Günay Working Paper No. 15/33 November 2015)
Has the Forecasting Performance of the Federal Reserve’s Greenbooks Changed over Time? (Ozan Ekşi ,Cüneyt Orman, Bedri Kamil Onur Taş Working Paper No. 15/32 November 2015)
Importance of Foreign Ownership and Staggered Adjustment of Capital Outflows (Özgür Özel ,M. Utku Özmen,Erdal Yılmaz Working Paper No. 15/31 November 2015)
Sources of Asymmetry and Non-linearity in Pass-Through of Exchange Rate and Import Price to Consumer Price Inflation for the
Turkish Economy during Inflation Targeting Regime (Süleyman Hilmi Kal, Ferhat Arslaner, Nuran Arslaner Working Paper No. 15/30 November 2015)
Selective Immigration Policy and Its Impacts on Natives: A General Equilibrium Analysis (Şerife Genç İleri Working Paper No. 15/29 November 2015)
How Does a Shorter Supply Chain Affect Pricing of Fresh Food? Evidence from a Natural Experiment (Cevriye Aysoy, Duygu Halim Kırlı, Semih Tümen Working Paper No. 15/28 October 2015)
Decomposition of Labor Productivity Growth: Middle Income Trap and Graduated Countries (Gökhan Yılmaz Working Paper No. 15/27 October 2015)
Estimating Income and Price Elasticity of Turkish Exports with Heterogeneous Panel Time-Series Methods (İhsan Bozok, Bahar Şen Doğan, Çağlar Yüncüler Working Paper No. 15/26 October 2015)
External Shocks, Banks and Monetary Policy in an Open Economy: Loss Function Approach (Yasin Mimir, Enes Sunel Working Paper No. 15/25 September 2015)
Tüm Yeni Açılan Krediler Eşit Mi? Türkiye’de Konut Kredisi ve Konut Kredisi Dışı Borç ile Özel Kesim Tasarruf Oranı (Cengiz Tunç, Abdullah Yavaş Working Paper No. 15/24 September 2015)
A Computable General Equilibrium Analysis of Transatlantic Trade and Investment Partnership and Trans-
Pacific Partnership on Chinese Economy (Buhara Aslan, Merve Mavuş Kütük, Arif Oduncu Working Paper No. 15/23 September 2015)