a health and social profi le - vancouver coastal health€¦ · a health and social profi le...
TRANSCRIPT

A health and social profi leFALL 2013
DRAKE
GEORGIA
HASTINGS
NAN
AIM
O
BO
UN
DAR
Y
BROADWAY
MAI
N
ANG
US
CAM
BIE
OAK
GR
ANVI
LLE
MC
DO
NAL
D
ALM
AD
UN
BAR
UBC
57 AVE
41 AVE
25 AVE
16 AVE
MARINE DR
BLA
NC
A
BURRARD
CLA
RK
COMMUNITY HEALTH AREA 6 SOUTH VANCOUVER SOUTH VANCOUVER

A Health and Social Profi leA Health and Social Profi le Vancouver Coastal Health 2
COMMUNITY HEALTH AREA 1 CITY CENTRE
A Health and Social Profi leA Health and Social Profi le Vancouver Coastal Health 2
COMMUNITY HEALTH AREA 6 SOUTH VANCOUVERSOUTH VANCOUVER
ContentsIntroduction by community partner . . . . . . . . . . . . . . . . . . . . . . . . . . . . . . . . . . . . . . . . . . . . . . . . . . . 7
Population estimates and projections . . . . . . . . . . . . . . . . . . . . . . . . . . . . . . . . . . . . . . . . . . . . . . . . . 9
Demographic composition . . . . . . . . . . . . . . . . . . . . . . . . . . . . . . . . . . . . . . . . . . . . . . . . . . . . . . . . . . 13
Diversity . . . . . . . . . . . . . . . . . . . . . . . . . . . . . . . . . . . . . . . . . . . . . . . . . . . . . . . . . . . . . . . . . . . . . . 14
Education and healthy child development . . . . . . . . . . . . . . . . . . . . . . . . . . . . . . . . . . . . . . . . 18
Employment and income . . . . . . . . . . . . . . . . . . . . . . . . . . . . . . . . . . . . . . . . . . . . . . . . . . . . . . . 29
Housing and household characteristics . . . . . . . . . . . . . . . . . . . . . . . . . . . . . . . . . . . . . . . . . . . 39
Health status . . . . . . . . . . . . . . . . . . . . . . . . . . . . . . . . . . . . . . . . . . . . . . . . . . . . . . . . . . . . . . . . . . . . . . 51
Life expectancy . . . . . . . . . . . . . . . . . . . . . . . . . . . . . . . . . . . . . . . . . . . . . . . . . . . . . . . . . . . . . . . . 52
Births . . . . . . . . . . . . . . . . . . . . . . . . . . . . . . . . . . . . . . . . . . . . . . . . . . . . . . . . . . . . . . . . . . . . . . . . . 54
Mortality . . . . . . . . . . . . . . . . . . . . . . . . . . . . . . . . . . . . . . . . . . . . . . . . . . . . . . . . . . . . . . . . . . . . . . 59
Chronic and communicable disease . . . . . . . . . . . . . . . . . . . . . . . . . . . . . . . . . . . . . . . . . . . . . . 64
School-age immunization coverage . . . . . . . . . . . . . . . . . . . . . . . . . . . . . . . . . . . . . . . . . . . . . . 66
Health service utilization . . . . . . . . . . . . . . . . . . . . . . . . . . . . . . . . . . . . . . . . . . . . . . . . . . . . . . . . . . . . 68
Acute care services . . . . . . . . . . . . . . . . . . . . . . . . . . . . . . . . . . . . . . . . . . . . . . . . . . . . . . . . . . . . . 69
Home and community care services . . . . . . . . . . . . . . . . . . . . . . . . . . . . . . . . . . . . . . . . . . . 71
Neighbourhoods in CHA 6 . . . . . . . . . . . . . . . . . . . . . . . . . . . . . . . . . . . . . . . . . . . . . . . . . . . . . . . . . . 75
CHA 6 community resources . . . . . . . . . . . . . . . . . . . . . . . . . . . . . . . . . . . . . . . . . . . . . . . . . . . . . . . . . 79
References . . . . . . . . . . . . . . . . . . . . . . . . . . . . . . . . . . . . . . . . . . . . . . . . . . . . . . . . . . . . . . . . . . . . . . . . 83

A Health and Social Profi leA Health and Social Profi le Vancouver Coastal Health 3
COMMUNITY HEALTH AREA 1 CITY CENTRE
A Health and Social Profi leA Health and Social Profi le Vancouver Coastal Health 3
COMMUNITY HEALTH AREA 6 SOUTH VANCOUVERSOUTH VANCOUVER
Health is where we live, learn, work and playWe are pleased to present this package of Health and Social Profi les for the six Community Health Areas (CHAs) in Vancouver. The full package includes Health and Social Profi les for CHA 1 (City Centre), CHA 2 (Mid-East), CHA 3 (North East), CHA 4 (Westside), CHA 5 (Midtown) CHA 6 (South Vancouver), as well as a Citywide Summary.
These profi les were prepared by Vancouver Coastal Health (VCH). They were compiled by Nerissa Tai, a student in the Master of Public Health program at Simon Fraser University, with guidance from Vancouver Community Developers, Charito Gailling, Katie Hume, Lisa McCune, Nicole Latham, Lycia Rodrigues and Jazmin Miranda, as well as Dr. Jat Sandhu and Eleni Kefalas at the VCH Public Health Surveillance Unit (PHSU).
VCH is the regional health authority responsible for providing public health services to over 1 million people in British Columbia. We serve the residents of Vancouver, Richmond, the North
Shore and Coast Garibaldi, Sea-to-Sky, Sunshine Coast, Powell River, Bella Bella and Bella Coola. Vancouver is divided into six geographical areas called “Community Health Areas” (CHAs). CHAs vary in population size and are comprised of three to eight neighbourhoods. We operate 13 hospitals
and also provide primary care, mental health and addiction services, community-based residential and home health care, and more.
While hospital care and clinical services are an important part of the health care system, VCH also uses population health approach, which aims to improve the health of the entire population and to reduce health inequities among population groups. A population health approach addresses many factors that infl uence the health of a population.
In these Health and Social profi les we report on some of the factors that infl uence the health of individuals and populations in Vancouver. These factors are called the “social determinants of health”. In each profi le we include population-level data about income, housing, education, employment and child development. We also report on traditional health indicators such as life expectancy, birth rates, standardized mortality ratios, and we include some information about health service utilization and identify key community resources.
A population health approach aims to improve the health of the entire population.

A Health and Social Profi leA Health and Social Profi le Vancouver Coastal Health 4
COMMUNITY HEALTH AREA 1 CITY CENTRE
A Health and Social Profi leA Health and Social Profi le Vancouver Coastal Health 4
COMMUNITY HEALTH AREA 6 SOUTH VANCOUVERSOUTH VANCOUVER
Addressing the social determinants of health can improve the health of the whole population and reduce health inequities; but Vancouver Coastal Health cannot do it alone. We need to work in partnership across sectors and with communities to address local issues, facilitate create access to services and strengthen the environments in which people live, learn, work and play. We hope that these profi les will help VCH staff and our partners in community to identify emerging needs, undertake strategic planning, and implement health-supporting initiatives.
The majority of the information presented in these profi les comes from BC Vital Statistics Agency, BC Statistics, the 2006 Statistics Canada Census and Vancouver Coastal Health databases (see References for a complete list of data sources).
Where possible, we have included information obtained through the 2011 Statistics Canada Census. Where data was unavailable for 2011, we have used information from the 2006 Census. The 2006 Census remains a valuable source of information about populations in Vancouver because it contains details collected through the mandatory long-form Census, which was discontinued prior to the 2011 Census. Also, at the time of publication of these Profi les, only limited data from the 2011 Census has been released.
We also consulted with community groups, public organizations and VCH staff to better inform the profi les and to gain local knowledge about unique neighbourhood characteristics and emerging trends.
We hope that this will be a useful and thought provoking document. Any comments or feedback is welcome at: [email protected].
A Health and Social Profi leA Health and Social Profi le Vancouver Coastal Health 5
COMMUNITY HEALTH AREA 1 CITY CENTRE
A Health and Social Profi leA Health and Social Profi le Vancouver Coastal Health 5
COMMUNITY HEALTH AREA 6 SOUTH VANCOUVERSOUTH VANCOUVER
AcknowledgementsWe would like to thank the following people for their contributions to the Vancouver Health and Social Profi les.
Participants in community consultation about the profi le design:Participants in community consultation about the profi le design:
Diane Ash, Westside Family Place
Adrian Archambault, Grandview Woodlands Community Policing Centre
Madeline Boscoe, REACH Community Health Centre
Sharon Babu, South Family Place
Donna Clarke, Renfrew-Collingwood Seniors Society
Terri Corcoran, David Thompson Secondary School
Kayo Devcic, Vancouver Coastal Health
Agata Feetham, Gordon Neighbourhood House
Christine Gillespie, Vancouver Coastal Health
Clemencia Gomez, South Granville Seniors Centre
Barb Kirby, BC Community Response Networks
Sandra Menzer, Vancouver Society of Children’s Centres
Ken Paquette, The Kettle Friendship Society
Wei-Wei Siew, South Vancouver Neighbourhood House
Sanja Sladojevic, Little Mountain Neighbourhood House
Chelan Wallace, South Vancouver Neighbourhood House
Marla States, Helping Spirit Lodge Society
Ethel Whitty, Carnegie Centre
Authors of the introductions for each profi le:Authors of the introductions for each profi le:
Joel Bronstein, Executive Director, Little Mountain Neighbourhood House
Michelle Fortin, Executive Director, Watari Youth, Family & Community Services
Jennifer Gray-Grant, Executive Director, Collingwood Neighbourhood House
Kate Hodgson, Executive Director, Network of Inner City Community Services Society
Eric Kowalski, Executive Director, West End Seniors Network
Karen Larcombe, Executive Director, South Vancouver Neighbourhood House
Emily Palmer, Director of Community Programs, Kitsilano Neighbourhood House
A Health and Social Profi leA Health and Social Profi le Vancouver Coastal Health 6
COMMUNITY HEALTH AREA 1 CITY CENTRE
A Health and Social Profi leA Health and Social Profi le Vancouver Coastal Health 6
COMMUNITY HEALTH AREA 6 SOUTH VANCOUVERSOUTH VANCOUVER
Organizations that provided data:Organizations that provided data:
BC Centre for Disease Control
BC Centre for Excellence in HIV/AIDS
BC Minstry of Health
BC Vital Statistics Agency (VISTA)
Food Secure Vancouver
City of Vancouver
Immunize BC
Stats Canada
UBC Human Early Learning Partnership
VCH Aboriginal Health Strategic Initiatives Program
VCH Public Health Surveillance Unit (PHSU)
Vancouver School Board
Westcoast Childcare Resource Centre
Cover map created by Patient Health Education Materials Program, VCH Centre for Patients and Families, May 2012.
Reviewers: Reviewers:
Dr. John Carsley, Medical Health Offi cer, Vancouver Coastal Health
Dr. Meena Dawar, Medical Health Offi cer, Vancouver Coastal Health
Ken Hawkins, Advisor, Decision Support, Vancouver Coastal Health
Dr. Jat Sandhu, Regional Director, Public Health Surveillance Unit (PHSU), Vancouver Coastal Health
Additional Assistance:Additional Assistance:
Lianne Carley, Policy Consultant, Vancouver Coastal Health
Belinda Boyd, Leader, Community Engagement, Vancouver Coastal Health
Susann Richter, Leader, Community Engagement, Vancouver Coastal Health
Andi Cuddington, Leader, Community Engagement, Vancouver Coastal Health
Margreth Tolson, Leader, Community Engagement, Vancouver Coastal Health
Elizabeth Holliday, Health Systems Planning Adviser, Vancouver Coastal Health
Maritia Gully, Regional Epidemiologist, Public Health Surveillance Unit, Vancouver Coastal Health

A Health and Social Profi leA Health and Social Profi le Vancouver Coastal Health 7
COMMUNITY HEALTH AREA 1 CITY CENTRE
A Health and Social Profi leA Health and Social Profi le Vancouver Coastal Health 7
COMMUNITY HEALTH AREA 6 SOUTH VANCOUVERSOUTH VANCOUVER
Introduction by community partnerKAREN LARCOMBE, EXECUTIVE DIRECTOR, SOUTH VANCOUVER NEIGHBOURHOOD HOUSE
This large geographic area, which includes 5 city neighbourhoods, features a strong family orientation, a high proportion of immigrants (60%), a large and growing seniors population, young children with multiple vulnerabilities, and pockets of low income and single parent households. Furthermore, South Vancouver is growing rapidly due to large scale planned developments in the Marpole/Oakridge and River District/East Fraser Lands - up to 40,000 new residents are expected in the next 15 years. Lack of community amenities and poor public transportation in CHA 6 are urgent problems that will be exacerbated as the population grows.
CHA6 has many community strengths. Looking around our neighbourhoods, one sees many examples of neighbours helping neighbours and people volunteering their talents to build a healthy community; community gardens, seniors walking clubs, and multicultural potlucks are all indicators of a caring community. Local activists are also addressing issues such as the lack of public transportation and amenities for seniors. Motivated by the lack of a seniors centre in South East Vancouver, seniors created the South Vancouver Seniors Arts and Cultural society. With fund raising well underway, we hope to celebrate the centre’s opening in the near future.
The historical lack of services and amenities in CHA 6 has led to a strong culture of collaboration between organizations such as: neighbourhood houses, family places, community centers, community service agencies, schools, health and mental health services, libraries, faith groups, businesses and community policing. The following activities refl ect a sample of community

A Health and Social Profi leA Health and Social Profi le Vancouver Coastal Health 8
COMMUNITY HEALTH AREA 1 CITY CENTRE
A Health and Social Profi leA Health and Social Profi le Vancouver Coastal Health 8
COMMUNITY HEALTH AREA 6 SOUTH VANCOUVERSOUTH VANCOUVER
agency eff orts to build a healthy community.
Marpole Place Neighbourhood House provides services and a welcoming gathering space for people of all ages. Responding to the areas homeless population, the Neighbourhood House opens as an extreme weather shelter and is strategizing methods to address homelessness by convening the Homeless Connect group.
Marpole Oakridge Family Place is also open to the whole community. Community workers observe that more low income immigrant families are settling into Marpole apartments. Partnering with the food bank and local schools, Family Place is helping newcomer families meet their basic needs.
In the Sunset, Victoria Fraserview and Killarney area, South Vancouver Family Place established several family support and early child development programs in partnership with local schools. Now established as Strong Start Centres, these programs greatly improved access to Early Childhood Development supports for isolated immigrant families. Family Place has also created an innovative partnership with the River District developer, off ering a family resource program to isolated families living in the Fraserlands area.
South Vancouver Neighbourhood House also works with residents and agency partners to provide services and support community development across South East Vancouver. With projects such as the South Vancouver Seniors’ Hub, Youth Green Team, Sunset Literacy, South Vancouver Food Network and intercultural dialogue circles, people are addressing community issues and at the same time fi nding a sense of belonging through engaging in community life.

A Health and Social Profi le Vancouver Coastal Health 9A Health and Social Profi le Vancouver Coastal Health 9
COMMUNITY HEALTH AREA 6 SOUTH VANCOUVERSOUTH VANCOUVER
A Health and Social Profi le Vancouver Coastal Health 9A Health and Social Profi leA Health and Social Profi le Vancouver Coastal Health 9
Population estimates and projectionsPopulation estimates and projections provide social agencies, government and other service providers with an opportunity to plan for emerging trends.
Population projections can be used to gauge future population and composition rates.
Multiple projection series are produced using diff erent combinations of assumptions about future fertility (births), mortality (deaths), and migration.
A Health and Social Profi leA Health and Social Profi le Vancouver Coastal Health 10
COMMUNITY HEALTH AREA 1 CITY CENTRE
A Health and Social Profi leA Health and Social Profi le Vancouver Coastal Health 10
COMMUNITY HEALTH AREA 6 SOUTH VANCOUVERSOUTH VANCOUVER
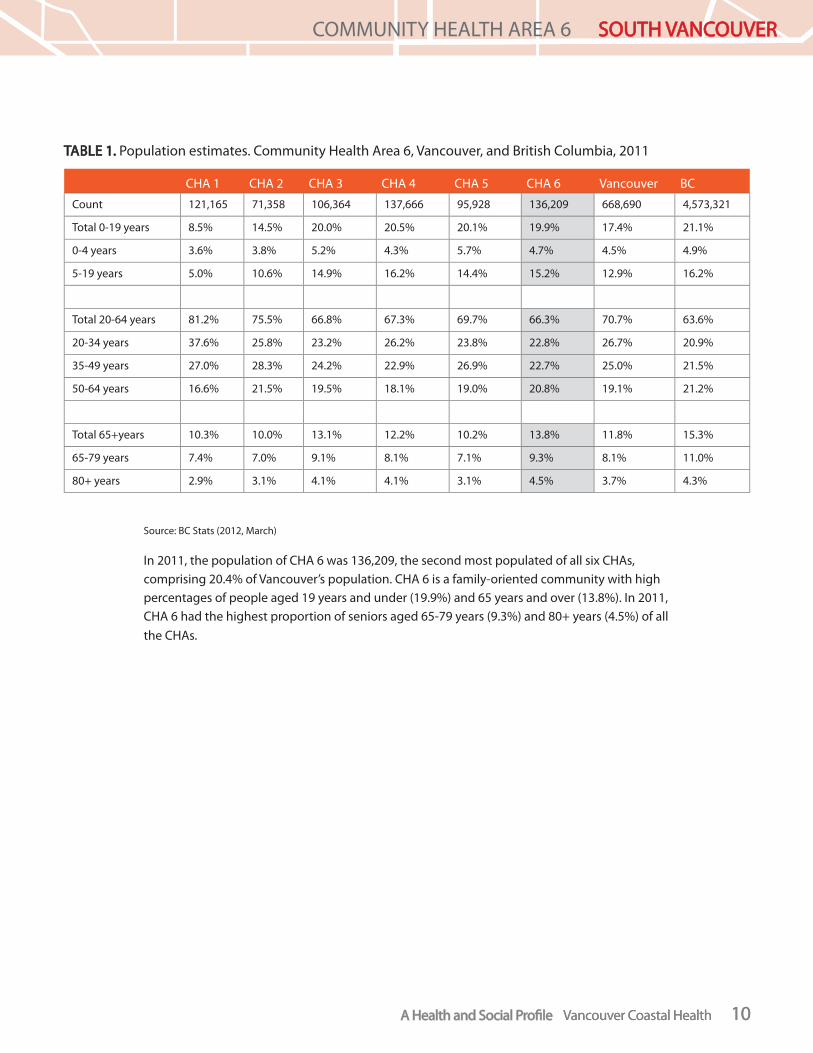
TABLE 1.TABLE 1. Population estimates. Community Health Area 6, Vancouver, and British Columbia, 2011
CHA 1 CHA 2 CHA 3 CHA 4 CHA 5 CHA 6 Vancouver BC
Count 121,165 71,358 106,364 137,666 95,928 136,209 668,690 4,573,321
Total 0-19 years 8.5% 14.5% 20.0% 20.5% 20.1% 19.9% 17.4% 21.1%
0-4 years 3.6% 3.8% 5.2% 4.3% 5.7% 4.7% 4.5% 4.9%
5-19 years 5.0% 10.6% 14.9% 16.2% 14.4% 15.2% 12.9% 16.2%
Total 20-64 years 81.2% 75.5% 66.8% 67.3% 69.7% 66.3% 70.7% 63.6%
20-34 years 37.6% 25.8% 23.2% 26.2% 23.8% 22.8% 26.7% 20.9%
35-49 years 27.0% 28.3% 24.2% 22.9% 26.9% 22.7% 25.0% 21.5%
50-64 years 16.6% 21.5% 19.5% 18.1% 19.0% 20.8% 19.1% 21.2%
Total 65+years 10.3% 10.0% 13.1% 12.2% 10.2% 13.8% 11.8% 15.3%
65-79 years 7.4% 7.0% 9.1% 8.1% 7.1% 9.3% 8.1% 11.0%
80+ years 2.9% 3.1% 4.1% 4.1% 3.1% 4.5% 3.7% 4.3%
Source: BC Stats (2012, March)
In 2011, the population of CHA 6 was 136,209, the second most populated of all six CHAs, comprising 20.4% of Vancouver’s population. CHA 6 is a family-oriented community with high percentages of people aged 19 years and under (19.9%) and 65 years and over (13.8%). In 2011, CHA 6 had the highest proportion of seniors aged 65-79 years (9.3%) and 80+ years (4.5%) of all the CHAs.
A Health and Social Profi leA Health and Social Profi le Vancouver Coastal Health 11
COMMUNITY HEALTH AREA 1 CITY CENTRE
A Health and Social Profi leA Health and Social Profi le Vancouver Coastal Health 11
COMMUNITY HEALTH AREA 6 SOUTH VANCOUVERSOUTH VANCOUVER
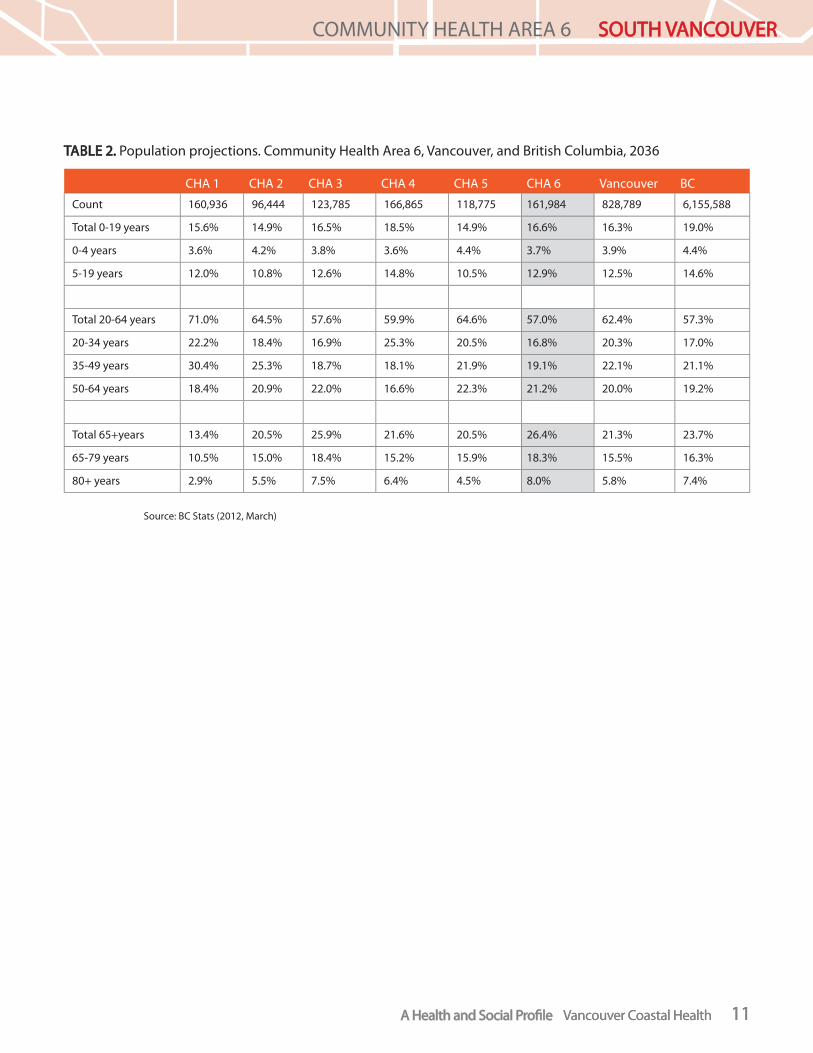
TABLE 2.TABLE 2. Population projections. Community Health Area 6, Vancouver, and British Columbia, 2036
CHA 1 CHA 2 CHA 3 CHA 4 CHA 5 CHA 6 Vancouver BC
Count 160,936 96,444 123,785 166,865 118,775 161,984 828,789 6,155,588
Total 0-19 years 15.6% 14.9% 16.5% 18.5% 14.9% 16.6% 16.3% 19.0%
0-4 years 3.6% 4.2% 3.8% 3.6% 4.4% 3.7% 3.9% 4.4%
5-19 years 12.0% 10.8% 12.6% 14.8% 10.5% 12.9% 12.5% 14.6%
Total 20-64 years 71.0% 64.5% 57.6% 59.9% 64.6% 57.0% 62.4% 57.3%
20-34 years 22.2% 18.4% 16.9% 25.3% 20.5% 16.8% 20.3% 17.0%
35-49 years 30.4% 25.3% 18.7% 18.1% 21.9% 19.1% 22.1% 21.1%
50-64 years 18.4% 20.9% 22.0% 16.6% 22.3% 21.2% 20.0% 19.2%
Total 65+years 13.4% 20.5% 25.9% 21.6% 20.5% 26.4% 21.3% 23.7%
65-79 years 10.5% 15.0% 18.4% 15.2% 15.9% 18.3% 15.5% 16.3%
80+ years 2.9% 5.5% 7.5% 6.4% 4.5% 8.0% 5.8% 7.4%
Source: BC Stats (2012, March)

A Health and Social Profi leA Health and Social Profi le Vancouver Coastal Health 12
COMMUNITY HEALTH AREA 1 CITY CENTRE
A Health and Social Profi leA Health and Social Profi le Vancouver Coastal Health 12
COMMUNITY HEALTH AREA 6 SOUTH VANCOUVERSOUTH VANCOUVER
FIGURE 1.FIGURE 1. Population distribution (%) by sex and age group. Community Health Area 6, 2006, 2011, and 2036
Source: BC Stats (2012, March )
Figure 1 illustrates the sex distribution in CHA 6 with males on the left and females on the right. Overall in 2011, there were 49.4% males and 50.6% females; however, the composition shifts according to the age group.
Figure 1 also shows the number of people in each fi ve-year age group. The fi gure shows what the population composition was in 2006 (black line), 2011 (bars), and what it is expected to look like in 2036 (red dotted line).
The population distribution in CHA 6 has not changed signifi cantly since 2006. By 2036, the total population of CHA 6 is projected to increase by 18.8% to 161,984 persons. The population of CHA 6 is also expected to age. In 2036, there will be 12.6% more people aged 65 years and over; again, the highest amongst the CHAs.
<11-45-9
10-1415-1920-2425-2930-3435-3940-4445-4950-5455-5960-6465-6970-7475-7980-8485-89
90+
6.0 4.0 2.0 0.0 2.0 4.0 6.0
Male (CHA6, 2011)Female (CHA6, 2011)
CHA6 (2036)CHA6 (2006)

A Health and Social Profi le Vancouver Coastal Health 13A Health and Social Profi le Vancouver Coastal Health 13
COMMUNITY HEALTH AREA 6 SOUTH VANCOUVERSOUTH VANCOUVER
A Health and Social Profi le Vancouver Coastal Health 13A Health and Social Profi leA Health and Social Profi le Vancouver Coastal Health 13
Demographic compositionThis section draws attention to the demographic composition of Community Health Area 6 and how it relates to diversity, education and childhood development, employment and income, and housing and household characteristics.
A Health and Social Profi leA Health and Social Profi le Vancouver Coastal Health 14
COMMUNITY HEALTH AREA 1 CITY CENTRE
A Health and Social Profi leA Health and Social Profi le Vancouver Coastal Health 14
COMMUNITY HEALTH AREA 6 SOUTH VANCOUVERSOUTH VANCOUVER
DiversityVisible Minorities.Visible Minorities. Both Statistics Canada and the Public Service Commission of Canada use the following defi nition of visible minority: A person in a visible minority group is someone who is non-white in colour/race, regardless of place of birth.
The immigrant populationThe immigrant population is defi ned as persons who are, or who have been, landed immigrants in Canada. This term does not include non-permanent residents, persons in Canada on employment or student authorizations, refugee claimants or persons born outside Canada who are Canadian citizens by birth (Statistics Canada, 2010, July 6).
Recent immigrantsRecent immigrants refer to landed immigrants who came to Canada up to fi ve years prior to a given census year. For the 2006 Census, recent immigrants are landed immigrants who arrived in Canada between January 1, 2001 and May 16, 2006 (Statistics Canada, 2010, July 6).

A Health and Social Profi leA Health and Social Profi le Vancouver Coastal Health 15
COMMUNITY HEALTH AREA 1 CITY CENTRE
A Health and Social Profi leA Health and Social Profi le Vancouver Coastal Health 15
COMMUNITY HEALTH AREA 6 SOUTH VANCOUVERSOUTH VANCOUVER
Aboriginal Population
Over the past few decades the health status of Aboriginal peoples in Vancouver has improved, particularly in the areas of infant mortality, unintentional injuries and suicide. These improvements can be attributed to changes in the social determinants of health, improved access to health care services and greater emphasis on cultural teachings. Participants at the 2011 Forum for Aboriginal Elders identifi ed many positive impacts that result from preserving Aboriginal cultural traditions. A number of community organizations operate in Vancouver to meet the needs of urban Aboriginal people. These include the Vancouver Aboriginal Council, the Vancouver Aboriginal Friendship Centre, the Urban Native Youth Association, and the Aboriginal Mother Centre Society.
FIGURE 2.FIGURE 2. Aboriginal population as percentage (%) of the total population. Community Health Area 6, Vancouver, and British Columbia, 2006
Source: Statistics Canada, 2006 Census of Population
The Aboriginal population of CHA 6 is 0.9%, the lowest amongst the CHAs and lower as compared to Vancouver (2.0%) and BC (4.8%).

A Health and Social Profi leA Health and Social Profi le Vancouver Coastal Health 16
COMMUNITY HEALTH AREA 1 CITY CENTRE
A Health and Social Profi leA Health and Social Profi le Vancouver Coastal Health 16
COMMUNITY HEALTH AREA 6 SOUTH VANCOUVERSOUTH VANCOUVER
Immigrant population
FIGURE 3.FIGURE 3. Immigrant population as a percentage (%) of the total population. Community Health Areas, Vancouver, and British Columbia, 2006

A Health and Social Profi leA Health and Social Profi le Vancouver Coastal Health 17
COMMUNITY HEALTH AREA 1 CITY CENTRE
A Health and Social Profi leA Health and Social Profi le Vancouver Coastal Health 17
COMMUNITY HEALTH AREA 6 SOUTH VANCOUVERSOUTH VANCOUVER
FIGURE 4.FIGURE 4. Select visible minority groups as a percentage (%) of the total visible minority population in Community Health Area 6 and Vancouver, 2006
Source: Statistics Canada, 2006 Census of Population
Relative to Vancouver, a greater proportion of people in CHA 6 identifi ed as either Chinese (58.6%) or South Asian (19.3%). CHA 6 is home to Vancouver’s largest South Asian population.
FIGURE 5.FIGURE 5. Total population by select mother tongue. Community Health Area 6 and Vancouver, 2006
Source: Statistics Canada, 2006 Census of Population
“N.o.s.” stands for “not otherwise specifi ed”. This refers to people who reported “Chinese” in their response to the question on language spoken most often at home without specifying Mandarin, Cantonese or other Chinese languages.

A Health and Social Profi leA Health and Social Profi le Vancouver Coastal Health 18
COMMUNITY HEALTH AREA 1 CITY CENTRE
A Health and Social Profi leA Health and Social Profi le Vancouver Coastal Health 18
COMMUNITY HEALTH AREA 6 SOUTH VANCOUVERSOUTH VANCOUVER
Education and healthy child developmentChild care enables parents of young children to work or study on a full or part-time basis. A vast body of research has demonstrated that quality early learning and child care has signifi cant educational, social, and emotional benefi ts for children.
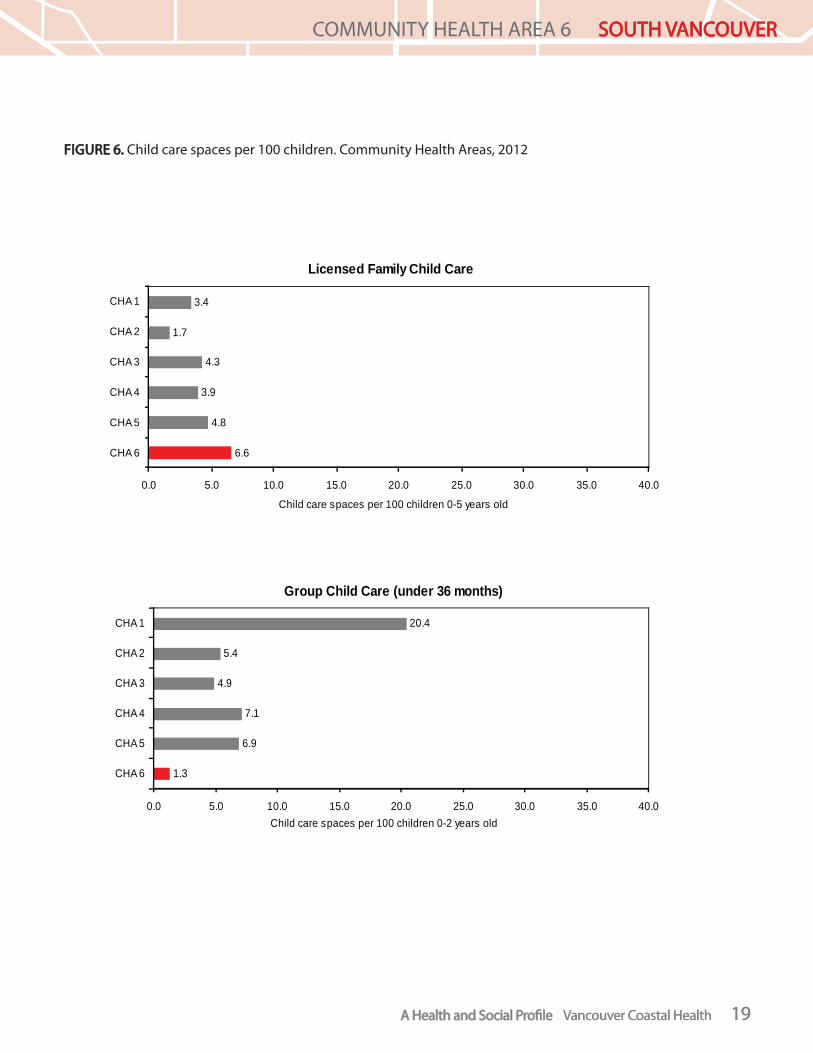
Licensed Family Child Care is off ered in a child care provider’s own home, and serves a maximum of 7 children from birth to age 12. Group Child Care serves children in two age groupings: from birth to 36 months and from 30 months to school-age. Preschools serve children age 30 months to school entry. Preschools are part-day programs, typically operating on the school-year, September to June (Vancouver Coastal Health, 2009).
Within Vancouver, the number of child care spaces varies considerably by CHA. While the number of spaces has increased in recent years, the population under age 5 is also increasing and child care availability remains low. Many families rely on informal child care arrangements.
In CHA 6 there are 1.3 licensed group child care spaces for every 100 children under 36 months and 11.3 licensed group child care spaces for every 100 children age 3-5 years. CHA 6 has the highest rate of preschool spaces, with 34.8 spaces for every 100 children ages 3-5.
Note: data provided here do not include unlicensed, “licence-not-required” nor informal child care arrangements (e.g. care by relative, nanny).
A Health and Social Profi leA Health and Social Profi le Vancouver Coastal Health 19
COMMUNITY HEALTH AREA 1 CITY CENTRE
A Health and Social Profi leA Health and Social Profi le Vancouver Coastal Health 19
COMMUNITY HEALTH AREA 6 SOUTH VANCOUVERSOUTH VANCOUVER
FIGURE 6.FIGURE 6. Child care spaces per 100 children. Community Health Areas, 2012
Licensed Family Child Care
6.6
4.8
3.9
4.3
1.7
3.4
0.0 5.0 10.0 15.0 20.0 25.0 30.0 35.0 40.0
CHA 6
CHA 5
CHA 4
CHA 3
CHA 2
CHA 1
Child care spaces per 100 children 0-5 years old
Group Child Care (under 36 months)
1.3
6.9
7.1
4.9
5.4
20.4
0.0 5.0 10.0 15.0 20.0 25.0 30.0 35.0 40.0
CHA 6
CHA 5
CHA 4
CHA 3
CHA 2
CHA 1
Child care spaces per 100 children 0-2 years old

A Health and Social Profi leA Health and Social Profi le Vancouver Coastal Health 20
COMMUNITY HEALTH AREA 1 CITY CENTRE
A Health and Social Profi leA Health and Social Profi le Vancouver Coastal Health 20
COMMUNITY HEALTH AREA 6 SOUTH VANCOUVERSOUTH VANCOUVER
Source: Westcoast Child Care Resource and Referral and City of Vancouver, 2012
Group Child Care (30 months to school age)
11.3
14.2
19.6
9.5
18.9
23.5
0.0 5.0 10.0 15.0 20.0 25.0 30.0 35.0 40.0
CHA 6
CHA 5
CHA 4
CHA 3
CHA 2
CHA 1
Child care spaces per 100 children 3-5 years old
Preschool
34.8
20.7
31.9
19.7
21.1
16.0
0.0 5.0 10.0 15.0 20.0 25.0 30.0 35.0 40.0
CHA 6
CHA 5
CHA 4
CHA 3
CHA 2
CHA 1
Preschool spaces per 100 children 3-4 years old
School Age Child Care (after-school care)
8.0
8.2
12.1
8.9
9.7
9.2
0.0 5.0 10.0 15.0 20.0 25.0 30.0 35.0 40.0
CHA 6
CHA 5
CHA 4
CHA 3
CHA 2
CHA 1
School age child care spaces per 100 children 5-12 years old
A Health and Social Profi leA Health and Social Profi le Vancouver Coastal Health 21
COMMUNITY HEALTH AREA 1 CITY CENTRE
A Health and Social Profi leA Health and Social Profi le Vancouver Coastal Health 21
COMMUNITY HEALTH AREA 6 SOUTH VANCOUVERSOUTH VANCOUVER
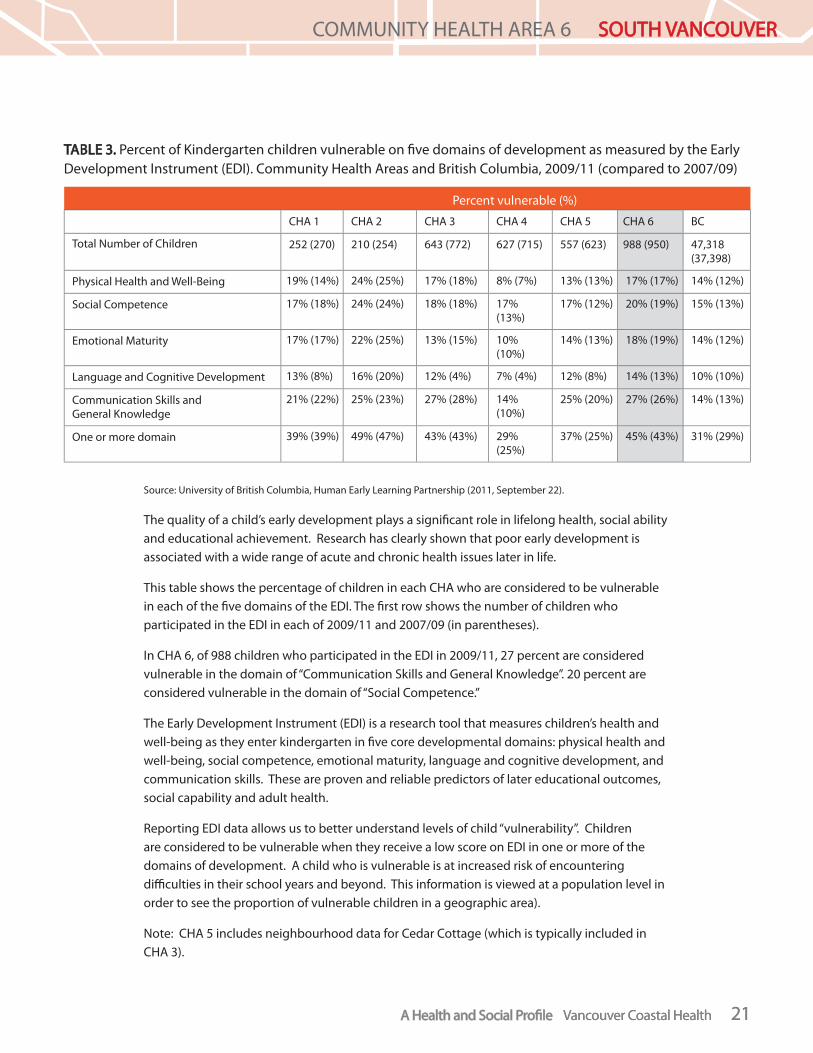
TABLE 3.TABLE 3. Percent of Kindergarten children vulnerable on fi ve domains of development as measured by the Early Development Instrument (EDI). Community Health Areas and British Columbia, 2009/11 (compared to 2007/09)
Percent vulnerable (%)
CHA 1 CHA 2 CHA 3 CHA 4 CHA 5 CHA 6 BC
Total Number of Children 252 (270) 210 (254) 643 (772) 627 (715) 557 (623) 988 (950) 47,318 (37,398)
Physical Health and Well-Being 19% (14%) 24% (25%) 17% (18%) 8% (7%) 13% (13%) 17% (17%) 14% (12%)
Social Competence 17% (18%) 24% (24%) 18% (18%) 17% (13%)
17% (12%) 20% (19%) 15% (13%)
Emotional Maturity 17% (17%) 22% (25%) 13% (15%) 10% (10%)
14% (13%) 18% (19%) 14% (12%)
Language and Cognitive Development 13% (8%) 16% (20%) 12% (4%) 7% (4%) 12% (8%) 14% (13%) 10% (10%)
Communication Skills and General Knowledge
21% (22%) 25% (23%) 27% (28%) 14% (10%)
25% (20%) 27% (26%) 14% (13%)
One or more domain 39% (39%) 49% (47%) 43% (43%) 29% (25%)
37% (25%) 45% (43%) 31% (29%)
Source: University of British Columbia, Human Early Learning Partnership (2011, September 22).
The quality of a child’s early development plays a signifi cant role in lifelong health, social ability and educational achievement. Research has clearly shown that poor early development is associated with a wide range of acute and chronic health issues later in life.
This table shows the percentage of children in each CHA who are considered to be vulnerable in each of the fi ve domains of the EDI. The fi rst row shows the number of children who participated in the EDI in each of 2009/11 and 2007/09 (in parentheses).
In CHA 6, of 988 children who participated in the EDI in 2009/11, 27 percent are considered vulnerable in the domain of “Communication Skills and General Knowledge”. 20 percent are considered vulnerable in the domain of “Social Competence.”
The Early Development Instrument (EDI) is a research tool that measures children’s health and well-being as they enter kindergarten in fi ve core developmental domains: physical health and well-being, social competence, emotional maturity, language and cognitive development, and communication skills. These are proven and reliable predictors of later educational outcomes, social capability and adult health.
Reporting EDI data allows us to better understand levels of child “vulnerability”. Children are considered to be vulnerable when they receive a low score on EDI in one or more of the domains of development. A child who is vulnerable is at increased risk of encountering diffi culties in their school years and beyond. This information is viewed at a population level in order to see the proportion of vulnerable children in a geographic area).
Note: CHA 5 includes neighbourhood data for Cedar Cottage (which is typically included in CHA 3).

A Health and Social Profi leA Health and Social Profi le Vancouver Coastal Health 22
COMMUNITY HEALTH AREA 1 CITY CENTRE
A Health and Social Profi leA Health and Social Profi le Vancouver Coastal Health 22
COMMUNITY HEALTH AREA 6 SOUTH VANCOUVERSOUTH VANCOUVER
TABLE 4. TABLE 4. Middle Years Development Instrument Well-Being Index, 2011
Community Health Area Number of students Low Medium/High
Very High/Thriving
CHA 1 143 16.2% 30.9% 52.9%
CHA 2 180 22.3% 39.4% 38.3%
CHA 3 735 31.9% 35.5% 32.6%
CHA 4 600 17.3% 33.2% 49.5%
CHA 5 418 22.3% 35.9% 41.8%
CHA 6 925 31.3% 30.5% 38.3%
Source: University of British Columbia, Human Early Learning Partnership, Personal Communication (2012, August 13)
The Middle-Years Development Instrument (MDI) measures social and emotional health, and also gathers information about children’s perceptions of the community assets available to support their health and development.
The MDI is a self-report questionnaire administered to Grade 4 children. It was used to gather data from all Vancouver School District children starting in 2011. Data from the Vancouver MDI project can be used to provide an overall picture of child well-being. The MDI calculates an overall health and well-being score which is composed of 5 dimensions: optimism, happiness, self-esteem, general health, and sadness (reverse-scored).
Table 4 shows that of the 925 grade 4 children from CHA 6 who participated in the MDI questionnaire in 201, almost 70% are doing well (scored “very high/thriving or “medium/high”). Children who scored “high” agreed or strongly agreed with statements like “I have more good times than bad times”, “I am happy with my life”, and “the things in my life are excellent”. Children who were considered “medium” on the well-being index responded that these statements were partially or somewhat true for them. Children who responded that they disagreed with these statements were designated as having a “low” level of well-being.

A Health and Social Profi leA Health and Social Profi le Vancouver Coastal Health 23
COMMUNITY HEALTH AREA 1 CITY CENTRE
A Health and Social Profi leA Health and Social Profi le Vancouver Coastal Health 23
COMMUNITY HEALTH AREA 6 SOUTH VANCOUVERSOUTH VANCOUVER
TABLE 5.TABLE 5. Middle Years Development Instrument percent ageof students reporting presence of each asset, 2011
Percentage of grade 4 students that report the presence of each asset
Community Health Area After School Activities Peer Relationships Nutrition and Sleep Adult Relationships
CHA 1 67.4% 85% 72% 83.7%
CHA 2 76.2% 74% 63.3% 79.5%
CHA 3 63.5% 76% 65.2% 70.9%
CHA 4 88.5% 79.8% 76.7% 82.7%
CHA 5 71.4% 78.3% 71.8% 75.5%
CHA 6 72.6% 76.9% 67.2% 73.5%
Source: University of British Columbia, Human Early Learning Partnership, Personal Communication, (2012, August 13).
The MDI also gathers information from children about their perception of the community and school assets they experience. Children were asked about their experiences of connection with adults in their schools, neighbourhoods and at home, and with their peers. They were also asked about how often they eat breakfast, how often they get a good night’s sleep, and whether they participated in after-school activities.
Table 5 shows that children in CHA 6 report having positive relationships with peers and adults. Almost 73% of children in CHA 6 participate in after-school activities. This is less than children in CHAs 2 and 4 but more than children in CHAs 1, 3 and 5. About 67% of children in CHA 6 report that they usually eat breakfast and get a good night’s sleep.

A Health and Social Profi leA Health and Social Profi le Vancouver Coastal Health 24
COMMUNITY HEALTH AREA 1 CITY CENTRE
A Health and Social Profi leA Health and Social Profi le Vancouver Coastal Health 24
COMMUNITY HEALTH AREA 6 SOUTH VANCOUVERSOUTH VANCOUVER
FIGURE 7.FIGURE 7. Percentage of students enrolled in the Vancouver School Board with a special needs designation or who are English Language Learners, Community Health Areas and Vancouver, 2010/11 school year
Source: Vancouver School Board, Personal Communication, (2011, September 30)
* The “special needs designation” includes all children designated with any of the following needs: physically dependent – multiple needs, deaf-blind, moderate to profound intellectual disabilities, physical disability or chronic health impairment, visual impairment, deaf or hard of hearing, autism spectrum disorder (ASD), students requiring intensive behaviour intervention or students with serious mental illness, mild intellectual disabilities, gifted, learning disabilities, students requiring behaviour support or students with mental illness. Detailed defi nitions for these designations can be found here: http://www.vsb.bc.ca/ministry-designations.
In September 2011 there were 55,062 students enrolled in the Vancouver School Board. Of these, about 1 in 10 students had a “special needs” designation and about 1 in 3 students were English Language Learners.
To best understand this information, it is important to consider both the percentages and numbers of children in each category. For example, while CHA 4 has a low percentage of students with a special needs designation (10.2%), it is home to the highest number of children with special needs designations (1,487 children).
Note: this table reports data based on school of enrolment. Some students attend schools in a community health area that is diff erent from their community health area of residence.
A Health and Social Profi leA Health and Social Profi le Vancouver Coastal Health 25
COMMUNITY HEALTH AREA 1 CITY CENTRE
A Health and Social Profi leA Health and Social Profi le Vancouver Coastal Health 25
COMMUNITY HEALTH AREA 6 SOUTH VANCOUVERSOUTH VANCOUVER
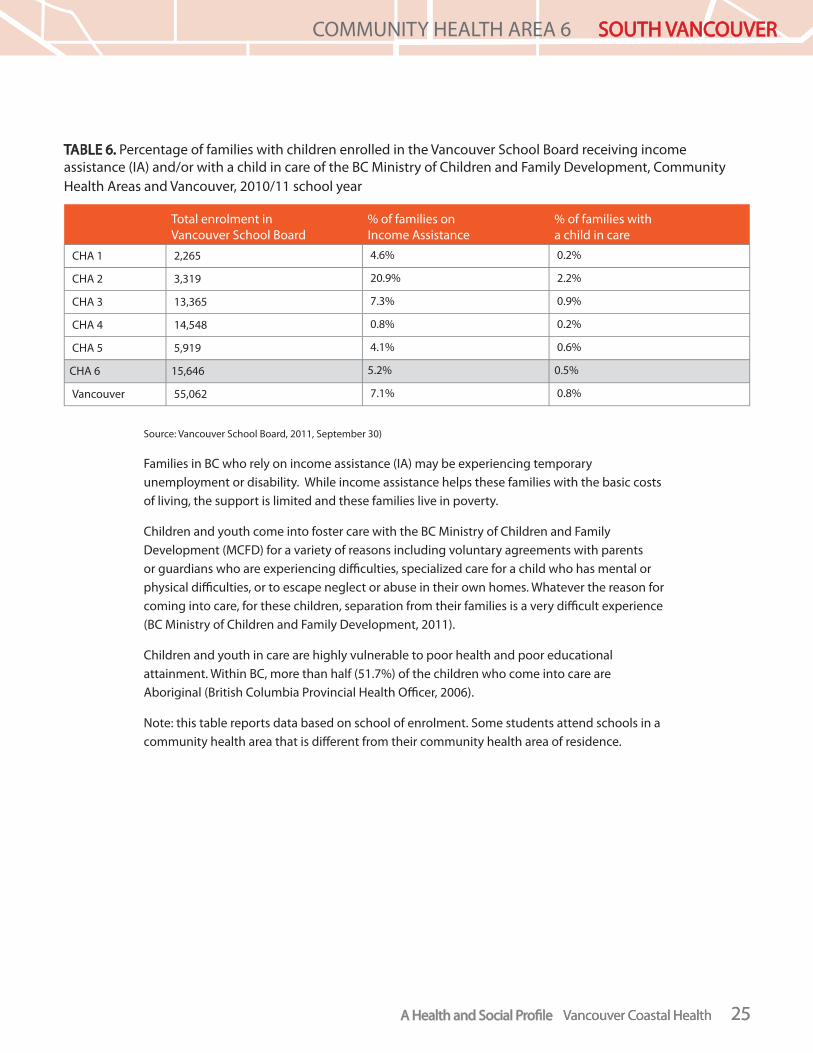
TABLE 6.TABLE 6. Percentage of families with children enrolled in the Vancouver School Board receiving income assistance (IA) and/or with a child in care of the BC Ministry of Children and Family Development, Community Health Areas and Vancouver, 2010/11 school year
Total enrolment in Vancouver School Board
% of families on Income Assistance
% of families with a child in care
CHA 1 2,265 4.6% 0.2%
CHA 2 3,319 20.9% 2.2%
CHA 3 13,365 7.3% 0.9%
CHA 4 14,548 0.8% 0.2%
CHA 5 5,919 4.1% 0.6%
CHA 6 15,646 5.2% 0.5%
Vancouver 55,062 7.1% 0.8%
Source: Vancouver School Board, 2011, September 30)
Families in BC who rely on income assistance (IA) may be experiencing temporary unemployment or disability. While income assistance helps these families with the basic costs of living, the support is limited and these families live in poverty.
Children and youth come into foster care with the BC Ministry of Children and Family Development (MCFD) for a variety of reasons including voluntary agreements with parents or guardians who are experiencing diffi culties, specialized care for a child who has mental or physical diffi culties, or to escape neglect or abuse in their own homes. Whatever the reason for coming into care, for these children, separation from their families is a very diffi cult experience (BC Ministry of Children and Family Development, 2011).
Children and youth in care are highly vulnerable to poor health and poor educational attainment. Within BC, more than half (51.7%) of the children who come into care are Aboriginal (British Columbia Provincial Health Offi cer, 2006).
Note: this table reports data based on school of enrolment. Some students attend schools in a community health area that is diff erent from their community health area of residence.

A Health and Social Profi leA Health and Social Profi le Vancouver Coastal Health 26
COMMUNITY HEALTH AREA 1 CITY CENTRE
A Health and Social Profi leA Health and Social Profi le Vancouver Coastal Health 26
COMMUNITY HEALTH AREA 6 SOUTH VANCOUVERSOUTH VANCOUVER
FIGURE 8.FIGURE 8. Percentage of students below the average on the Foundation Skills Assessment reading tests – average of Grade 4 and 7 students. Community Health Areas and British Columbia, average 2008/09-2010/11
Source: BC Stats (2011)
The Foundation Skills Assessment (FSA) is an annual, province-wide assessment of Grade 4 and 7 students’ academic skills, providing a snapshot of how well BC students are performing in reading comprehension, writing, and numeracy (BC Ministry of Education). There has been controversy over the meaningfulness and misuse of the data and many parents have opted their children out of writing these exams. As such, these numbers do not refl ect all Grade 4 and 7 students.
A Health and Social Profi leA Health and Social Profi le Vancouver Coastal Health 27
COMMUNITY HEALTH AREA 1 CITY CENTRE
A Health and Social Profi leA Health and Social Profi le Vancouver Coastal Health 27
COMMUNITY HEALTH AREA 6 SOUTH VANCOUVERSOUTH VANCOUVER
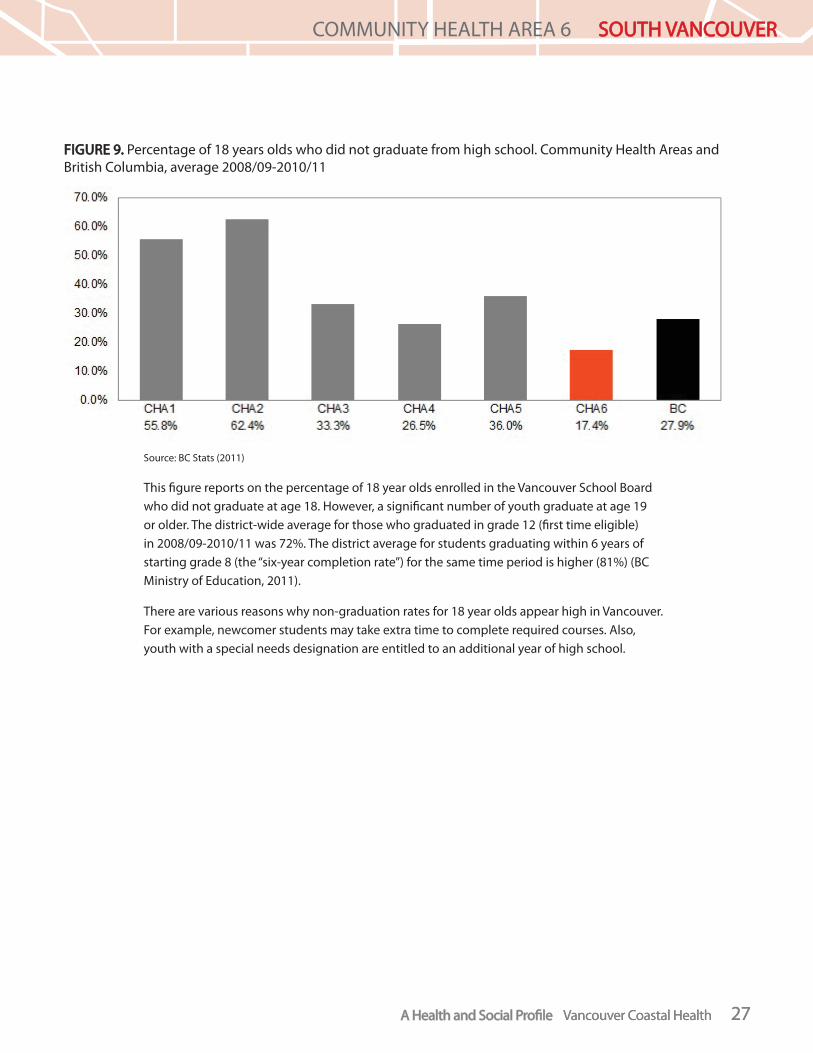
FIGURE 9.FIGURE 9. Percentage of 18 years olds who did not graduate from high school. Community Health Areas and British Columbia, average 2008/09-2010/11
Source: BC Stats (2011)
This fi gure reports on the percentage of 18 year olds enrolled in the Vancouver School Board who did not graduate at age 18. However, a signifi cant number of youth graduate at age 19 or older. The district-wide average for those who graduated in grade 12 (fi rst time eligible) in 2008/09-2010/11 was 72%. The district average for students graduating within 6 years of starting grade 8 (the “six-year completion rate”) for the same time period is higher (81%) (BC Ministry of Education, 2011).
There are various reasons why non-graduation rates for 18 year olds appear high in Vancouver. For example, newcomer students may take extra time to complete required courses. Also, youth with a special needs designation are entitled to an additional year of high school.
A Health and Social Profi leA Health and Social Profi le Vancouver Coastal Health 28
COMMUNITY HEALTH AREA 1 CITY CENTRE
A Health and Social Profi leA Health and Social Profi le Vancouver Coastal Health 28
COMMUNITY HEALTH AREA 6 SOUTH VANCOUVERSOUTH VANCOUVER
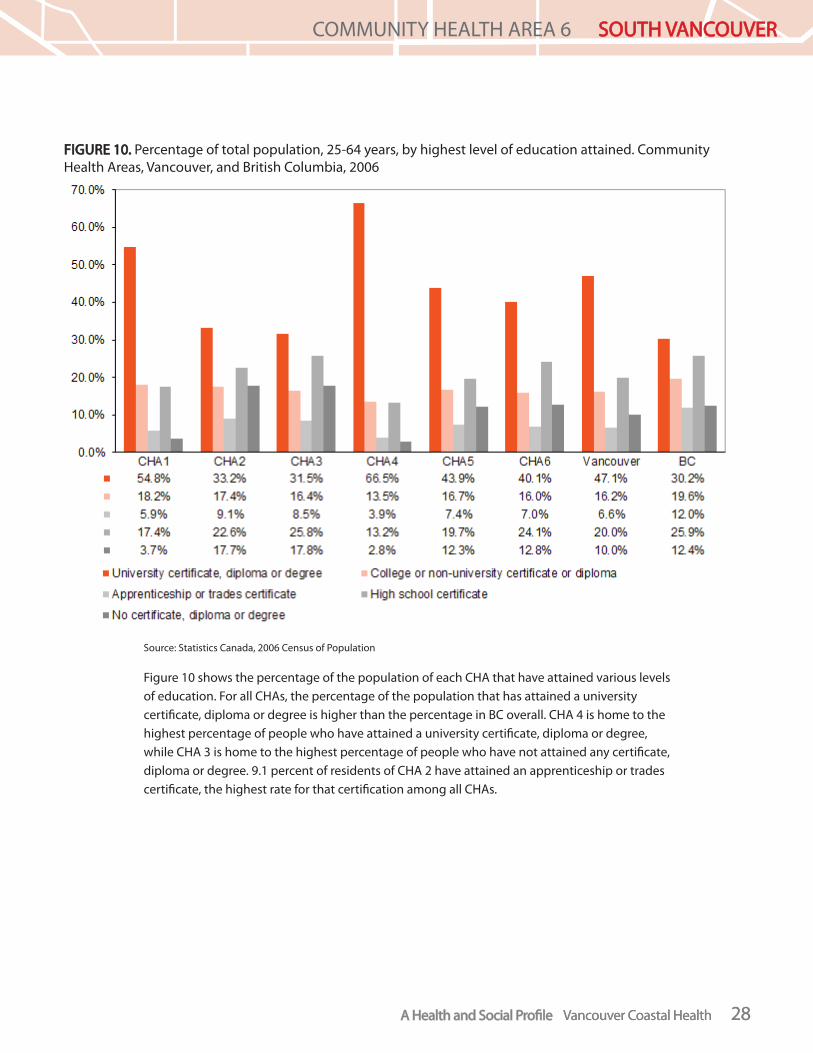
FIGURE 10.FIGURE 10. Percentage of total population, 25-64 years, by highest level of education attained. Community Health Areas, Vancouver, and British Columbia, 2006
Source: Statistics Canada, 2006 Census of Population
Figure 10 shows the percentage of the population of each CHA that have attained various levels of education. For all CHAs, the percentage of the population that has attained a university certifi cate, diploma or degree is higher than the percentage in BC overall. CHA 4 is home to the highest percentage of people who have attained a university certifi cate, diploma or degree, while CHA 3 is home to the highest percentage of people who have not attained any certifi cate, diploma or degree. 9.1 percent of residents of CHA 2 have attained an apprenticeship or trades certifi cate, the highest rate for that certifi cation among all CHAs.

A Health and Social Profi leA Health and Social Profi le Vancouver Coastal Health 29
COMMUNITY HEALTH AREA 1 CITY CENTRE
A Health and Social Profi leA Health and Social Profi le Vancouver Coastal Health 29
COMMUNITY HEALTH AREA 6 SOUTH VANCOUVERSOUTH VANCOUVER
Employment and income
FIGURE 11.FIGURE 11. Median after tax incomes of economic families. Community Health Areas, Vancouver, and British Columbia, 2006
Source: Statistics Canada, 2006 Census of Population
Median income divides income distribution into two groups - half having income above that amount and the other below (Statistics Canada, 2010, July 6). This measure of income is not distorted by the highest and lowest values of average income.
Economic families refer to a group of two or more persons who live in the same dwelling and are related to each other by blood, marriage, common‐law or adoption. A couple may be of opposite or same sex. For 2006, foster children are included.
$0
$10,000
$20,000
$30,000
$40,000
$50,000
$60,000
$70,000
$80,000
$59,424 $43,883 $52,404 $72,410 $54,987 $53,156 $56,700 $57,599
CHA1 CHA2 CHA3 CHA4 CHA5 CHA6 Vancouver BC

A Health and Social Profi leA Health and Social Profi le Vancouver Coastal Health 30
COMMUNITY HEALTH AREA 1 CITY CENTRE
A Health and Social Profi leA Health and Social Profi le Vancouver Coastal Health 30
COMMUNITY HEALTH AREA 6 SOUTH VANCOUVERSOUTH VANCOUVER
FIGURE 12.FIGURE 12. Median after-tax individual income of persons (aged 15+ years) not in economic families. Community Health Areas, Vancouver, and British Columbia
Source: Statistics Canada, 2006 Census of Population
TABLE 7.TABLE 7. Median and average after-tax income of individuals (aged 15+ years), by sex. Community Health Areas, Vancouver, and British Columbia, 2005
CHA 1 CHA 2 CHA 3 CHA 4 CHA 5 CHA 6 Vancouver BC
Median after-tax income ($)
Total $27,624 $16,309 $18,916 $27,831 $21,334 $18,952 $21,840 $22,785
Male $29,950 $16,823 $21,304 $31,885 $23,366 $21,276 $24,200 $28,251
Female $25,585 $15,996 $17,231 $24,682 $19,812 $17,129 $19,951 $18,930
Diff erence (%) 17.1% 5.2% 23.6% 29.2% 17.9% 24.2% 21.3% 49.2%
Average after-tax income ($)
Total $34,233 $22,230 $22,719 $43,746 $26,229 $24,340 $30,107 $28,908
Male $39,135 $22,801 $25,011 $56,323 $28,483 $27,347 $34,832 $34,652
Female $29,222 $21,562 $20,547 $32,639 $24,122 $21,622 $25,595 $23,408
Diff erence (%) 33.9% 5.7% 21.7% 72.5% 18.1% 26.5% 36.1% 48.0%
Source: Statistics Canada, 2006 Census of Population
When looking at median income, males in CHA 6 make 24.2% more than females.
$0
$5,000
$10,000
$15,000
$20,000
$25,000
$30,000
$27,225 $14,624 $18,674 $27,022 $21,873 $21,262 $22,647 $22,832
CHA1 CHA2 CHA3 CHA4 CHA5 CHA6 Vancouver BC

A Health and Social Profi leA Health and Social Profi le Vancouver Coastal Health 31
COMMUNITY HEALTH AREA 1 CITY CENTRE
A Health and Social Profi leA Health and Social Profi le Vancouver Coastal Health 31
COMMUNITY HEALTH AREA 6 SOUTH VANCOUVERSOUTH VANCOUVER
TABLE 8.TABLE 8. Employment income and unemployment rates for Canadian-born, all immigrants, and recent immigrants. Community Health Areas and British Columbia, 2006
Employment Income ($), 2005 Unemployment Rate (%), 2006
Canadian-Born All ImmigrantsRecent Immigrants Canadian-Born All Immigrants
Recent Immigrants
CHA 1 $41,201 $33,967 $22,973 3.8% 5.7% 8.5%
CHA 2 $28,520 $24,044 $19,202 8.1% 8.0% 9.9%
CHA 3 $34,922 $24,800 $17,940 6.0% 5.8% 7.5%
CHA 4 $41,597 $34,962 $18,164 3.4% 5.6% 10.2%
CHA 5 $35,067 $25,080 $17,992 4.4% 6.1% 11.9%
CHA 6 $37,202 $24,558 $14,643 4.8% 5.1% 8.7%
BC $36,053 $28,009 $17,994 4.8% 5.5% 9.7%
Source: BC Stats (2011)
Immigrants and, in particular, recent immigrants experience a disadvantage in the labour force. Within CHA 6, recent immigrants earn$22,559 less than the average Canadian-born worker, while experiencing rates of unemployment that are 3.9 percentage points higher.

A Health and Social Profi leA Health and Social Profi le Vancouver Coastal Health 32
COMMUNITY HEALTH AREA 1 CITY CENTRE
A Health and Social Profi leA Health and Social Profi le Vancouver Coastal Health 32
COMMUNITY HEALTH AREA 6 SOUTH VANCOUVERSOUTH VANCOUVER
FIGURE 13.FIGURE 13. Income distribution (%), after-tax. Community Health Areas, Vancouver, and British Columbia, 2006
Source: Statistics Canada, 2006 Census of Population
Economic Families
4.9%
5.4%
5.3%
5.9%
14.0%
16.0%
16.8%
15.7%
11.7%
17.5%
27.2%
14.2%
54.5%
48.9%
52.2%
53.2%
38.0%
55.1%
50.2%
48.6%
28.1%
30.2%
26.1%
27.2%
44.9%
23.7%
17.2%
31.1%
3.8%
3.4%
4.9%
3.9%
0% 10% 20% 30% 40% 50% 60% 70% 80% 90% 100%
BC
Vancouver
CHA6
CHA5
CHA4
CHA3
CHA2
CHA1
Under $10,000 $10,000 to $29,999 $30,000 to $79,999 $80,000 and over
Individuals not in economic families
16.1%
20.4%
19.9%
17.9%
17.8%
22.9%
26.3%
19.5%
42.7%
42.1%
48.0%
48.1%
37.2%
48.5%
50.0%
35.4%
24.5%
23.6%
21.4%
23.0%
26.8%
20.9%
15.7%
27.0%
11.7%
13.9%
10.6%
10.9%
18.2%
7.5%
7.8%
18.0%
0% 10% 20% 30% 40% 50% 60% 70% 80% 90% 100%
BC
Vancouver
CHA6
CHA5
CHA4
CHA3
CHA2
CHA1
Under $10,000 $10,000 to $29,999 $30,000 to $79,999 $80,000 and over

A Health and Social Profi leA Health and Social Profi le Vancouver Coastal Health 33
COMMUNITY HEALTH AREA 1 CITY CENTRE
A Health and Social Profi leA Health and Social Profi le Vancouver Coastal Health 33
COMMUNITY HEALTH AREA 6 SOUTH VANCOUVERSOUTH VANCOUVER
FIGURE 14.FIGURE 14. Composition of family income of economic families. Community Health Area 6 and Vancouver, 2006
Source: Statistics Canada, 2006 Census of Population
These fi gures break down income source (employment, government transfer payments and other sources) as a percentage of the total income of economic families in CHA 6 compared to that of Vancouver.
Government transfer payments include the Old Age Security pension and Guaranteed Income Supplement, benefi ts from the Canada Pension Plan, benefi ts from Employment Insurance, and child benefi ts.
Other money income includes dividends, interests, other investment income, retirement pensions, superannuation and annuities, and income from abroad.
At 11.0%, the relative share of government transfer payments for families is third highest in CHA 6 (11.0%) and greater than in Vancouver (7.6%). The relative share of “other money income” is second highest in CHA 6 (13.3%), behind CHA 4 (23.9%).
Note: see page 29 for defi nition of economic families.

A Health and Social Profi leA Health and Social Profi le Vancouver Coastal Health 34
COMMUNITY HEALTH AREA 1 CITY CENTRE
A Health and Social Profi leA Health and Social Profi le Vancouver Coastal Health 34
COMMUNITY HEALTH AREA 6 SOUTH VANCOUVERSOUTH VANCOUVER
FIGURE 15. FIGURE 15. Composition of individual income of persons (aged 15+ years) not in economic families. Community Health Area 6 and Vancouver, 2006
Source: Statistics Canada, 2006 Census of Population
The relative share of government transfer payments for individuals is the highest within CHA 6 (16.3%), while the relative share of other money income is second highest in CHA 6 (20.4%).
In 2013, new regulations under the Employment Insurance system will be in place, aff ecting seasonal workers, most of whom are immigrants. This is of particular relevance to CHA 6 with its high immigrant population, as after six weeks of unemployment, “frequent claimants” will have to accept any job off ered to them at 70% of their “on season” salary or risk losing benefi ts.

A Health and Social Profi leA Health and Social Profi le Vancouver Coastal Health 35
COMMUNITY HEALTH AREA 1 CITY CENTRE
A Health and Social Profi leA Health and Social Profi le Vancouver Coastal Health 35
COMMUNITY HEALTH AREA 6 SOUTH VANCOUVERSOUTH VANCOUVER
FIGURE 16.FIGURE 16. Percentage of population receiving income assistance. Community Health Areas and British Columbia, 2010
Source: BC Stats (2011)
The BC Employment and Assistance program is meant to assist British Columbians to move from income assistance to sustainable employment. Applicants are expected to take advantage of all other sources of income and assets before qualifying, and to actively seek work and participate in employment programs while receiving assistance (BC Ministry of Social Development, 2010, May 28). Included are those on temporary assistance: expected to work, expected to work - medical condition, temporarily excused and persistent multiple barriers. Excluded are those on continual assistance who have access to other forms of assistance: persons with disabilities, children in the home of a relative, and Old Age Security (BC Stats, n.d.).

A Health and Social Profi leA Health and Social Profi le Vancouver Coastal Health 36
COMMUNITY HEALTH AREA 1 CITY CENTRE
A Health and Social Profi leA Health and Social Profi le Vancouver Coastal Health 36
COMMUNITY HEALTH AREA 6 SOUTH VANCOUVERSOUTH VANCOUVER
FIGURE 17.FIGURE 17. Incidence of low-income among individuals over age 15 after-tax. Community Health Areas, 2001 and 2006
Source: Statistics Canada, 2001 Census of Population and 2006 Census of Population
The most widely recognized approach to understanding poverty is the “Low Income Cut Off ” (LICO), calculated by Statistics Canada: “A LICO is an income threshold below which a family will likely devote a larger share of its income to the necessities of food, shelter and clothing than an average family would”. Statistics Canada calculates diff erent LICOs for families of various sizes living in rural and urban communities. For example, in 2006 the LICO, after tax, for a single person living in a city with a population over 500,000 was $17, 568. The LICO, after tax, for a family of four in a similar sized city was $33, 216 (Statistics Canada. 2012, December 20).
From 2001 to 2006, the incidence of low-income among individuals over the age of 15 decreased in all CHAs with the exception of CHA 4 (Westside), which showed a very small increase.
0.0%
10.0%
20.0%
30.0%
40.0%
50.0%
60.0%
70.0%
2001 35.4% 64.3% 54.4% 31.4% 44.3% 48.6%
2006 33.0% 56.1% 45.7% 32.2% 37.2% 40.1%
CHA1 CHA2 CHA3 CHA4 CHA5 CHA6

A Health and Social Profi leA Health and Social Profi le Vancouver Coastal Health 37
COMMUNITY HEALTH AREA 1 CITY CENTRE
A Health and Social Profi leA Health and Social Profi le Vancouver Coastal Health 37
COMMUNITY HEALTH AREA 6 SOUTH VANCOUVERSOUTH VANCOUVER
FIGURE 18. FIGURE 18. Children, aged less than 6 years, (%) living in low income conditions, after-tax. Community Health Areas, Vancouver, and British Columbia, 2006
Source: Statistics Canada, 2006 Census of Population
CHA 6 has the second highest percentage of children living in low income conditions (24.7%), which is higher than in Vancouver (20.1%) and BC (15.1%).
A Health and Social Profi leA Health and Social Profi le Vancouver Coastal Health 38
COMMUNITY HEALTH AREA 1 CITY CENTRE
A Health and Social Profi leA Health and Social Profi le Vancouver Coastal Health 38
COMMUNITY HEALTH AREA 6 SOUTH VANCOUVERSOUTH VANCOUVER
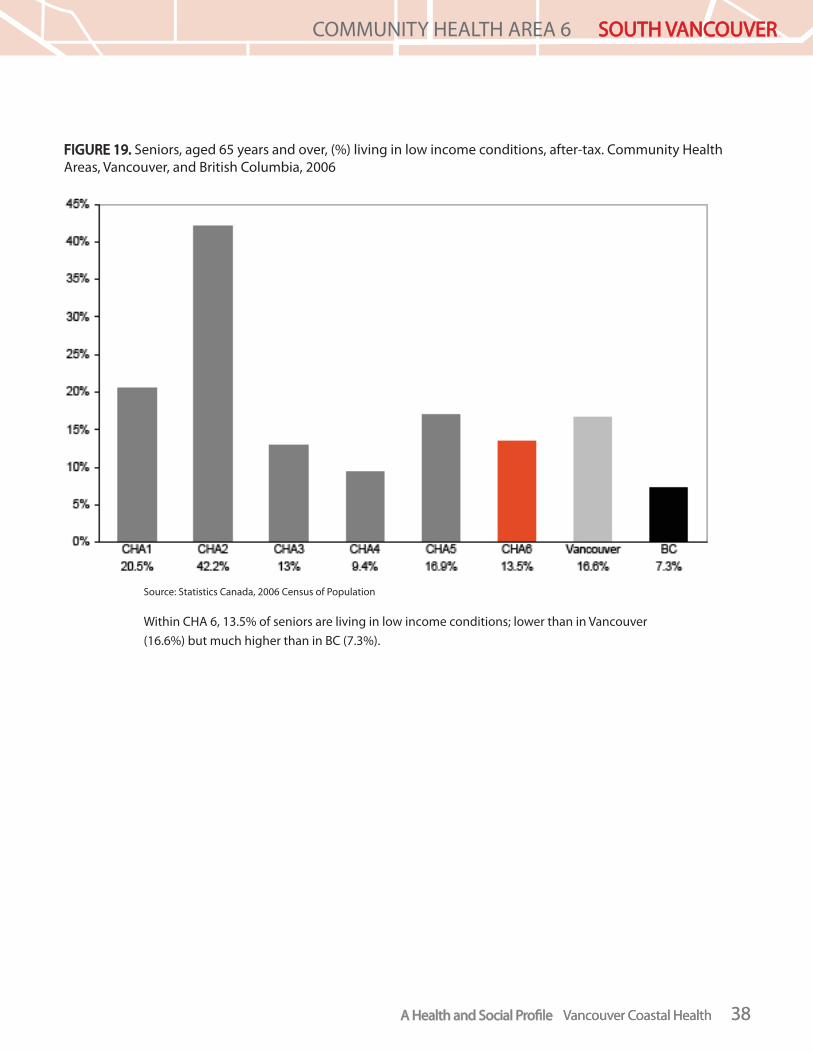
FIGURE 19.FIGURE 19. Seniors, aged 65 years and over, (%) living in low income conditions, after-tax. Community Health Areas, Vancouver, and British Columbia, 2006
Source: Statistics Canada, 2006 Census of Population
Within CHA 6, 13.5% of seniors are living in low income conditions; lower than in Vancouver (16.6%) but much higher than in BC (7.3%).

A Health and Social Profi leA Health and Social Profi le Vancouver Coastal Health 39
COMMUNITY HEALTH AREA 1 CITY CENTRE
A Health and Social Profi leA Health and Social Profi le Vancouver Coastal Health 39
COMMUNITY HEALTH AREA 6 SOUTH VANCOUVERSOUTH VANCOUVER
Housing and household characteristics
FIGURE 20. FIGURE 20. Average number of persons in households. Community Health Areas, Vancouver, and British Columbia, 2006
Source: Statistics Canada, 2006 Census of Population
CHA 6 is a family-oriented community with the highest percentage of households with 3 children (17.9%). CHA 6 and CHA 3 have the highest average number of people per household at 2.8; higher than both Vancouver (2.2) and BC (2.5).

A Health and Social Profi leA Health and Social Profi le Vancouver Coastal Health 40
COMMUNITY HEALTH AREA 1 CITY CENTRE
A Health and Social Profi leA Health and Social Profi le Vancouver Coastal Health 40
COMMUNITY HEALTH AREA 6 SOUTH VANCOUVERSOUTH VANCOUVER
TABLE 9.TABLE 9. Total lone parent families as a percent of all census families by sex of parent. Community Health Areas, Vancouver, and British Columbia, 2006
CHA 1 CHA 2 CHA 3 CHA 4 CHA 5 CHA 6 Vancouver BC
Total lone-parent families 11.3% 22.4% 18.5% 13.1% 17.6% 17.5% 16.2% 15.1%
Female parent 81.4% 81.0% 81.0% 83.0% 78.0% 83.4% 81.6% 79.8%
Male parent 18.6% 19.0% 19.0% 17.0% 22.1% 16.6% 18.4% 20.2%
Source: Statistics Canada, 2006 Census of Population
Lone parent families, over 80% of whom are led by women, are often at a disadvantage economically. With high housing costs and women’s incomes typically lower than men’s, children in lone parent families may live in poorer quality housing and have less access to enrichment programs than their counterparts in two-income households.
CHA 6 has a greater percentage of lone parent families (17.6%) as compared to Vancouver (16.2%) and BC (15.1%), and the highest percentage of female parent led lone-parent families (83.4%).

A Health and Social Profi leA Health and Social Profi le Vancouver Coastal Health 41
COMMUNITY HEALTH AREA 1 CITY CENTRE
A Health and Social Profi leA Health and Social Profi le Vancouver Coastal Health 41
COMMUNITY HEALTH AREA 6 SOUTH VANCOUVERSOUTH VANCOUVER
FIGURE 21. FIGURE 21. Living arrangements of seniors age 65 years and over. Community Health Areas, Vancouver, and British Columbia, 2006
Source: Statistics Canada, 2006 Census of Population
CHA 6 has the second lowest percentage of seniors that live alone (21.2%). CHA 6 has a high immigrant population and these numbers may refl ect that immigrant born seniors are more likely than their Canadian counterparts to live in extended families (Citizenship and Immigration Canada, 2005, April 1).
These fi gures cover seniors living in private homes and do not include those living in facilities or hospitals.

A Health and Social Profi leA Health and Social Profi le Vancouver Coastal Health 42
COMMUNITY HEALTH AREA 1 CITY CENTRE
A Health and Social Profi leA Health and Social Profi le Vancouver Coastal Health 42
COMMUNITY HEALTH AREA 6 SOUTH VANCOUVERSOUTH VANCOUVER
TABLE 10. TABLE 10. Percentage of population 15 years and older by hours of unpaid care/assistance to seniors. Community Health Areas, Vancouver, and British Columbia, 2006
Total population 15 years and older
Hours unpaid care/assist. to seniors
Less than 5 hrs unpaid care/assist. to seniors
5 – 9 hrs unpaid care/assist. to seniors
10+ hrs unpaid care/assist.to seniors
CHA 1 95,705 88.9% 7.2% 2.2% 1.6%
CHA 2 46,560 88.4% 6.4% 2.6% 2.6%
CHA 3 82,015 81.6% 10.3% 4.2% 3.9%
CHA 4 107,290 83.5% 10.7% 3.3% 2.5%
CHA 5 69,110 83.4% 10.0% 3.4% 3.1%
CHA 6 107,165 80.3% 11.0% 4.5% 4.2%
Vancouver 507,850 84.0% 9.6% 3.4% 3.0%
BC 3,394,910 82.5% 10.3% 3.9% 3.3%
Source: Statistics Canada, 2006 Census of Population
Table 10 shows the percentage of the adult population that is providing unpaid care to seniors. These caregivers are most often relatives or spouses.
It also refers to the number of hours persons spent providing unpaid care or assistance to seniors of one’s own household, to other senior family members outside the household, and to friends or neighbours in the week (Sunday to Saturday) prior to Census Day (May 16, 2006).
Unpaid care or assistance to seniors does not include volunteer work for a non-profi t organization, religious organization, charity or community group, or work without pay in the operation of a family farm, business or professional practice (2006 Census Dictionary).

A Health and Social Profi leA Health and Social Profi le Vancouver Coastal Health 43
COMMUNITY HEALTH AREA 1 CITY CENTRE
A Health and Social Profi leA Health and Social Profi le Vancouver Coastal Health 43
COMMUNITY HEALTH AREA 6 SOUTH VANCOUVERSOUTH VANCOUVER
FIGURE 22. FIGURE 22. Tenant and owner occupied dwellings. Community Health Areas, Vancouver, and British Columbia, 2006
Source: Statistics Canada, 2006 Census of Population
CHA 6 has a higher percentage of owner occupied dwellings (57.9%) than tenant occupied (42.1%) as opposed to Vancouver with a higher percentage of tenant occupied (52.1%) than owner occupied (47.9%) dwellings.

A Health and Social Profi leA Health and Social Profi le Vancouver Coastal Health 44
COMMUNITY HEALTH AREA 1 CITY CENTRE
A Health and Social Profi leA Health and Social Profi le Vancouver Coastal Health 44
COMMUNITY HEALTH AREA 6 SOUTH VANCOUVERSOUTH VANCOUVER
FIGURE 23. FIGURE 23. Total number of dwellings and percentage that are occupied. Community Health Areas, 2012
Source: City of Vancouver, Personal Communication, (2012, July 5)
A dwelling may be considered as “unoccupied” if there was someone living there who was not counted in the census (overseas visitors, etc.) or someone living there who the census didn’t fi nd, or a part-time resident. It also includes housing that is empty due to being renovated, those vacant and for sale, or those in-between tenants (City of Vancouver, Personal Communication, 2012, July 5).
A high number of unoccupied dwellings in an area may have an impact on people’s feelings of community vibrancy and safety. The above fi gure shows the total number of dwellings in each CHA and the percentage of dwellings that were occupied at the time of the 2011 Census.
Note: The neighbourhood of Cedar Cottage spans across CHAs 3 and 5. In this fi gure, data for Cedar Cottage is included in CHA 5 only.

A Health and Social Profi leA Health and Social Profi le Vancouver Coastal Health 45
COMMUNITY HEALTH AREA 1 CITY CENTRE
A Health and Social Profi leA Health and Social Profi le Vancouver Coastal Health 45
COMMUNITY HEALTH AREA 6 SOUTH VANCOUVERSOUTH VANCOUVER
FIGURE 24. FIGURE 24. Percentage of population who have moved recently (within 2005-2006 or 2001-2006). Community Health Areas, Vancouver, and British Columbia, 2006
Source: Statistics Canada, 2006 Census of Population
Mobility refers to the number of people who have changed addresses within the last year (2005-2006) or last 5 years (2001-2006) before the Census Day (Statistics Canada, 2010, July 6).
Comparing across CHAs, CHA 6 is home to the second least mobile population behind only CHA 3. 15.5% moved in 2005-2006 and 45.0% moved between 2001-2006, as compared to 19.7% and 50.7%, respectively, within Vancouver.
A more stable community with lower mobility may imply a closer social support network with higher social capital and consequent positive health eff ects.

A Health and Social Profi leA Health and Social Profi le Vancouver Coastal Health 46
COMMUNITY HEALTH AREA 1 CITY CENTRE
A Health and Social Profi leA Health and Social Profi le Vancouver Coastal Health 46
COMMUNITY HEALTH AREA 6 SOUTH VANCOUVERSOUTH VANCOUVER
FIGURE 25.FIGURE 25. Percentage of households paying 30% or more of their income on housing costs. Community Health Areas, Vancouver, and British Columbia, 2006
Source: Statistics Canada, 2006 Census of Population
A household paying more than 30% of annual income on housing is considered to be living in unaff ordable conditions. This cost burden makes it diffi cult to pay for other necessities such as food, clothing, education, transportation, and health care.
Thirty-four percent of CHA 6 households are paying 30% or more of their income on housing costs, the lowest amongst the CHAs. This is still higher as compared to BC (29.0%), which is indicative of Vancouver’s increasingly unaff ordable housing costs.

A Health and Social Profi leA Health and Social Profi le Vancouver Coastal Health 47
COMMUNITY HEALTH AREA 1 CITY CENTRE
A Health and Social Profi leA Health and Social Profi le Vancouver Coastal Health 47
COMMUNITY HEALTH AREA 6 SOUTH VANCOUVERSOUTH VANCOUVER
FIGURE 26.FIGURE 26. Average gross rent and owner monthly payment ($). Community Health Areas, Vancouver, and British Columbia, 2005
Source: Statistics Canada, 2006 Census of Population
CHA 6 has an average gross rent of $862, the third highest amongst the CHAs behind only CHA 4 and CHA 1. The average gross rent and owner monthly payments are lower as compared to Vancouver but higher as compared to BC.

A Health and Social Profi leA Health and Social Profi le Vancouver Coastal Health 48
COMMUNITY HEALTH AREA 1 CITY CENTRE
A Health and Social Profi leA Health and Social Profi le Vancouver Coastal Health 48
COMMUNITY HEALTH AREA 6 SOUTH VANCOUVERSOUTH VANCOUVER
FIGURE 27.FIGURE 27. Percentage of properties with secondary suites. Community Health Areas 3, 4, and 6, 2009
Source: City of Vancouver , 2009
Note: CHA 1, CHA 2, and CHA 5 have been excluded due to their non-residential zones, as distinguishing single-family dwellings with suites from other multi-family properties is impractical.
CHA 3 has the highest percentage of properties with secondary suites within Vancouver at 41%. This includes 57% of Kensington-Cedar Cottage, 44% of Renfrew Collingwood, and 38% of Hastings Sunrise properties, amongst the highest of all Vancouver neighbourhoods.
Secondary suites, involving the use of basements or the ground fl oors of houses to provide additional accommodation, are thought to provide aff ordable housing to renters and to facilitate home ownership by providing additional income to qualify and pay for mortgages.
A Health and Social Profi leA Health and Social Profi le Vancouver Coastal Health 49
COMMUNITY HEALTH AREA 1 CITY CENTRE
A Health and Social Profi leA Health and Social Profi le Vancouver Coastal Health 49
COMMUNITY HEALTH AREA 6 SOUTH VANCOUVERSOUTH VANCOUVER
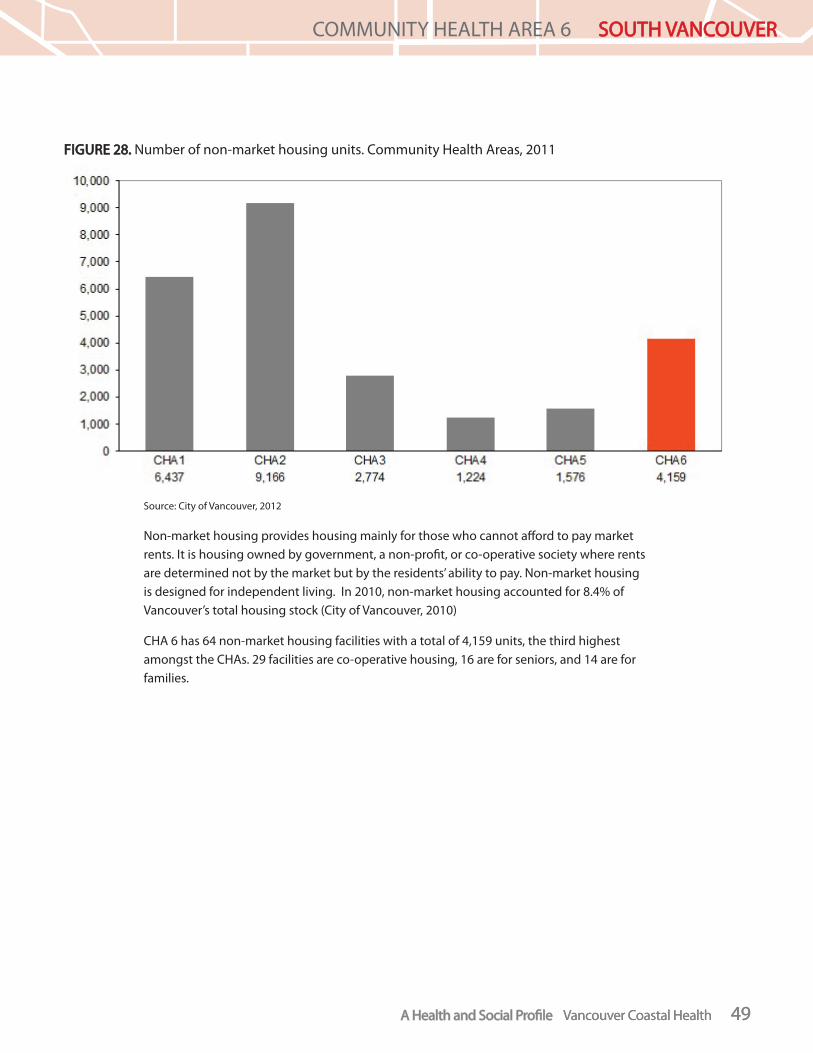
FIGURE 28.FIGURE 28. Number of non-market housing units. Community Health Areas, 2011
Source: City of Vancouver, 2012
Non-market housing provides housing mainly for those who cannot aff ord to pay market rents. It is housing owned by government, a non-profi t, or co-operative society where rents are determined not by the market but by the residents’ ability to pay. Non-market housing is designed for independent living. In 2010, non-market housing accounted for 8.4% of Vancouver’s total housing stock (City of Vancouver, 2010)
CHA 6 has 64 non-market housing facilities with a total of 4,159 units, the third highest amongst the CHAs. 29 facilities are co-operative housing, 16 are for seniors, and 14 are for families.

A Health and Social Profi leA Health and Social Profi le Vancouver Coastal Health 50
COMMUNITY HEALTH AREA 1 CITY CENTRE
A Health and Social Profi leA Health and Social Profi le Vancouver Coastal Health 50
COMMUNITY HEALTH AREA 6 SOUTH VANCOUVERSOUTH VANCOUVER
TABLE 11.TABLE 11. Number of permanent and temporary shelter spaces. Community Health Areas, 2011/2012
Permanent Shelter Spaces
Temporary Shelter Spaces
Sheltered Homeless Population
Street Homeless Population
CHA 1 261 80 533 127
CHA 2 298 216 461 134
CHA 3 0 0 no data available no data available
CHA 4 18 0 19 no data available
CHA 5 103 140 128 6
CHA 6 0 0 no data available no data available
Source: City of Vancouver, Personal Communication, (2012, June 26).
All homeless counts underestimate the number of homeless people at one time and do not take into account the mobility of this population. However, in CHA 6 there are no shelter spaces to accommodate this population.
Note: For permanent shelters, three facilities that serve vulnerable populations (e.g. youth safe houses) do not publish their locations and/or number of spaces due to safety concerns and have been excluded from these Profi les.
For temporary shelter spaces, these include all HEAT or Winter Response shelters that were open at any point during 2011/2012 (some closed or are scheduled to close). This does not include Extreme Weather Alert shelter spaces.

A Health and Social Profi le Vancouver Coastal Health 51A Health and Social Profi le Vancouver Coastal Health 51
COMMUNITY HEALTH AREA 6 SOUTH VANCOUVERSOUTH VANCOUVER
A Health and Social Profi le Vancouver Coastal Health 51A Health and Social Profi leA Health and Social Profi le Vancouver Coastal Health 51
Health statusThis section details the type of data used to profi le the health of communities and illustrates the interaction between the determinants of health, illness and injury.
Understanding the health status of a population provides an opportunity to evaluate current health programs, and to be proactive in planning future health initiatives and tailor interventions to meet community needs.
A Health and Social Profi leA Health and Social Profi le Vancouver Coastal Health 52
COMMUNITY HEALTH AREA 1 CITY CENTRE
A Health and Social Profi leA Health and Social Profi le Vancouver Coastal Health 52
COMMUNITY HEALTH AREA 6 SOUTH VANCOUVERSOUTH VANCOUVER
Life expectancy
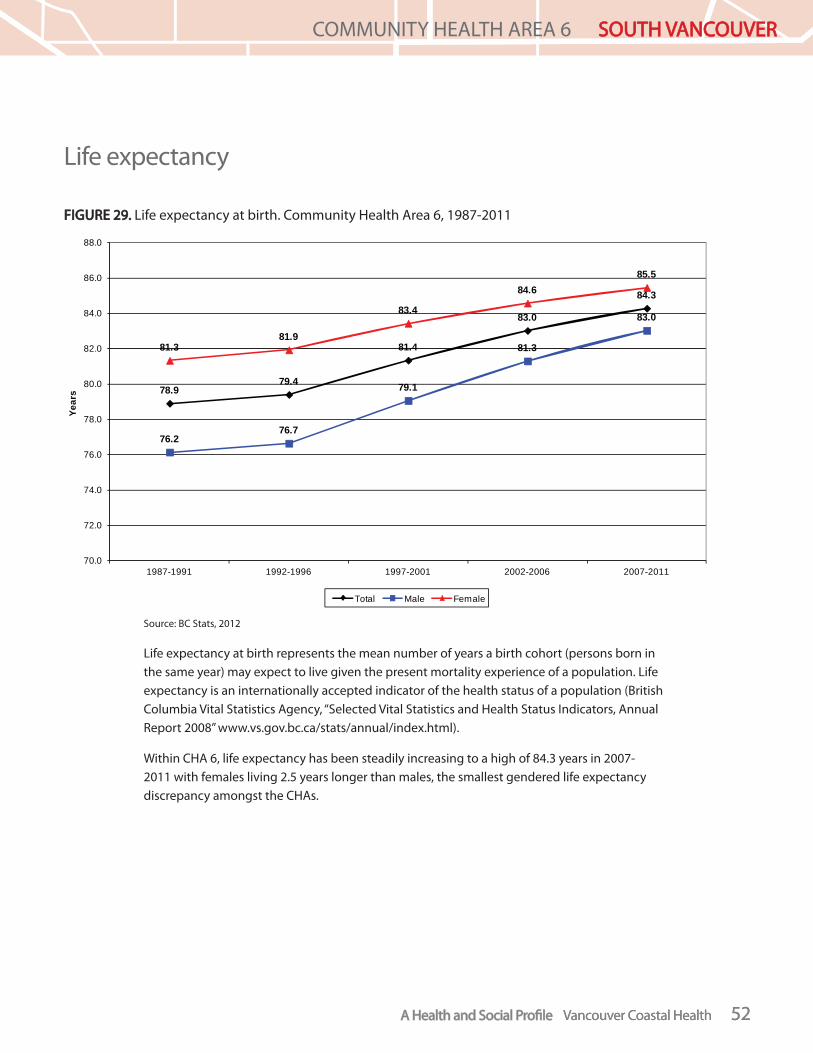
FIGURE 29.FIGURE 29. Life expectancy at birth. Community Health Area 6, 1987-2011
Source: BC Stats, 2012
Life expectancy at birth represents the mean number of years a birth cohort (persons born in the same year) may expect to live given the present mortality experience of a population. Life expectancy is an internationally accepted indicator of the health status of a population (British Columbia Vital Statistics Agency, “Selected Vital Statistics and Health Status Indicators, Annual Report 2008” www.vs.gov.bc.ca/stats/annual/index.html).
Within CHA 6, life expectancy has been steadily increasing to a high of 84.3 years in 2007-2011 with females living 2.5 years longer than males, the smallest gendered life expectancy discrepancy amongst the CHAs.
78.979.4
81.4
83.0
84.3
76.276.7
79.1
81.3
83.0
81.381.9
83.4
84.685.5
70.0
72.0
74.0
76.0
78.0
80.0
82.0
84.0
86.0
88.0
1987-1991 1992-1996 1997-2001 2002-2006 2007-2011
Year
s
Total Male Female

A Health and Social Profi leA Health and Social Profi le Vancouver Coastal Health 53
COMMUNITY HEALTH AREA 1 CITY CENTRE
A Health and Social Profi leA Health and Social Profi le Vancouver Coastal Health 53
COMMUNITY HEALTH AREA 6 SOUTH VANCOUVERSOUTH VANCOUVER
FIGURE 30.FIGURE 30. Life expectancy at birth. Community Health Areas, Vancouver, and British Columbia, 2007-2011
Source: BC Stats, 2012
Figure 30 shows the average life expectancy for the total population (males and females together) within each CHA. Life expectancy in CHAs 3, 4, 5, and 6 is higher than the provincial average. While life expectancy in CHA 2 is the lowest among all CHAs, it is steadily increasing.

A Health and Social Profi leA Health and Social Profi le Vancouver Coastal Health 54
COMMUNITY HEALTH AREA 1 CITY CENTRE
A Health and Social Profi leA Health and Social Profi le Vancouver Coastal Health 54
COMMUNITY HEALTH AREA 6 SOUTH VANCOUVERSOUTH VANCOUVER
Births
FIGURE 31. FIGURE 31. Crude live birth rate per 1,000 population. Community Health Areas, Vancouver, and British Columbia, 2001-2005 vs. 2006-2010
Source: BC Vital Statistics Agency (VISTA), June 16, 2011
The crude live birth rate is the number of births divided by the mid-year population and converted to a rate per 1,000 population. Crude rates allow for comparisons to be made between diff erent time periods or geographic areas where the populations are not identical (BC Vital Statistics Agency, 2009).
Between 2001-2005 and 2006-2010, the birth rate within CHA 6 has remained relatively stable at 9.8 and 9.7 per 1,000 live births, respectively.
0
2
4
6
8
10
12
14
per
1,0
00
po
pu
lati
on
2001-2005 7.9 8.3 11.3 8.6 11.8 9.8 9.6 9.8
2006-2010 8.4 7.9 10.6 8.6 11.8 9.7 9.5 9.9
CHA 1 CHA 2 CHA 3 CHA 4 CHA 5 CHA 6 Vancouver BC

A Health and Social Profi leA Health and Social Profi le Vancouver Coastal Health 55
COMMUNITY HEALTH AREA 1 CITY CENTRE
A Health and Social Profi leA Health and Social Profi le Vancouver Coastal Health 55
COMMUNITY HEALTH AREA 6 SOUTH VANCOUVERSOUTH VANCOUVER
FIGURE 32.FIGURE 32. Infant mortality rate per 1,000 live births. Community Health Areas, Vancouver, and British Columbia, 2001-2005 vs. 2006-2010
Source: BC Vital Statistics Agency (VISTA), April 14, 2011
The infant mortality rate is calculated as the number of deaths of children less than one year of age per 1,000 live births in the same year. Infant mortality is an internationally accepted indicators of maternal and child health. “[Infant mortality rates] refl ect not only on the state of health care within a jurisdiction, but also on the social environments, the policy supports, and the priority that a society places on childbearing. Our societal goal is to improve infant health and reduce infant mortality to the lowest level possible” (BC Provincial Health Offi cer, 2003).
Figure 32 shows that infant mortality rates increased in some CHAs between 2001-2005 and 2006-2010, notably CHAs 1, 2, 5 and 6. However, these rates need to be interpreted with caution as the population size is small giving rise to tremendous variability. The infant mortality rate in Vancouver increased slightly between 2001-2005 and 2006-2010. The rate in Vancouver is slightly higher than the provincial average.
In 2003 the BC Provincial Health Offi cer published a review of infant mortality rates which sought to determine whether increases in the number and rate of deaths in infants are long term trends or random fl uctuations. It concluded that there is an overall trend in BC toward declining rate of infant mortality, though random fl uctuations may occur in any given year.
Major causes of infant mortality include perinatal conditions (where the fetus or newborn is aff ected by maternal factors and complications of pregnancy, labour and delivery), respiratory and cardiovascular disorders specifi c to the perinatal period, congenital anomalies (such as defects of the heart and circulatory system), Sudden Infant Death Syndrome (SIDS) and pneumonia/infl uenza.
Infant mortality can be reduced by ensuring access to maternal and newborn care as well as by attending to the environments in which infants live (e.g. via immunization, injury prevention, and measures to reduce the risk of SIDS) (British Columbia Provincial Health Offi cer, 2003).
0
1
2
3
4
5
6
7
8
9
per 1
,000
live
birt
hs
2001-2005 2 3.5 5.2 4.8 3 2.9 3.6 4.2
2006-2010 2.7 3.7 3.7 3.3 8.4 5.2 4.6 3.8
CHA 1 CHA 2 CHA 3 CHA 4 CHA 5 CHA 6 Vancouver BC

A Health and Social Profi leA Health and Social Profi le Vancouver Coastal Health 56
COMMUNITY HEALTH AREA 1 CITY CENTRE
A Health and Social Profi leA Health and Social Profi le Vancouver Coastal Health 56
COMMUNITY HEALTH AREA 6 SOUTH VANCOUVERSOUTH VANCOUVER
FIGURE 33.FIGURE 33. Live births by age of mother (%). Community Health Areas, Vancouver, and British Columbia, 2010
Source: BC Statistical Agency (VISTA), June 16, 2011
Amongst the CHAs, CHA 6 has the lowest percentage of women who were 35 years or older when they gave birth in 2010 (32.2%); however, this is still higher than in BC (23.2%).
3.0%
0.8%
0.6%
0.7%
0.1%
1.3%
2.5%
0.1%
73.8%
62.8%
67.2%
61.5%
54.7%
65.2%
65.1%
64.0%
23.2%
36.4%
32.2%
37.8%
45.2%
33.5%
32.4%
35.9%
0.0% 10.0% 20.0% 30.0% 40.0% 50.0% 60.0% 70.0% 80.0% 90.0% 100.0%
BC Vancouver
CHA6
CHA5
CHA4
CHA3
CHA2
CHA1
<20 years 20-34 years 35+ years

A Health and Social Profi leA Health and Social Profi le Vancouver Coastal Health 57
COMMUNITY HEALTH AREA 1 CITY CENTRE
A Health and Social Profi leA Health and Social Profi le Vancouver Coastal Health 57
COMMUNITY HEALTH AREA 6 SOUTH VANCOUVERSOUTH VANCOUVER
FIGURE 34.FIGURE 34. Teenage mother (females aged less than 20 years) birth rates per 1,000 live births. Community Health Areas, Vancouver, and British Columbia, 2001-2005 vs. 2006-2010
Source: BC Vital Statistics Agency (VISTA), June 16, 2011
In CHA 6, from 2001-2005 and 2006-2010, teenage mother birth rates have remained relatively stable at 15.2 and 14.6 per 1,000 live births, respectively. In 2006-2010, this was the third highest rate amongst the CHAs, behind only CHA 2 and CHA 3, but much lower as compared to BC (32.7 per 1,000 live births).
0
5
10
15
20
25
30
35
40
45
per
1,0
00 li
ve b
irth
s
2001-2005 7.3 40.1 15.1 3.5 20.4 15.2 15 37.7
2006-2010 3.1 26.6 15.6 3.5 8.8 14.6 10.8 32.7
CHA 1 CHA 2 CHA 3 CHA 4 CHA 5 CHA 6 Vancouver BC

A Health and Social Profi leA Health and Social Profi le Vancouver Coastal Health 58
COMMUNITY HEALTH AREA 1 CITY CENTRE
A Health and Social Profi leA Health and Social Profi le Vancouver Coastal Health 58
COMMUNITY HEALTH AREA 6 SOUTH VANCOUVERSOUTH VANCOUVER
FIGURE 35.FIGURE 35. Low birth weight (less than 2,500 grams) rate per 1,000 live births. Community Health Areas, Vancouver, and British Columbia, 2001-2005 vs. 2006-2010
Source: BC Vital Statistics Agency (VISTA), June 16, 2011
Figure 35 shows the number of low birth weight births for every 1,000 births in each CHA. The rate of low birth weight is increasing in every CHA except in CHA 2. In CHA 2, between 2001-2005 and 2006-2010 the rate of low birth weight babies decreased from 71.7 to 59.3 of every 1,000 babies born.
There are many factors that contribute to low birth weight, and these factors tend to overlap. Risk factors for low birth weight include multiple births, pre-term births (less than 259 days gestation), maternal infections, maternal use of alcohol, tobacco, cocaine or narcotics, maternal experience of violence/abuse and fertility/IVF treatments. Eff orts to address low birth weight need to be multidisciplinary and include substance use prevention and prenatal medical care.
Birth weight is an indicator of the general health of newborns, and a key determinant of infant survival, health and development. Low birth weight infants are at a greater risk of dying during the fi rst year of life, and of developing chronic health problems (Human Resources and Skills Development Canada, 2012).
0
10
20
30
40
50
60
70
80
per
1,0
00 li
ve b
irth
s
2001-2005 48.4 71.9 59.8 47.8 55.4 60 56.4 53.5
2006-2010 55.1 60.1 64.2 51.9 66 72.5 62.2 55.5
CHA 1 CHA 2 CHA 3 CHA 4 CHA 5 CHA 6 Vancouver BC
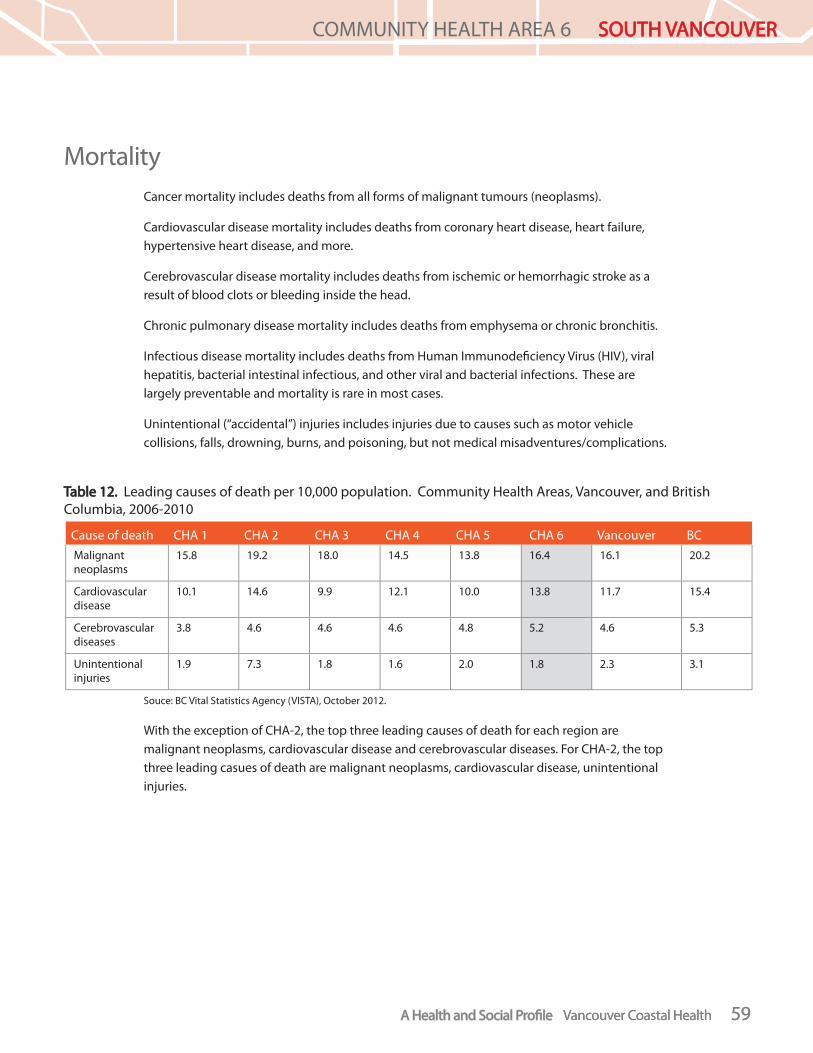
A Health and Social Profi leA Health and Social Profi le Vancouver Coastal Health 59
COMMUNITY HEALTH AREA 1 CITY CENTRE
A Health and Social Profi leA Health and Social Profi le Vancouver Coastal Health 59
COMMUNITY HEALTH AREA 6 SOUTH VANCOUVERSOUTH VANCOUVER
MortalityCancer mortality includes deaths from all forms of malignant tumours (neoplasms).
Cardiovascular disease mortality includes deaths from coronary heart disease, heart failure, hypertensive heart disease, and more.
Cerebrovascular disease mortality includes deaths from ischemic or hemorrhagic stroke as a result of blood clots or bleeding inside the head.
Chronic pulmonary disease mortality includes deaths from emphysema or chronic bronchitis.
Infectious disease mortality includes deaths from Human Immunodefi ciency Virus (HIV), viral hepatitis, bacterial intestinal infectious, and other viral and bacterial infections. These are largely preventable and mortality is rare in most cases.
Unintentional (“accidental”) injuries includes injuries due to causes such as motor vehicle collisions, falls, drowning, burns, and poisoning, but not medical misadventures/complications.
Table 12.Table 12. Leading causes of death per 10,000 population. Community Health Areas, Vancouver, and British Columbia, 2006-2010
Souce: BC Vital Statistics Agency (VISTA), October 2012.
With the exception of CHA-2, the top three leading causes of death for each region are malignant neoplasms, cardiovascular disease and cerebrovascular diseases. For CHA-2, the top three leading casues of death are malignant neoplasms, cardiovascular disease, unintentional injuries.
Cause of death CHA 1 CHA 2 CHA 3 CHA 4 CHA 5 CHA 6 Vancouver BCMalignant neoplasms
15.8 19.2 18.0 14.5 13.8 16.4 16.1 20.2
Cardiovascular disease
10.1 14.6 9.9 12.1 10.0 13.8 11.7 15.4
Cerebrovascular diseases
3.8 4.6 4.6 4.6 4.8 5.2 4.6 5.3
Unintentional injuries
1.9 7.3 1.8 1.6 2.0 1.8 2.3 3.1
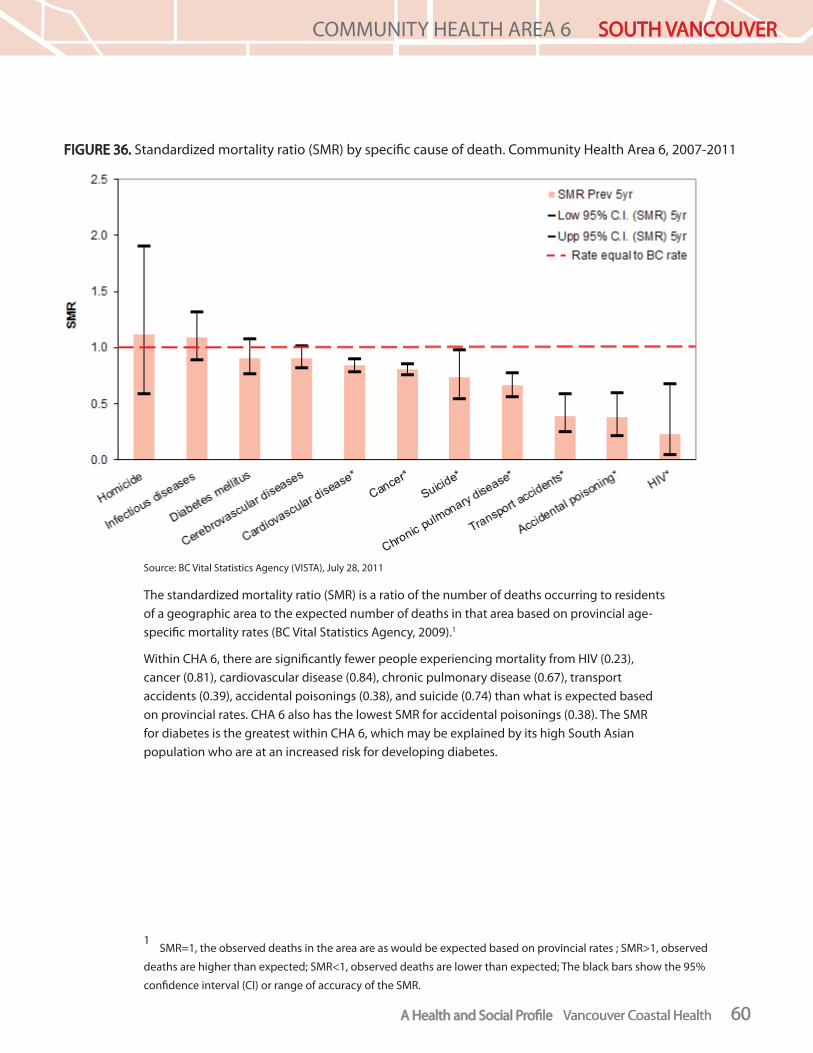
A Health and Social Profi leA Health and Social Profi le Vancouver Coastal Health 60
COMMUNITY HEALTH AREA 1 CITY CENTRE
A Health and Social Profi leA Health and Social Profi le Vancouver Coastal Health 60
COMMUNITY HEALTH AREA 6 SOUTH VANCOUVERSOUTH VANCOUVER
FIGURE 36.FIGURE 36. Standardized mortality ratio (SMR) by specifi c cause of death. Community Health Area 6, 2007-2011
Source: BC Vital Statistics Agency (VISTA), July 28, 2011
The standardized mortality ratio (SMR) is a ratio of the number of deaths occurring to residents of a geographic area to the expected number of deaths in that area based on provincial age-specifi c mortality rates (BC Vital Statistics Agency, 2009).1
Within CHA 6, there are signifi cantly fewer people experiencing mortality from HIV (0.23), cancer (0.81), cardiovascular disease (0.84), chronic pulmonary disease (0.67), transport accidents (0.39), accidental poisonings (0.38), and suicide (0.74) than what is expected based on provincial rates. CHA 6 also has the lowest SMR for accidental poisonings (0.38). The SMR for diabetes is the greatest within CHA 6, which may be explained by its high South Asian population who are at an increased risk for developing diabetes.
1SMR=1, the observed deaths in the area are as would be expected based on provincial rates ; SMR>1, observed
deaths are higher than expected; SMR<1, observed deaths are lower than expected; The black bars show the 95%
confi dence interval (CI) or range of accuracy of the SMR.
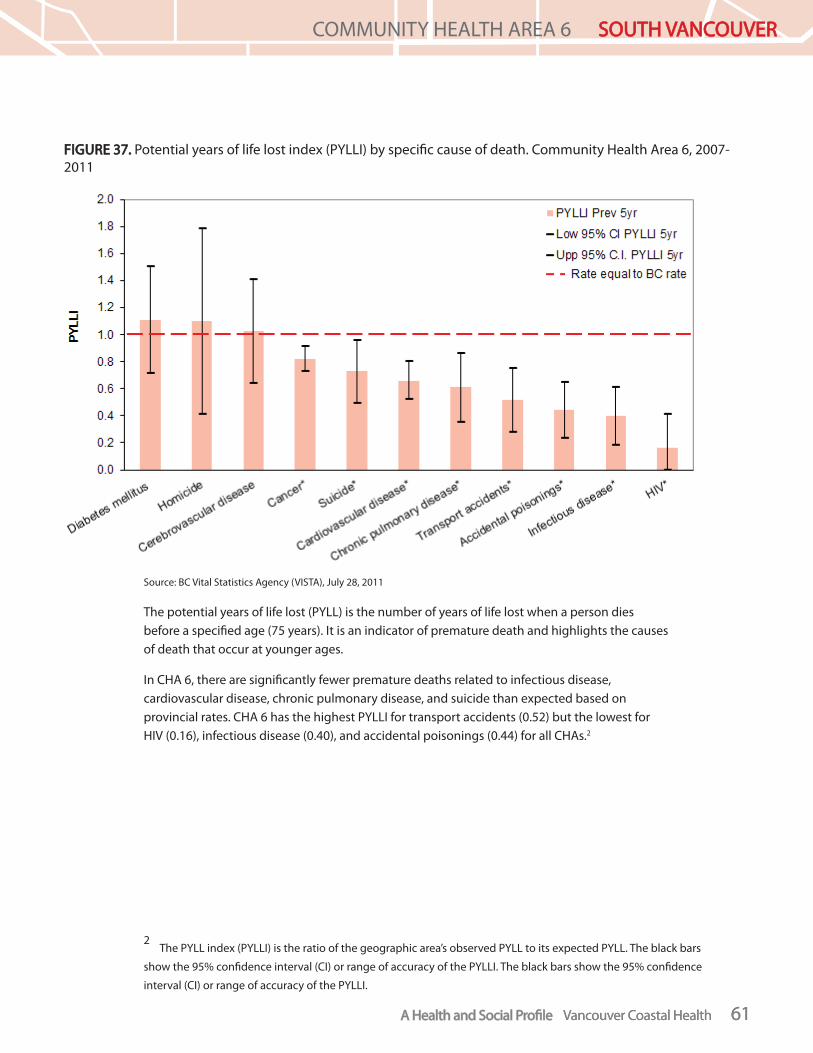
A Health and Social Profi leA Health and Social Profi le Vancouver Coastal Health 61
COMMUNITY HEALTH AREA 1 CITY CENTRE
A Health and Social Profi leA Health and Social Profi le Vancouver Coastal Health 61
COMMUNITY HEALTH AREA 6 SOUTH VANCOUVERSOUTH VANCOUVER
FIGURE 37FIGURE 37. . Potential years of life lost index (PYLLI) by specifi c cause of death. Community Health Area 6, 2007-2011
Source: BC Vital Statistics Agency (VISTA), July 28, 2011
The potential years of life lost (PYLL) is the number of years of life lost when a person dies before a specifi ed age (75 years). It is an indicator of premature death and highlights the causes of death that occur at younger ages.
In CHA 6, there are signifi cantly fewer premature deaths related to infectious disease, cardiovascular disease, chronic pulmonary disease, and suicide than expected based on provincial rates. CHA 6 has the highest PYLLI for transport accidents (0.52) but the lowest for HIV (0.16), infectious disease (0.40), and accidental poisonings (0.44) for all CHAs.2
2The PYLL index (PYLLI) is the ratio of the geographic area’s observed PYLL to its expected PYLL. The black bars
show the 95% confi dence interval (CI) or range of accuracy of the PYLLI. The black bars show the 95% confi dence
interval (CI) or range of accuracy of the PYLLI.

A Health and Social Profi leA Health and Social Profi le Vancouver Coastal Health 62
COMMUNITY HEALTH AREA 1 CITY CENTRE
A Health and Social Profi leA Health and Social Profi le Vancouver Coastal Health 62
COMMUNITY HEALTH AREA 6 SOUTH VANCOUVERSOUTH VANCOUVER
TABLE 13.TABLE 13. Age specifi c suicide rates per 10,000 population. Community Health Areas, Vancouver, and British Columbia, 2006-2010 (compared to 2001-2005)
CHA 1 CHA 2 CHA 3 CHA 4 CHA 5 CHA 6 Vancouver BC
< 24 years 2.3 (2.5) 1.7 (2.6) 2.3 (0.6) 0.7 (0.8) 1.6 (1.1) 1.4 (1.0) 1.5 (1.1) 1.6 (1.9)
25-44 years 1.4 (1.2) 2.7 (3.5) 0.8 (1.4) 0.6 (0.8) 0.7 (1.5) 0.8 (0.7) 1.1 (1.4) 1.2 (1.5)
45-64 years 3.3 (3.1) 3.5 (4.3) 0.7 (1.7) 1.6 (1.3) 1.4 (1.7) 1.0 (0.8) 1.8 (1.9) 1.4 (1.6)
65-84 years 1.4 (1.8) 2.5 (2.2) 1.4 (0.9) 1.0 (1.2) 0.5 (1.5) 1.0 (1.2) 1.2 (1.4) 1.2 (1.2)
85+ years 2.4 (5.3) 0.0 (0.0) 0.0 (7.9) 2.0 (1.5) 1.5 (1.8) 1.3 (0.0) 1.4 (2.4) 1.3 (1.8)
Source: BC Vital Statistics Agency (VISTA), July 28, 2011
Table 13 shows the suicide rates for fi ve age groupings for the periods 2006-2010 compared with 2001-2005. Overall in Vancouver the highest rate is within the age group of 45-64 years.
While suicide deaths include people from all socioeconomic, age, gender, culture and ethnic groups, some groups experience higher rates. Suicide rates tend to be higher among youth, Aboriginal people and people who identify as lesbian, gay, bisexual, transgender and two-spirit. It is estimated that in more than 70 percent of suicides, the person was suff ering from one or more unmanaged mental health issues (http://www.crisiscentre.bc.ca/about-us/).
In CHA 6 the highest suicide rate in 2006-2010 is within the age group of under 24 years. CHA 6 has similar rates of suicide to Vancouver and BC. Within CHA 6, there has been an increase in the rate of suicide of persons aged 85 years and older from zero in 2002-2006 to 1.3 per 10,000 population in 2006-2010.
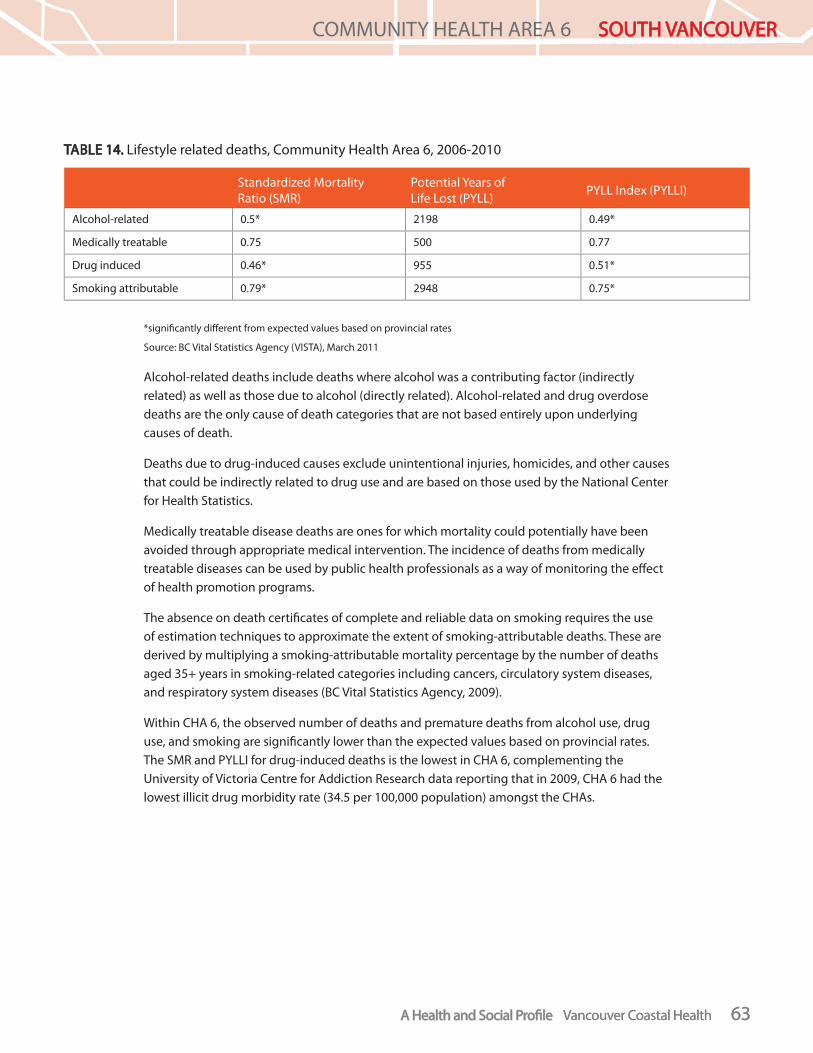
A Health and Social Profi leA Health and Social Profi le Vancouver Coastal Health 63
COMMUNITY HEALTH AREA 1 CITY CENTRE
A Health and Social Profi leA Health and Social Profi le Vancouver Coastal Health 63
COMMUNITY HEALTH AREA 6 SOUTH VANCOUVERSOUTH VANCOUVER
TABLE 14.TABLE 14. Lifestyle related deaths, Community Health Area 6, 2006-2010
Standardized Mortality Ratio (SMR)
Potential Years of Life Lost (PYLL) PYLL Index (PYLLI)
Alcohol-related 0.5* 2198 0.49*
Medically treatable 0.75 500 0.77
Drug induced 0.46* 955 0.51*
Smoking attributable 0.79* 2948 0.75*
*signifi cantly diff erent from expected values based on provincial rates
Source: BC Vital Statistics Agency (VISTA), March 2011
Alcohol-related deaths include deaths where alcohol was a contributing factor (indirectly related) as well as those due to alcohol (directly related). Alcohol-related and drug overdose deaths are the only cause of death categories that are not based entirely upon underlying causes of death.
Deaths due to drug-induced causes exclude unintentional injuries, homicides, and other causes that could be indirectly related to drug use and are based on those used by the National Center for Health Statistics.
Medically treatable disease deaths are ones for which mortality could potentially have been avoided through appropriate medical intervention. The incidence of deaths from medically treatable diseases can be used by public health professionals as a way of monitoring the eff ect of health promotion programs.
The absence on death certificates of complete and reliable data on smoking requires the use of estimation techniques to approximate the extent of smoking-attributable deaths. These are derived by multiplying a smoking-attributable mortality percentage by the number of deaths aged 35+ years in smoking-related categories including cancers, circulatory system diseases, and respiratory system diseases (BC Vital Statistics Agency, 2009).
Within CHA 6, the observed number of deaths and premature deaths from alcohol use, drug use, and smoking are signifi cantly lower than the expected values based on provincial rates. The SMR and PYLLI for drug-induced deaths is the lowest in CHA 6, complementing the University of Victoria Centre for Addiction Research data reporting that in 2009, CHA 6 had the lowest illicit drug morbidity rate (34.5 per 100,000 population) amongst the CHAs.

A Health and Social Profi leA Health and Social Profi le Vancouver Coastal Health 64
COMMUNITY HEALTH AREA 1 CITY CENTRE
A Health and Social Profi leA Health and Social Profi le Vancouver Coastal Health 64
COMMUNITY HEALTH AREA 6 SOUTH VANCOUVERSOUTH VANCOUVER
Chronic and communicable disease
Chronic diseases are typifi ed by long duration and slow progression. They are by far the leading cause of death across Canada.
Human Immunodefi ciency Virus (HIV) is a virus that attacks the immune system, resulting in a chronic progressive illness that leaves people vulnerable to opportunistic infection. HIV is transmitted from person to person through unprotected sexual intercourse, shared needles or equipment for injection drug use, or perinatally (from mother to her baby) (Public Health Agency of Canada, 2012).
Hepatitis C is a virus that results in chronic liver disease and is transmitted in the same ways as HIV, i.e. sharing of sharp instruments or unsterilized personal hygiene equipment with an infected person, sharing of drug-use equipment, unprotected sexual intercourse, or perinatally.

A Health and Social Profi leA Health and Social Profi le Vancouver Coastal Health 65
COMMUNITY HEALTH AREA 1 CITY CENTRE
A Health and Social Profi leA Health and Social Profi le Vancouver Coastal Health 65
COMMUNITY HEALTH AREA 6 SOUTH VANCOUVERSOUTH VANCOUVER
TABLE 15.TABLE 15. Chronic and communicable disease new diagnosis rates per 100,000 people. Community Health Area 6, Vancouver, and British Columbia
CHA 6 Vancouver BCChronic disease new diagnosis rate per 100,000 population, 2010/11 (compared to 2008/09)
Arthritis (osteoarthritis and rheumatoid arthritis) 489.7 (476.4) 487.2 (447.6) 690.5 (642.8)
Cardiovascular disease 450.0 (417.0) 358.5 (364.8) 421.7 (469.6)
Chronic obstructive pulmonary disease (COPD)(aged 45+ years)
337.0 (478.8) 298.0 (476.1) 424.7(643.5)
Diabetes 877.3 (739.9) 641.0 (561.3) 644.6 (650.4)
Communicable disease new diagnosis rate per 100,000 population, 2009/11 (compared to 2006/08)
HIV (males) 10.7 (9.9) 42.0 (51.0) 11.1 (13.7)
HIV (females) 3.4 (1.5) 5.2 (7.9) 2.6 (3.3)
Hepatitis C 28.9 (34.3) 58.4 (75.7) N/A (64.3)
Sources: BC Primary Health Care Disease Registries, November 2011, BC Centre for Disease Control, Annual Report 2011, VCH, Public Health Surveillance Unit (PARIS), July 16 2012
South Asians are at an increased risk of heart disease and diabetes, and CHA 6, with its high South Asian population, has the highest chronic disease new diagnosis rates for both cardiovascular disease and diabetes. In CHA 6, from 2008/09 to 2010/11, there was a 30% decrease in the new diagnoses rates of COPD but an 18.6% increase for that of diabetes. CHA 6 has relatively low communicable disease new diagnoses rates for both HIV and Hepatitis C, with rates remaining relatively stable from 2006/08 to 2010/11.
Note: Chronic disease cases are notifi ed to various registries by primary care physicians and therefore may not truly refl ect rates of new diagnoses. Communicable disease data are collected by primary care physicians, laboratories, hospitals and institutions and reported to the local public health unit through a mandatory notifi cation system. Even though the reporting of diseases is mandatory under legislation, the number of cases may be underreported for a number of reasons: 1) not all diseases present signs and symptoms, 2) not all individuals who experience illness seek care, and 3) health care providers do not always conduct laboratory tests

A Health and Social Profi leA Health and Social Profi le Vancouver Coastal Health 66
COMMUNITY HEALTH AREA 1 CITY CENTRE
A Health and Social Profi leA Health and Social Profi le Vancouver Coastal Health 66
COMMUNITY HEALTH AREA 6 SOUTH VANCOUVERSOUTH VANCOUVER
School-age immunization coverageImmunization is one of the most eff ective methods to protect adults and children from communicable disease illness or death. Widespread immunization reduces the number of susceptible people making it diffi cult for disease to spread from person to person (British Columbia Centre for Disease Control, 2011).
The fi gures below report on two indicators for school immunization coverage. Meningococcal C immunization protects against meningoccal infection that aff ects the lining around the spinal cord and brain often resulting in death or permanent brain damage to those who survive. The Tdap immunization protects against the potentially lethal diseases of diphtheria, tetanus, and pertussis.
BC’s publicly funded immunization program off ers many vaccinations free of charge. VCH is responsible for providing these vaccinations in the school setting, however, private practice general practitioners may also provide the vaccines (British Columbia Centre for Disease Control, 2011).
CHA 6 has the highest rates of student Meningococcal C and Tdap immunization coverage amongst all CHAs. The CHA 6 Meningococcal C and Tdap immunization coverage rates are also 8.7% and 4.1% higher, respectively, as compared to Vancouver overall.
Immunization coverage may be lower in certain Community Health Areas for several reasons. Although vaccines are demonstrated to be safe, some families do not consent to their children receiving vaccinations. Some children may receive vaccinations via their primary care practioner and not through VCH public health.
Newcomer students also tend to have lower rates of immunization. They may have been vaccinated in their home countries but have incomplete records or they may be living with sponsors or in home-stay situations with adults who are unable to authorize vaccinations for minors.
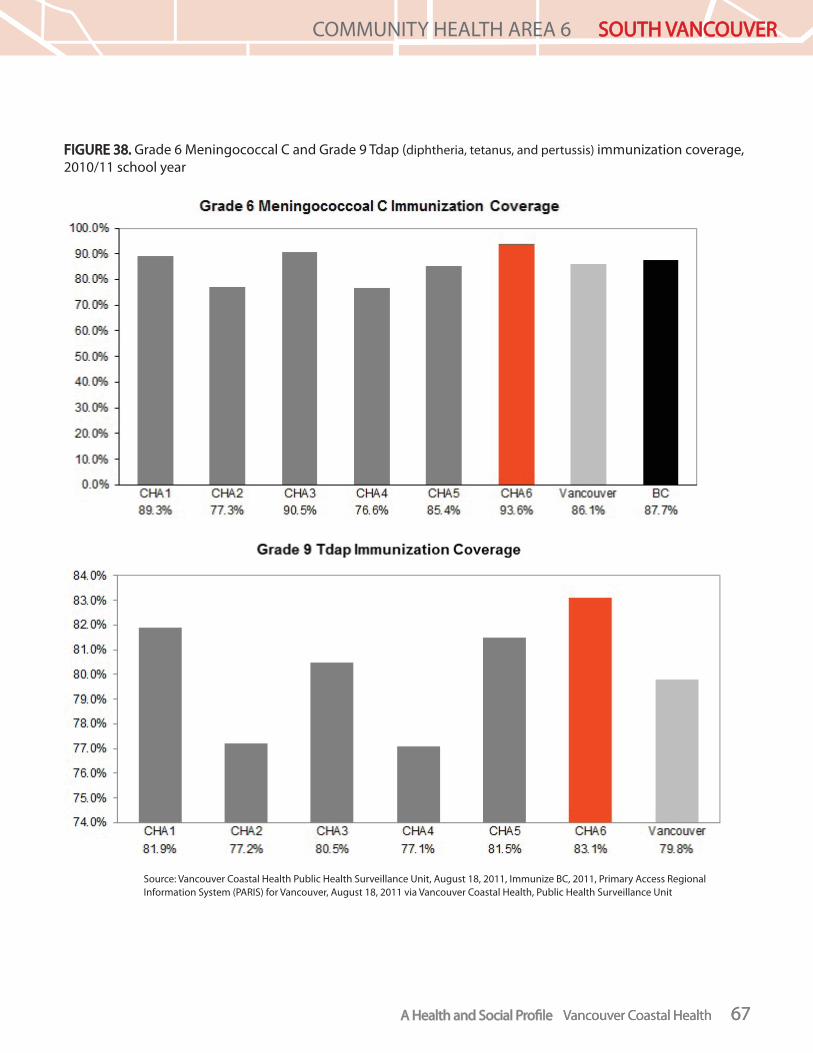
A Health and Social Profi leA Health and Social Profi le Vancouver Coastal Health 67
COMMUNITY HEALTH AREA 1 CITY CENTRE
A Health and Social Profi leA Health and Social Profi le Vancouver Coastal Health 67
COMMUNITY HEALTH AREA 6 SOUTH VANCOUVERSOUTH VANCOUVER
FIGURE 38.FIGURE 38. Grade 6 Meningococcal C and Grade 9 Tdap (diphtheria, tetanus, and pertussis) immunization coverage, 2010/11 school year
Source: Vancouver Coastal Health Public Health Surveillance Unit, August 18, 2011, Immunize BC, 2011, Primary Access Regional Information System (PARIS) for Vancouver, August 18, 2011 via Vancouver Coastal Health, Public Health Surveillance Unit

A Health and Social Profi le Vancouver Coastal Health 68A Health and Social Profi le Vancouver Coastal Health 68
COMMUNITY HEALTH AREA 6 SOUTH VANCOUVERSOUTH VANCOUVER
A Health and Social Profi le Vancouver Coastal Health 68A Health and Social Profi leA Health and Social Profi le Vancouver Coastal Health 68
Health service utilizationHealth care utilization has evolved as the population’s need for care has changed over time. Factors which have infl uenced the population’s need for care include: aging, socio-demographic population shifts and changes in the prevalence and incidence of diff erent diseases.
The prevalence of chronic health conditions has resulted in the emergence of both residential and community-based health services designed to promote functional independence and hence, keep people out of institutional settings.
Health service utilization data provide valuable insight into the health of a population and can be used to help determine the allocation of health prevention eff orts and resources.

A Health and Social Profi leA Health and Social Profi le Vancouver Coastal Health 69
COMMUNITY HEALTH AREA 1 CITY CENTRE
A Health and Social Profi leA Health and Social Profi le Vancouver Coastal Health 69
COMMUNITY HEALTH AREA 6 SOUTH VANCOUVERSOUTH VANCOUVER
Acute care servicesAcute care services include hospital admissions related to the:
• Circulatory system include heart disease, hypertensive disease, and diseases of the arteries or veins
• Digestive system include diseases of the oral cavity, esophagus, stomach, small intestine, liver, gallbladder, appendicitis, hernia, enteritis and colitis
• Respiratory system include pneumonia, infl uenza, COPD, and acute respiratory infections
• Mental disease and disorders include organic brain disorders, mental and behavioural disorders due to psychoactive substance use, schizophrenia, mood disorders, and more
TABLE 16TABLE 16. . Acute care hospital admissions (inpatient) by clinical category per 100,000 population. Community Health Areas, Vancouver, and British Columbia, 2007/08
CHA1 CHA 2 CHA3 CH4 CH5 CHA 6 Vancouver BC
Circulatory system 500.7 717.8 595.4 557.8 582.4 682.6 598.0 1049.5
Mental disease and disorders 666.4 1669.1 504.5 426.8 514.2 477.0 645.8 645.2
Respiratory system 329.7 992.5 488.9 514.2 687.1 508.7 495.6 622.3
Signifi cant trauma, injury, poisoning, and toxic eff ect of drugs 417.1 688.6 447.8 457.4 470.6 458.1 471.9 705.2
Pregnancy and childbirth 962.5 882.6 1221.2 993.0 1353.1 1175.4 1102.3 1184.9
Source: BC Ministry of Health Services, Management Information Branch (Discharge Abstract Database), December 2008 via Vancouver
Coastal Health Authority Knowledge Base
Within CHA 6, acute hospital admission rates related to the circulatory system are 682.6 per 100,000 population; higher than in Vancouver. The crude live birth rate of CHA 6 is amongst the highest of the CHAs so it is not surprising that acute hospital admission rates related to pregnancy and childbirth are 6.2% higher as compared to Vancouver overall.

A Health and Social Profi leA Health and Social Profi le Vancouver Coastal Health 70
COMMUNITY HEALTH AREA 1 CITY CENTRE
A Health and Social Profi leA Health and Social Profi le Vancouver Coastal Health 70
COMMUNITY HEALTH AREA 6 SOUTH VANCOUVERSOUTH VANCOUVER
FIGURE 39.FIGURE 39. Emergency room visits per 100,000 population. Community Health Areas and Vancouver, 2010
Source: Vancouver Coastal Health, Emergency Department Systems (CareCast, Eclipsys and McKesson
In 2010, CHA 6 had the second lowest rate of emergency room visits at 15,580.5 per 100,000 population, which is 29.3% lower as compared to Vancouver.

A Health and Social Profi leA Health and Social Profi le Vancouver Coastal Health 71
COMMUNITY HEALTH AREA 1 CITY CENTRE
A Health and Social Profi leA Health and Social Profi le Vancouver Coastal Health 71
COMMUNITY HEALTH AREA 6 SOUTH VANCOUVERSOUTH VANCOUVER
Home and community care services
Adult day centres (ADCs) are community based services for seniors and people with disabilities that provide health care supports such as medication management, personal care such as bathing, health education, and therapeutic social and recreational programs such as meal programs, fi tness, and out trips. The purpose of ADCs is to support people to remain at home and provide respite for their caregivers.
Assisted living provides housing plus supportive health services for seniors or people with physical disabilities who need extra help with meals and personal care (i.e. bathing, grooming, dressing and medication management).
Physical and occupational therapy, also known as community rehabilitation services, provides assessment, consultation, treatment and education to clients and their families in home or community clinics to help clients improve or maintain physical and functional abilities.
People are eligible for home nursing if they have been released from hospital and need short-term care, have an ongoing or chronic health issue requiring more complex care, or have a worsening health issue and need help to continue living at home. Services provided by home care nurses include assessment, education, counselling, medical and post surgical care, and palliative care.
Home support provides care for those just released from hospital or as a means of prevention from going to the hospital by providing services such as personal grooming, special exercises, and support and relief for the primary caregiver, to help people remain independent and safe in their own home as long as possible.
Residential care (RC) is for people who have complex care needs and can no longer remain safely in their own home. RC clients require 24 hour nursing care in a supervised and secure environment.

A Health and Social Profi leA Health and Social Profi le Vancouver Coastal Health 72
COMMUNITY HEALTH AREA 1 CITY CENTRE
A Health and Social Profi leA Health and Social Profi le Vancouver Coastal Health 72
COMMUNITY HEALTH AREA 6 SOUTH VANCOUVERSOUTH VANCOUVER
TABLE 17.TABLE 17. Home and community care utilization rates per 1,000 population. Community Health Area 6 and Vancouver, 2010/11
CHA 6 Vancouver
Adult Day Service 1.4 1.4
Assisted Living Service 1.7 1.0
Case Management Services 8.9 8.3
Community Rehabilitation Services 10.1 10.2
Home Nursing Services 8.2 8.6
Home Support Services – Long Term 6.0 7.9
Home Support Services - Short Term 2.9 2.6
Residential Care Services 12.3 8.1
Source: Vancouver Coastal Health, June 28, 2012
People aged 65 years and over make up 13.8% of the CHA 6 population and this age group is projected to increase to 26.4% of the population over the next 25 years. One of the main goals of the health care system is to ensure that there is an adequate supply of home and community care services so that people do not have to resort to institutional care. The volume of clients receiving these services is determined both by the demand for the service (refl ecting the proportion of the CHA that is elderly and their health status) and the resources available.
CHA 6 has higher utilization rates for assisted living, case management, short term home support, and residential care services but lower rates for home nursing and long term home support services than the Vancouver average. Most notably, residential care service utilization rates are 34% greater within CHA 6 than in Vancouver overall.

A Health and Social Profi leA Health and Social Profi le Vancouver Coastal Health 73
COMMUNITY HEALTH AREA 1 CITY CENTRE
A Health and Social Profi leA Health and Social Profi le Vancouver Coastal Health 73
COMMUNITY HEALTH AREA 6 SOUTH VANCOUVERSOUTH VANCOUVER
TABLE 18TABLE 18. . The number of publicly funded assisted living, hospice, and residential care beds. Community Health Areas and Vancouver, 2010/2011
Assisted Living Hospice Residential Care
CHA 1 113 12 917
CHA 2 105 6 185
CHA 3 96 10 474
CHA 4 15 0 888
CHA 5 75 0 387
CHA 6 199 0 1035
Vancouver 603 28 3886
Source: BC Ministry of Health Services Health Systems Planning Division, 2009
CHA 6 has approximately one third of Vancouver’s assisted living beds and one quarter of Vancouver’s residential care beds, the most amongst the CHAs.
Note: Assisted living, hospice, and residential care facilities are open to all residents and do not just serve a community. Some residents in a community health area might access home and community health services outside their own health area but most prefer to stay in their neighbourhood whenever possible.

A Health and Social Profi leA Health and Social Profi le Vancouver Coastal Health 74
COMMUNITY HEALTH AREA 1 CITY CENTRE
A Health and Social Profi leA Health and Social Profi le Vancouver Coastal Health 74
COMMUNITY HEALTH AREA 6 SOUTH VANCOUVERSOUTH VANCOUVER
FIGURE 40.FIGURE 40. General physicians per 100,000 population. Community Health Areas, Vancouver, and British Columbia, 2009
Source: BC Ministry of Health Services Health System Planning Division, Medical Services Plan Information Resource Manual, 2008/2009
CHA 6 has the second fewest number of general physicians per 100,000 population.

A Health and Social Profi le Vancouver Coastal Health 75A Health and Social Profi le Vancouver Coastal Health 75
COMMUNITY HEALTH AREA 6 SOUTH VANCOUVERSOUTH VANCOUVER
A Health and Social Profi le Vancouver Coastal Health 75A Health and Social Profi leA Health and Social Profi le Vancouver Coastal Health 75
Neighbourhoods in CHA 6

A Health and Social Profi leA Health and Social Profi le Vancouver Coastal Health 76
COMMUNITY HEALTH AREA 1 CITY CENTRE
A Health and Social Profi leA Health and Social Profi le Vancouver Coastal Health 76
COMMUNITY HEALTH AREA 6 SOUTH VANCOUVERSOUTH VANCOUVER
CHA 6 (South Vancouver) is composed of 5 unique neighbourhoods including: Oakridge, Marpole, Sunset, Victoria-Fraserview, and Killarney. Geographically, South Vancouver is the second largest of the community health areas and the largest and most culturally diverse in terms of population.
Oakridge
Boundaries: centred on Oak and Cambie Streets between 41st and 57th Avenues
Area (hectares): 401
Population: 12,735
Oakridge is a middle-class, suburban neighbourhood, home to classic bungalows and Vancouver’s fi rst shopping centre- Oakridge Centre. On August 17, 2009, the Canada Line, a rapid transit system that links Vancouver with central Richmond and the Vancouver International Airport, was opened, becoming a major catalyst for development and change along the Cambie Corridor.
Within South Vancouver, Oakridge has the highest percentage of people aged 5 years and over (19.6%). The majority report Chinese (50.5%), while a minority report English (31.6%) as their mother tongue (City of Vancouver, 2009).
The median after-tax household income is $54,784, the highest amongst all the South Vancouver neighbourhoods. It is home to a mix of single-detached houses (47.1%) and apartments (41.5%), with the highest average gross rent at $1,064. Within South Vancouver, Oakridge is home to the highest percentage of owner occupied dwellings (City of Vancouver, 2009).
Marpole
Boundaries: stretching from Angus Drive to Ontario Street and from 57th Avenue to the North Arm of the Fraser River
Area (hectares): 561
Population: 23,785
Marpole is one of the city’s oldest communities with a many mid-century suburban and middle-class neighbourhoods. Its three bridges make it a major commuting corridor connecting Vancouver to parts south of the Fraser River.
Within South Vancouver, Marpole has the highest percentage of persons aged 40-64 years (37.1%) and second highest percentage of people aged 20-39 years (30.5%). 40.7% report Chinese and 36.5% report English as their mother tongue (City of Vancouver, 2009).
The median household income, after-tax of Marpole is $41,125, much lower as compared to the other South Vancouver neighbourhoods. Marpole is composed primarily of low-rise apartments

A Health and Social Profi leA Health and Social Profi le Vancouver Coastal Health 77
COMMUNITY HEALTH AREA 1 CITY CENTRE
A Health and Social Profi leA Health and Social Profi le Vancouver Coastal Health 77
COMMUNITY HEALTH AREA 6 SOUTH VANCOUVERSOUTH VANCOUVER
(53.4%), with rentals making up 57.2% of the dwellings, the highest in South Vancouver, at an average gross rent of $822. Renters tend to move a lot so it is unsurprising that Marpole is home to the most mobile population, with 52.7% having changed addresses between 2001 and 2006 (City of Vancouver, 2009).
In Spring 2012, the City of Vancouver embarked on the comprehensive Marpole Community Plan that provides a framework to guide positive change and development with the neighbourhood in a variety of topics including: land use, urban design, housing, transportation, park and public spaces, heritage features, and community facilities (City of Vancouver, 2009).
Sunset
Boundaries: stretching from Ontario to Knight Street and from 41st Avenue to the North Arm of the Fraser River
Area (hectares): 627
Population: 35,230
Within South Vancouver, Sunset is home to the youngest population with the highest percentage of people aged 19 years and under (24.7%) and 20-39 years (30.6%). 24.9% of the population report English, 26.1% report Punjabi, and 21.3% report Chinese as their mother tongue, with Sunset home to the majority of Vancouver’s South Asian population (City of Vancouver, 2009).
Sunset has a moderate median household income, after-tax of $51,311. It is composed primarily of detached duplexes (51.9%), with rentals making up 40.9% of the dwellings at an average gross rent of $784, the lowest within CHA 6 (City of Vancouver, 2009).
Sunset is a well-established single-family oriented community, home to the Punjabi Market shopping district. The City of Vancouver’s Sunset Community Vision Program was approved by City Council and will be used at City Hall to guide decision-making aff ecting Sunset through to 2021, and to set priorities for funding, programs, and services. (City of Vancouver, 2009).
Victoria-Fraserview
Boundaries: stretches from Knight to Vivian Street and from 41st Avenue to the North Arm of the Fraser River
Area (hectares): 532
Population: 29,200
The Victoria-Fraserview neighbourhood has a long history of redevelopment from agricultural to industrial, and now to residential use with the East Fraserlands development.
Within South Vancouver, Victoria-Fraserview has the second highest percentage of people aged 65 years and over (17.1%). 48.1% report Chinese and 25.7% report English as their mother

A Health and Social Profi leA Health and Social Profi le Vancouver Coastal Health 78
COMMUNITY HEALTH AREA 1 CITY CENTRE
A Health and Social Profi leA Health and Social Profi le Vancouver Coastal Health 78
COMMUNITY HEALTH AREA 6 SOUTH VANCOUVERSOUTH VANCOUVER
tongue (City of Vancouver, 2009).
Victoria-Fraserview has a moderate median after-tax income of $49,499. The neighbourhood is primarily made up of single-detached homes (37.6%), detached duplexes (32.8%), and low rise apartment buildings (25.0%), with 64.6% of them being owner occupied. More stable communities are more likely to own (rather than rent) and Victoria-Fraserview has the most stable community in South Vancouver, with only 41.6% having moved between 2001 and 2006 (City of Vancouver, 2009).
The City of Vancouver’s Victoria-Fraserview/Killarney (V-F/K) Community Vision Program was approved by City Council and will be used at City Hall to guide decision-making aff ecting V-F/K through to 2021, and to set priorities for funding, programs, and services (City of Vancouver, 2009).
Killarney
Boundaries: located in the southeast corner of Vancouver stretching from Vivian Street to Boundary Road and from East 41st Avenue to the Fraser River.
Area (hectares): 677
Population: 27,180
Within Killarney is the East Fraserlands, 126 acres of industrial land south of Marine Way and east of Kerr Street to Boundary Road, that is being developed over the next 25 years into a new, sustainable residential community, which will include parks, a community centre, commercial centre, schools, childcare facilities, a riverfront walk, and other public amenities.
Killarney has a high percentage of its population aged 40 to 64 years, while another 22.4% are aged 19 years, 27.4% are aged 20 to 39 years, and 13.8% are aged 65 and over. More people report Chinese (38.4%) than English (33.5%) as their mother tongue (City of Vancouver, 2009).
At $53,242, Killarney has the second highest median household income, after-tax amongst the South Vancouver neighborhoods. It is primarily made up of row houses (31.9%), single detached houses (24.9%), and low rise apartment buildings (20.5%), at a moderate average gross rent of $844 (City of Vancouver, 2009).
Similar to Victoria-Fraserview, Killarney underwent a community visioning process through the City of Vancouver Community Vision Program (City of Vancouver, 2009).

A Health and Social Profi le Vancouver Coastal Health 79A Health and Social Profi le Vancouver Coastal Health 79
COMMUNITY HEALTH AREA 6 SOUTH VANCOUVERSOUTH VANCOUVER
A Health and Social Profi le Vancouver Coastal Health 79A Health and Social Profi leA Health and Social Profi le Vancouver Coastal Health 79
CHA 6 community resources

A Health and Social Profi leA Health and Social Profi le Vancouver Coastal Health 80
COMMUNITY HEALTH AREA 1 CITY CENTRE
A Health and Social Profi leA Health and Social Profi le Vancouver Coastal Health 80
COMMUNITY HEALTH AREA 6 SOUTH VANCOUVERSOUTH VANCOUVER
Public elementary schools23 in total
3 in Oakridge (Dr. Annie B. Jamieson, Sir William Osler and Van Horne)
4 in Marpole (Sir Wilfred Laurier, David Lloyd George, J.W. Sexsmith and Sir Wilfred Laurier Annex)
4 in Sunset (John Henderson, Walter Moberly, Pierre Elliot Trudeau and Henderson Annex)
8 in Victoria-Fraserview (Sir Charles-Kingsford Smith, Sir James Douglas, Sir Sanford Fleming, David Oppenheimer, Dr. George M. Weir, Waverley, Tecumseh and Douglas Annex)
4 in Killarney (Champlain Heights, Captain James Cook, Dr. H.N. MacCorkindale and Champlain Heights Annex)
Public secondary schools4 in total
1 in Oakridge (Sir Winston Churchill)
1 in Sunset (John Oliver)
1 in Victoria-Fraserview (David Thompson)
1 in Killarney (Killarney)
Post secondary schools and collegesLangara College
Family resource programsSouth Vancouver Family Place
Marpole Oakridge Family Place
7 Strong Start Programs (Moberly, Champlain Heights Annex, Cook, David Lloyd George, Henderson Annex, Waverly, and Anne Hebert Strong Start Centre)
Several family resource programs operated by community centres and neighbourhood houses
Note: Family Places / family resource programs are parent / child interactive programs for families with children 0-6 years. Family resource programs are unique from other early childhood development programs in that parent and child attend together. Family resource programs have fi ve core areas of service which include: family support, play-based learning, early literacy, learning and care, parent education, and information and referrals. They are low cost or free with subsidies readily available. Family Places may be independent stand-alone organizations or embedded in a multi-service agency such as a neighbourhood
house.
Non-market housing complexes 64 in total
3 in Oakridge: all servicing seniors
15 in Marpole: 9 housing co-operatives and 4 for seniors
5 in Sunset: 2 housing co-operatives, 1 for families, and 1 for seniors
14 in Victoria-Fraserview: 6 for seniors and 5 for families
27 in Killarney: 14 housing co-operatives, 5 are for seniors, and 7 are for families
Adult Day Centres (ADCs)L’Chaim Centre ADC
South Vancouver ADC Seniors Centre
Oakridge Seniors Centre
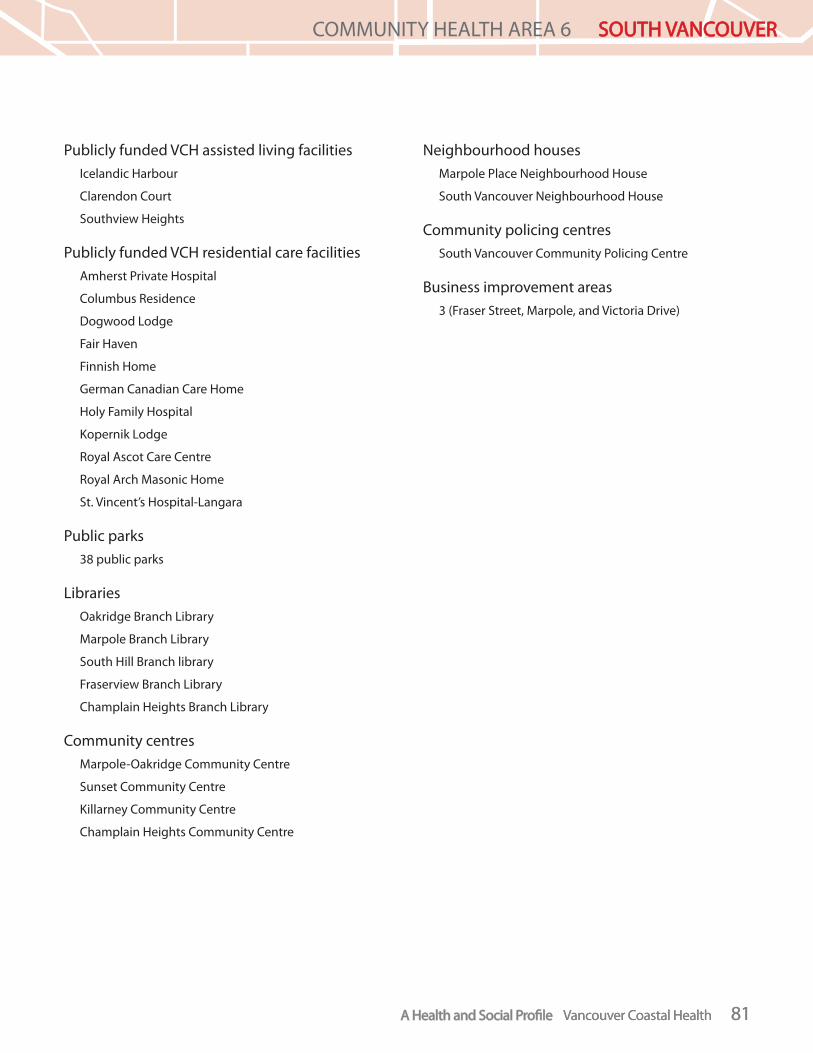
A Health and Social Profi leA Health and Social Profi le Vancouver Coastal Health 81
COMMUNITY HEALTH AREA 1 CITY CENTRE
A Health and Social Profi leA Health and Social Profi le Vancouver Coastal Health 81
COMMUNITY HEALTH AREA 6 SOUTH VANCOUVERSOUTH VANCOUVER
Publicly funded VCH assisted living facilitiesIcelandic Harbour
Clarendon Court
Southview Heights
Publicly funded VCH residential care facilitiesAmherst Private Hospital
Columbus Residence
Dogwood Lodge
Fair Haven
Finnish Home
German Canadian Care Home
Holy Family Hospital
Kopernik Lodge
Royal Ascot Care Centre
Royal Arch Masonic Home
St. Vincent’s Hospital-Langara
Public parks38 public parks
LibrariesOakridge Branch Library
Marpole Branch Library
South Hill Branch library
Fraserview Branch Library
Champlain Heights Branch Library
Community centresMarpole-Oakridge Community Centre
Sunset Community Centre
Killarney Community Centre
Champlain Heights Community Centre
Neighbourhood housesMarpole Place Neighbourhood House
South Vancouver Neighbourhood House
Community policing centresSouth Vancouver Community Policing Centre
Business improvement areas3 (Fraser Street, Marpole, and Victoria Drive)
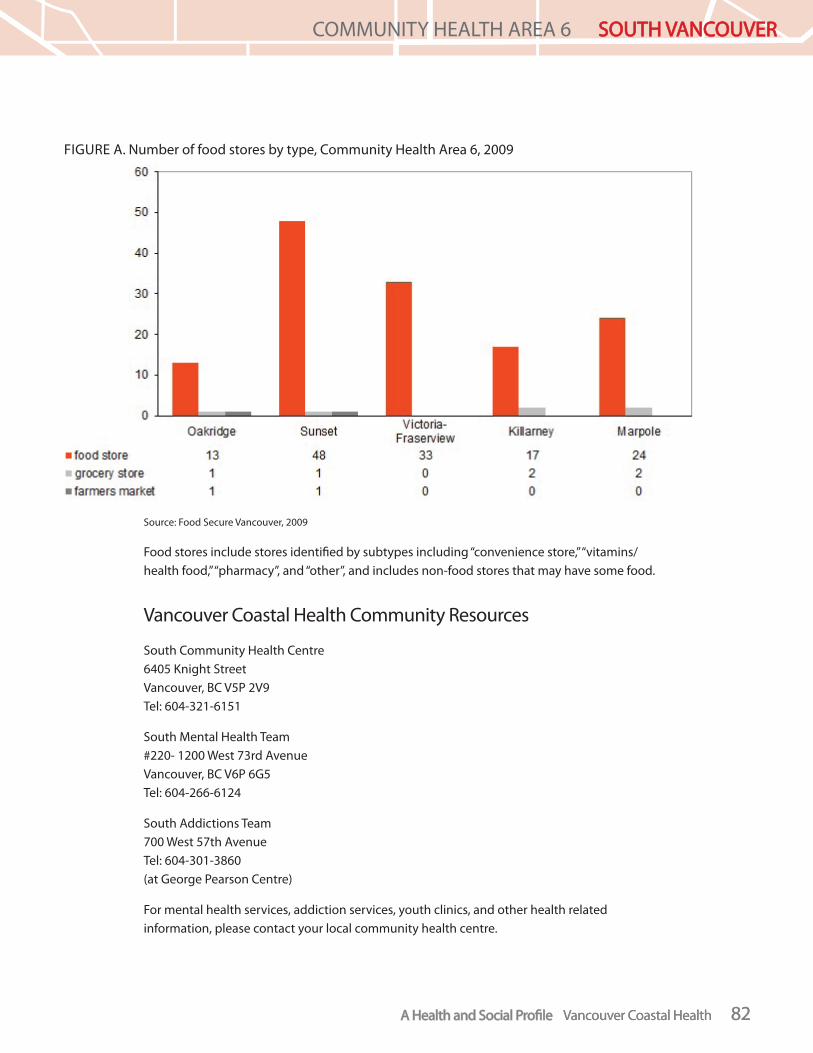
A Health and Social Profi leA Health and Social Profi le Vancouver Coastal Health 82
COMMUNITY HEALTH AREA 1 CITY CENTRE
A Health and Social Profi leA Health and Social Profi le Vancouver Coastal Health 82
COMMUNITY HEALTH AREA 6 SOUTH VANCOUVERSOUTH VANCOUVER
FIGURE A. Number of food stores by type, Community Health Area 6, 2009
Source: Food Secure Vancouver, 2009
Food stores include stores identifi ed by subtypes including “convenience store,” “vitamins/health food,” “pharmacy”, and “other”, and includes non-food stores that may have some food.
Vancouver Coastal Health Community Resources
South Community Health Centre6405 Knight StreetVancouver, BC V5P 2V9Tel: 604-321-6151
South Mental Health Team#220- 1200 West 73rd AvenueVancouver, BC V6P 6G5Tel: 604-266-6124
South Addictions Team 700 West 57th AvenueTel: 604-301-3860(at George Pearson Centre)
For mental health services, addiction services, youth clinics, and other health related information, please contact your local community health centre.

A Health and Social Profi leA Health and Social Profi le Vancouver Coastal Health 83
COMMUNITY HEALTH AREA 1 CITY CENTRE
A Health and Social Profi leA Health and Social Profi le Vancouver Coastal Health 83
COMMUNITY HEALTH AREA 6 SOUTH VANCOUVERSOUTH VANCOUVER
ReferencesBC Ministry of Children and Family Development. (2011). Children and youth needing care. Retrieved from http://www.mcf.
gov.bc.ca/foster/inneed.htm
BC Ministry of Education. (n.d.). Foundation skills assessment. Retrieved from http://www.bced.gov.bc.ca/assessment/fsa/
BC Ministry of Education (2011). District reports. Retrieved from http://www.bced.gov.bc.ca/reporting/district_data_summary.php
BC Ministry of Health Services, Health System Planning Division (Medical Services Plan Information Resource Manual) 2009
BC Ministry of Health Services, Management Information Branch (Discharge Abstract Database), December 2008
BC Ministry of Social Development. (2012, May 28). Applying for BC Employment and Assistance (BCEA). Retrieved from http://www.eia.gov.bc.ca/bcea.htm
BC Primary Health Care (Cardiovascular Disease Registry, Chronic Obstructive Pulmonary Disease Registry and Diabetes Registry), November 2011
British Columbia. Provincial Health Offi cer. (2003). A Review of Infant Mortality In British Columbia: Opportunities for Prevention. Victoria, B.C.: Ministry of Health Planning.
BC Stats. (n.d.). Basic income assistance recipients. Retrieved from http://www.bcstats.gov.bc.ca/Files/ae995933-4584-4ad5-9176-b0e407680d16/IncomeAssistanceRecipientsNotes.pdf
BC Stats. (2012, March). Adults receiving basic income assistance regional district report. Retrieved from http://www.bcstats.gov.bc.ca/Files/eb265156-ef82-44b0-b7d1-68316244e8e3/IncomeAssistanceRecipientsbyRDandMunicipality2012Q1.pdf
BC Stats. (2012, March). Population estimates for B.C. census metropolitan areas and census agglomerations. Retrieved from http://www.bcstats.gov.bc.ca/StatisticsBySubject/Demography/PopulationEstimates.aspx
BC Stats (2011). Local health area 161 – Vancouver City Centre statistical profi le. Retrieved from http://www.bcstats.gov.bc.ca/StatisticsBySubject/SocialStatistics/SocioEconomicProfi lesIndices/Profi les.aspx
BC Stats (2011). Local health area 162 – Vancouver Downtown Eastside statistical profi le. Retrieved from http://www.bcstats.gov.bc.ca/StatisticsBySubject/SocialStatistics/SocioEconomicProfi lesIndices/Profi les.aspx
BC Stats (2011). Local health area 163 – Vancouver North East statistical profi le. Retrieved from http://www.bcstats.gov.bc.ca/StatisticsBySubject/SocialStatistics/SocioEconomicProfi lesIndices/Profi les.aspx
BC Stats (2011). Local health area 164 – Vancouver Westside statistical profi le. Retrieved from http://www.bcstats.gov.bc.ca/StatisticsBySubject/SocialStatistics/SocioEconomicProfi lesIndices/Profi les.aspx
BC Stats (2011). Local health area 165 – Vancouver Midtown statistical profi le. Retrieved from http://www.bcstats.gov.bc.ca/StatisticsBySubject/SocialStatistics/SocioEconomicProfi lesIndices/Profi les.aspx
BC Stats (2011). Local health area 166 – Vancouver South statistical profi le. Retrieved from http://www.bcstats.gov.bc.ca/StatisticsBySubject/SocialStatistics/SocioEconomicProfi lesIndices/Profi les.aspx
BC Stats. (2011, June). HSDA 32 – Vancouver statistical profi le. Retrieved from http://www.bcstats.gov.bc.ca/StatisticsBySubject/SocialStatistics/SocioEconomicProfi lesIndices/Profi les.aspx
BC Stats. (2011, July). British Columbia population 1867 – 2010 [Data fi le]. Retrieved from http://www.bcstats.gov.bc.ca/StatisticsBySubject/Demography/PopulationEstimates.aspx

A Health and Social Profi leA Health and Social Profi le Vancouver Coastal Health 84
COMMUNITY HEALTH AREA 1 CITY CENTRE
A Health and Social Profi leA Health and Social Profi le Vancouver Coastal Health 84
COMMUNITY HEALTH AREA 6 SOUTH VANCOUVERSOUTH VANCOUVER
BC Vital Statistics Agency. (2009). Glossary. In Selected vital statistics and health status indicators: One-hundred and thirty eighth annual report 2009. Retrieved from http://www.vs.gov.bc.ca/stats/annual/2009/pdf/glossary.pdf
BC Vital Statistics Agency (VISTA Database), June 2012.
British Columbia Centre for Disease Control. (2011). Diseases and Vaccinations. Retrieved from http://immunizebc.ca/diseases-vaccinations
British Columbia Centre for Disease Control. (2012, June 28). British Columbia annual summary of reportable diseases 2010. Retrieved from http://www.bccdc.ca/NR/rdonlyres/6F0D23A6-18E8-4983-AE53-A7F0C7F0D91B/0/2010CDAnnualReportFinal.pdf
British Columbia Centre for Disease Control. (HIV/AIDS Information System), June 2012.
British Columbia Provincial Health Offi cer. (2008). An ounce of prevention revisited: A review of health promotion and selected outcomes for children and youth in BC schools. Retrieved from http://www.health.gov.bc.ca/pho/pdf/phoannual2006.pdf
Census Dictionary. (2006). Statistics Canada. Retrieved from http://www12.statcan.gc.ca/census-recensement/2006/ref/dict/pop045-eng.cfm
Citizenship and Immigration Canada. (2005). Recent Immigrants in Metropolitan Areas: Vancouver— A Comparative Profi le Based on the 2001 Census. Retrieved from http://www.cic.gc.ca/english/resources/research/census2001/vancouver/partc.asp
City of Vancouver. (n.d.) List of all parks by neighbourhood. Retrieved from http://cfapp.vancouver.ca/parkfi nder_wa/index.cfm?fuseaction=FAC.ParkList_Area#9
City of Vancouver. (2009a). Community pages. Retrieved from http://vancouver.ca/community_profi les/communitylist.htm
City of Vancouver. (2009b). The role of secondary suites: rental housing strategy- Study 4. Retrieved from http://vancouver.ca/commsvcs/housing/pdf/dec09secsuitesstudy.pdf
City of Vancouver. (2010a). City plan and community visions. Retrieved from http://vancouver.ca/commsvcs/planning/cityplan/visions/
City of Vancouver. (2010b). Rental housing strategy research and policy development synthesis report. Retrieved from http://vancouver.ca/commsvcs/housing/pdf/RentalHousingSynthesisReport.pdf
City of Vancouver. (2010c).What is non-market housing? Retrieved from http://vancouver.ca/commsvcs/housing/whatis.htm
City of Vancouver. (2012a). Non-market housing inventory. Retrieved from http://app.vancouver.ca/NonMarketHousing_Net/default.aspx
City of Vancouver. (2012b). Vancouver 2012 homeless count results. Retrieved from http://vancouver.ca/ctyclerk/cclerk/20120529/documents/rr1presentationrevised.pdf
Food Secure Vancouver. (2009). Accessibility. Retrieved from http://www.foodsecurevancouver.ca/accessibility/availability/foodaccess-stores
Human Resources and Skills Development Canada. (2012, July 17). Indicators of Well-Being in Canada. Retrieved from http://www4.hrsdc.gc.ca/[email protected]?iid=4
Ohlsson A, Prakeshkumar Shah. (2008). Determinants and Prevention of Low Birth Weight: A Synopsis of the Evidence. Alberta: Institute of Health Economics. Retrieved Dfrom http://www.ihe.ca/publications/library/2008/determinants-and-

A Health and Social Profi leA Health and Social Profi le Vancouver Coastal Health 85
COMMUNITY HEALTH AREA 1 CITY CENTRE
A Health and Social Profi leA Health and Social Profi le Vancouver Coastal Health 85
COMMUNITY HEALTH AREA 6 SOUTH VANCOUVERSOUTH VANCOUVER
prevention-of-low/
Public Health Agency of Canada. (2012, February 22). Infectious Diseases. Retrieved from http://www.phac-aspc.gc.ca/id-mi/index-eng.php
Statistics Canada, 2001 Census of Population
Statistics Canada, 2006 Census of Population
Statistics Canada. (2007). Musqueam, British Columbia (Code630308) (table). Aboriginal Population Profi le. 2006 Census. Statistics Canada Catalogue no. 92-594-XWE. Ottawa. Released January 15, 2008. Retrieved from http://www12.statcan.ca/census-recensement/2006/dp-pd/prof/92-594/index.cfm?Lang=E
Statistics Canada. (2010, July 6). 2006 Census dictionary. Retrieved from http://www12.statcan.gc.ca/census-recensement/2006/ref/dict/index-eng.cfm
Statistics Canada. (2012, June 18). Low income cut off s. Retrieved from http://www.statcan.gc.ca/pub/75f0002m/2012002/lico-sfr-eng.htm
Statistics Canada. (2012, June 18). Table 1 – Low income cut off s (1992 base) after-tax. Retrieved from http://www.statcan.gc.ca/pub/75f0002m/2012002/tbl/tbl01-eng.htm
University of British Columbia, Human Early Learning Partnership. (2011, September 22). Early Development Instrument Data Tables. Retrieved from http://earlylearning.ubc.ca/maps/edi/data/
Vancouver Coastal Health. (2010, April). Bed Map. Retrieved July 18, 2012.
Vancouver Coastal Health, Care Cast (Richmond Hospital, UBC Hospital, and Vancouver General Hospital) and Eclipsys (Mount Saint Joseph Hospital, St. Paul’s Hospital), October 2010.
Vancouver Coastal Health Home and Community Care Decision Support Cube, (June 28, 2012)
Vancouver Coastal Health. (2011). Home and Community Care. Retrieved from http://www.vch.ca/your_health/health_topics/home_and_community_care/home_and_community_care
Vancouver Coastal Health Public Health Surveillance Unit. (2011, August 18). Primary Access Regional Information System (PARIS) for Vancouver.
Vancouver Coastal Health. (2011, November 17). Adult Day Centre contacts- Vancouver.