a geographic information system method for estimating home
TRANSCRIPT

A Geographic Information System Method for Estimating Home Range Size
Linde E. T. Ostro; Truman P. Young; Scott C. Silver; Fred W. Koontz
The Journal of Wildlife Management, Vol. 63, No. 2. (Apr., 1999), pp. 748-755.
Stable URL:http://links.jstor.org/sici?sici=0022-541X%28199904%2963%3A2%3C748%3AAGISMF%3E2.0.CO%3B2-K
The Journal of Wildlife Management is currently published by Alliance Communications Group.
Your use of the JSTOR archive indicates your acceptance of JSTOR's Terms and Conditions of Use, available athttp://www.jstor.org/about/terms.html. JSTOR's Terms and Conditions of Use provides, in part, that unless you have obtainedprior permission, you may not download an entire issue of a journal or multiple copies of articles, and you may use content inthe JSTOR archive only for your personal, non-commercial use.
Please contact the publisher regarding any further use of this work. Publisher contact information may be obtained athttp://www.jstor.org/journals/acg.html.
Each copy of any part of a JSTOR transmission must contain the same copyright notice that appears on the screen or printedpage of such transmission.
The JSTOR Archive is a trusted digital repository providing for long-term preservation and access to leading academicjournals and scholarly literature from around the world. The Archive is supported by libraries, scholarly societies, publishers,and foundations. It is an initiative of JSTOR, a not-for-profit organization with a mission to help the scholarly community takeadvantage of advances in technology. For more information regarding JSTOR, please contact [email protected].
http://www.jstor.orgTue Oct 30 11:20:53 2007

- -
A GEOGRAPHIC INFORMATION SYSTEM METHOD FOR ESTIMATING HOME RANGE SIZE LlNDE E. T. OSTRO,' Louis Calder Center Biological Station and Department of Biology, Fordham University, P.O. Box K,
Armonk, NY 10504, USA TRUMAN P. YOUNG, Department of Environmental Horticulture, University of California, Davis, CA 95616, USA SCOTT C. SILVER, Queens Wildlife Center, Wildlife conservation Society, 53-51 11l t h Street, Flushing, NY 11368, USA FRED W. KOONTZ, Science Resource Center, Wildlife conservation Society, 2300 Southern Boulevard, Bronx, NY 10460, USA
Abstract: \Ve developed a new technique to quantify home ranges by using coordinate-based data that were collected at srnall time intenals and entered into a Geographic Information System (GIS). We used this technique (digitized polygons [DP]) and 4 other established methods to estimate home range sizes of groups of black howler monkeys (Alorrana pigra). \Ve calculated the size of the area used by the study groups during the study period. The DP niethod used all available data points, excluded lacunae within home ranges, and accounted for spread of the group. The DP estimates of home range size were compared with 4 widely used methods: n~inimunl convex polygon (MCP), grid-cell (GC) ,95% Ilarmonic mean (HM), and 95% adaptive kernel (AK!. Sizes of home ranges ranged fro,* 1 to 62 ha. Results of all procedures were strongly correlated tP < 0.001), altholigh each gave very different estimates of home range sizes. The DP estimates were smaller than AK (P < 0.039) and hiCP ( P < 0.002) estimates and consistently (although not significantly) larger than GC: niethods ( P = 0.99). There was no statistically significant or consistent difference behveen DP and Hki estimates. Digitized polygons required the investigator to select path width and size of lacunae to exclude, but these decisions can be based upon biologicrtl information. This method may be the most appropriate technique to deter~nirle Ilorne range size with autocorrelated location data that can be converted to day-range paths.
JOURNAL OF WILDLIFE MANAGEMENT 63(2):748-755
K e y words: Alotruttn pigra, Belize, black howler monkey, digitized polygon, CIS, home range, method, pri- mate.
All techniques used to estimate size or use which is crucial to understanding the biology of patterns of an animal's home range require sub- the animal (Reynolds and Laundre 1990). jective decisions on the part of the investigator, Nonstatistical techniques such as MCP or GC and all have statistical limitations (Kenward counts are widely used by primatologists as 1987, Harris et al. 1990, \Vhite and Garrott home range estimators (e.g., Isbell 1983, Fedi- 1990). Most home range estimators were de- gan et al. 1988, Isbell et al. 1990, Olupot et al. veloped to ana1,yze data points collected once or 1994, De la Torre et al. 1995, Zhang 1995, Ston- a few times a day, often from live-trapping or er 1996). However, like all methods (including radiotelemetry studies. However, many s tules the method presented here), nonstatistical tech- investigate habituated individuals or groups of niques are sensitive to sample size (Goldingay animals. Data collected in these studies are of- and Kavanagh 1993). In addition, they may give ten multiple sequential location points collected only crude size estimates or require multiple over a long time period, and are usually highly subjective decisions such as grid size, place- autocorrelated. Probabilistic estimators that as- ment, and linkage methods ('l'oight and Tinline sume independence of points cannot readily be 1980). applied to these data (Dixon and Chapman Home range data are usually collected as a 1980, Skvihart and Slade 1985; TVorton 1987, series of point locations or coordinates with no 1989). Increasing the time intend between area associated with a point. However, if the
data points to achieve statistical independence unit under investigation is a group of animals rather than an individual, each location will can result in underestimation of an animal's have an area associated with it that corresponds range and loss of information, such as distance to group spread. None of the commonly used moved in a 24-hr period (day-range length), techniques accounts for the spread of a group.
We present a method for estimating the size of a home range as calculated with the GIs soft-' E-mail: [email protected] ware IDRISI (Eastman 1995). Home range is

defined as the area the study animals were known to use during the study period. Our goal in using a GIs to analyze ranging data was to create a home range estimator that would use " all available data points, exclude areas not used by the animals, account for area used by the whole group during the time period of the study, and be ecologically and behaviorally rel- evant. We applied this mkthod and 4 commonly used home ranee estimators to 10 sets of loca- " tion data collected on groups of black howler monkeys between March 1994 and May 1995. These data were collected as part of a study of translocated black howler monkeys in ~ e i i z e , Central America (Koontz et al. 1994, Silver 1997, Ostro 1998), and were used to investigate
L>
the spatial ecology of translocated monkeys (0s- tro 1998, Ostro et al. 1999). We cbscuss the dif- ferences between the DP and other methods used to calculate home range estimates, and the ecological implications of those differences.
METHODS We collected location data on 8 groups of
black howler monkeys in 3 areas. Six groups were studied for 3 months prior to translocation at 2 sites in the Community Baboon Sanctuary (CBS) in northern Belize (Tl , T2, T3, T4, C1, C2). Each group was followed for 8 days during this time. In May 1994, Groups T1, T2, T3, and T4 were translocated to the Cockscomb Basin Wildlife Sanctuary (CBWS) in southern Belize. Following the translocation, we continued to study Groups T1 and T2 in CBWS (Tla, T2a), and Groups C1 and C2 in CBS for 1year. At this time, we also began to follow 2 groups that had been translocated to CBWS in previous years (E l , E2). In the year following translo- cation, we followed each group of monkeys (Tla, T2a, E l , E2, C1, C2) 4 times a month. A data collection ~ e r i o d lasted from the time we first contacted the monkeys to that time the fol- lowing day.
We created a trail system in CBS by cutting and marking trails every 20 m with position tags. The distance between tags was measured to the nearest meter, and degree readings were taken by sight compass. We calculated the Uni- versal Transverse Mercator (UTM) coordmates of each tag. In CBWS, a trail system marked with positibn tags every 50 m already existed, and UTM coordinates had previously been de- termined for each tag in CBWS (Koontz et al. 1994). We checked accuracy via differentially
corrected GPS readings and by measuring dis- tances to alternative tags in the area.
During data collection, we recorded the lo- cation of the estimated center of the monkey group every 15 min relative to a permanent tag, and we later calculated position coordmates. If monkeys moved away from known positions, we placed and measured new tags along their travel path. Day-range path was recorded as the se- quence of coordinates taken every 15 min dur- ing a data collection period and was calculated as the sum of distances between each set of co- ordmates. Group spread was estimated at least once per hour as the diameter of a circle that would encompass all group members.
Data Analysis We analyzed 10 sets of data points with each
of the following procedures: (1)MCP, (2) 20- X 20-m GC counts, (3) 95% HM estimates (Dixon and Chapman 1980), (4) 95% AK esti- mates (Worton 1987, 1989). and ( 5 ) DP (see below).
For the GC method, we used day-range paths of monkeys to calculate number of cells entered rather than use an arbitrary linkage method to join cells with nonadjacent locations. We cal- culated 95% HM and 95% AK estimates ma a subset of independent data points. The subset was created by sequentially removing data points until the ratio of t211-2 (Schoener 1980) for each dataset was >0.95 and <1.05, where t = the distance between points, and r = the dis- tance from each point to the geometric mean of all points. Minimum convex polygons, 95% HM, and 95% AK estimates were calculated via the program CALHOME (Kie et al. 1996). The default option for grid-cell size was used, and the program estimated an optimal smoothing parameter. Home range estimates using DP and GC analyses were calculated wlth IDRISI (Eastman 1995).
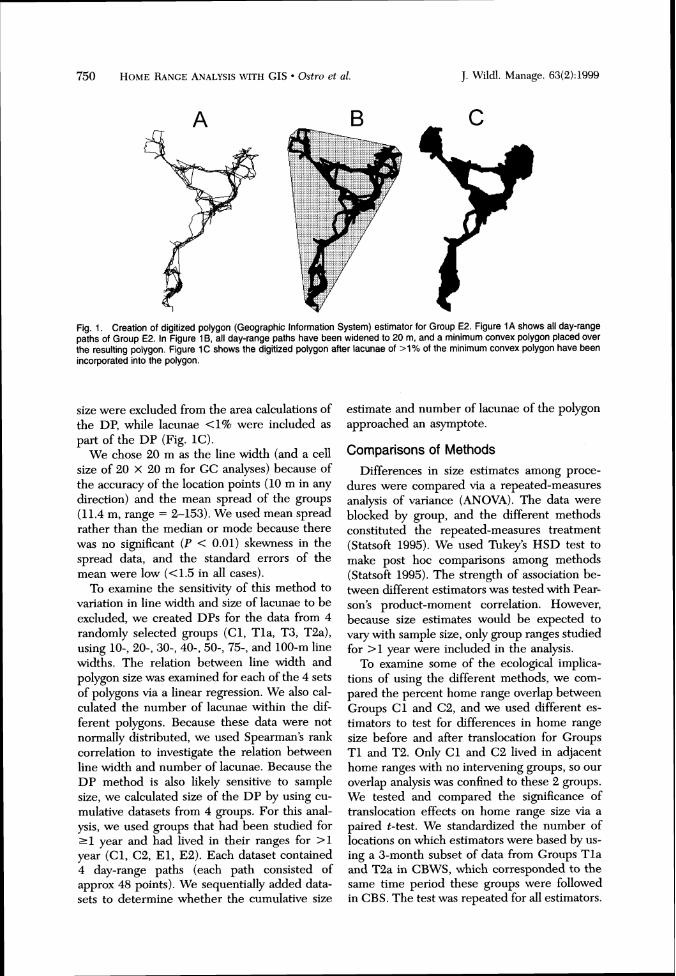
Digitized Polygons We created DP estimators by mapping day-
range paths of the groups (Fig. lA), and we then created a 20-m-wide buffer around each path. We supenmposed an MCP on the result- ing range map (Fig. 1B) and calculated the size of all lacunae (contiguous areas within the MCP not entered by the monkeys). The lacunae that were avoided by the groups due to topographic features or abnipt vegetation changes were all 21% of the MCP. Lacunae greater than this
750 HOMERANGEANALYSISWITH GIS Ostn)et ul. J. Wildl. Manage. 63(2):1999
Fig. 1. Creation of digitized polygon (Geographic InformationSystem) estimator for Group €2. Figure 1A shows all day-range paths of Group €2. In Figure lB, all day-range paths have been widened to 20 m, and a minimum convex polygon placed over the resulting polygon. Figure 1C shows the digitized polygon after lacunae of >I% of the minimum convex polygon have been incorporatedinto the polygon.
size were excluded from the area calculations of the DP, while lacunae <I% were included as part of the DP (Fig. 1C).
We chose 20 m as the line width (and a cell size of 20 x 20 m for GC analyses) because of the accuracy of the location points (10 m in any direction) and the mean spread of the groups (11.4 m, range = 2-153). We used mean spread rather than the meaan or mode because there was no significant (P < 0.01) skewness in the spread data, and the standard errors of the mean were low (<1.5 in all cases).
To examine the sensitivity of this method to variation in line width and size of lacunae to be excluded, we created DPs for the data from 4 randomly selected groups (Cl, Tla, T3, T2a), using lo-, 20-, 30-, 40-, 50-, 75-, and 100-m line widths. The relation between line width and polygon size was examined for each of the 4 sets of polygons via a linear regression. We also cal-culated the number of lacunae within the &f-ferent polygons. Because these data were not normally distributed, we used Spearman's rank correlation to investigate the relation between line width and number of lacunae. Because the DP method is also likely sensitive to sample size, we calculated size of the DP by using cu-mulative datasets from 4 groups. For this anal-ysis, we used groups that had been studied for 21 year and had lived in their ranges for >I year (Cl , C2, E l , E2). Each dataset contained 4 day-range paths (each path consisted of approx 48 points). We sequentially added data-sets to determine whether the cumulative size
estimate and number of lacunae of the polygon approached an asymptote.
Comparisons of Methods Differences in size estimates among proce-
dures were compared via a repeated-measures analysis of variance (ANOVA). The data were blocked by group, and the different methods constituted the repeated-measures treatment (Statsoft 1995). We used Tukey's HSD test to make post hoc comparisons among methods (Statsoft 1995). The strength of association be-tween afferent estimators was tested with Pear-son's product-moment correlation. However, because size estimates would be expected to vary with sample size, only group ranges studed for >1year were included in the analysis.
To examine some of the ecological implica-tions of using the different methods, we com-pared the percent home range overlap between Groups C1 and C2, and we used different es-timators to test for differences in home range size before and after translocation for Groups T1 and T2. Only C1 and C2 lived in adjacent home ranges with no intervening groups, so our overlap analysis was confined to these 2 groups. We tested and compared the significance of translocation effects on home range size via a paired t-test. We standardized the number of locations on which estimators were based by us-ing a 3-month subset of data from Groups T l a and T2a in CBWS, which corresponded to the same time period these groups were followed in CBS. The test was repeated for all estimators.

J. Wildl. Manage. 63(2):1999 HOMERANGEANALYSISWITH GIs Ostro et nl. 751
LlNE WIDTH (m)
LlNE WIDTH (m)
Fig. 2. Effect of line width on (A) digitized polygon size esti-mates; and (B) number of lacunae for Groups Tla,C1,T3, and T2a.
RESULTS Lie collected 384 location points (8day-range
paths) for each group studed prior to translo-cation: 2,300-2,700 points (48 day-range paths) for each group studied from May 1994 to May 1995. The data were highly autocorrelated (mean t2/r2= 0.22, range = 0.002-1.1). Group size averaged 5.6 + 1.0 (f t SE) indwiduals.
Parameters of the Digitized Polygon The area of the DPs increased with line
width for all polygon sets (T2: F1,? = 387.79, r2 = 0.99, P < 0.001;C1: F , , = 518.71, r2 = 0.99, P < 0.001; T3: F1,; = 125.13, 7" = 0.96, P < 0.001; T1: F , , = 37.09, 7" = 0.88, P < 0.002). The average increase was 0.2 ha (range = 0.07-0.36) for every increase of 1 m in line width, which was a mean increase of 1.3% with a 20-m DP (Fig. 2). 111 each case, the number of lacunae decreased with increasing line width (r > 0.99, P < 0.001; Fig. 2). At each line width, the majorit?i of lacunae were <1% of the MCP used for their assessment. Lacunae usually
NUMBER OF DAY-RANGE PATHS
NUMBER OF DAY-RANGE PATHS Fig. 3. Effect of sample size on (A) digitized polygon size estimates; and (B) number of lacunae for Groups C1,C2,El , and €2.
summed to <13% of the area of the DPs, with the exception of the lacunae in a 10-m DP. which summed to 27%.
The DP size for 3 of the 4 groups sampled approached an asymptote after 6-9 months of data were entered (Fig. 3). The number of la-cunae in the polygons of these groups peaked and then began to decline as the polygon size approached the asymptote. The cumulative size estimates of the fourth group (E2) continued to increase even after a full year of data collection.
Comparison of Methods Estimates of home range size were positively
correlated for all methods (6 2 0.86, P < 0.001). As home range size increased, however, variation in size of the different estimates also increased (F l , s = 95.53. + = 0.92, P < 0.001). There were differences in the estimates of home range size among the methods = 6.93, P < 0.001). Post hoc comparisons did not show significant differences between DP and HM or GC methods, although GC estimates were consistently smaller (by an average of 8%) than DP estimates (Table 1).The AK (60%) and
752 HO\IE K 4 \ 6 E AUALISIS\ ~ I T HCIS Ostro et a1 J \Vildl Manage 63(2) 1999
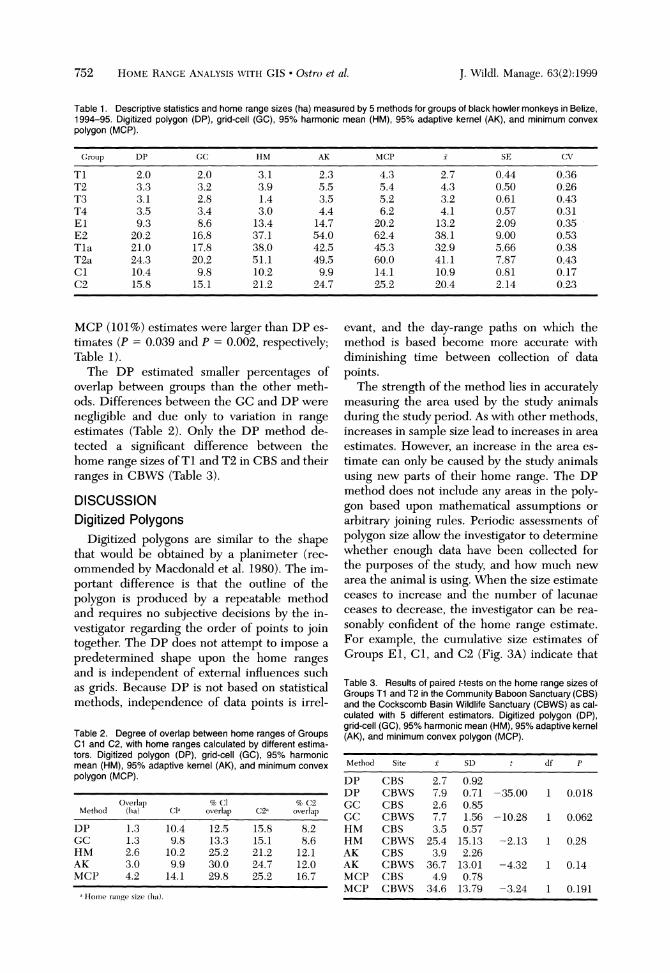
Table 1. Descriptive statistics and home range sizes (ha) measured by 5 methods for groups of black howler monkeys in Belize, 1994-95. Digitized polygon (DP), grid-cell (GC), 95% harmonic mean (HM), 95% adaptive kernel (AK), and minimum convex polygon (MCP).
T1 T2 TO T4 E l E2 Tla T2a C1 C2
MCP (101%) estimates were larger than DP es-timdes (P = 0.039 and P = 0.002, respectively; Table 1).
The DP estimated smaller percentages of overlap between groups than the other meth-ods. Differences between the GC and DP were negligible and due only to variation in range estimates (Table 2). Only the DP method de-tected a significant difference between the home range sizes of T l and T2 in CBS and their ranges in CB\VS (Table 3).
DISCUSSION Digitized Polygons
Digitized polygons are similar to the shape that would be obtained by a planimeter (rec-ommended by Macdonald et al. 1980).The im-portant difference is that the outline of the polygon is produced by a repeatable method and requires no subjective decisions by the in-vestigator regarding the order of points to join together. The DP does not attempt to impose a predetermined shape upon the home ranges and is independent of external influences such as grids. Because DP is not based on statistical methods, independence of data points is irrel-
Table 2. Degree of overlap between home ranges of Groups C1 and C2, with home ranges calculated by different estima-tors. Digitized polygon (DP), grid-cell (GC), 95% harmonic mean (HM), 95% adaptive kernel (AK), and minimum convex polygon (MCP).
evant, and the day-range paths on which the method is based become more accurate with diminishing time between collection of data points.
The strength of the method lies in accurately measuring the area used by the study animals during the study period. As with other methods, increases in sample size lead to increases in area estimates. However, an increase in the area es-timate can only be caused by the study animals using new parts of their home range. The DP method does not include any areas in the poly-gon based upon mathematical assumptions or arbitrary joining rules. Periodic assessments of polygon size allow the investigator to determine whether enough data have been collected for the purposes of the study, and how much new area the animal is using. When the size estimate ceases to increase and the number of lacunae ceases to decrease, the investigator can be rea-sonably confident of the home range estimate. For example, the cumulative size estimates of Groups E l , C1, and C2 (Fig. 3A) indicate that
Table 3. Results of paired f-tests on the home range sizes of Groups T I and T2 in the Community Baboon Sanctuary (CBS) and the Cockscomb Basin Wildlife Sanctuary (CBWS) as cal-culated with 5 different estimators. Digitized polygon (DP), grid-cell (GC),95% harmonic mean (HM), 95% adaptive kernel (AK), and minimum convex polygon (MCP).
DP DP c:c GC H11 Hbl AK AK MCP hlCP
CBS CBWS CBS CBWS CBS CBWS CBS CB\YS CBS CBWS

J. Wildl. Manage. 63(2):1999 HOMERANGEAN.'ILYSIS\YITII (;IS Octtr) et (11. 753
enough data were collected to determine the yearly home range of these groups, unlike .E2 whose home range size was still increasing after a year of data collection.
Both width of the day-range path and size of lacunae to exclude are elements of subjectivity in the DP method. Digitized polygons are very sensitive to variation in path width, which should be based upon biological information collected by the investigator during the study. 15ihilewe used mean group spread to determine path width, this parameter could be increased to include the area visually surveyed by the study animals, as suggested by Struhsaker (1975).
If researchers rely on coordinates rather than presence-absence within a predefined grid, the path widths and lacunae of DPs can be adjusted to the size and spread of the group, even if it changes over time. Group size and spread were small in this study, but large groups of animals can occupy a considerable area, and even spe-cies with small group sizes can have large group spreads (e.g., chimpanzees [Pan troglodytes]. Glliglieri 1984; patas monkeys [Erythrocebus patas], Chism and Rowell 1988).Digitized poly-gons can describe the ranging pattern of any group at an appropriate scale.
The decision about the size of lacunae to ex-clude will always be arbitrary but can be based upon the knowledge and expertise of the inves-tigator. Upon examination of the raw DPs (Fig. lB), we were able to determine which lacunae were avoided by the groups, and we generally could identify factors that accounted for their nonuse. 1Ve were then able to identify exclusion criteria for lacunae. In our case, lacunae 5 1 % of the MCP were small enough to be biologi-cally insignificant to the groups and added a rel-atively small area to the polygon.
Comparison of Methods The strong correlation among the techniques
suggests any of these methods could be used to determine the relativc size of home ranges. However, the correlation is mainly due to the large range of home range sizes analyzed, and differences among estimates are not always con-sistent in their magnitude. By all estimates, the home ranges of T1 and T2 increased by more than 250% followirig their translocation to CBWS. However, only the DP estimator de-tected significant differences between area used at the 2 sites. This result is likely due to the low
variation in DP estimates at CBWS compared with that of other estimators.
Probabilistic methods appear to be less useful than the DP method for determining home range size with these data. To satis@ the as-sunlption of statistical independence, 90% of the data points were eliminated from consid-eration, and there was a large degree of both relative and absolute variation in size estimates. Both AK and HM methods generated discon-nected polygons and incorporated large areas not used by the monkeys, which led to larger home range estimates than those given 1)y the DP method. One of the strengths of these methods is they can be used to determine core areas and patterns of usage frequencies. By overlaying the day-range paths on a daily or monthly basis, these can be calctilated via the DP method.
If the grid cell is the same width as the DP buffer and day-range paths are used for both analyses, the difference in the estimates given by the 2 methods is not significant. However, the lack of a dfference between the 2 methods is an artifact of the grid size used in this study. Grid size is rarely based upon biological infor-mation such as gronp spread, and clay-range paths are almost never used in grid analyses. Grid size is usually chosen in advance of the study and may be dctated by external factors such as trails or marker locations. Estimates vary with the size and placement of the grid, which cannot be changed after data collection. This variation may be negligible w<than appro-priately slnall cell size but increases with in-creasing grid size (Kool arid Croft 1992).
Ecological Implications Ecological measures such as population den-
sity and carrying capacity are often based upon home range size. Percent overlap between home ranges may he used to determine the spacing systems and territoriality of species (Sekulic 1982, Cheney 1987, Lott 1991).Here, home range estimates varied by as much as 300% (Table I), which suggests lnethods may not give equally appropriate estimates for the determination of home range size with the ty-pe of data used in this study. Methods that include areas within a home range based upon mathe-matical niles rather than biological information arc likely to ignore subtle topographic or social boundaries between home ranges arid overes-timate home range overlap. Overloohng these

754 HOMERANGEASALYSIS\\'ITH GIS Ostn) et (11. J . \liildl. Manage. 63(2):1999
boundaries may lead to the mischaracterization of a species' spacing system. Given our defini-tion of home range size, if day-range path data are available, the DP method may give the most accurate estimate.
An advantage of the DP method is that DPs are developed with a GIs, and the analytical techniaues-of GIs can be used to examine in-fluences on the home ranges of the study or-ganisms. The DP method can pinpoint areas avoided by study organisms and allow additional . -types of analyses such as the influence of biotic and abiotic features on the movements of the study groups (Ostro 1998).Using GIs,we could determine that, in CBWS, Groups Tla, T2a, E l , and E2 selected habitat close to rivers and streams (Ostro 1998). If behavioral data are col-lected with accompanying coordinates, the in-fluence of both geographic and intergroup in-teractions on activity and behavioral patterns can be investigated.
ACKNOWLEDGMENTS We thank E. MacFadzean, 0. MacFadzean,
B. Thompson, F. Thompson, \V. Belisle, and S. Flowers for their assistance and permission to work on their land. We also thank the Belize Audubon Society and people of St. Paul's Bank for their help and friendship throughout this study. The assistance of W. Shoh, E. Sho, E. Pop, M. Teisch, M. Robertshaw, E. N. Ostro, and the wardens of the Cockscomb Basin Wild-life Sanctuary was invaluable. J. Gibbs, J. Wehr, L. A. Isbell, E. Merrill, D. Berteaux, C. P. Yeag-
u
er, and an anonymous reviewer provided advice and comments on this study. The research was partially funded by The Wildlife Conservation Society, and their assistance is gratefully ac-knowledged. This paper is contribution 185 to the Louis Calder Biological Station.
LITERATURE CITED CHENEY,D. L. 1987. Interactions and relationships
between groups. Pages 267-281 in B. B. Smuts. D. L. Cheney, K. M.Seyfarth, R. \V. \$'rangham, and T. T. Struhsaker, editors. Primate societies. University of Chicago Press, Chicago. Illinois, USA.
CHISMJ., AND T. E. ROLVELI,.1988. The natural his-tory of patas monkeys. Pages 412438 in A. Gau-tier-Hion, F. Bourliere, J-P. Gautier, and J. King-don, editors. A primate radiation: evolut iona~bi-olog. of the African guenons. Cambridge Uni-versity Press, Cambridge, New York, USA.
DE LA TORRE,S., F. CAMPOS,A N D T. DE \'RIES. 1995. Home range and birth seasonality of Sagirirlt~sni-
gricollis graellsi in Ecuadorian Amazonia. Amer-ican Journal of Primatology 37:39-56.
DIXON,K. R., ASD J. -4. CHAPIIAN.1980. Ilarnionic mean measure of aninla1 actixity areas. Ecology 61:1040-1044.
EASTMAS,J. K. 1995. IDKISI. \'ersion 1.0. The ID-RISI Project. Clark Labs for Cartographic Tech-nology and Geograpliic Analysis, Clark University Worcester, Slassachusetts, USA.
FEDIGAN,L. XI.. L. F E D I C , . ~ ~ ,C. CHAPMAN,4x13K. GLASDER.1988. Spider monkey home ranges: a conlparison of radio telemetry and direct obser-vation. American Journal of Primatology 16:19-nr\AY.
GHIGI~IERI,hl. P. 1984. Feeding ecology and sociality of chimpanzees in Kibale Forest, Uganda. Pages 161-194 in P. S. Rodman and J . G. H. Cant, ed-itors. Adaptations for foraging in nonhuman pri-mates. Columbia University Press, Yew York, New York, USA.
GOLDINGAY,R. L., A N D R. P. KAVANAGH. 1993. Home range estimates and habitat of the yellow-bellied glider (Petuurus uust) at LVaratah Creek, New South Wales. Wildlife Research 20:387-404.
HARRIS,S., M! J. CRESSFVELL.P. J. FORDE,LV. J. TRE-\VHELL.A, T. WOOLLARD,A N D S. WRAY. 1990. Home range analysis nsing radio-tracking data-a review of problems and techniques particularly as applied to the study of mammals. Mammal Ke-view 20:97-123.
ISBELL,L. A. 1983. Daily ranging behavior of red co-lobns (Colohu,~hadius tephroscela) in Kibale Forest, Uganda. Folia Primatologica 41:3449.
, D. L. CHENEY,A N D K. M. SEYFARTH.1990. Costs and benefits of home range shifts among vervet monkeys (Cercopitlzeczrs c~ethiops)in Amo-boseli National Park, Kenya. Behavioral Ecology and Sociobiology 27:351-3.58.
KEN~YAR~) ,K., editor. 1987. \;17ildlife radio tagging. Academic Press, London, United Kingdom.
KIE, J. 6..J. A. BALD\VIS,AND C. J. EVANS.1996. CALHOME: a program for estimating animal home ranges. Wildlife Society Bulletin 24:342-344.
KOOL,K. M., AND D. B. CROFT.1992. Estimators for home range areas of arboreal colobine monkeys. Folia Primatologica 58:210-214.
KOONTZ,F. \V., K. HOR~VICH,E. SAQUI.H. SAQUI, K. GLANDER.C. KOONTZ,A N D \v. '~'.WESTHO>~. 1994. Reintroduction of black howler monkeys (Alouuttupigi-a) into the Cockscomb Basin Wild-life Sanctua~y,Belize. Pages 104-111 it1 Ameri-can Zoo and Aquarium Association annual con-ference proceedings. American Zoo and Aquari-unl Association, Bethesda, Maryland, USA.
L o n , D. F. 1991. Intraspecific variation in the social systems of wild vertebrates. Cambridge Univer-sity Press, Cambridge, United Kingdom.
MACIIONAI,D,D. W., F. G. HALL,.AND N. 6.HOUGH. 1980. The evaluation of home range size and con-figuration using radio tracking data. Pages 405-422 ill C. J. Amlaner, Jr. and D , \I< Macdonald, editors. '4 handbook on biotelemetry and radio tracking. Pergamon Press. Oxford, United King-dom.
OLUPOT,\V., C. A. CHAPMAN,C. H. BRO\\.N,AWD P.
J. Wildl. Manage. 63(2):1999 HOMERANGEANALYSIS WITH GIs Ostro et al. 755
M. WASER.1994. Mangabey (Cercocebus ulbi-gena) population density, group size, and ranging: a twenty-year comparison. American Journal of Primatology 32:197-205.
OSTRO,L. E. T. 1998. The spatial ecology of trans-located black howler monkeys Alouatta pigra in Belize. Dissertation, Fordham University Bronx, New York, USA.
, S. C. SILVER,F. 1%'. KOONTZ,T. P. YOUNG, .4ND R. H. HORWICH.1999. Ranging behavior of translocated and established groups of black howler monkeys Alouatta pigra in Belize, Central America. Biological Conservation 87:181-190.
REYNOLDS,T. D., AND J. W. LAC'NDRE.1990. Time iritervals for estimating pronghorn and coyote home ranges and daily movements. Journal of Wildlife Management 54:31&322.
SCHOENER,T. W. 1980. An enlpirically based estimate for home range. Theoretical Population B i o l o ~ 20:28l-325.
SEKCLIC,R. 1982. Daily and seasonal patterns of roar-ing and spacing in four red howler Aloziatta sen-icu1u.s troops. Folia Primatologica 39:2248.
SILVER,S. C . 1997. The feeding ecology of translo-cated howler monkeys (Aluuatta pigra) in Belize. Dissertation, Fordham University, Bronx, Kew York, USA.
STATSOFT.1995. STATISTICAfor Windows. Statsoft, Ttilsa, Oklahoma, US.4.
STONER,K. E. 1996, Habitat selection and seasonal patterns of activity and foraging of mantled howl-ing monkeys (illouatta palliata) in northeastern
Costa Rica. International Journal of Primatology 17:l-31.
STRUHSAKER,T. T. 1975. The red colobus monkey. University of Chicago Press. Chicago, Illinois, USA.
SWIHART,R. K., .4ND N. A. SLADE.1985. Influence of sampling interval on estimates of home range size. Journal of Wildlife Management 49:1019-1025.
VOIGHT,I). R., AND R. K. TINLINE.1980. Strategies for analyzing radio-tracking data. Pages 387404 in C. J. Amlaner, Jr. and D. W. Macdonald, e&-tors. A handbook on biotelemetry and radio tracking. Pergamon Press, Oxford, United King-dom.
WHITE,G. C., AND R. A. GAR ROT^. 1990. Analysis of wildlife radio-tracking data. Academic Press, San Diego, California, USA.
\vORTON, B. J. 1987. A review of models of home range for animal movement. Ecological Model-ling 38377-298.
. 1989. Kernel methods for estimating the uti-lization distribution in home range studies. Ecol-ogy 70:164-168.
ZHANG,S., 1995. Activity and rangng patterns in re-lation to fruit utilization by brown capuchins (Ce-bus npella) in French Guiana. International Jour-nal of Primatology 16:489-,507.
Recezoed 8 J a n u a y 1998 Accepted 20 August 1998 Assoczate Eclztor Memll