a fret-based assay for characterization of alternative splicing
TRANSCRIPT

Published online 26 June 2009 Nucleic Acids Research, 2009, Vol. 37, No. 17 e116doi:10.1093/nar/gkp551
A FRET-based assay for characterization ofalternative splicing events using peptide nucleicacid fluorescence in situ hybridizationAna M. Blanco1, Laura Rausell1, Begona Aguado2, Manuel Perez-Alonso1 and
Ruben Artero3,*
1Sistemas Genomicos S.L., Parque Tecnologico de Valencia, Ronda G. Marconi 6, E-46980 Paterna,2Centro de Biologıa Molecular Severo Ochoa (CBMSO – CSIC UAM), Cantoblanco 28049 Madrid and3Department of Genetics, University of Valencia, Dr. Moliner, 50, E-46100 Burjassot, Spain
Received April 21, 2009; Revised June 10, 2009; Accepted June 11, 2009
ABSTRACT
We describe a quantitative method for detectingRNA alternative splicing variants that combinesin situ hybridization of fluorescently labeled peptidenucleic acid (PNA) probes with confocal microscopyForster resonance energy transfer (FRET). The useof PNA probes complementary to sequences flank-ing a given splice junction allows to specificallyquantify, within the cell, the RNA isoform generatingsuch splice junction by FRET measure. As a proof ofconcept we analyzed two alternative splicing eventsoriginating from lymphocyte antigen 6 (LY6) com-plex, locus G5B (LY6G5B) pre-mRNA. These arecharacterized by the removal of the first intron(Fully Spliced Isoform, FSI) or by retention of suchintron (Intron-Retained Isoform, IRI). The use of PNAprobe pairs labeled with donor (Cy3) and acceptor(Cy5) fluorophores, suitable to FRET, flankingFSI and IRI specific splice junctions specificallydetected both mRNA isoforms in HeLa cells. Wehave observed that the method works efficientlywith probes 5–11 nt apart. The data supports thatthis FRET-based PNA fluorescence in situ hybridiza-tion (FP–FISH) method offers a conceptually newapproach for characterizing at the subcellular levelnot only splice variant isoform structure, locationand dynamics but also potentially a wide variety ofclose range RNA–RNA interactions.
INTRODUCTION
Recognition of the various roles played by RNA-splicingvariants within the cell is creating a demand for better
methods for detecting and characterizing these RNA spe-cies in situ. Direct observation of mRNA-splicing variantsin cells can provide much valuable information on thespatial distribution and compartmentalization of RNAwithin the cell as well as the potential significance of local-ization with respect to RNA processing, intranuclear turn-over, protein localization and transport to the cytoplasm,complementing in vitro biochemical methods (1). Indeed,localization of transcripts is an extremely efficient way totarget encoded proteins to individual subcellular compart-ments or to specific regions of a cell, making it an impor-tant post-transcriptional level of gene regulation (2–4).Some reports have described the in situ detection of spe-cific splicing variants in Drosophila embryos (5), striatecortex sections (6) and microdissected eye tissue (7). Anapproach taken by several works involves using two kindsof fluorescent DNA oligonucleotides, each labeled with adifferent fluorescence molecule, having a sequence comple-mentary to an adjacent nucleic acid sequence of the targetmRNA in cells, to detect formed hybrid using Forsterresonance energy transfer (FRET) (8,9). FRET is a pro-cess through which an excited fluorophore (donor) trans-fers its energy to a nearby light-absorbing molecule(acceptor). FRET is dependent on the proximity of bothmolecules, which must be within a range of 1–10 nm ofeach other, making this technique a unique tool to quan-titatively analyze the molecular interactions with spatialand temporal resolution (10). The use of DNA oligonu-cleotide probes suffers two important limitations, in par-ticular probe length and RNase H activation (11,12). Oneway to address these limitations is to use artificial, high-affinity analogues of DNA, such as peptide nucleic acids(PNAs). The neutral backbone of PNAs allows them tobind to DNA or RNA under low ionic strength condi-tions, which discourage reannealing of complementarygenomic strands. Because PNA forms highly stable
*To whom correspondence should be addressed. Tel: +34 96 3543005; Fax: +34 96 3543029; Email: [email protected] address:Manuel Perez-Alonso, Department of Genetics, University of Valencia, Dr. Moliner, 50, E-46100 Burjassot, Spain
� 2009 The Author(s)This is an Open Access article distributed under the terms of the Creative Commons Attribution Non-Commercial License (http://creativecommons.org/licenses/by-nc/2.0/uk/) which permits unrestricted non-commercial use, distribution, and reproduction in any medium, provided the original work is properly cited.
Downloaded from https://academic.oup.com/nar/article-abstract/37/17/e116/1077937by gueston 06 April 2018
duplexes with RNA, the length of the hybridizationprobes can be decreased, and RNase H fails to recognizethe unnatural structure of PNA–RNA duplex (13,14).Additional benefits of using fluorescent PNAs in situhybridization are lower background signals, mild washingprocedure and unlimited stability of the probe mixture(15). The combination of PNA probes and FRET hasbeen used successfully for the detection of unspliced andspliced versions of RPS14A mRNA by in vitro transcrip-tion techniques (16), as well as for the direct and rapiddetection and quantification of GNAS mutant alleles infibrous dysplasia/McCune–Albright syndrome (17).In this study we have set out a method to detect RNA-
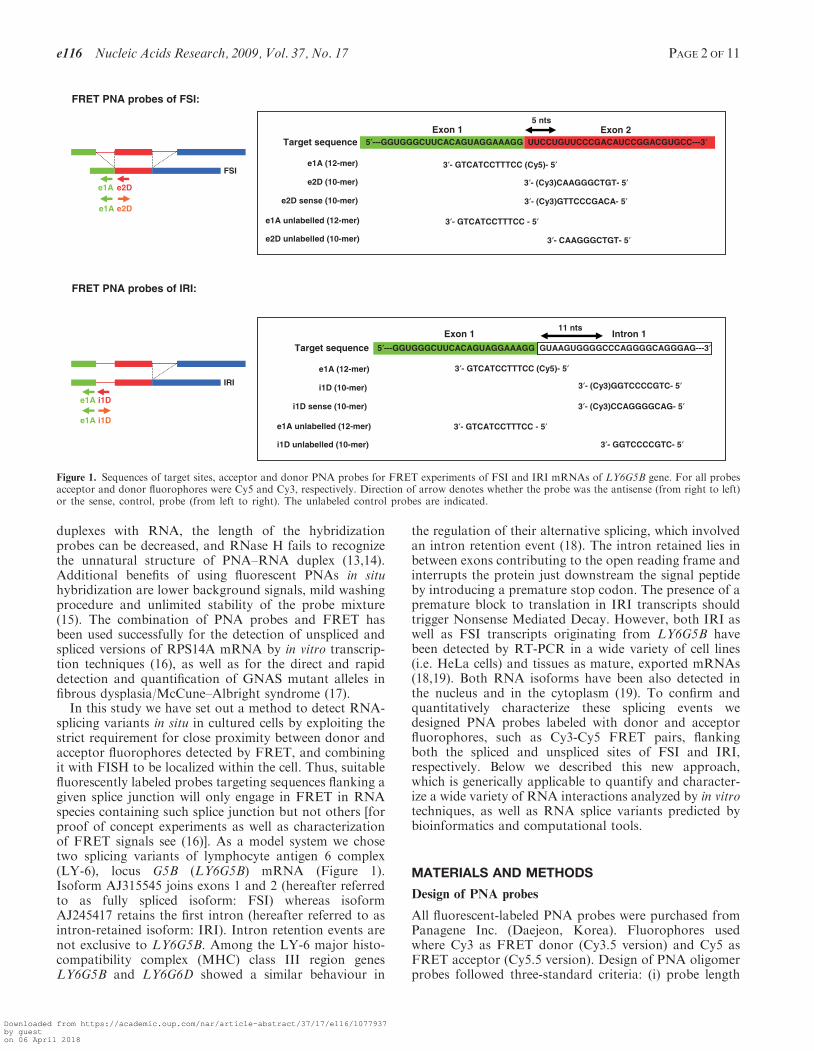
splicing variants in situ in cultured cells by exploiting thestrict requirement for close proximity between donor andacceptor fluorophores detected by FRET, and combiningit with FISH to be localized within the cell. Thus, suitablefluorescently labeled probes targeting sequences flanking agiven splice junction will only engage in FRET in RNAspecies containing such splice junction but not others [forproof of concept experiments as well as characterizationof FRET signals see (16)]. As a model system we chosetwo splicing variants of lymphocyte antigen 6 complex(LY-6), locus G5B (LY6G5B) mRNA (Figure 1).Isoform AJ315545 joins exons 1 and 2 (hereafter referredto as fully spliced isoform: FSI) whereas isoformAJ245417 retains the first intron (hereafter referred to asintron-retained isoform: IRI). Intron retention events arenot exclusive to LY6G5B. Among the LY-6 major histo-compatibility complex (MHC) class III region genesLY6G5B and LY6G6D showed a similar behaviour in
the regulation of their alternative splicing, which involvedan intron retention event (18). The intron retained lies inbetween exons contributing to the open reading frame andinterrupts the protein just downstream the signal peptideby introducing a premature stop codon. The presence of apremature block to translation in IRI transcripts shouldtrigger Nonsense Mediated Decay. However, both IRI aswell as FSI transcripts originating from LY6G5B havebeen detected by RT-PCR in a wide variety of cell lines(i.e. HeLa cells) and tissues as mature, exported mRNAs(18,19). Both RNA isoforms have been also detected inthe nucleus and in the cytoplasm (19). To confirm andquantitatively characterize these splicing events wedesigned PNA probes labeled with donor and acceptorfluorophores, such as Cy3-Cy5 FRET pairs, flankingboth the spliced and unspliced sites of FSI and IRI,respectively. Below we described this new approach,which is generically applicable to quantify and character-ize a wide variety of RNA interactions analyzed by in vitrotechniques, as well as RNA splice variants predicted bybioinformatics and computational tools.
MATERIALS AND METHODS
Design of PNA probes
All fluorescent-labeled PNA probes were purchased fromPanagene Inc. (Daejeon, Korea). Fluorophores usedwhere Cy3 as FRET donor (Cy3.5 version) and Cy5 asFRET acceptor (Cy5.5 version). Design of PNA oligomerprobes followed three-standard criteria: (i) probe length
FRET PNA probes of FSI:
FRET PNA probes of IRI:
e2D
e1A e2D
e1A
FSI
5′---GGUGGGCUUCACAGUAGGAAAGG UUCCUGUUCCCGACAUCCGGACGUGCC---3′Exon 1 Exon 2
Target sequence
e1A (12-mer) 3′- GTCATCCTTTCC (Cy5)- 5′
e2D (10-mer) 3′- (Cy3)CAAGGGCTGT- 5′
e2D sense (10-mer) 3′- (Cy3)GTTCCCGACA- 5′
e2D unlabelled (10-mer) 3′- CAAGGGCTGT- 5′
5 nts
e1A unlabelled (12-mer) 3′- GTCATCCTTTCC - 5′
5′---GGUGGGCUUCACAGUAGGAAAGG GUAAGUGGGGCCCAGGGGCAGGGAG---3′
1nortnI1noxE
3′- GTCATCCTTTCC (Cy5)- 5′
3′- (Cy3)GGTCCCCGTC- 5′
11 nts
3′- GTCATCCTTTCC - 5′
3′- (Cy3)CCAGGGGCAG- 5′
3′- GGTCCCCGTC- 5′
Target sequence
e1A (12-mer)
i1D (10-mer)
i1D sense (10-mer)
i1D unlabelled (10-mer)
e1A unlabelled (12-mer)
IRI
i1D
e1A i1D
e1A
Figure 1. Sequences of target sites, acceptor and donor PNA probes for FRET experiments of FSI and IRI mRNAs of LY6G5B gene. For all probesacceptor and donor fluorophores were Cy5 and Cy3, respectively. Direction of arrow denotes whether the probe was the antisense (from right to left)or the sense, control, probe (from left to right). The unlabeled control probes are indicated.
e116 Nucleic Acids Research, 2009, Vol. 37, No. 17 PAGE 2 OF 11
Downloaded from https://academic.oup.com/nar/article-abstract/37/17/e116/1077937by gueston 06 April 2018

between 10 and 18-mer, (ii) purinic nucleotides belowseven in any 10-mer stretch, (iii) no-self complementarysequences. PNA probes of 10–12-mer were designed tobe complementary to sequences flanking splice junctionscharacteristic of splice variants AJ315545 (FSI) andAJ245417 (IRI). Target sequences, acceptor (Cy5-labeled12-mer PNA) and donor (Cy3-labeled 10-mer PNA)probes are given in Figure 1.
Cell culture
HeLa human epithelial ovarian carcinoma cells weregrown at 378C in a humidified atmosphere of 5% CO2.Cells were maintained by regular passage in Dulbecco’smodified Eagle’s medium (DMEM; Gibco, Invitrogen,France). This medium was supplemented with 10% heat-inactivated fetal bovine serum (FBS), 2mM L-glutamine,100U/ml penicillin, 50U/ml streptomycin, 0.1% ofsodium bicarbonate 7.5% solution and sodium pyruvate100mM (Gibco).
PNA fluorescence in situ hybridization (FISH)
HeLa cells were grown on 16-mm glass coverslips for 24 hin complete DMEM medium, and then washed with1� PBS without Ca2+ or Mg2+ (Gibco). Because no pro-tocol had been so far described for cell FISH using PNAprobes, cells were initially processed according to threepre-existing FISH protocols to find the best hybridizationconditions. The first protocol assayed was a modified pro-tocol introduced by Van de Corput and colleagues (20).Briefly, cells were fixed in 4% formaldehyde, 5% aceticacid in 0.9% NaCl, and permeabilized with 70% ethanolovernight at�208C. After permeabilization, cells were pre-treated with 0.002% pepsin in 0.01N HCl for 4min at378C, post-fixed with 3% formaldehyde, and dehydratedin a graded series of ethanol (70%, 90% and 100%), 5mineach step, at room temperature. In situ hybridizations wereperformed in air-dried cells by hybridizing overnight at378C in Hybridization Buffer (Vysis, Abbott Molecular,Pasadena, CA) containing fluorescent-labeled PNAprobes (e1A-Cy5, e2D-Cy3, i1D-Cy3, e2Dsense-Cy3 ori1Dsense-Cy3) and unlabeled probes (e1A, e2D and i1D)at concentrations that ranged 1, 2, 5, 10 and 20 mM in anhumidified chamber (see also Figures 1 and 2). Afterremoving the hybridization solution with 0.1M Tris–HClpH 7.4, 0.15M NaCl and 0.05% Tween 20, cells werewashed twice with 2� SSC (2� Standard Saline Citrate,Gibco) at room temperature and at 378C for three timeseach. Two additional FISH protocols based on the worksby Bonifazi et al. (21) and Rayasam et al. (22) gave incon-sistent results. For FRET experiments we used the mod-ified Van de Corput protocol (20) with combined donorand acceptor PNA probe pairs (e1A-Cy5/e2D-Cy3, e1A-Cy5/i1D-Cy3, e1A-Cy5/e2Dsense-Cy3 and e1A-Cy5/i1Dsense-Cy3). After the final washing step, cells weremounted in antifading medium (Glycerol/PBS). All solu-tions were made in DEPC-treated water.
Combined PNA–FISH and immunofluorescence protocol
HeLa cells were grown on 16-mm glass coverslips for24 h in complete DMEM medium, and then washed with
1� PBS without Ca2+ or Mg2+. The slides were fixed in100% methanol at �208C for 10min. After removing themethanol, the slides were allowed to air dry and werestored overnight at �808C. Cells were washed with PBSand incubated with mouse monoclonal anti-phospho-SC35 Nuclear Speckles antibody (Abcam, Cambridge,UK) for 2 h at 378C, followed by three washes withPBS. After incubation with secondary FITC anti-mouseantibody (Sigma-Aldrich), coverslips were washed againwith PBS, and then processed for PNA–FISH by hybri-dizing with fluorescent PNA probes (e1A-Cy5, e2D-Cy3or i1D-Cy3) at a suitable concentration in PBS at 378Covernight in a humidified chamber. Finally, cells werewashed several times with PBS and mounted with gly-cerol/PBS mixture.
Imaging with confocal FRET microscopy
Confocal images were acquired with a Leica TCS-SP2confocal microscope (Leica Microsystems, HeidelbergGmbH, Germany) at the Central Unit of Research ofUniversity of Valencia. To correct for spectral bleed-through (SBT) and for uncontrolled variations indonor–acceptor concentrations, a combination of donor,FRET and acceptor filter sets was used to isolate andmaximize three specific signals: donor fluorescence, accep-tor fluorescence resulting from FRET and the directlyexcited acceptor fluorescence, respectively. Filter setsused were as follows: the red channel (donor excitation/donor emission=543/575 nm: Cy3), the green/blue chan-nel (acceptor excitation/acceptor emission=633/680 nm:Cy5) and the FRET channel (donor excitation/acceptoremission=543/680 nm: FRET). Three different samples,containing just donor, just acceptor, and both donor andacceptor were examined with each of the three filters.
FRET image data analysis
FRET was measured using the FRET-sensitized emissionWizard of the Leica Confocal Spectrum Express 03 soft-ware package that is used for measuring the FRET effi-ciency. The sensitized emission technique quantifies FRETby measuring the increase in acceptor emission uponenergy transfer from the donor. As described above, thismethod needs reference intensities (donor only and accep-tor only specimens) in order to obtain calibration coeffi-cients to correct for excitation and emission crosstalk,excitation of the acceptor through the excitation wave-length of the donor or the impact of the backgroundsignal. The software used removes both the donor andacceptor SBT problems and corrects the variation in fluor-ophore expression level, calculating FRET efficiency (E) inpercent, based on the formula described by Wouters et al.(23): E=[BFF� (ADEBDC) � (CAECAC)]/CAE, where BFF
is the intensity of fluorescence in FRET channel; ADE isthe intensity in donor emission channel; CAE is the inten-sity in acceptor emission channel; BDC is the donor emis-sion crosstalk ratio, and CAC is the acceptor excitationcrosstalk ratio. The correction factors on the formulaare (ADEBDC), the donor crosstalk correction, and(CAECAC) is the acceptor cross-excitation correction.The method involves measuring the donor (donor
PAGE 3 OF 11 Nucleic Acids Research, 2009, Vol. 37, No. 17 e116
Downloaded from https://academic.oup.com/nar/article-abstract/37/17/e116/1077937by gueston 06 April 2018
excitation only) and the FRET signal, followed by thedetection of the acceptor (acceptor excitation only). Thedonor and acceptor measurements give the correction con-stants for elimination of the excitation and emission cross-talk. Images were sequentially recorded for each of thefollowing three channels. First Channel A (A, ch1), thatis, the excitation with excitation wavelength of donor anddetection with parameter settings of donor (donor chan-nel); Second Channel B (B, ch2), that is, the excitationwith excitation wavelength of donor and detection withparameter settings of acceptor (FRET channel); ThirdChannel C (C, ch3), that is, the excitation with excitationwavelength of acceptor and detection with parameter set-tings of acceptor (acceptor channel). Once appropriateimage sets were obtained, the software package generateda FRET efficiency report in which regions of interest(ROIs) were manually selected from the image. Thebleed-through component in ROIs is evaluated based onthe individual donor and acceptor samples, and was elimi-nated from the FRET data, pixel by pixel, to obtain thetrue (or precision) FRET efficiency signal, that is, themean FRET pixel intensities within each ROI. FRETmeasurements for all ROIs selected are given as themean� SE from a minimum of four independent experi-ments. FRET values in the different conditions assayedwere compared using a Student’s t-test.
RESULTS
FISH in cultured cells using PNA probes requiresa pepsin treatment
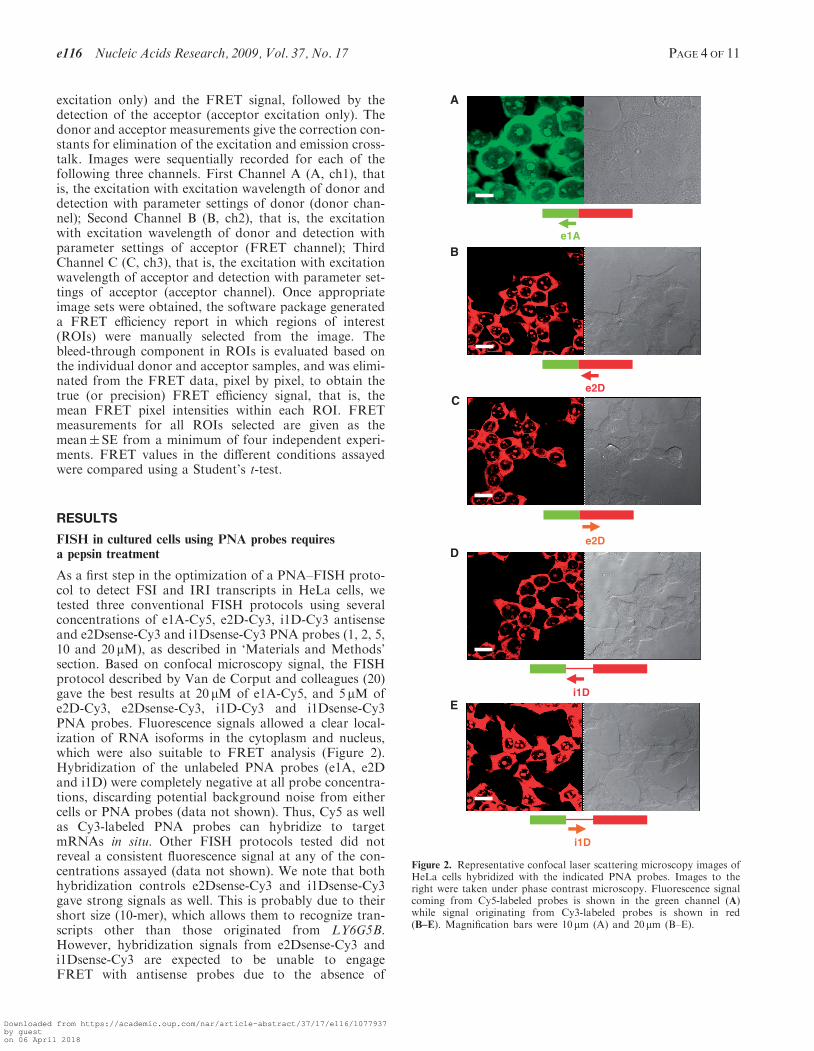
As a first step in the optimization of a PNA–FISH proto-col to detect FSI and IRI transcripts in HeLa cells, wetested three conventional FISH protocols using severalconcentrations of e1A-Cy5, e2D-Cy3, i1D-Cy3 antisenseand e2Dsense-Cy3 and i1Dsense-Cy3 PNA probes (1, 2, 5,10 and 20 mM), as described in ‘Materials and Methods’section. Based on confocal microscopy signal, the FISHprotocol described by Van de Corput and colleagues (20)gave the best results at 20 mM of e1A-Cy5, and 5 mM ofe2D-Cy3, e2Dsense-Cy3, i1D-Cy3 and i1Dsense-Cy3PNA probes. Fluorescence signals allowed a clear local-ization of RNA isoforms in the cytoplasm and nucleus,which were also suitable to FRET analysis (Figure 2).Hybridization of the unlabeled PNA probes (e1A, e2Dand i1D) were completely negative at all probe concentra-tions, discarding potential background noise from eithercells or PNA probes (data not shown). Thus, Cy5 as wellas Cy3-labeled PNA probes can hybridize to targetmRNAs in situ. Other FISH protocols tested did notreveal a consistent fluorescence signal at any of the con-centrations assayed (data not shown). We note that bothhybridization controls e2Dsense-Cy3 and i1Dsense-Cy3gave strong signals as well. This is probably due to theirshort size (10-mer), which allows them to recognize tran-scripts other than those originated from LY6G5B.However, hybridization signals from e2Dsense-Cy3 andi1Dsense-Cy3 are expected to be unable to engageFRET with antisense probes due to the absence of
A
B
C
E
D
e1A
e2D
e2D
i1D
i1D
Figure 2. Representative confocal laser scattering microscopy images ofHeLa cells hybridized with the indicated PNA probes. Images to theright were taken under phase contrast microscopy. Fluorescence signalcoming from Cy5-labeled probes is shown in the green channel (A)while signal originating from Cy3-labeled probes is shown in red(B–E). Magnification bars were 10 mm (A) and 20 mm (B–E).
e116 Nucleic Acids Research, 2009, Vol. 37, No. 17 PAGE 4 OF 11
Downloaded from https://academic.oup.com/nar/article-abstract/37/17/e116/1077937by gueston 06 April 2018

matching sequences within the LY6G5B transcripts, thusproviding a convenient FRET negative control.
Ly6G5B PNA probes strongly stain the cytoplasm,but also the nucleolar subcompartment
Fluorescence signal originated from e1A-Cy5, e2D-Cy3and i1D-Cy3 PNA probes was detected both in thecytoplasmic and nuclear cellular domains (Figure 2).We observed a patched nuclear signal resembling nuclearspeckles with respect to size, shape and number. Specklesare nuclear bodies enriched in splicing and export factors(24). Alternatively, patched nuclear signal might corre-spond to nucleoli, which has been suggested to participatein unconventional roles, particularly the biogenesis ofRNA-containing cellular machinery components otherthan ribosomes (25). Having optimized the concentrationof PNA probes suitable for FRET analysis, we next exam-ined the intranuclear spatial distribution of the fluorescentPNA signal in HeLa cells. Colocalization of the e1A-Cy5,e2D-Cy3 and i1D-Cy3 hybridization signals with speckleswas investigated by a combination of anti-SC35 antibodystaining (26) with a methanol-based FISH protocol (see‘Materials and Methods’ section) to preserve protein epi-topes (20). Because nucleoli are denser and more refractilethan the nucleoplasm, co-localization of hybridization sig-nals and nucleoli in HeLa cells was assessed by merging
fluorescence and phase contrast images, which revealnucleoli as dark nuclear bodies (27). Fluorescence origi-nated from e1A-Cy5, e2D-Cy3 and i1D-Cy3 was accumu-lated in non-speckle regions (Figure 3; white arrows),detecting a complete absence of colocalization with ananti-SC35 antibody. Unexpectedly, under the transmittedlight, nuclear hybridization fluorescence completely colo-calized with HeLa nucleoli in all cells analyzed (Figure 3).
Fluorescence energy transfer between exonicdonor-acceptor PNA probe pairs
In these experiments Cy5 and Cy3 fluorophores served asthe acceptor-donor pair for FRET. If acceptor (Cy5) anddonor (Cy3) are in close proximity (<10 nm) and in appro-priate relative orientation to each other, excitation of thedonor molecule leads to transfer of energy to the acceptor.This energy transfer results in a decrease in emission fromthe donor and in increase in fluorescence at the emissionwavelength of the acceptor (10,28,29). We performedFRET by imaging sensitized emission based on measuringfluorescence intensities. Detecting sensitized emission istechnically the most straightforward method for measur-ing FRET, but it is also the most complex to analyze.Appropriate filter sets are used to isolate the specific sig-nals from donor and acceptor to carefully correct the con-tamination by spectral bleed-through (SBT) of the
Merged (Cy5-TL)
Merged (Cy3-TL)
Merged (Cy3-TL)
LTCTIF-53CS5yC-A1e Merged (Cy5-FITC)
LTCTIF-53CS3yC-D2e Merged (Cy3-FITC)
LTCTIF-53CS3yC-D1i Merged (Cy3-FITC)
Nuclearspeckles
Nucleolus
A
B
C
Figure 3. LY6G5B PNA probes label the cytoplasm and nucleoli of HeLa cells, but not nuclear speckles. Cells were fixed and subject to FISH andimmunofluorescence using fluorescent PNA probes e1A-Cy5 (A; blue), e2D-Cy3 (B; red) or i1D-Cy3 (C; red), and SC35 monoclonal antibodydetected with a FITC-labeled secondary (SC35-FITC; green in A–C). Nuclear speckles (white arrows) fail to colocalize with the intranuclearhybridization signal in any field studied (shown representative examples in the merged images). Nucleoli appear as darker bodies under phasecontrast transmitted light (TL; black arrows), which correspond to the locations of hybridization signals as shown in the merged images.Magnification bar, 10 mm.
PAGE 5 OF 11 Nucleic Acids Research, 2009, Vol. 37, No. 17 e116
Downloaded from https://academic.oup.com/nar/article-abstract/37/17/e116/1077937by gueston 06 April 2018

detected FRET signal. SBT is contributed by both thedonor emission that is detected in the acceptor (FRET)channel and by direct excitation of the acceptor fluoro-phore at the wavelength used to excite the donor (30,31).Therefore, donor-only and acceptor-only controls wereincluded in the measurements. In fact, we used FRET-sensitized emission Wizard of the Leica ConfocalSpectrum Express 03 software package, that removesboth the donor and acceptor SBT problems and correctsthe variation in fluorophore expression level, calculatingFRET efficiency (E) in percent in the different regions ofinterest (ROIs) selected, as described in ‘Materials andMethods’ section.A strong FRET signal was observed in the cytoplasm
and nucleolus of HeLa cells hybridized with the FSI-specific e1A-Cy5/e2D-Cy3 probe pair (Figure 4A). Aftermanual selection of ROIs, which included cell cytoplasms(ROI 1–9) and background (ROI 10, outside the cell), thesoftware generated a report with FRET values informa-tion, and percent FRET efficiency for each ROI, correct-ing the optical crosstalk and the background effect asreference with Donor Channel A (A, ch1), with FRETChannel B (B, ch2) and Acceptor Channel C (C, ch3).Similar reports were obtained for the cytoplasms of cells,and the FRET efficiency values were used to calculate themean FRET efficiency percentage in the cell cytoplasm(mean� SE: 41.9� 1.39%, n=88). A representativereport of FRET efficiency for the negative control e1A-Cy5/e2Dsense-Cy3 probe pair is shown in Figure 4B,where the FRET efficiency percentage in manuallyselected cytoplasmic ROIs (ROI 1-8 in cytoplasm, whitearrows) is dramatically reduced (n=105, 5.4� 0.3%).FRET efficiency mean of FSI-specific e1A-Cy5/e2D-Cy3
probe pair was significantly higher than negative controlprobe pair e1A-Cy5/e2Dsense-Cy3 in the cytoplasm with astudent’s t-test (Figure 4C, P< 10�6). Values of FRET,FRET efficiency and excitation channels A, B and C forthe ROIs shown in Figure 4 (also for Figures 5–7) areprovided in Supplementary Data.
A similar FRET was detected between FSI-specificdonor acceptor probe pairs (e1A-Cy5/e2D-Cy3) in nucleo-lar ROIs (Figure 5A). After manual selection of ROIs(ROI 1–8 in nucleoli, white arrows), the software gener-ated a report with FRET efficiency values. Nucleolarreports of e1A-Cy5/e2D-Cy3 FRET were obtained, andthe mean� SE FRET efficiency values were 73.7�5.45%, n=27. In contrast, FRET efficiency for the neg-ative probe pair e1A-Cy5/e2Dsense-Cy3 was significantlylower in nucleolar regions (n=39, 0.6� 0.09%) applyinga Student’s t-test (Figure 5, P< 10�4). Taken togetherthese results indicate that FSI RNA locates to the nucleo-lus thus suggesting either an unconventional role fornucleoli in LY6G5B pre-mRNA processing or a role forFSI transcripts in a nucleolar function.
Isoform-specific fluorescence energy transfer
We next performed a similar FRET analysis in HeLacells using the IRI-specific e1A-Cy5/i1D-Cy3 probe pair.In Figure 6A, we show a representative FRET imagesreport of manually selected cytoplasmic ROIs (ROI 1–8in cytoplasm and ROI 9 outside the cell, white arrows).Equivalent e1A-Cy5/i1D-Cy3 FRET reports wereobtained. The percentage FRET efficiency mean�SE ofall ROIs selected was 28.3� 0.78%, n=108, in contrastto the negative FRET probe pair e1A-Cy5/i1Dsense-Cy3in cytoplasmic regions (0.49� 0.21%, n=71), which is
0
20
40
60
80
100
e1Ae2D
FR
ET
Eff
icie
ncy
(%
)
Donor (e2D-Cy3) FRET
0
100
ROI 1
ROI 2
ROI 3
ROI 4
ROI 5
ROI 6
ROI 7
ROI 8
ROI 9
ROI 10
ROI 4
ROI 5 ROI 1
ROI 2
ROI 3ROI 7
ROI 8
ROI 6
0
100
Donor (e2Dsense-Cy3) Acceptor (e1A-Cy5) FRET FRETeff
e2De1A
e2De1A
FSI
CYTOPLASM
*
FRET
A
B
C
CYTOPLASM
Acceptor (e1A-Cy5) FRETeff
e1Ae2Dsense
*p<10–6
Figure 4. FRET between e1A/e2D probe pair detects the LY6G5B transcript FSI in the cytoplam of HeLa cells. Representative laser scanningmicroscope FRET report containing donor-red, acceptor-green, FRET and FRET efficiency images (pseudocolor) from (A) positive e1A-Cy5/e2D-Cy3 and (B) negative e1A-Cy5/e2Dsense-Cy3 FRET combination in HeLa hybridized cells. The color bar represents relative degree of FRETefficiency shown in the pseudocolor images. Values of the different ROIs selected (white arrows) are shown in Supplementary Data (Figure S1Aand B). Magnification bar, 10 mm. (C) Representation of mean� SE of FRET efficiency values of cytoplasmic ROIs from e1A-Cy5/e2D-Cy3 (n=88)and e1A-Cy5/e2Dsense-Cy3 (n=105) in five hybridization experiments. A statistically significant difference was observed between the positive FRETpair e1A-e2D and negative e1A-e2D sense probe combination applying a Student’s t-test.
e116 Nucleic Acids Research, 2009, Vol. 37, No. 17 PAGE 6 OF 11
Downloaded from https://academic.oup.com/nar/article-abstract/37/17/e116/1077937by gueston 06 April 2018

shown in a FRET image report in Figure 6B (ROI 1–7 incytoplasm and ROI 8 outside the cell, white arrows).Mean FRET efficiency values were significantly differentin a Student’s t-test (P< 10�6).
In the analysis of the nucleolar signal, the mean ofFRET efficiency for the e1A-Cy5/i1D-Cy3 probe pair
was 17� 0.75% (n=41), in contrast to 0.7� 0.37%(n=39) of nucleolar ROIs from HeLa cells hybridizedwith the negative control e1A-Cy5/i1Dsense-Cy3 probecombination. A representative laser scanning microscopeFRET report derived from the selection of nucleolarregions of e1A-Cy5/i1D-Cy3 and e1A-Cy5/i1Dsense-Cy3
0
10
20
30
40
50
e1Ai1D
FR
ET
Eff
icie
ncy
(%
)
Donor (i1D-Cy3) FRET
0
100
0
100
Donor (i1sense-Cy3) Acceptor (e1A-Cy5) FRET FRETeff
CYTOPLASM
*
FRET
A
B
C
CYTOPLASM
ROI 1
ROI 2
ROI 3
ROI 4ROI 5
ROI 6 ROI 7 ROI 8
ROI 9
ROI 1
ROI 2ROI 3
ROI 4
ROI 5
ROI 6
ROI 7ROI 8
IRI
i1D
e1A i1D
e1A
Acceptor (e1A-Cy5) FRETeff
e1Ai1Dsense
*p<10–6
Figure 6. FRET between e1A/i1D probe pair detects the LY6G5B transcript IRI in the cytoplasm of HeLa cells. Representative laser scanningmicroscope FRET report containing donor-red, acceptor-green, FRET and FRET efficiency images (pseudocolor) from (A) positive e1A-Cy5/i1D-Cy3 and (B) negative e1A-Cy5/i1Dsense-Cy3 FRET combination in HeLa cells. The color bar represents relative degree of FRET efficiency shown inthe pseudocolor images. Values of the different ROIs selected (white arrows) are shown in Supplementary Data (Figure S2A and B). Magnificationbar, 10 mm. (C) Representation of mean� SE of FRET efficiency values of cytoplasmic ROIs from e1A-Cy5/i1D-Cy3 (n=108) and e1A-Cy5/i1Dsense-Cy3 (n=71) in four hybridization experiments. A statistically significant difference was observed between the positive FRET pair e1A-i1D and negative e1A-i1D sense probe combination applying a Student’s t-test.
Donor (e2D-Cy3) FRET
0
100
0
100
Donor (e2Dsense-Cy3) Acceptor (e1A-Cy5) FRET FRETeff
A
B
C
NUCLEOLUS
ROI 4
ROI 5
ROI 6
ROI 1
ROI 2
ROI 3
ROI 7
ROI 8
ROI 4
ROI 5
ROI 1 ROI 2
ROI 3ROI 7
ROI 6
Acceptor (e1A-Cy5) FRETeff
0
20
40
60
80
100
120
e1Ae2D e1Ae2Dsense
FR
ET
Eff
icie
ncy
(%
)
FSI
NUCLEOLUS
*
e2De1A
e2De1A
FRET
*p<10–4
Figure 5. FRET between e1A/e2D probe pair detects the LY6G5B transcript FSI in the nucleous of HeLa cells. Representative laser scanningmicroscope FRET report containing donor-red, acceptor-green, FRET and FRET efficiency images (pseudocolor) from (A) positive e1A-Cy5/e2D-Cy3 and (B) negative e1A-Cy5/e2Dsense-Cy3 FRET combination in HeLa cells. The color bar represents relative degree of FRET efficiency shown inthe pseudocolor images. Values of the different ROIs selected (white arrows) are shown in Supplementary Data (Figure S1C and D). Magnificationbar, 10 mm. (C) Representation of mean� SE of FRET efficiency values of nucleolar ROIs from e1A-Cy5/e2D-Cy3 (n=27) and e1A-Cy5/e2Dsense-Cy3 (n=39) in four hybridization experiments. A statistically significant difference was observed between the positive FRET pair e1A/e2D andnegative e1A-e2D sense probe combination applying a Student’s t-test.
PAGE 7 OF 11 Nucleic Acids Research, 2009, Vol. 37, No. 17 e116
Downloaded from https://academic.oup.com/nar/article-abstract/37/17/e116/1077937by gueston 06 April 2018
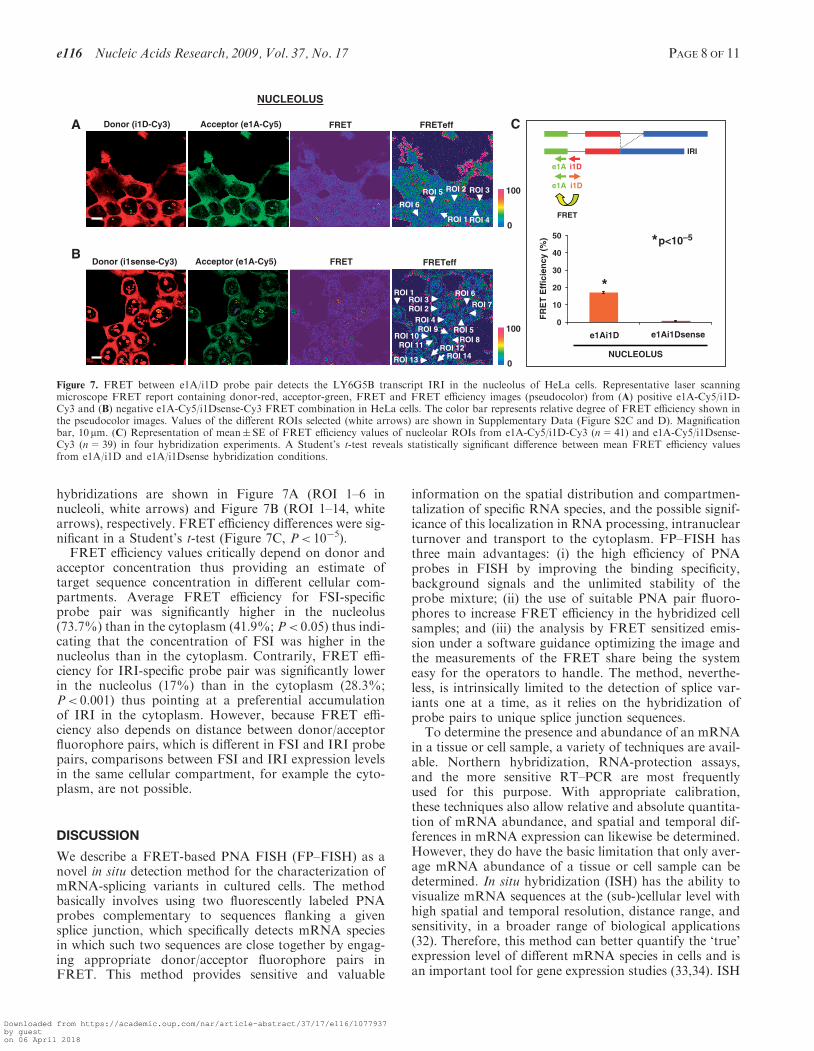
hybridizations are shown in Figure 7A (ROI 1–6 innucleoli, white arrows) and Figure 7B (ROI 1–14, whitearrows), respectively. FRET efficiency differences were sig-nificant in a Student’s t-test (Figure 7C, P< 10�5).FRET efficiency values critically depend on donor and
acceptor concentration thus providing an estimate oftarget sequence concentration in different cellular com-partments. Average FRET efficiency for FSI-specificprobe pair was significantly higher in the nucleolus(73.7%) than in the cytoplasm (41.9%; P< 0.05) thus indi-cating that the concentration of FSI was higher in thenucleolus than in the cytoplasm. Contrarily, FRET effi-ciency for IRI-specific probe pair was significantly lowerin the nucleolus (17%) than in the cytoplasm (28.3%;P< 0.001) thus pointing at a preferential accumulationof IRI in the cytoplasm. However, because FRET effi-ciency also depends on distance between donor/acceptorfluorophore pairs, which is different in FSI and IRI probepairs, comparisons between FSI and IRI expression levelsin the same cellular compartment, for example the cyto-plasm, are not possible.
DISCUSSION
We describe a FRET-based PNA FISH (FP–FISH) as anovel in situ detection method for the characterization ofmRNA-splicing variants in cultured cells. The methodbasically involves using two fluorescently labeled PNAprobes complementary to sequences flanking a givensplice junction, which specifically detects mRNA speciesin which such two sequences are close together by engag-ing appropriate donor/acceptor fluorophore pairs inFRET. This method provides sensitive and valuable
information on the spatial distribution and compartmen-talization of specific RNA species, and the possible signif-icance of this localization in RNA processing, intranuclearturnover and transport to the cytoplasm. FP–FISH hasthree main advantages: (i) the high efficiency of PNAprobes in FISH by improving the binding specificity,background signals and the unlimited stability of theprobe mixture; (ii) the use of suitable PNA pair fluoro-phores to increase FRET efficiency in the hybridized cellsamples; and (iii) the analysis by FRET sensitized emis-sion under a software guidance optimizing the image andthe measurements of the FRET share being the systemeasy for the operators to handle. The method, neverthe-less, is intrinsically limited to the detection of splice var-iants one at a time, as it relies on the hybridization ofprobe pairs to unique splice junction sequences.
To determine the presence and abundance of an mRNAin a tissue or cell sample, a variety of techniques are avail-able. Northern hybridization, RNA-protection assays,and the more sensitive RT–PCR are most frequentlyused for this purpose. With appropriate calibration,these techniques also allow relative and absolute quantita-tion of mRNA abundance, and spatial and temporal dif-ferences in mRNA expression can likewise be determined.However, they do have the basic limitation that only aver-age mRNA abundance of a tissue or cell sample can bedetermined. In situ hybridization (ISH) has the ability tovisualize mRNA sequences at the (sub-)cellular level withhigh spatial and temporal resolution, distance range, andsensitivity, in a broader range of biological applications(32). Therefore, this method can better quantify the ‘true’expression level of different mRNA species in cells and isan important tool for gene expression studies (33,34). ISH
0
10
20
30
40
50
e1Ai1D
FR
ET
Eff
icie
ncy
(%
)
Donor (i1D-Cy3) FRET
0
100
0
100
Donor (i1sense-Cy3) Acceptor (e1A-Cy5) FRET FRETeff
NUCLEOLUS
*
*
A
B
C
NUCLEOLUS
IRI
ROI 1
ROI 2 ROI 3
ROI 4
ROI 5
ROI 6
ROI 1
ROI 2ROI 3
ROI 4ROI 5
ROI 6ROI 7
ROI 8ROI 9
ROI 10ROI 11 ROI 12
ROI 13 ROI 14
FRET
i1D
e1A i1D
e1A
Acceptor (e1A-Cy5) FRETeff
e1Ai1Dsense
p<10–5
Figure 7. FRET between e1A/i1D probe pair detects the LY6G5B transcript IRI in the nucleolus of HeLa cells. Representative laser scanningmicroscope FRET report containing donor-red, acceptor-green, FRET and FRET efficiency images (pseudocolor) from (A) positive e1A-Cy5/i1D-Cy3 and (B) negative e1A-Cy5/i1Dsense-Cy3 FRET combination in HeLa cells. The color bar represents relative degree of FRET efficiency shown inthe pseudocolor images. Values of the different ROIs selected (white arrows) are shown in Supplementary Data (Figure S2C and D). Magnificationbar, 10 mm. (C) Representation of mean� SE of FRET efficiency values of nucleolar ROIs from e1A-Cy5/i1D-Cy3 (n=41) and e1A-Cy5/i1Dsense-Cy3 (n=39) in four hybridization experiments. A Student’s t-test reveals statistically significant difference between mean FRET efficiency valuesfrom e1A/i1D and e1A/i1Dsense hybridization conditions.
e116 Nucleic Acids Research, 2009, Vol. 37, No. 17 PAGE 8 OF 11
Downloaded from https://academic.oup.com/nar/article-abstract/37/17/e116/1077937by gueston 06 April 2018

originally utilized probes in the form of radioactivelylabeled rRNA, visualized by autoradiography (35).Subsequently, various non-isotopic probe labels havealso been used, usually detected with immunoenzymaticmethods (36) or fluorescent in situ hybridization (FISH)(37). In order to generate sufficient signal, non-isotopicISH methods usually use long probes or multiple probecocktails for binding of sufficient number of label mole-cules to each target. However, long probes, as well asbeing not well suited for the discrimination of minorsequence variations, also add a problem since affinityand specificity for nucleic acid probes usually are inverselycorrelated (38). The use of short synthetic DNA oligomersas well as biosynthesizing short RNA probes modifiedwith fluorescent labels have limitations in detecting andprobing the structure and function of biological RNAs.For example, DNA-based probes have relatively low affin-ity for complementary RNA, so it requires that either longDNA probes be used or effective target sites be limited tounstructured regions of the RNA (12). Also, the problemsand cost of chemically synthesized RNA, as well as limita-tions on biosynthesizing RNA site-specifically modifiedwith fluorophores (39–41), hinder progress in this area.One possibility to address these hybridization probes lim-itations is to use unnatural, high-affinity analogues ofDNA. In the present study, we used artificial nucleicacids, such as PNA–oligonucleotides, that typically hybri-dize to complementary DNA and RNA targets with highaffinity, yielding base-paired duplexes with high thermalstabilities (13,42). As a first step in confirming thatthe PNA–FISH assay did detect FSI and IRI mRNAsplice sites sequences in HeLa cells, we tested differentconcentrations of e1A-Cy5, e2D-Cy3, i1D-Cy3 antisensePNA probes and, e2Dsense-Cy3 and i1Dsense-Cy3under three different FISH protocols. Clear localizationof mRNA molecules in the cytoplasm and nucleuswas only found with a FISH protocol that includeda mild pepsin treatment step while alternative FISHprotocols gave unconsistent hybridization signals or nosignal at all.
FRET is one of the most useful and widely applied toolin use today to measure distances on the molecular scale incells (43,44). The majority of FRET studies had beenapplied to identify and spatially localize sites of directinteraction between molecules, specially the detection ofdirect protein–protein interactions, but little is knownabout the use of this technique to detect and characterizeRNA species interaction. Here we show the usefulness ofFRET to quantitavely analyze splicing events (FSI andIRI) of a specific gene, LY6G5B, in cell in culture. Weshow a strong FRET signal in the cytoplasm and nucleoliof HeLa cells hybridized with positive FRET–PNA probepairs detecting FSI and IRI. Consistently, negativeFRET–PNA probe pairs e1A-Cy5/e2Dsense-Cy3 ande1A-Cy5/i1Dsense-Cy3 showed a statistically significantdecrease in FRET efficiency both in the cytoplasm andnucleoli of HeLa cells. FRET efficiency values can beused to provide an estimate of target RNA concentrationin a given cellular location. For example, we detect higherFRET efficiency for FSI probe pair in the nucleolus thanin the cytoplasm (Figures 4 and 5), thus suggesting that
FSI transcripts preferentially accumulated in the nucleolusversus the cytoplasm. However, we note that a compari-son of relative levels of expression of FSI versus IRI in thecytoplasm or nucleolus is not possible as FRET efficiencyvalues are also influenced by the distance that separatesdonor and acceptor fluorophores in FSI and IRI probepairs. Indeed, as the number of nucleotides separating twofluorophores decreased from 11 (e1A-Cy5/i1D-Cy3) to 5(e1A-Cy5/e2D-Cy3), changes in fluorescence FRET spec-tra became larger, from cytoplasmic 28.3% and nucleolar17% FRET efficiency to cytoplasmic 41.9% and nucleolar73.7%, respectively, consistent with isoform specificFRET. Within a range from 4–14 nt, the distancesbetween two fluorophores estimated from FRET efficiencywere well correlated with the expected distances betweentwo fluorophore-conjugated nucleotides (9). Our resultsshow that FRET occurred quantitatively in response tothe number of nucleotides separating the donor and accep-tor on the double-strand PNA–RNA hybrids formed, sug-gesting that under the PNA design rules, the selection ofPNA probe pairs suitable for FRET analysis ought to be4–14 nt apart for best results.We note that FP–FRET is not confined to detecting
nearby sequences within a single molecule, but has thepotential to be used as a molecular ruler to determineintermolecular distances, either between two RNA mole-cules or an RNA molecule and a protein. For example,detection of fluorescence energy transfer between a donorPNA probe against a given sequence in molecule 1and acceptor PNA probe against a given sequence in mol-ecule 2, would place both molecules a maximum of 10 nmapart. These evolutions of the FP–FRET applicationwe describe would help delineate RNA or RNA–proteinconformational changes in large macromolecular com-plexes, for instance the working spliceosome, for whichfew structural details are known so far, and whose 3Dstructure has not been obtained. Also, this new approachcould be generically applicable to quantify and character-ize a wide variety of RNA interactions analyzed by in vitrotechniques, and potential trans-splicing variants predictedby bioinformatic and computational tools. So, thismethod could fulfill the need for efficient methods allow-ing the detection and characterization of RNA–RNAand RNA–protein interactions, such as snRNAs (45),snoRNAs with their targets (46), and micro-RNAs fromthe RNAi pathway with their target mRNA(s) (47).Through technical improvements, we believe that FP–FISH could be suitable to automatization, as similarlyseen in cytogenetic imaging through commercially avail-able imaging platforms (48–51).A combination of FISH and immunofluorescence meth-
ods was used to discard co-localization of intranuclearfluorescent PNA signal and nuclear speckles in HeLacells. Instead, under transmitted light, FSI and IRI iso-forms accumulated in patches that perfectly colocalizedwith HeLa nucleoli. This was surprising as nuclear speck-les are typically associated with pre-mRNA splicing,mature mRNA storage, and export control (26,52),whereas nucleoli are physical compartments where ribo-some biogenesis takes place. Nevertheless, the nucleolihave been involved in a number of unconventional cellular
PAGE 9 OF 11 Nucleic Acids Research, 2009, Vol. 37, No. 17 e116
Downloaded from https://academic.oup.com/nar/article-abstract/37/17/e116/1077937by gueston 06 April 2018
processes, such as mRNA export or surveillance. Forexample, spliced c-myc RNA localized to the nucleolusin mammalian cells (53). The nucleolus in mRNAtransport-defective yeast mutants has been shown to bedisrupted and fragmented. Furthermore, heat shock ormutation of nucleolar proteins such as pol I or Mtr3p,also implicated in mRNA transport, result in accumula-tion of polyA+RNA in the nucleolus of yeast (54,55).Evidence from Schizosaccharomyces pombe indicated thata subset of polyA+RNA associates transiently with thenucleolus during export; in transport-defective mutants,an intron-containing transcript accumulated in the nucleo-lus, whereas transcripts from the intronless cDNA did notaccumulate (56). One work using a GFP-based reportersystem in living yeast cells showed that mRNA processingfactors were required for nuclear export of mRNAs,demonstrating a clear coupling between mRNA proces-sing and export. Moreover, mRNAs containing a partic-ular 30-untranslated region sequence from the ASH1transcript accumulated in the nucleolus (57). Given theclear nucleolar localization of LY6G5B isoforms as wellas the examples just mentioned, we suggest an unconven-tional role for the nucleolus in FSI and IRI isoformmetabolism including export control, RNA surveillanceand/or an as yet unknown function.In summary, FP–FISH provides a robust in situ tech-
nology to quantitatively characterize different mRNAsplice variants with spatial and temporal resolutionwithin a cell. The assay might also be adapted to the ana-lysis of RNA–RNA and RNA–protein interactions and istherefore expected to resolve and confirm predictedmacromolecular interactions involving RNA, and to findbroad application in basic cell biology and molecularpathology research.
SUPPLEMENTARY DATA
Supplementary Data are available at NAR Online.
ACKNOWLEDGEMENTS
The authors thank Alberto Hernandez and Sonia Priegofor their invaluable help with the confocal microscopy andFRET analysis, as well as Francisco Garcıa for his sup-port with statistical analysis.
FUNDING
Genoma Espana Foundation [Accion Especial sobreGenomica de Enfermedades Raras ‘Cetegen’]. Fundingfor open access charge: Genoma Espana Foundation.
Conflict of interest statement. None declared.
REFERENCES
1. Chusainow,J., Ajuh,P.M., Trinkle-Mulcahy,L., Sleeman,J.E.,Ellenberg,J. and Lamond,A.I. (2005) FRET analyses of the U2AFcomplex localize the U2AF35/U2AF65 interaction in vivo andreveal a novel self-interaction of U2AF35. RNA, 11, 1201–1214.
2. Kloc,A., Zearfoss,N.R. and Etkin,L.D. (2002) Mechanisms ofsubcellular mRNA localization. Cell, 108, 533–544.
3. Adereth,Y., Dammai,V., Kose,N., Li,R. and Hsu,T. (2005)RNA-dependent integrin alpha3 protein localization regulatedby the Muscleblind-like protein MLP1. Nat. Cell Biol., 7,1240–1247.
4. Lecuyer,E., Yoshida,H., Parthasarathy,N., Alm,C., Babak,T.,Cerovina,T, Hughes,T.R., Tomancak,P. and Krause,H.M. (2007)Global analysis of mRNA localization reveals a prominent role inorganizing cellular architecture and function. Cell, 131, 174–187.
5. Artero,R.D., Akam,M. and Perez-Alonso,M. (1992)Oligonucleotide probes detect splicing variants in situ in Drosophilaembryos. Nucleic Acids Res., 20, 5687–5690.
6. Yin,Z.Q., Deng,Z.M., Crewther,S.G. and Crewther,D.P. (2001)Altered expression of alternatively spliced isoforms of the mRNANMDAR1 receptor in the visual cortex of strabismic cats.Mol. Vis., 7, 271–276.
7. Ledee,D.R., Chen,J., Tonelli,L.H., Takase,H., Gery,I. andZelenka,P.S. (2004) Differential expression of splice variants ofchemokine CCL27 mRNA in lens, cornea, and retina of the normalmouse eye. Mol. Vis., 10, 663–667.
8. Tsuji,A., Sato,Y., Hirano,M., Suga,T., Koshimoto,H., Taguchi,T.and Ohsuka,S. (2001) Development of a time-resolved fluorometricmethod for observing hybridization in living cells using fluorescenceresonance energy transfer. Biophys. J., 81, 501–515.
9. Tsuji,A., Koshimoto,H., Sato,Y., Hirano,M., Sei-Iida,Y., Kondo,S.and Ishibashi,K. (2000) Direct observation of specific messengerRNA in a single living cell under a fluorescence microscope.Biophys. J., 78, 3260–3274.
10. Megıas,D., Marrero,R., Martınez Del Peso,B., Garcıa,M.A.,Bravo-Cordero,J.J., Garcıa-Grande,A., Santos,A. andMontoya,M.C. (2009) Novel lambda FRET spectral confocalmicroscopy imaging method. Microsc. Res. Tech., 72, 1–11.
11. Dorywalska,M., Blanchard,S.C., Gonzalez,R.L., Kim,H.D., Chu,S.and Puglisi,J.D. (2005) Site-specific labeling of the ribosome forsingle-molecule spectroscopy. Nucleic Acids Res., 33, 182–189.
12. Smith,G.J., Sosnick,T.R., Scherer,N.F. and Pan,T. (2005) Efficientfluorescence labelling of a large RNA through oligonucleotidehybridization. RNA, 11, 234–239.
13. Pellestor,F. and Paulasova,P. (2004) The peptide nucleic acids(PNAs), powerful tools for molecular genetics and cytogenetics.Eur. J. Hum. Genet., 12, 694–700.
14. Ray,A. and Norden,B. (2000) Peptide nucleic acid (PNA): itsmedical and biotechnical applications and promise for the future.FASEB J., 14, 1041–1060.
15. Williams,B., Stender,H. and Coull,J.M. (2002) PNA fluorescentin situ hybridization for rapid microbiology and cytogeneticanalysis. Methods Mol. Biol., 208, 181–193.
16. Robertson,K.L., Yu,L., Armitage,B.A., Lopez,A.J. andPeteanu,L.A. (2006) Fluorescent PNA probes as hybridizationlabels for biological RNA. Biochemistry, 45, 6066–6074.
17. Karadag,A., Riminucci,M., Bianco,P., Cherman,N.,Kuznetsov,S.A., Nguyen,N., Collins,M.T., Robey,P.G. andFisher,L.W. (2004) A novel technique based on a PNAhybridization probe and FRET principle for quantification ofmutant genotype in fibrous dysplasia/McCune-Albright syndrome.Nucleic Acids Res., 32, e63.
18. Mallya,M., Campbell,R.D. and Aguado,B. (2002) Transcriptionalanalysis of a novel cluster of LY-6 family members in the humanand mouse major histocompatibility complex: five genes with manysplice forms. Genomics, 80, 113–123.
19. Calvanese,V., Mallya,M., Campbell,R.D. and Aguado,B. (2008)Regulation of expression of two LY-6 family genes by intronretention and transcription induced chimerism. BMC Mol. Biol.,9, 81.
20. van de Corput,M.P. and Grosveld,F.G. (2001) Fluorescence in situhybridization analysis of transcript dynamics in cells. Methods, 25,111–118.
21. Bonifazi,E., Gullotta,F., Vallo,L., Iraci,R., Nardone,A.M.,Brunetti,E., Botta,A. and Novelli,G. (2006) Use of RNAfluorescence in situ hybridization in the prenatal molecular diagnosisof myotonic dystrophy type I. Clin. Chem., 52, 319–322.
22. Rayasam,G.V., Elbi,C., Walker,D.A., Wolford,R., Fletcher,T.M.,Edwards,D.P. and Hager,G.L. (2005) Ligand-specific dynamics of
e116 Nucleic Acids Research, 2009, Vol. 37, No. 17 PAGE 10 OF 11
Downloaded from https://academic.oup.com/nar/article-abstract/37/17/e116/1077937by gueston 06 April 2018
the progesterone receptor in living cells and during chromatinremodeling in vitro. Mol. Cell Biol., 25, 2406–2418.
23. Wouters,F.S., Verveer,P.J. and Bastiaens,P.I. (2001) Imagingbiochemistry inside cells. Trends Cell Biol., 11, 203–211.
24. Rodrigues,J.P., Rode,M., Gatfield,D., Blencowe,B.J.,Carmo-Fonseca,M. and Izaurralde,E. (2001) REF proteins mediatethe export of spliced and unspliced mRNAs from the nucleus. Proc.Natl Acad. Sci. USA, 98, 1030–1035.
25. Raska,I., Shaw,P.J. and Cmarko,D. (2006) New insights intonucleolar architecture and activity. Int. Rev. Cytol., 255, 177–235.
26. Schmidt,U., Richter,K., Berger,A.B. and Lichter,P. (2006) In vivoBiFC analysis of Y14 and NXF1 mRNA export complexes:preferential localization within and around SC35 domains.J. Cell Biol., 172, 373–381.
27. Leung,A.K., Andersen,J.S., Mann,M. and Lamond,A.I. (2003)Bioinformatic analysis of the nucleolus. Biochem. J., 376, 553–569.
28. Leuba,S.H., Anand,S.P., Harp,J.M. and Khan,S.A. (2008)Expedient placement of two fluorescent dyes for investigatingdynamic DNA protein interactions in real time. Chromosome Res.,16, 451–467.
29. Voss,T.C., Demarco,I.A. and Day,R.N. (2005) Quantitativeimaging of protein interactions in the cell nucleus. Biotechniques, 38,413–424.
30. Elder,A.D., Domin,A., Kaminski Schierle,G.S., Lindon,C., Pines,J.,Esposito,A. and Kaminski,C.F. (2009) A quantitative protocol fordynamic measurements of protein interactions by Forster resonanceenergy transfer-sensitized fluorescence emission. J. R. Soc. Interface,6, S59–S81.
31. Sekar,R.B. and Periasamy,A. (2003) Fluorescence resonance energytransfer (FRET) microscopy imaging of live cell proteinlocalizations. J. Cell Biol., 160, 629–633.
32. van de Corput,M.P., Dirks,R.W., van Gijlswijk,R.P.,van Binnendijk,E., Hattinger,C.M., de Paus,R.A., Landegent,J.E.and Raap,A.K. (1998) Sensitive mRNA detection by fluorescencein situ hybridization using horseradish peroxidase-labelledoligodeoxynucleotides and tyramide signal amplification.J. Histochem. Cytochem., 46, 1249–1259.
33. Lee,C.K., Sunkin,S.M., Kuan,C., Thompson,C.L., Pathak,S.,Ng,L., Lau,C., Fischer,S., Mortrud,M., Slaughterbeck,C. et al.(2008) Quantitative methods for genome-scale analysis of in situhybridization and correlation with microarray data. Genome Biol.,9, R23.
34. Yaylaoglu,M.B., Agbemafle,B.M., Oesterreicher,T.J.,Finegold,M.J., Thaller,C. and Henning,S.J. (2006) Diverse patternsof cell-specific gene expression in response to glucocorticoid in thedeveloping small intestine. Am. J. Physiol. Gastrointest. LiverPhysiol., 291, G1041–G1050.
35. Gall,J.G. and Pardue,M.L. (1969) Formation and detection ofRNA-DNA hybrid molecules in cytological preparations. Proc. NatlAcad. Sci. USA, 63, 378–383.
36. Langer-Safer,P.R., Levine,M. and Ward,D.C. (1982)Immunological method for mapping genes on Drosophila polytenechromosomes. Proc. Natl Acad. Sci. USA, 79, 4381–4385.
37. Bauman,J.G., Wiegant,J. and van Duijn,P. (1981) Cytochemicalhybridization with fluorochrome-labelled RNA. II. Applications.J. Histochem. Cytochem., 29, 238–246.
38. Stougaard,M., Lohmann,J.S., Zajac,M., Hamilton-Dutoit,S. andKoch,J. (2007) In situ detection of non-polyadenylated RNAmolecules using Turtle Probes and target primed rolling circlePRINS. BMC Biotechnol., 7, 69.
39. Qin,P.Z. and Pyle,A.M. (1999) Site-specific labeling of RNA withfluorophores and other structural probes. Methods, 18, 60–70.
40. Li,N., Yu,C. and Huang,F. (2005) Novel cyanine-AMP conjugatesfor efficient 50 RNA fluorescent labelling by one-step transcriptionand replacement of [gamma-32P]ATP in RNA structural investiga-tion. Nucleic Acids Res., 33, e37.
41. Moore,M.J. and Query,C.C. (2000) Joining of RNAs by splintedligation. Methods Enzymol., 317, 109–123.
42. Bonvicini,F., Filippone,C., Manaresi,E., Gentilomi,G.A.,Zerbini,M., Musiani,M. and Gallinella,G. (2006) Peptide nucleicacid-based in situ hybridization assay for detection of parvovirusB19 nucleic acids. Clin. Chem., 52, 973–978.
43. Murata,S., Herman,P., Mochizuki,K., Nakazawa,T., Kondo,T.,Nakamura,N., Lakowicz,J.R. and Katoh,R. (2003) Spatialdistribution analysis of AT- and GC-rich regions in nuclei usingcorrected fluorescence resonance energy transfer. J. Histochem.Cytochem., 51, 951–958.
44. Murata,S., Herman,P., Iwashina,M., Mochizuki,K., Nakazawa,T.,Kondo,T., Nakamura,N., Lakowicz,J.R. and Katoh,R. (2005)Application of microscopic Forster resonance energy transfer tocytological diagnosis of the thyroid tumors. J. Biomed. Opt., 10,034008.
45. Forne,T., Labourier,E., Antoine,E., Rossi,F., Gallouzi,I.,Cathala,G., Tazi,J. and Brunel,C. (1996) Structural featuresof U6 snRNA and dynamic interactions with other spliceosomalcomponents leading to pre-mRNA splicing. Biochimie., 78,436–442.
46. Bachellerie,J.P., Cavaille,J. and Huttenhofer,A. (2002) Theexpanding snoRNA world. Biochimie., 84, 775–790.
47. Hartmann,C., Corre-Menguy,F., Boualem,A., Jovanovic,M. andLelandais-Briere,C. (2004) MicroRNAs: a new class of geneexpression regulators. Med. Sci., 20, 894–898.
48. Pepperkok,R. and Ellenberg,J. (2006) High-throughput fluorescencemicroscopy for systems biology. Nat. Rev. Mol. Cell Biol., 7,690–696.
49. Starkuviene,V. and Pepperkok,R. (2007) The potential ofhigh-content high-throughput microscopy in drug discovery. Br. J.Pharmacol., 152, 62–71.
50. Oheim,M. (2007) High-throughput microscopy must re-invent themicroscope rather than speed up its functions. Br. J. Pharmacol.,152, 1–4.
51. Price,J.H., Goodacre,A., Hahn,K., Hodgson,L., Hunter,E.A.,Krajewski,S., Murphy,R.F., Rabinovich,A., Reed,J.C. andHeynen,S. (2002) Advances in molecular labelling, high throughputimaging and machine intelligence portend powerful functionalcellular biochemistry tools. J Cell Biochem Suppl., 39, 194–210.
52. Hall,L.L., Smith,K.P., Byron,M. and Lawrence,J.B. (2006)Molecular anatomy of a speckle. Anat. Rec. A Discov. Mol. CellEvol. Biol., 288, 664–675.
53. Bond,V.C. and Wold,B. (1993) Nucleolar localization of myctranscripts. Mol. Cell Biol., 13, 3221–3230.
54. Kadowaki,T., Hitomi,M., Chen,S. and Tartakoff,A.M. (1994)Nuclear mRNA accumulation causes nucleolar fragmentation inyeast mtr2 mutant. Mol. Biol. Cell, 5, 1253–1263.
55. Kadowaki,T., Schneiter,R., Hitomi,M. and Tartakoff,A.M. (1995)Mutations in nucleolar proteins lead to nucleolar accumulation ofpolyA+ RNA in Saccharomyces cerevisiae. Mol. Biol. Cell, 6,1103–1110.
56. Ideue,T., Azad,A.K., Yoshida,J., Matsusaka,T., Yanagida,M.,Ohshima,Y. and Tani,T. (2004) The nucleolus is involved in mRNAexport from the nucleus in fission yeast. J. Cell Sci., 117,2887–2895.
57. Brodsky,A.S. and Silver,P.A. (2000) Pre-mRNA processing factorsare required for nuclear export. RNA, 6, 1737–1749.
PAGE 11 OF 11 Nucleic Acids Research, 2009, Vol. 37, No. 17 e116
Downloaded from https://academic.oup.com/nar/article-abstract/37/17/e116/1077937by gueston 06 April 2018