a framework for water demand in the yakima river … framework for water demand in the yakima river...
TRANSCRIPT

A Framework for Water Demand in the Yakima River Basin
YRBWEP III Work Group September 23, 2009
Joel FreudenthalYakima County Public Services
Surface Water Management Division

“Title XII (the current YRBWEP authorization) also provided for the completion of two reports, with recommendations which shall provide a basis for the third phase of the YRBWEP. These reports are: 1) A report addressing the adequacy of the water supply available for sustaining the agricultural economy of the Yakima River basin, and 2) The Biologically Based Target Flow Report which has been completed by SOAC .”
Bureau of Reclamation, Interim Comprehensive Basin Operating Plan for the Yakima Project, 2002
Basis of the Framework
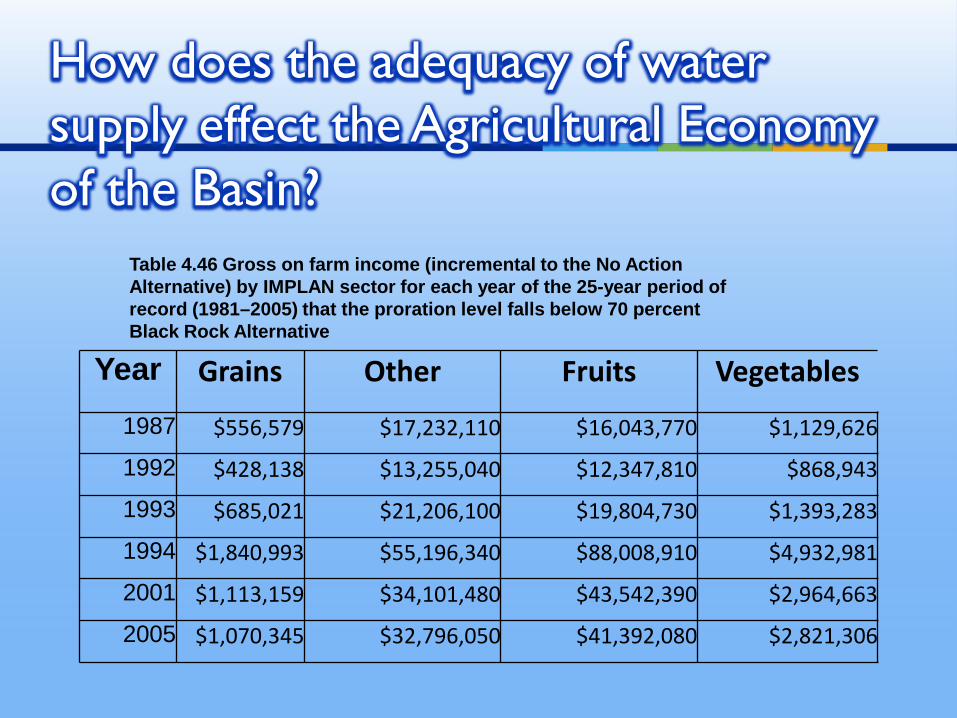
How does the adequacy of water supply effect the Agricultural Economy of the Basin?
Table 4.46 Gross on farm income (incremental to the No ActionAlternative) by IMPLAN sector for each year of the 25-year period ofrecord (1981–2005) that the proration level falls below 70 percentBlack Rock Alternative
Year Grains Other Fruits Vegetables
1987 $556,579 $17,232,110 $16,043,770 $1,129,626
1992 $428,138 $13,255,040 $12,347,810 $868,943
1993 $685,021 $21,206,100 $19,804,730 $1,393,283
1994 $1,840,993 $55,196,340 $88,008,910 $4,932,981
2001 $1,113,159 $34,101,480 $43,542,390 $2,964,663
2005 $1,070,345 $32,796,050 $41,392,080 $2,821,306

What is the Agricultural Economy?
Year Total Loss On-Farm Income
Loss X 3.5 Economic Multiplier
1987$34,964,072.00 $122,374,252.00
1992$26,901,923.00 $94,156,730.50
1993$43,091,127.00 $150,818,944.50
1994$149,981,218.00 $524,934,263.00
2001$81,723,693.00 $286,032,925.50
2005$78,081,786.00 $273,286,251.00

Historically, pro-rationing has
occurred in 14% of the years since 1945, with 1 year of pro-
ration of senior districts in 1979.
But the last 25 years show:
What is the frequency and severity of Drought?
Year
Pro-Ration Level Probability
1994 28 0.042005 38 0.082001 40 0.121993 56 0.161992 64 0.21987 65 0.241988 73 0.281986 92 0.321981 95 0.362003 97 0.41989 98 0.441982 100 0.48

What is the risk to Ag. Economy of water supply shortage?

What is the unmet demand for water in a recent drought year?
District Firm RightsPro-ratable
Rights
"Normal" Drought year (2005, 38%)
Additional "minimal"
water supply demand
Available for in
"normal" drought
year
Proportion of full
entitlement
KRD 336,000 127,680 85,000 212,680 63%RID 375,000 142,500 35,000 177,500 47%WIP 306,000 350,000 133,000 50,000 183,000 75%Sunnyside 316,000 143,000 54,340 0 54,340 81%Tieton 76,000 38,000 14,440 0 14,440 79%Other 519,000 42,000 15,960 3000 538,000 93%KID 18,000 91,275 75,150 0 75,150 85%
Total 1,235,000 1,375,275 563,070 170,000 720,110
Fish Pulse 0 42,000 42,000Parker 83,000 180,000 180,000
Total Irr and Fish Unmet Demand 395,000

Unmet Water Demand at Various Water Supply levels
District50% (around
1993) 38% (2005) 28% (1994) 10% 0%
KRD 44,680 85,000 118,600 179,080 212,680
RID 35,000 35,000 35,000 35,000 35,000
WIP 8,000 50,000 85,000 148,000 183,000
Sunnyside 0 0 0
Yak-Tieton 0 0 0
Other 0 3,000 7,200 14,760 18,960
KID 29,513 0 52,331 66,023 75,150
Total 117,193 173,000 298,131 442,863 524,790
Fish Pulse 30,000 42,000 42,000 42,000 42,000
Parker 153,000 180,000 180,000 180,000 180,000
Total Irr and Fish Unmet Water Demand (AF) 300,193 395,000 520,131 664,863 746,790
Pro-Rationing Level

Combined Economic and Water Demand
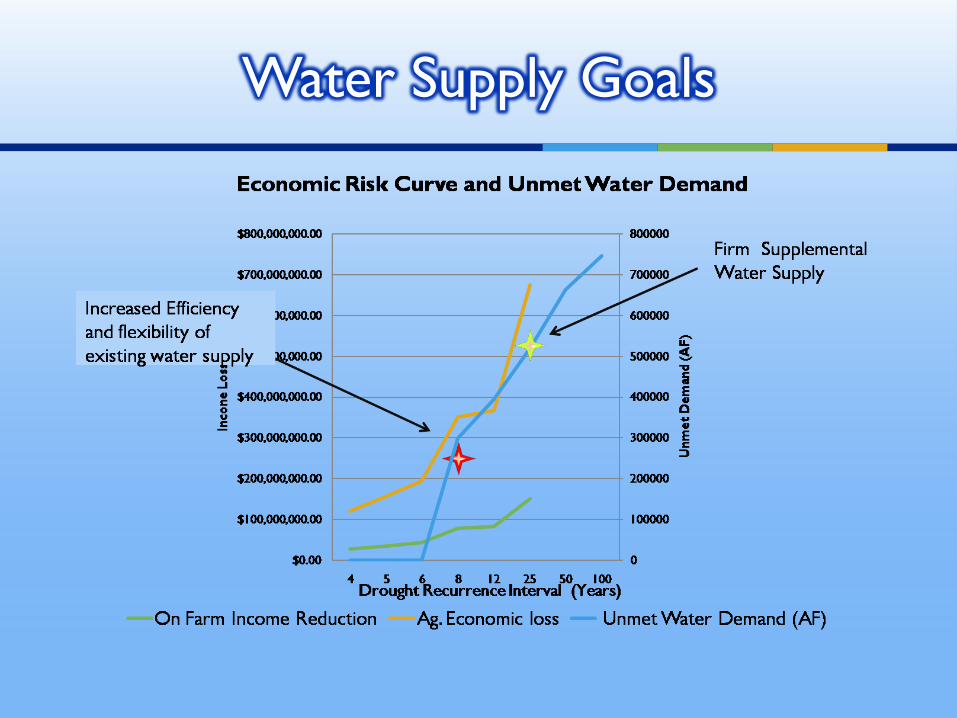
Water Supply Goals

300 KAF of improvements to efficiency and flexibility of existing water supply.
Information Needs- In-stream flows at Parker gage dominate the water supply needs,
do we really see habitat benefits at higher flows? What about flows at Prosser and Kiona?
Increased efficiency of water use can impact KID during droughts, can KID generate an similar “minimal” water demand for drought?
Elements of Different Water Supply Goals
Elements - In-stream flows at Parker gage – Conservation, Diversion Reduction
(i.e. Satus Project), Changes to existing facilities, Transfers Ag. and Fish Water Supply – Conservation, Use/Manage Surficial
Aquifer, Re-reg reservoirs (Wymer and Naches Arm), Transfers, Carry Over Storage in new or existing Reservoirs

520 KAF of Firm Supplemental water supply.Information Needs-
Minimal need for the WIP? Minimal needs for M&I Pro-ratable or Junior Water Rights? Minimal needs for Roza if supplied by other means than Large
Bumping? Flow targets and means to meet them at Parker, Prosser,
Kiona
Elements of Different Water Supply Goals
Elements - Inter-Basin Transfer New Dedicated Multi-Year Carry Over Storage – Wymer, Small
Bumping, other Naches Arm Storage Ag. and Fish Water Supply – Use/Manage Surficial Aquifer, Re-reg
reservoirs (Wymer and Naches Arm), Transfers, Carry Over Storage in existing Reservoirs,
Drought Relief Wells – Already have approximately 100 KAF of firm supply for the near term.