19056 final report sozo - yakima, washington · yakima sports complex – yakima, wa project #:...
TRANSCRIPT

FILENAME: H:\PROJFILE\19056 - YAKIMA SPORTS COMPLEX\REPORT\FINAL\19056 FINAL REPORT_SOZO.DOCX
October 13, 2015 Project #: 19056
Kerry Martin
Sozo Sports of Central Washington
1200 Chesterley Drive, Suite 140
Yakima, WA 98902
RE: Transportation Impact Analysis for the Yakima Sports Complex
Dear Kerry,
This report presents the results of Kittelson & Associates Inc.’s transportation impact analysis for the
proposed Yakima Sports Complex. The results of this study indicate that with the identified mitigation
measures, the proposed sports complex can be constructed while maintaining acceptable traffic
operations and safety at the study intersections. Additional details of the study methodology, findings,
and recommendations are provided herein.
INTRODUCTION
SOZO Sports is proposing to develop a multi-use sports complex at 2210 S 38th
Avenue in Yakima. The
58-acre sports complex will have 13 outdoor soccer fields and an 80,000 square foot indoor facility that
will house six courts that can be used for indoor soccer, volleyball, and basketball. The remainder of the
indoor facility will include space for concessions, private training facilities, restrooms, miscellaneous
facility space, and administrative offices. For the purposes of this study, full build-out of the envisioned
complex is anticipated to be completed by 2017. Phase two of this project may include the
development of an adjacent 60 acres; however this longer-term phase and it’s transportation impacts
are not included in the analysis.
Access to the sports complex will be provided via two new driveways off of S 36th
Avenue. Figure 1
illustrates the site vicinity map and Figure 2 illustrates a draft version of the proposed site plan and site
access driveways. Given the preliminary nature of the current site plan, this traffic study does not
include an operations assessment of the S 36th
Avenue site-access driveways. A supplemental
assessment of the site access conditions will be prepared when a more formal site layout is decided
upon.


Yakima Sports Complex – Yakima, WA Project #: 19056
October 13, 2015 Page: 3
Kittelson & Associates, Inc. Portland, Oregon
Figure 2 – Draft Site Development Plan (Draft site plan prepared by Digital Design and Development 10/5/15 and is subject to further refinement.)

Yakima Sports Complex – Yakima, WA Project #: 19056
October 13, 2015 Page: 4
Kittelson & Associates, Inc. Portland, Oregon
SCOPE OF THE REPORT/METHODOLOGY
This analysis determines the transportation-related impacts associated with the proposed development
and has been prepared in accordance with City of Yakima and Yakima County requirements for a traffic
impact analysis. The study intersections and scope of this project are based on consultation with City
and County staff. Operational analyses have been performed at the following intersections:
� S 52nd
Avenue/W Washington Avenue
� S 48th
Avenue/W Washington Avenue
� S 16th
Avenue/W Valley Mall Boulevard
� S 52nd
Avenue/Ahtanum Road
� S 38th
Avenue/Ahtanum Road
� S 16th
Avenue/Ahtanum Road
� Proposed site driveways
This report evaluates the following transportation scenarios:
� Year 2015 existing transportation-system conditions within the site vicinity during the
weekday PM peak hour and Saturday afternoon peak hour;
� Forecast year 2017 background traffic conditions during the weekday p.m. peak hour and
Saturday peak hour of generator without build-out of the site;
� Trip generation and assignment for the proposed development;
� Forecast year 2017 total traffic conditions during the weekday p.m. peak hour and Saturday
peak hour of generator with build-out of the site; and
� Recommended improvements/intersection considerations.
All level of service analyses described in this report was performed in accordance with the procedures
stated in the 2010 Highway Capacity Manual (Reference 1).
The analysis herein evaluates the peak 15-minute flow rate during the peak hour analysis period. For
this reason, the analyses reflect conditions that are only likely to occur for 15-minutes out of each
average peak hour; therefore, the study intersections will likely operate more efficiently during the
other times of day.
JURISDICTIONAL REQUIREMENTS
The City of Yakima, which has jurisdiction over the intersections on W Washington Avenue, W Valley
Mall Boulevard, and S 36th
Avenue, has an operational standard of LOS D or better.

Yakima Sports Complex – Yakima, WA Project #: 19056
October 13, 2015 Page: 5
Kittelson & Associates, Inc. Portland, Oregon
Yakima County has jurisdiction over the three study intersections on Athanum Road with an operational
standard of LOS C or better.
EXISTING CONDITIONS
The existing conditions analysis identifies site conditions and the current operational and geometric
characteristics of the study area roadways and intersections. The purpose of this section is to set the
stage for a basis of comparison to future conditions.
Transportation Facilities
Table 1 summarizes the existing transportation facilities and roadways in the study area. Figure 3
illustrates the existing lane configurations and traffic control devices in place at the study intersections.
Table 1 - Existing Transportation Facilities
Roadway
Functional
Classification1
Number of
Lanes
Posted
Speed (mph) Sidewalks Bicycle Lanes
On-Street
Parking
W Washington
Avenue
Principal Arterial
(Urban) 5 Lanes 40 Yes No No
Spring Creek
Road Local Access 2 Lanes 35 No No No
Ahtanum Road Minor Arterial
(Urban)
2 lanes
(4 Lanes
between S 26th
Avenue and S
16th
Avenue)
50 (West of S
26th
Avenue)
45 (East of S 26th
Avenue)
Partial No No
S 52nd
Avenue Collector
Arterial (urban) 2 Lanes 40 No No No
S 38th
Avenue Local Access 2 Lanes 35 West Side Only No No
S 36th
Avenue Local Access 2 Lanes 35 No No No
S 16th
Avenue Arterial (Urban) 2 Lanes 35 East Side Only No No
1 Source: City of Yakima Functional Class and traffic Volumes Map (November 2010)
Pedestrian and Bicycle Facilities
The proposed project site is located in a predominately rural area with limited pedestrian and bicycle
infrastructure. Continuous sidewalks are present on both sides of W Washington Avenue, on the west
side of S 38th
Avenue between Ahtanum Road and W Sorenson Road, and on the east side of S 16th
Avenue north of Ahtanum Road. Sidewalks are also present on the north side of Ahtanum Road for
approximately ½ mile west of S 16th
Avenue and on the south side of Ahtanum Road for approximately
¼ mile west of S 16th
Avenue. W Washington Avenue has shared bicycle lane infrastructure.


Yakima Sports Complex – Yakima, WA Project #: 19056
October 13, 2015 Page: 7
Kittelson & Associates, Inc. Portland, Oregon
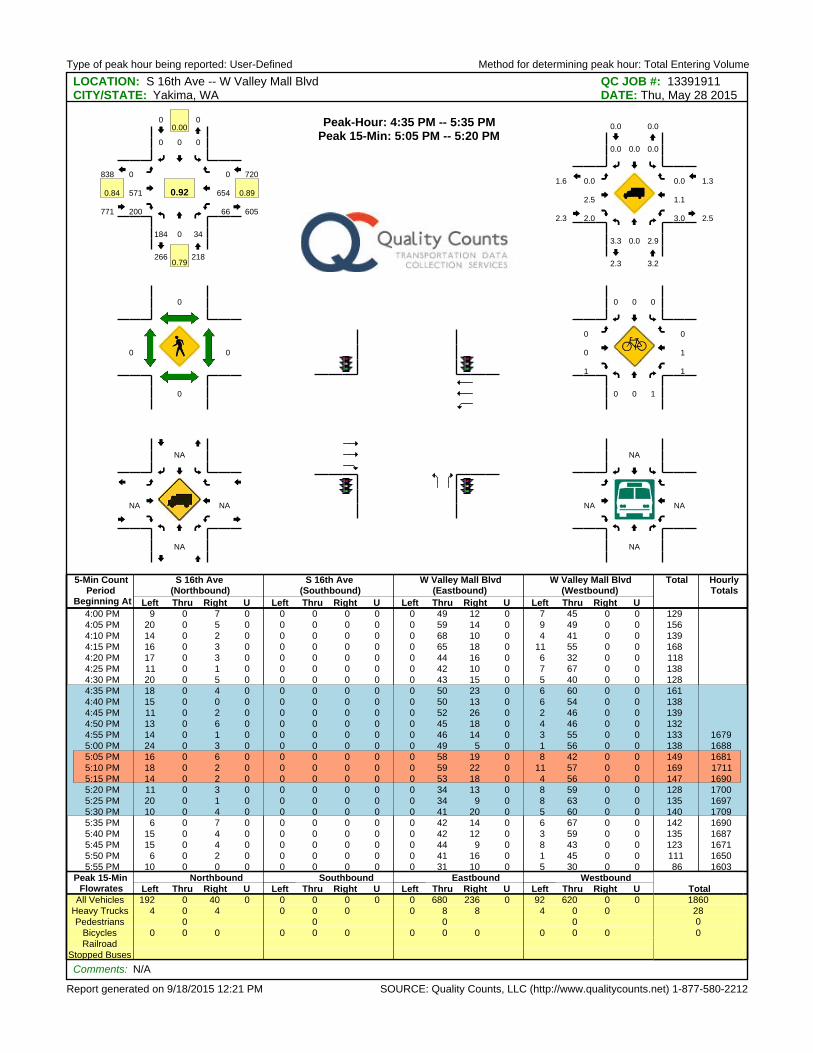
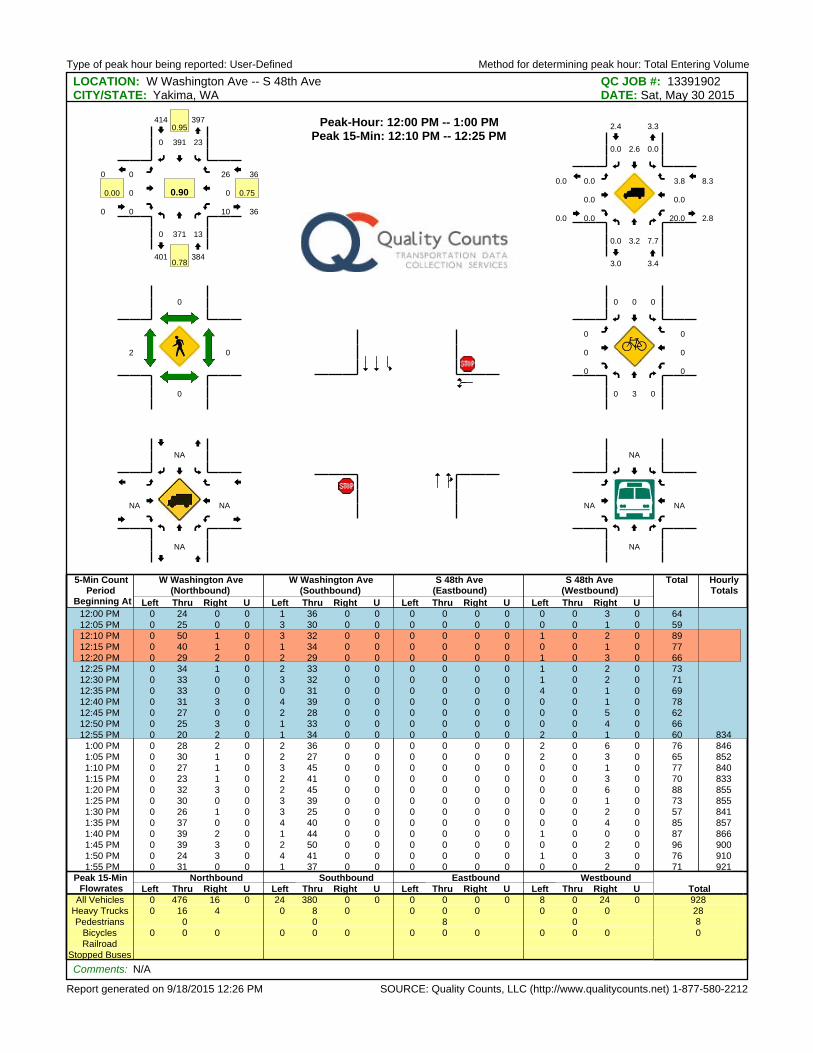
EXISTING TRAFFIC OPERATIONS
Manual turning-movement counts were conducted at the study intersections in May 2015 prior to the
end of the 2014/2015 school year. The counts were conducted on a typical mid-week day during the
evening (4:00 to 6:00 p.m.) peak time period and on a typical Saturday afternoon (12:00 to 2:00 p.m.).
The system-wide evening and Saturday afternoon peak hours were found to occur between 4:35 - 5:35
p.m. and 12:00 - 1:00 p.m., respectively. Attachment “A” includes the traffic count data used in this
study.
Figures 4 and 5 summarize the level-of-service analysis for the study intersections under existing traffic
conditions during the weekday p.m. and Saturday peak hours, respectively. As shown, all of the study
intersections currently operate acceptably. Attachment “B” includes the existing traffic operations
worksheets.
Crash Analysis
Crash records were obtained from WSDOT for the five-year period from January 1, 2010, through
available 2015 (the 2015 data is partial and preliminary). The detailed crash data covering all reported
crashes that occurred at the study intersections were reviewed in an effort to identify potential
intersection safety issues or trends. The intersection crash data are summarized in Table 2, including
types and severity of crashes. Attachment “C” contains the crash data provided by WSDOT
Table 2 - Intersection Crash History (January 1, 2010 - Available 2015 Data)
Intersection
Collision Type Severity
Total
Estimated
Crash
Rate2
Rear
End Turn Angle Other PDO1 Injury Fatal
S 52nd
Avenue/W Washington
Avenue 0 3 0 0 1 2 0 3 0.13
S 48th
Avenue/W Washington
Avenue 0 0 0 0 0 0 0 0 0.0
S 16th
Avenue/W Valley Mall
Boulevard 0 2 0 0 1 1 0 2 0.06
S 52nd
Avenue/Ahtanum Road 0 1 0 1 1 1 0 2 0.11
S 38th
Avenue/Ahtanum Road 0 0 0 0 0 0 0 0 0.0
S 16th
Avenue/Ahtanum Road 1 6 4 0 9 2 0 11 0.45
1 PDO: Property Damage Only
2 Crash Rate = (Total Crashes) / (365 days/year x daily entering vehicles / 1,000,000)
As shown in Table 2, the S 16th Avenue/Ahtanum Road intersection has experienced the most crashes
over the most recent five-year period. The majority of the crashes were turning crashes, with five of the
six attributed to southbound vehicles making left turns and not yielding to the oncoming vehicle.
Further analysis of the crashes at this intersection as well as the other intersections did not reveal any
discernable patterns or obvious geometric/operational concerns.


Yakima Sports Complex – Yakima, WA Project #: 19056
October 13, 2015 Page: 10
Kittelson & Associates, Inc. Portland, Oregon
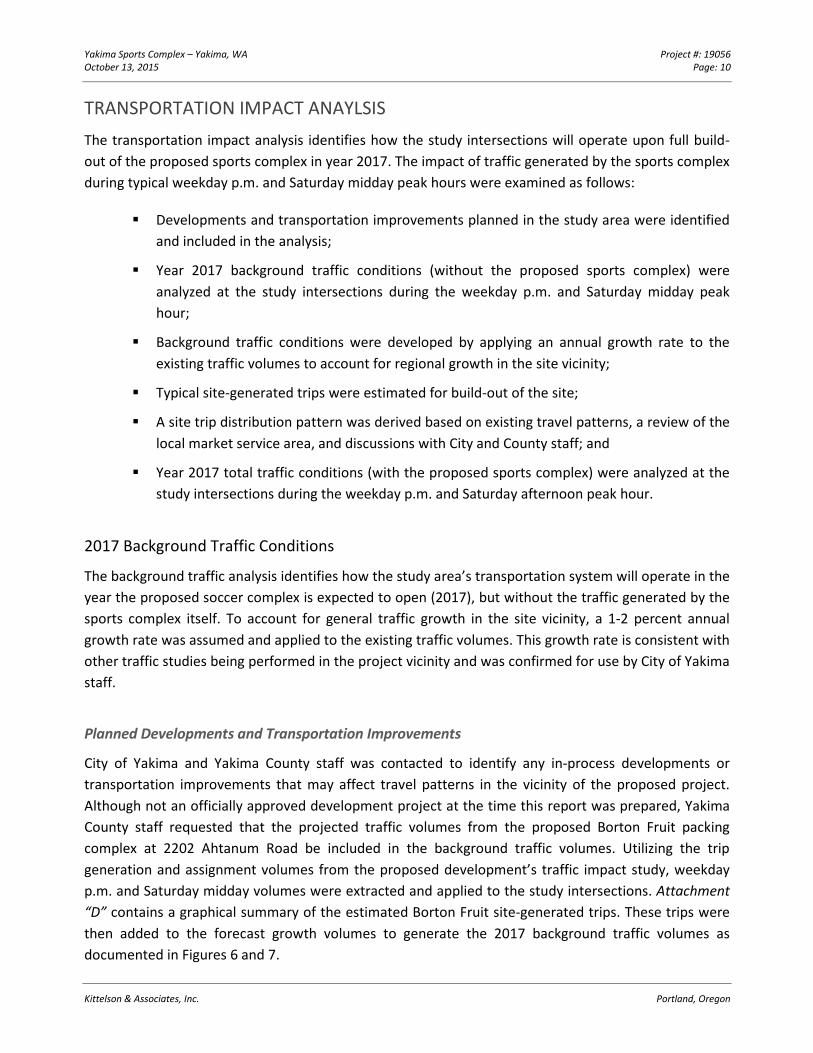
TRANSPORTATION IMPACT ANAYLSIS
The transportation impact analysis identifies how the study intersections will operate upon full build-
out of the proposed sports complex in year 2017. The impact of traffic generated by the sports complex
during typical weekday p.m. and Saturday midday peak hours were examined as follows:
� Developments and transportation improvements planned in the study area were identified
and included in the analysis;
� Year 2017 background traffic conditions (without the proposed sports complex) were
analyzed at the study intersections during the weekday p.m. and Saturday midday peak
hour;
� Background traffic conditions were developed by applying an annual growth rate to the
existing traffic volumes to account for regional growth in the site vicinity;
� Typical site-generated trips were estimated for build-out of the site;
� A site trip distribution pattern was derived based on existing travel patterns, a review of the
local market service area, and discussions with City and County staff; and
� Year 2017 total traffic conditions (with the proposed sports complex) were analyzed at the
study intersections during the weekday p.m. and Saturday afternoon peak hour.
2017 Background Traffic Conditions
The background traffic analysis identifies how the study area’s transportation system will operate in the
year the proposed soccer complex is expected to open (2017), but without the traffic generated by the
sports complex itself. To account for general traffic growth in the site vicinity, a 1-2 percent annual
growth rate was assumed and applied to the existing traffic volumes. This growth rate is consistent with
other traffic studies being performed in the project vicinity and was confirmed for use by City of Yakima
staff.
Planned Developments and Transportation Improvements
City of Yakima and Yakima County staff was contacted to identify any in-process developments or
transportation improvements that may affect travel patterns in the vicinity of the proposed project.
Although not an officially approved development project at the time this report was prepared, Yakima
County staff requested that the projected traffic volumes from the proposed Borton Fruit packing
complex at 2202 Ahtanum Road be included in the background traffic volumes. Utilizing the trip
generation and assignment volumes from the proposed development’s traffic impact study, weekday
p.m. and Saturday midday volumes were extracted and applied to the study intersections. Attachment
“D” contains a graphical summary of the estimated Borton Fruit site-generated trips. These trips were
then added to the forecast growth volumes to generate the 2017 background traffic volumes as
documented in Figures 6 and 7.

Yakima Sports Complex – Yakima, WA Project #: 19056
October 13, 2015 Page: 11
Kittelson & Associates, Inc. Portland, Oregon
2017 Background Traffic Intersection Operations
As shown in Figures 6 and 7, all of the study intersections are forecast to continue to operate
acceptably during the weekday p.m. and Saturday midday peak hours. Attachment “D” contains the
worksheets used to evaluate year 2017 background traffic conditions.
PROPOSED REDEVELOPMENT PLAN
SOZO Sports is proposing to construct a 58-acre soccer complex. At full buildout, the complex will
include 13 outdoor soccer fields and an 80,000 square foot multi-use indoor facility. The indoor facility
will have six courts that can accommodate a variety of recreational activities including indoor soccer,
volleyball, and/or basketball events. It will also include support space, concessions, restrooms, a private
training complex, and administrative offices. Main access to the site will be provided via two new site
driveways on S. 38th Avenue. This analysis assumes the development will be built out and in use by the
year 2017.
Trip Generation Estimate
To estimate the trip generation potential of the proposed soccer complex, the data presented in the
Institute of Transportation Engineers (ITE) reference Trip Generation, 9th Edition (Reference 2) was
reviewed. For the 13 outdoor soccer fields, the “Soccer Complex” land use would provide a reasonable
estimate of the typical1 weekday p.m. and Saturday midday peak hour trip profiles. The indoor facility,
however, is unique in that it is not accurately represented by any of the land use categories in the trip
generation reference manual. Detailed conversations with the project design team revealed that each
indoor soccer, volleyball, and basketball field/court will generate a proportionately similar level of use
to each outdoor soccer field. Based on these assumptions, the trip generation for the indoor facility was
calculated using the same “Soccer Complex” land use category. Tables 3 and 4 summarize the daily,
weekday p.m. and Saturday afternoon peak-hour trips for the proposed soccer complex.
1 It is recognized that the proposed soccer complex can and will most likely host large regional soccer/athletic
tournaments at various times of the year. However, given that these events will be relatively infrequent, the trip
generation analysis is focused on typical weekday p.m. and Saturday midday levels of activity. This activity is assumed
to include a variety of youth and adult soccer practices/games.


Yakima Sports Complex – Yakima, WA Project #: 19056
October 13, 2015 Page: 14
Kittelson & Associates, Inc. Portland, Oregon
Table 3 - Proposed Yakima Sports Complex Trip Generation - Weekday PM Peak Hour
Land Use
ITE
Code
Size
(Fields)
Daily
Trips
Weekday P.M. Peak Hour
Total In Out
Soccer Complex 488 13
Fields 928 230 154 76
Soccer Complex (Indoor Facility) 488 6
Fields 428 106 71 35
Total New Trips 1,356 336 225 111
Table 4 - Proposed Yakima Sports Complex Trip Generation - Saturday Midday Peak Hour
Land Use
ITE
Code
Size
(Fields)
Daily
Trips
Saturday Peak Hour of Generator
Total In Out
Soccer Complex 488 13
Fields 1,528 394 189 205
Soccer Complex (Indoor Facility) 488 6
Fields 706 182 87 95
Total New Trips 2,234 576 276 300
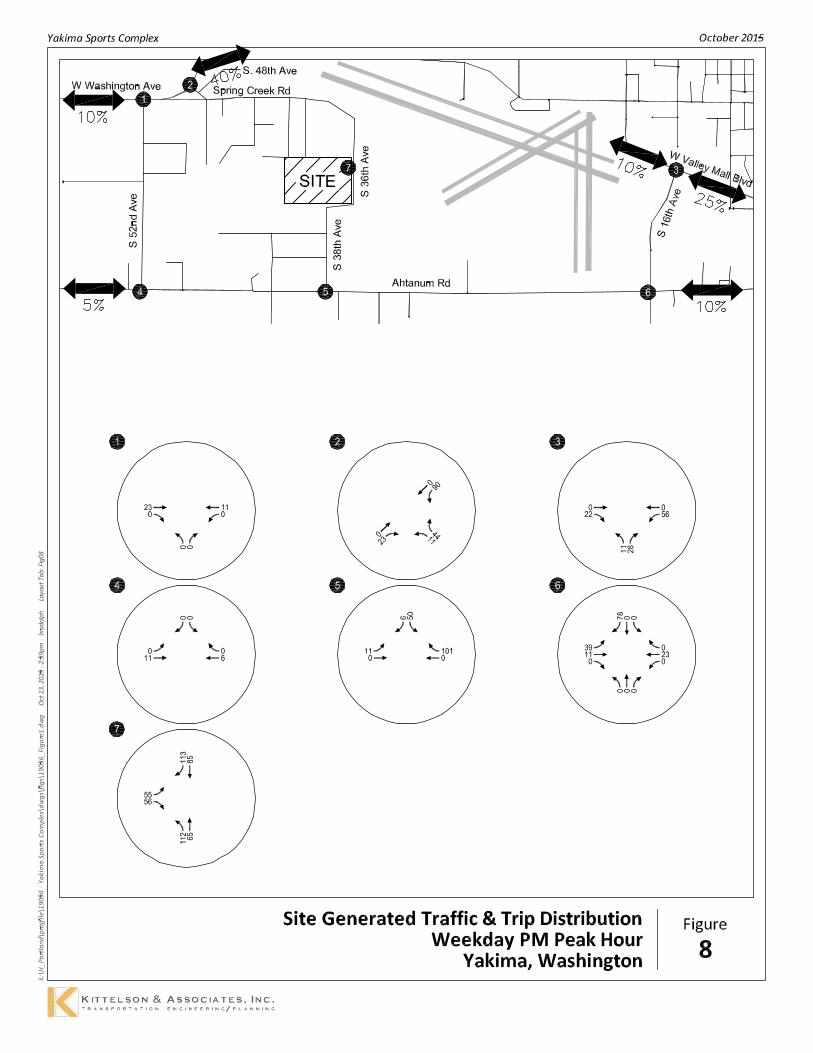
Site Trip Distribution/Trip Assignment
The site-generated trips shown in Tables 3 and 4 were distributed onto the roadway network according
to existing traffic patterns, a review of the local market service area, various routing choices, the
proposed site layout, and the marketing plans being developed by SOZO Sports. Figures 8 and 9
illustrate the resulting trip distribution pattern for the proposed development and the assignment of
site-generated trips during the weekday p.m. and Saturday afternoon peak hour.
2017 TOTAL TRAFFIC CONDITIONS
The total traffic conditions analysis estimates how the study area’s transportation system will operate
with the traffic generated by the proposed sports complex. The year 2017 background traffic volumes
shown in Figures 6 and 7 were added to the site-generated traffic shown in Figures 8 and 9 to arrive at
the total traffic volumes shown in Figures 10 and 11. As shown in Figures 10 and 11, all of the study
intersections are forecast to continue to operate acceptably with the exception of the S. 38th
Avenue/Ahtanum Road intersection during the weekday PM peak hour. Attachment “E” includes the
2017 Total Traffic Conditions analysis worksheets.


Yakima Sports Complex – Yakima, WA Project #: 19056
October 13, 2015 Page: 19
Kittelson & Associates, Inc. Portland, Oregon
S. 38th
Avenue/Ahtanum Road Intersection
As shown in Figure 10, the southbound approach at the unsignalized S. 38th
Avenue/Ahtanum Road
intersection is projected to operate with a critical movement delay that exceeds Yakima County’s level
of service “C” standard during the weekday p.m. peak hour. Given these findings, a signal warrant
analysis was subsequently performed at the intersection in accordance with the procedures outlined in
the 2009 Manual on Uniform Traffic Control Devices (MUTCD). The following volume-based traffic
signal warrants were evaluated as part of the analysis:
� Warrant 1: Eight-Hour Vehicle Volume (1A – Minimum Vehicular Volume and 1B -
Interruption of Continuous Traffic)
� Warrant 2: Four-Hour Vehicular Volume
� Warrant 3: Peak Hour
From this analysis, it was found that the intersection would meet traffic signal warrants #1, #2, and #3.
The signal warrant worksheets that address MUTCD Warrants #1-3 are included in Attachment “F”.
With signalization, the intersection is forecast to operate at an acceptable level of service “A” as shown
in Table 5.
Table 5 - S. 38th
Avenue/Ahtanum Road Mitigation Summary
S. 38th
Avenue/Ahtanum Road
Weekday PM Peak Hour
Delay/LOS V/C
Existing Unsignalized Configuration
Critical Movement =
Southbound Approach
29.5 / D 0.50
Assumed Future Signalized Configuration1
11.7 / B 0.66
Note: Hollow arrows represent assumed new travel lanes.
1 Given the existing rural two-lane configuration of Ahtanum Road, signalization assumes the construction of a 100-foot
eastbound left-turn lane with protected left-turn phasing. Although not assumed as part of the signalization analysis and not
necessary to address level of service or capacity constraints, a westbound right-turn lane on Ahtanum Road would provide
additional operations and safety benefits and should be considered if sufficient right-of-way can be acquired.

Yakima Sports Complex – Yakima, WA Project #: 19056
October 13, 2015 Page: 20
Kittelson & Associates, Inc. Portland, Oregon
Iteration of Signalization Needs
As documented, full buildout of the proposed soccer complex results in a level of service degradation of
the S. 38th Avenue/Ahtanum Road Intersection from level of service “C” to “D”. A signal warrant
analysis indicates that signalization of the intersection would be warranted under these conditions,
whereby a subsequent signalization analysis has shown that acceptable operations can be restored to
the intersection.
At the request of City and County staff, an iterative analysis was performed at this intersection to help
determine how much of the proposed soccer complex can be constructed before triggering level of
service “D” conditions and the need for signalization. As shown in Table 6, the equivalent of eleven
soccer fields can be constructed while maintaining Yakima County’s level of service “C” standard during
the weekday p.m. peak hour. Beyond eleven fields, projected traffic volumes would be high enough to
result in level of service “D” conditions and the need for signalization.
Table 6 - S. 38th
Avenue/Ahtanum Road Maximum Level of Service Threshold
Weekday PM Peak Hour
S. 38th
Avenue/Ahtanum Road Delay/LOS V/C
11 Fields
Critical Movement =
Southbound Approach
24.6 / C 0.39
12 Fields 25.0 / D 0.40
W. Washington Avenue/S. 48th
Avenue Intersection
Although the critical westbound S. 48th
Avenue approach to the W. Washington Avenue intersection is
forecast to continue to operate at acceptable levels of service during the 2017 weekday PM and
Saturday midday peak hour, field observations, existing travel patterns, and forecast traffic volumes
indicate that the vast majority of movements on this approach are and will be making a right-turn onto
W. Washington Avenue. As an existing single-lane approach, this heavy right-turn volume has the
potential to be significantly delayed by left-turning vehicles, resulting in long vehicle queues. A second
exclusive right-turn lane on the S. 48th
Avenue approach (from W. Washington Avenue to Spring Creek
Road) would better accommodate the existing and projected right-turn movement and minimize delays
to the predominate right-turn maneuver. This right-turn lane would also be useful to accommodate
traffic during special events.

Yakima Sports Complex – Yakima, WA Project #: 19056
October 13, 2015 Page: 21
Kittelson & Associates, Inc. Portland, Oregon
FINDINGS AND RECOMMENDATIONS
Based on the results of this transportation impact analysis, the proposed Yakima Sports Complex can be
developed while maintaining acceptable levels of service at the study intersections. The findings and
recommendations of this analysis are summarized below.
Existing Conditions
� All study intersections currently operate at acceptable levels of service during the weekday
p.m. and Saturday midday peak hours.
Year 2017 Background Conditions
� With the assumed local and regional traffic growth, all study intersections are forecast to
continue to operate at acceptable levels of service during the weekday p.m. and Saturday
midday peak hours.
Proposed Development Plan
� The proposed sports complex is estimated to generate approximately 1,355 daily weekday
trips, with 336 trips (225 in, 111 out) occurring during the weekday p.m. peak hour and
approximately 2,232 daily Saturday trips, with 576 trips (276 in, 300 out) during the
Saturday midday peak hour. These trip generation estimates are representative of typical
weekday and Saturday conditions and do not reflect trips associated with major
tournaments of similar large-scale special events.
Year 2017 Total Traffic Conditions
� All study intersections are forecast to continue to operate at acceptable levels of service
during the weekday p.m. and Saturday afternoon peak hours with the exception of the S.
38th
Avenue/Ahtanum Road intersection.
� At the construction and utilization of the equivalent of twelve or more soccer fields,
the southbound approach at the unsignalized S. 38th Avenue/Ahtanum Road
intersection is forecast to operate with a critical movement delay that exceeds
Yakima County’s level of service “C” standard during the weekday p.m. peak hour.
o A traffic signal warrant analysis concluded that the intersection meets the
volume-based traffic signal warrants #1, #2, and #3.
o Assuming signalization and the construction of a 100-foot eastbound left-
turn lane, the S. 38th Avenue/Ahtanum Road intersection would operate at
an acceptable level of service “B”.

Yakima Sports Complex – Yakima, WA Project #: 19056
October 13, 2015 Page: 22
Kittelson & Associates, Inc. Portland, Oregon
o Although not needed to address level of service or capacity issues, a
westbound right-turn lane on Ahtanum Road would provide additional
operations and safety benefits.
� Field observations, existing travel patterns, and forecast traffic volumes indicate
that the vast majority of movements on the S. 48th
Avenue approach to the W.
Washington Avenue/S. 48th
Avenue intersection are/will be turning right onto W.
Washington Avenue. As an existing single-lane approach, this heavy right-turn
volume has the potential to be delayed by left-turning vehicles, resulting in long
vehicle queues. A second exclusive lane (exclusively for right-turning vehicles) on
the S. 48th Avenue approach (from Spring Creek Road to W. Washington Avenue)
would better accommodate the existing and projected right-turn movement and
minimize delays to the predominate right-turn maneuver.
RECOMMENDATIONS
The following list summarizes improvements recommended in conjunction with site development:
� The S. 38th
Avenue/Ahtanum Road intersection should be signalized. Based on the iterations
analysis, signalization would be needed at the equivalent of 12 or more soccer fields. As
part of the signalization project, Ahtanum Road should be widened to provide a 100-foot
eastbound left-turn lane.
� A second exclusive lane (for right-turning vehicles) should be constructed on the S. 48th
Avenue (from Spring Creek Road to W. Washington Avenue) approach to the W.
Washington Avenue/S. 48th
Avenue intersection. This second lane should be constructed as
part of the initial development of the soccer complex.
� Any new landscaping, signage or above-ground utilities along the S. 36th
Avenue site
frontage should be installed and maintained to ensure they do not interfere with the vision
clearance triangles at the two proposed site driveways.
We trust this letter adequately addresses the traffic impacts associated with the proposed Yakima
Sports Complex. Please contact us if you have any questions.
Sincerely,
KITTELSON & ASSOCIATES, INC.
Matt Hughart, AICP Julia Kuhn, P.E.
Associate Planner Principal Engineer

Yakima Sports Complex – Yakima, WA Project #: 19056
October 13, 2015 Page: 23
Kittelson & Associates, Inc. Portland, Oregon
REFERENCES
1. Transportation Research Board. Highway Capacity Manual. 2010.
2. Washington State Department of Transportation. WSDOT Design Manual. 2013.
3. Institute of Transportation Engineers. Trip Generation, 9th
Edition. 2012.
ATTACHMENTS
A. Traffic Count Data
B. Existing Traffic Operations Worksheets
C. WSDOT Crash Data
D. 2017 Background Traffic Operations Worksheets
E. 2017 Total Traffic Operations Worksheet
F. Signal Warrant Worksheets

Appendix A Traffic Counts

Type of peak hour being reported: User-Defined Method for determining peak hour: Total Entering Volume
Report generated on 9/18/2015 12:21 PM SOURCE: Quality Counts, LLC (http://www.qualitycounts.net) 1-877-580-2212
LOCATION: W Washington Ave -- S 48th Ave QC JOB #: 13391901CITY/STATE: Yakima, WA DATE: Thu, May 28 2015
5-Min CountPeriod
Beginning At
W Washington Ave(Northbound)
W Washington Ave(Southbound)
S 48th Ave(Eastbound)
S 48th Ave(Westbound)
Total HourlyTotals
Left Thru Right U Left Thru Right U Left Thru Right U Left Thru Right U4:00 PM 0 27 2 0 4 43 0 0 0 0 0 0 0 0 6 0 824:05 PM 0 42 1 0 5 32 0 0 0 0 0 0 4 0 7 0 914:10 PM 0 27 1 0 3 59 0 0 0 0 0 0 0 0 4 0 944:15 PM 0 35 1 0 6 46 0 0 0 0 0 0 0 0 2 0 904:20 PM 0 19 0 0 4 56 0 0 0 0 0 0 1 0 3 0 834:25 PM 0 24 1 0 4 36 0 0 0 0 0 0 2 0 7 0 744:30 PM 0 30 2 0 5 61 0 0 0 0 0 0 0 0 4 0 102
4:35 PM 0 31 0 1 6 68 0 0 0 0 0 0 0 0 2 0 1084:40 PM 0 36 1 0 8 39 0 0 0 0 0 0 1 0 4 0 894:45 PM 0 45 0 0 10 48 0 0 0 0 0 0 2 0 3 0 1084:50 PM 0 31 5 0 4 54 0 0 0 0 0 0 2 0 4 0 1004:55 PM 0 29 2 0 2 65 0 0 0 0 0 0 0 0 3 0 101 11225:00 PM 0 30 1 0 2 48 0 0 0 0 0 0 0 0 4 0 85 11255:05 PM 0 41 2 0 7 59 0 0 0 0 0 0 2 0 5 0 116 1150
5:10 PM 0 54 0 0 1 57 0 0 0 0 0 0 1 0 8 0 121 11775:15 PM 0 40 6 0 5 85 0 0 0 0 0 0 0 0 12 0 148 12355:20 PM 0 43 0 0 2 74 0 0 0 0 0 0 0 0 2 0 121 12735:25 PM 0 33 1 0 3 79 0 0 0 0 0 0 0 0 3 0 119 13185:30 PM 0 43 0 0 3 76 0 0 0 0 0 0 3 0 4 0 129 13455:35 PM 0 34 1 0 10 49 0 0 0 0 0 0 1 0 4 0 99 13365:40 PM 0 35 1 0 4 65 0 0 0 0 0 0 0 0 7 0 112 13595:45 PM 0 31 0 0 2 60 0 0 0 0 0 0 0 0 4 0 97 13485:50 PM 0 30 0 0 5 63 0 0 0 0 0 0 1 0 2 0 101 13495:55 PM 0 32 0 0 2 39 0 0 0 0 0 0 2 0 0 0 75 1323
Peak 15-Min Northbound Southbound Eastbound WestboundTotalFlowrates Left Thru Right U Left Thru Right U Left Thru Right U Left Thru Right U
All Vehicles 0 548 24 0 32 864 0 0 0 0 0 0 4 0 88 0 1560Heavy Trucks 0 12 0 0 16 0 0 0 0 0 0 0 28Pedestrians 0 0 0 4 4
Bicycles 0 0 0 0 0 0 0 0 0 0 0 0 0Railroad
Stopped Buses
Comments: N/A
Peak-Hour: 4:35 PM -- 5:35 PMPeak 15-Min: 5:10 PM -- 5:25 PM
1 456 18
537520
0
0
0 11
0
54
475
805
0
65
510
764
71
0
0.00 0.58
0.83
0.81
0.86
0.0 3.3 0.0
3.82.00.0
0.0
0.0
0.0 0.0
0.0
0.0
3.2
2.1
0.0
0.0
2.9
2.0
2.8
0.0
0
0
0 1
0 0 0
030
0
0
0 0
0
0
NA
NA
NA NA
NA
NA
NA NA

Type of peak hour being reported: User-Defined Method for determining peak hour: Total Entering Volume
Report generated on 9/18/2015 12:21 PM SOURCE: Quality Counts, LLC (http://www.qualitycounts.net) 1-877-580-2212
LOCATION: S 52nd Ave -- W Washington Ave QC JOB #: 13391903CITY/STATE: Yakima, WA DATE: Thu, May 28 2015
5-Min CountPeriod
Beginning At
S 52nd Ave(Northbound)
S 52nd Ave(Southbound)
W Washington Ave(Eastbound)
W Washington Ave(Westbound)
Total HourlyTotals
Left Thru Right U Left Thru Right U Left Thru Right U Left Thru Right U4:00 PM 1 0 4 0 0 0 0 0 0 27 1 0 6 36 0 0 754:05 PM 1 0 9 0 0 0 0 0 0 34 2 0 6 35 0 0 874:10 PM 2 0 8 0 0 0 0 0 0 18 3 0 7 44 0 0 824:15 PM 0 0 6 0 0 0 0 0 0 30 1 0 11 42 0 0 904:20 PM 0 0 1 0 0 0 0 0 0 23 1 0 8 44 0 0 774:25 PM 2 0 5 0 0 0 0 0 0 19 1 0 8 33 0 0 684:30 PM 1 0 10 0 0 0 0 0 0 20 2 0 11 52 0 0 96
4:35 PM 1 0 7 0 0 0 0 0 0 26 1 0 7 63 0 0 1054:40 PM 1 0 6 0 0 0 0 0 0 34 0 0 3 39 0 0 834:45 PM 0 0 9 0 0 0 0 0 0 35 1 0 10 37 0 0 924:50 PM 2 0 4 0 0 0 0 0 0 34 0 0 11 54 0 0 1054:55 PM 0 0 5 0 0 0 0 0 0 28 1 0 9 52 0 0 95 10555:00 PM 0 0 9 0 0 0 0 0 0 25 1 0 8 40 0 0 83 10635:05 PM 1 0 13 0 0 0 0 0 0 28 4 0 9 50 0 0 105 10815:10 PM 1 0 8 0 0 0 0 0 0 44 0 0 12 49 0 0 114 1113
5:15 PM 1 0 8 0 0 0 0 0 0 36 2 0 11 68 0 0 126 11495:20 PM 1 0 6 0 0 0 0 0 0 33 1 0 12 64 0 0 117 11895:25 PM 4 0 6 0 0 0 0 0 0 30 4 0 18 62 0 0 124 12455:30 PM 0 0 8 0 0 0 0 0 0 34 0 0 10 63 0 0 115 12645:35 PM 1 0 6 0 0 0 0 0 0 29 1 0 10 49 0 0 96 12555:40 PM 0 0 8 0 0 0 0 0 0 29 2 0 8 52 0 0 99 12715:45 PM 3 0 7 0 0 0 0 0 0 23 4 0 11 51 0 0 99 12785:50 PM 1 0 6 0 0 0 0 0 0 25 0 0 8 59 0 0 99 12725:55 PM 1 0 5 0 0 0 0 0 0 26 2 0 3 38 0 0 75 1252
Peak 15-Min Northbound Southbound Eastbound WestboundTotalFlowrates Left Thru Right U Left Thru Right U Left Thru Right U Left Thru Right U
All Vehicles 24 0 80 0 0 0 0 0 0 396 28 0 164 776 0 0 1468Heavy Trucks 4 0 0 0 0 0 0 0 0 0 16 0 20Pedestrians 0 0 0 0 0
Bicycles 0 0 0 0 0 0 0 0 0 0 2 0 2Railroad
Stopped Buses
Comments: N/A
Peak-Hour: 4:35 PM -- 5:35 PMPeak 15-Min: 5:15 PM -- 5:30 PM
12 0 89
000
0
387
15 120
641
0
101
0
402
761
0
135
476
653
0.87 0.81
0.79
0.00
0.86
8.3 0.0 1.1
0.00.00.0
0.0
3.6
0.0 2.5
1.9
0.0
2.0
0.0
3.5
2.0
0.0
2.2
3.2
2.0
0
0
0 0
0 0 0
000
0
0
0 0
6
0
NA
NA
NA NA
NA
NA
NA NA

Type of peak hour being reported: User-Defined Method for determining peak hour: Total Entering Volume
Report generated on 9/18/2015 12:21 PM SOURCE: Quality Counts, LLC (http://www.qualitycounts.net) 1-877-580-2212
LOCATION: S 52nd Ave -- Ahtanum Rd QC JOB #: 13391905CITY/STATE: Yakima, WA DATE: Thu, May 28 2015
5-Min CountPeriod
Beginning At
S 52nd Ave(Northbound)
S 52nd Ave(Southbound)
Ahtanum Rd(Eastbound)
Ahtanum Rd(Westbound)
Total HourlyTotals
Left Thru Right U Left Thru Right U Left Thru Right U Left Thru Right U4:00 PM 0 0 0 0 0 0 7 0 6 23 0 0 0 35 2 0 734:05 PM 0 0 0 0 2 0 0 0 5 27 0 0 0 35 1 0 704:10 PM 0 0 0 0 3 0 7 0 5 19 0 0 0 39 4 0 774:15 PM 0 0 0 0 3 0 6 0 2 18 0 0 0 25 2 0 564:20 PM 0 0 0 0 0 0 9 0 3 15 0 0 0 31 3 0 614:25 PM 0 0 0 0 2 0 3 0 4 22 0 0 0 34 2 0 674:30 PM 0 0 0 0 3 0 6 0 7 22 0 0 0 33 1 0 72
4:35 PM 0 0 0 0 1 0 6 0 5 19 0 0 0 42 4 0 774:40 PM 0 0 0 0 3 0 3 0 6 28 0 0 0 37 4 0 814:45 PM 0 0 0 0 0 0 7 0 6 41 0 0 0 42 2 0 984:50 PM 0 0 0 0 1 0 11 0 3 22 0 0 0 37 1 0 754:55 PM 0 0 0 0 1 0 5 0 2 12 0 0 0 41 2 0 63 8705:00 PM 0 0 0 0 1 0 4 0 4 21 0 0 0 40 3 0 73 8705:05 PM 0 0 0 0 2 0 6 0 8 16 0 0 0 48 6 0 86 8865:10 PM 0 0 0 0 1 0 8 0 1 19 0 0 0 46 4 0 79 888
5:15 PM 0 0 0 0 4 0 8 0 5 19 0 0 0 54 4 0 94 9265:20 PM 0 0 0 0 2 0 6 0 1 24 0 0 0 41 6 0 80 9455:25 PM 0 0 0 0 2 0 12 0 4 25 0 0 0 48 2 0 93 9715:30 PM 0 0 0 0 5 0 7 0 2 20 0 0 0 38 1 0 73 9725:35 PM 0 0 0 0 4 0 6 0 6 21 0 0 0 32 1 0 70 9655:40 PM 0 0 0 0 2 0 6 0 6 13 0 0 0 39 3 0 69 9535:45 PM 0 0 0 0 3 0 4 0 4 18 0 0 0 26 2 0 57 9125:50 PM 0 0 0 0 1 0 10 0 5 12 0 0 0 30 1 0 59 8965:55 PM 0 0 0 0 0 0 3 0 3 18 0 0 0 21 2 0 47 880
Peak 15-Min Northbound Southbound Eastbound WestboundTotalFlowrates Left Thru Right U Left Thru Right U Left Thru Right U Left Thru Right U
All Vehicles 0 0 0 0 32 0 104 0 40 272 0 0 0 572 48 0 1068Heavy Trucks 0 0 0 4 0 0 0 28 0 0 24 4 60Pedestrians 0 0 0 0 0
Bicycles 0 0 0 0 0 0 0 0 0 0 0 0 0Railroad
Stopped Buses
Comments: N/A
Peak-Hour: 4:35 PM -- 5:35 PMPeak 15-Min: 5:15 PM -- 5:30 PM
0 0 0
23083
47
266
0 0
514
39
0
106
313
553
86
0
289
597
0.74 0.85
0.00
0.78
0.91
0.0 0.0 0.0
4.30.01.2
0.0
8.6
0.0 0.0
3.5
5.1
0.0
1.9
7.3
3.6
2.3
0.0
8.3
3.2
0
0
0 0
0 0 0
000
0
0
0 0
1
0
NA
NA
NA NA
NA
NA
NA NA

Type of peak hour being reported: User-Defined Method for determining peak hour: Total Entering Volume
Report generated on 9/18/2015 12:21 PM SOURCE: Quality Counts, LLC (http://www.qualitycounts.net) 1-877-580-2212
LOCATION: S 38th Ave -- Ahtanum Rd QC JOB #: 13391907CITY/STATE: Yakima, WA DATE: Thu, May 28 2015
5-Min CountPeriod
Beginning At
S 38th Ave(Northbound)
S 38th Ave(Southbound)
Ahtanum Rd(Eastbound)
Ahtanum Rd(Westbound)
Total HourlyTotals
Left Thru Right U Left Thru Right U Left Thru Right U Left Thru Right U4:00 PM 0 0 0 0 4 0 1 0 0 24 0 0 0 32 3 0 644:05 PM 0 0 0 0 0 0 0 0 1 30 0 0 0 34 6 0 714:10 PM 0 0 0 0 4 0 1 0 0 20 0 0 0 35 2 0 624:15 PM 0 0 0 0 2 0 0 0 0 18 0 0 0 28 3 0 514:20 PM 0 0 0 0 1 0 0 0 1 16 0 0 0 32 1 0 514:25 PM 0 0 0 0 5 0 0 0 0 20 0 0 0 32 6 0 634:30 PM 0 0 0 0 3 0 2 0 2 26 0 0 0 35 2 0 70
4:35 PM 0 0 0 0 7 0 1 0 1 17 0 0 0 46 9 0 814:40 PM 0 0 0 0 5 0 1 0 1 32 0 0 0 43 4 0 864:45 PM 0 0 0 0 4 0 3 0 0 37 0 0 0 43 1 0 884:50 PM 0 0 0 0 6 0 1 0 0 18 0 0 0 37 7 0 694:55 PM 0 0 0 0 2 0 1 0 1 21 0 0 0 47 2 0 74 8305:00 PM 0 0 0 0 1 0 0 0 1 19 0 0 0 39 2 0 62 8285:05 PM 0 0 0 0 4 0 0 0 2 17 0 0 0 53 2 0 78 8355:10 PM 0 0 0 0 3 0 0 0 1 22 0 0 0 48 4 0 78 8515:15 PM 0 0 0 0 3 0 1 0 2 17 0 0 0 56 4 0 83 8835:20 PM 0 0 0 0 2 0 0 0 2 21 0 0 0 46 5 0 76 9085:25 PM 0 0 0 0 2 0 0 0 1 27 0 0 0 53 2 0 85 9305:30 PM 0 0 0 0 1 0 1 0 0 25 0 0 0 34 3 0 64 9245:35 PM 0 0 0 0 0 0 1 0 2 19 0 0 0 38 1 0 61 9045:40 PM 0 0 0 0 1 0 5 0 0 17 0 0 0 39 2 0 64 8825:45 PM 0 0 0 0 1 0 0 0 0 17 0 0 0 26 2 0 46 8405:50 PM 0 0 0 0 2 0 0 0 0 15 0 0 0 37 3 0 57 8285:55 PM 0 0 0 0 1 0 0 0 1 17 0 0 0 27 2 0 48 802
Peak 15-Min Northbound Southbound Eastbound WestboundTotalFlowrates Left Thru Right U Left Thru Right U Left Thru Right U Left Thru Right U
All Vehicles 0 0 0 0 64 0 20 0 8 344 0 0 0 528 56 0 1020Heavy Trucks 0 0 0 4 0 0 0 12 0 0 44 4 64Pedestrians 0 0 0 0 0
Bicycles 0 0 0 0 0 0 0 0 0 0 0 0 0Railroad
Stopped Buses
Comments: N/A
Peak-Hour: 4:35 PM -- 5:35 PMPeak 15-Min: 4:35 PM -- 4:50 PM
0 0 0
4009
12
273
0 0
545
45
0
49
285
590
57
0
313
554
0.81 0.88
0.00
0.58
0.91
0.0 0.0 0.0
2.50.00.0
8.3
7.0
0.0 0.0
3.7
4.4
0.0
2.0
7.0
3.7
5.3
0.0
6.4
3.6
0
0
0 0
0 0 0
000
0
0
0 0
0
0
NA
NA
NA NA
NA
NA
NA NA

Type of peak hour being reported: User-Defined Method for determining peak hour: Total Entering Volume
Report generated on 9/18/2015 12:21 PM SOURCE: Quality Counts, LLC (http://www.qualitycounts.net) 1-877-580-2212
LOCATION: S 16th Ave -- Ahtanum Rd QC JOB #: 13391909CITY/STATE: Yakima, WA DATE: Thu, May 28 2015
5-Min CountPeriod
Beginning At
S 16th Ave(Northbound)
S 16th Ave(Southbound)
Ahtanum Rd(Eastbound)
Ahtanum Rd(Westbound)
Total HourlyTotals
Left Thru Right U Left Thru Right U Left Thru Right U Left Thru Right U4:00 PM 3 8 4 0 11 3 7 0 7 28 2 0 2 25 5 0 1054:05 PM 0 4 6 0 8 3 10 0 3 20 2 0 1 40 13 0 1104:10 PM 1 8 2 0 5 4 6 0 3 21 2 0 3 20 7 0 824:15 PM 1 3 0 0 8 6 12 0 8 19 0 0 0 37 13 0 1074:20 PM 0 3 1 0 8 5 6 0 2 16 1 0 4 40 9 0 954:25 PM 0 1 3 0 10 3 9 0 5 22 1 0 3 27 8 0 924:30 PM 1 2 1 0 9 2 9 0 11 29 1 0 0 33 7 0 105
4:35 PM 1 9 2 0 10 4 7 0 8 27 3 0 1 46 8 0 1264:40 PM 0 0 3 0 13 4 8 0 8 25 2 0 4 26 6 0 994:45 PM 2 4 1 0 13 7 7 0 7 38 0 0 0 41 4 0 1244:50 PM 1 3 3 0 11 4 7 0 6 31 0 0 0 36 7 0 1094:55 PM 0 4 3 0 8 2 7 0 6 21 0 0 2 36 9 0 98 12525:00 PM 7 10 5 0 5 3 3 0 4 16 3 0 3 37 13 0 109 12565:05 PM 3 10 4 0 10 3 6 0 3 21 1 0 0 38 10 0 109 1255
5:10 PM 2 4 5 0 13 3 17 0 5 24 0 0 0 51 9 0 133 13065:15 PM 3 3 1 0 6 5 11 0 3 17 4 0 4 38 10 0 105 13045:20 PM 3 4 0 0 7 5 16 0 5 22 2 0 3 42 9 0 118 13275:25 PM 1 4 7 0 3 3 10 0 4 20 2 0 2 36 9 0 101 13365:30 PM 1 1 0 0 5 5 5 0 9 24 6 0 3 32 7 0 98 13295:35 PM 3 2 2 0 10 4 10 0 4 22 0 0 1 33 10 0 101 13045:40 PM 0 3 2 0 12 3 6 0 9 20 0 0 0 22 9 0 86 12915:45 PM 1 0 1 0 6 3 6 0 5 21 0 0 1 28 5 0 77 12445:50 PM 3 4 1 0 10 3 4 0 2 10 1 0 0 26 6 0 70 12055:55 PM 3 3 2 0 11 1 5 0 0 16 2 0 3 29 4 0 79 1186
Peak 15-Min Northbound Southbound Eastbound WestboundTotalFlowrates Left Thru Right U Left Thru Right U Left Thru Right U Left Thru Right U
All Vehicles 32 44 24 0 104 52 176 0 52 252 24 0 28 524 112 0 1424Heavy Trucks 4 0 0 4 0 0 0 16 0 8 20 4 56Pedestrians 0 0 0 0 0
Bicycles 0 0 0 0 0 0 0 0 0 0 0 0 0Railroad
Stopped Buses
Comments: N/A
Peak-Hour: 4:35 PM -- 5:35 PMPeak 15-Min: 5:10 PM -- 5:25 PM
24 56 34
10448104
68
286
23 22
459
101
114
256
377
582
225
93
424
587
0.80 0.88
0.57
0.77
0.93
4.2 1.8 5.9
3.84.20.0
2.9
5.2
8.7 13.6
2.8
4.0
3.5
2.3
5.0
3.4
3.1
7.5
5.0
2.4
0
0
0 1
0 0 0
000
0
0
0 0
0
0
NA
NA
NA NA
NA
NA
NA NA
Type of peak hour being reported: User-Defined Method for determining peak hour: Total Entering Volume
Report generated on 9/18/2015 12:21 PM SOURCE: Quality Counts, LLC (http://www.qualitycounts.net) 1-877-580-2212
LOCATION: S 16th Ave -- W Valley Mall Blvd QC JOB #: 13391911CITY/STATE: Yakima, WA DATE: Thu, May 28 2015
5-Min CountPeriod
Beginning At
S 16th Ave(Northbound)
S 16th Ave(Southbound)
W Valley Mall Blvd(Eastbound)
W Valley Mall Blvd(Westbound)
Total HourlyTotals
Left Thru Right U Left Thru Right U Left Thru Right U Left Thru Right U4:00 PM 9 0 7 0 0 0 0 0 0 49 12 0 7 45 0 0 1294:05 PM 20 0 5 0 0 0 0 0 0 59 14 0 9 49 0 0 1564:10 PM 14 0 2 0 0 0 0 0 0 68 10 0 4 41 0 0 1394:15 PM 16 0 3 0 0 0 0 0 0 65 18 0 11 55 0 0 1684:20 PM 17 0 3 0 0 0 0 0 0 44 16 0 6 32 0 0 1184:25 PM 11 0 1 0 0 0 0 0 0 42 10 0 7 67 0 0 1384:30 PM 20 0 5 0 0 0 0 0 0 43 15 0 5 40 0 0 128
4:35 PM 18 0 4 0 0 0 0 0 0 50 23 0 6 60 0 0 1614:40 PM 15 0 0 0 0 0 0 0 0 50 13 0 6 54 0 0 1384:45 PM 11 0 2 0 0 0 0 0 0 52 26 0 2 46 0 0 1394:50 PM 13 0 6 0 0 0 0 0 0 45 18 0 4 46 0 0 1324:55 PM 14 0 1 0 0 0 0 0 0 46 14 0 3 55 0 0 133 16795:00 PM 24 0 3 0 0 0 0 0 0 49 5 0 1 56 0 0 138 1688
5:05 PM 16 0 6 0 0 0 0 0 0 58 19 0 8 42 0 0 149 16815:10 PM 18 0 2 0 0 0 0 0 0 59 22 0 11 57 0 0 169 17115:15 PM 14 0 2 0 0 0 0 0 0 53 18 0 4 56 0 0 147 16905:20 PM 11 0 3 0 0 0 0 0 0 34 13 0 8 59 0 0 128 17005:25 PM 20 0 1 0 0 0 0 0 0 34 9 0 8 63 0 0 135 16975:30 PM 10 0 4 0 0 0 0 0 0 41 20 0 5 60 0 0 140 17095:35 PM 6 0 7 0 0 0 0 0 0 42 14 0 6 67 0 0 142 16905:40 PM 15 0 4 0 0 0 0 0 0 42 12 0 3 59 0 0 135 16875:45 PM 15 0 4 0 0 0 0 0 0 44 9 0 8 43 0 0 123 16715:50 PM 6 0 2 0 0 0 0 0 0 41 16 0 1 45 0 0 111 16505:55 PM 10 0 0 0 0 0 0 0 0 31 10 0 5 30 0 0 86 1603
Peak 15-Min Northbound Southbound Eastbound WestboundTotalFlowrates Left Thru Right U Left Thru Right U Left Thru Right U Left Thru Right U
All Vehicles 192 0 40 0 0 0 0 0 0 680 236 0 92 620 0 0 1860Heavy Trucks 4 0 4 0 0 0 0 8 8 4 0 0 28Pedestrians 0 0 0 0 0
Bicycles 0 0 0 0 0 0 0 0 0 0 0 0 0Railroad
Stopped Buses
Comments: N/A
Peak-Hour: 4:35 PM -- 5:35 PMPeak 15-Min: 5:05 PM -- 5:20 PM
184 0 34
000
0
571
200 66
654
0
218
0
771
720
0
266
605
838
0.84 0.89
0.79
0.00
0.92
3.3 0.0 2.9
0.00.00.0
0.0
2.5
2.0 3.0
1.1
0.0
3.2
0.0
2.3
1.3
0.0
2.3
2.5
1.6
0
0
0 0
0 0 1
000
0
0
1 1
1
0
NA
NA
NA NA
NA
NA
NA NA
Type of peak hour being reported: User-Defined Method for determining peak hour: Total Entering Volume
Report generated on 9/18/2015 12:26 PM SOURCE: Quality Counts, LLC (http://www.qualitycounts.net) 1-877-580-2212
LOCATION: W Washington Ave -- S 48th Ave QC JOB #: 13391902CITY/STATE: Yakima, WA DATE: Sat, May 30 2015
5-Min CountPeriod
Beginning At
W Washington Ave(Northbound)
W Washington Ave(Southbound)
S 48th Ave(Eastbound)
S 48th Ave(Westbound)
Total HourlyTotals
Left Thru Right U Left Thru Right U Left Thru Right U Left Thru Right U
12:00 PM 0 24 0 0 1 36 0 0 0 0 0 0 0 0 3 0 6412:05 PM 0 25 0 0 3 30 0 0 0 0 0 0 0 0 1 0 59
12:10 PM 0 50 1 0 3 32 0 0 0 0 0 0 1 0 2 0 8912:15 PM 0 40 1 0 1 34 0 0 0 0 0 0 0 0 1 0 7712:20 PM 0 29 2 0 2 29 0 0 0 0 0 0 1 0 3 0 6612:25 PM 0 34 1 0 2 33 0 0 0 0 0 0 1 0 2 0 7312:30 PM 0 33 0 0 3 32 0 0 0 0 0 0 1 0 2 0 7112:35 PM 0 33 0 0 0 31 0 0 0 0 0 0 4 0 1 0 6912:40 PM 0 31 3 0 4 39 0 0 0 0 0 0 0 0 1 0 7812:45 PM 0 27 0 0 2 28 0 0 0 0 0 0 0 0 5 0 6212:50 PM 0 25 3 0 1 33 0 0 0 0 0 0 0 0 4 0 6612:55 PM 0 20 2 0 1 34 0 0 0 0 0 0 2 0 1 0 60 834
1:00 PM 0 28 2 0 2 36 0 0 0 0 0 0 2 0 6 0 76 8461:05 PM 0 30 1 0 2 27 0 0 0 0 0 0 2 0 3 0 65 8521:10 PM 0 27 1 0 3 45 0 0 0 0 0 0 0 0 1 0 77 8401:15 PM 0 23 1 0 2 41 0 0 0 0 0 0 0 0 3 0 70 8331:20 PM 0 32 3 0 2 45 0 0 0 0 0 0 0 0 6 0 88 8551:25 PM 0 30 0 0 3 39 0 0 0 0 0 0 0 0 1 0 73 8551:30 PM 0 26 1 0 3 25 0 0 0 0 0 0 0 0 2 0 57 8411:35 PM 0 37 0 0 4 40 0 0 0 0 0 0 0 0 4 0 85 8571:40 PM 0 39 2 0 1 44 0 0 0 0 0 0 1 0 0 0 87 8661:45 PM 0 39 3 0 2 50 0 0 0 0 0 0 0 0 2 0 96 9001:50 PM 0 24 3 0 4 41 0 0 0 0 0 0 1 0 3 0 76 9101:55 PM 0 31 0 0 1 37 0 0 0 0 0 0 0 0 2 0 71 921
Peak 15-Min Northbound Southbound Eastbound WestboundTotalFlowrates Left Thru Right U Left Thru Right U Left Thru Right U Left Thru Right U
All Vehicles 0 476 16 0 24 380 0 0 0 0 0 0 8 0 24 0 928Heavy Trucks 0 16 4 0 8 0 0 0 0 0 0 0 28Pedestrians 0 0 8 0 8
Bicycles 0 0 0 0 0 0 0 0 0 0 0 0 0Railroad
Stopped Buses
Comments: N/A
Peak-Hour: 12:00 PM -- 1:00 PMPeak 15-Min: 12:10 PM -- 12:25 PM
0 371 13
233910
0
0
0 10
0
26
384
414
0
36
397
401
36
0
0.00 0.75
0.78
0.95
0.90
0.0 3.2 7.7
0.02.60.0
0.0
0.0
0.0 20.0
0.0
3.8
3.4
2.4
0.0
8.3
3.3
3.0
2.8
0.0
0
0
2 0
0 3 0
000
0
0
0 0
0
0
NA
NA
NA NA
NA
NA
NA NA

Type of peak hour being reported: User-Defined Method for determining peak hour: Total Entering Volume
Report generated on 9/18/2015 12:26 PM SOURCE: Quality Counts, LLC (http://www.qualitycounts.net) 1-877-580-2212
LOCATION: S 52nd Ave -- W Washington Ave QC JOB #: 13391904CITY/STATE: Yakima, WA DATE: Sat, May 30 2015
5-Min CountPeriod
Beginning At
S 52nd Ave(Northbound)
S 52nd Ave(Southbound)
W Washington Ave(Eastbound)
W Washington Ave(Westbound)
Total HourlyTotals
Left Thru Right U Left Thru Right U Left Thru Right U Left Thru Right U
12:00 PM 1 0 8 0 0 0 0 0 0 21 1 0 4 35 0 0 7012:05 PM 0 0 5 0 0 0 0 0 0 24 3 0 4 30 0 0 66
12:10 PM 0 0 12 0 0 0 0 0 0 45 1 0 2 32 0 0 9212:15 PM 2 0 8 0 0 0 0 0 0 24 3 0 7 25 0 0 6912:20 PM 2 0 12 0 0 0 0 0 0 24 1 0 3 31 0 0 7312:25 PM 1 0 3 0 0 0 0 0 0 30 3 0 4 30 0 0 7112:30 PM 3 0 6 0 0 0 0 0 0 24 2 0 5 31 0 0 7112:35 PM 0 0 7 0 0 0 0 0 0 30 1 0 4 31 0 0 7312:40 PM 0 0 4 0 0 0 0 0 0 28 0 0 7 30 0 0 6912:45 PM 2 0 4 0 0 0 0 0 0 24 5 0 5 25 0 0 6512:50 PM 1 0 4 0 0 0 0 0 0 23 1 0 2 26 0 0 5712:55 PM 3 0 2 0 0 0 0 0 0 24 1 0 7 30 0 0 67 843
1:00 PM 1 0 6 0 0 0 0 0 0 25 5 0 10 29 0 0 76 8491:05 PM 2 0 2 0 0 0 0 0 0 23 0 0 1 24 0 0 52 8351:10 PM 1 0 7 0 0 0 0 0 0 25 3 0 8 42 0 0 86 8291:15 PM 1 0 5 0 0 0 0 0 0 25 2 0 4 38 0 0 75 8351:20 PM 3 0 5 0 0 0 0 0 0 23 0 0 7 38 0 0 76 8381:25 PM 0 0 2 0 0 0 0 0 0 30 7 0 7 32 0 0 78 8451:30 PM 5 0 4 0 0 0 0 0 0 23 3 0 8 17 0 0 60 8341:35 PM 2 0 6 0 0 0 0 0 0 26 0 0 10 29 0 0 73 8341:40 PM 1 0 5 0 0 0 0 0 0 41 2 0 6 38 0 0 93 8581:45 PM 1 0 7 0 0 0 0 0 0 30 3 0 6 46 0 0 93 8861:50 PM 3 0 2 0 0 0 0 0 0 28 4 0 7 34 0 0 78 9071:55 PM 0 0 3 0 0 0 0 0 0 26 6 0 8 31 0 0 74 914
Peak 15-Min Northbound Southbound Eastbound WestboundTotalFlowrates Left Thru Right U Left Thru Right U Left Thru Right U Left Thru Right U
All Vehicles 16 0 128 0 0 0 0 0 0 372 20 0 48 352 0 0 936Heavy Trucks 4 0 4 0 0 0 0 24 0 4 4 0 40Pedestrians 0 0 0 0 0
Bicycles 0 0 0 0 0 0 0 0 0 0 0 0 0Railroad
Stopped Buses
Comments: N/A
Peak-Hour: 12:00 PM -- 1:00 PMPeak 15-Min: 12:10 PM -- 12:25 PM
15 0 75
000
0
321
22 54
356
0
90
0
343
410
0
76
396
371
0.86 0.95
0.63
0.00
0.90
26.7 0.0 4.0
0.00.00.0
0.0
3.7
0.0 3.7
2.5
0.0
7.8
0.0
3.5
2.7
0.0
2.6
3.8
3.5
0
2
0 0
0 0 4
000
0
0
0 1
0
0
NA
NA
NA NA
NA
NA
NA NA

Type of peak hour being reported: User-Defined Method for determining peak hour: Total Entering Volume
Report generated on 9/18/2015 12:26 PM SOURCE: Quality Counts, LLC (http://www.qualitycounts.net) 1-877-580-2212
LOCATION: S 52nd Ave -- Ahtanum Rd QC JOB #: 13391906CITY/STATE: Yakima, WA DATE: Sat, May 30 2015
5-Min CountPeriod
Beginning At
S 52nd Ave(Northbound)
S 52nd Ave(Southbound)
Ahtanum Rd(Eastbound)
Ahtanum Rd(Westbound)
Total HourlyTotals
Left Thru Right U Left Thru Right U Left Thru Right U Left Thru Right U
12:00 PM 0 0 0 0 3 0 4 0 2 25 0 0 0 20 2 0 5612:05 PM 0 0 0 0 0 0 3 0 3 20 0 0 0 18 0 0 44
12:10 PM 0 0 0 0 3 0 1 0 11 39 0 0 0 21 3 0 7812:15 PM 0 0 0 0 3 0 3 0 5 37 0 0 0 9 2 0 5912:20 PM 0 0 0 0 1 0 4 0 5 22 0 0 0 35 3 0 7012:25 PM 0 0 0 0 2 0 1 0 4 31 0 0 0 15 1 0 5412:30 PM 0 0 0 0 2 0 2 0 3 14 0 0 0 24 2 0 4712:35 PM 0 0 0 0 2 0 2 0 4 30 0 0 0 23 4 0 6512:40 PM 0 0 0 0 1 0 3 0 3 24 0 0 0 28 0 0 5912:45 PM 0 0 0 0 4 0 2 0 2 16 0 0 0 20 0 0 4412:50 PM 0 0 0 0 1 0 1 0 1 12 0 0 0 21 0 0 3612:55 PM 0 0 0 0 0 0 4 0 0 23 0 0 0 19 2 0 48 660
1:00 PM 0 0 0 0 5 0 2 0 3 14 0 0 0 14 1 0 39 6431:05 PM 0 0 0 0 2 0 2 0 1 13 0 0 0 14 1 0 33 6321:10 PM 0 0 0 0 0 0 2 0 5 23 0 0 0 34 4 0 68 6221:15 PM 0 0 0 0 0 0 4 0 8 22 0 0 0 15 1 0 50 6131:20 PM 0 0 0 0 2 0 4 0 1 17 0 0 0 22 5 0 51 5941:25 PM 0 0 0 0 6 0 1 0 3 19 0 0 0 17 2 0 48 5881:30 PM 0 0 0 0 4 0 4 0 3 18 0 0 0 14 3 0 46 5871:35 PM 0 0 0 0 3 0 5 0 2 23 0 0 0 15 2 0 50 5721:40 PM 0 0 0 0 2 0 4 0 5 14 0 0 0 21 1 0 47 5601:45 PM 0 0 0 0 1 0 4 0 2 19 0 0 0 15 1 0 42 5581:50 PM 0 0 0 0 0 0 0 0 2 28 0 0 0 18 4 0 52 5741:55 PM 0 0 0 0 5 0 3 0 2 12 0 0 0 23 0 0 45 571
Peak 15-Min Northbound Southbound Eastbound WestboundTotalFlowrates Left Thru Right U Left Thru Right U Left Thru Right U Left Thru Right U
All Vehicles 0 0 0 0 28 0 32 0 84 392 0 0 0 260 32 0 828Heavy Trucks 0 0 0 0 0 0 0 28 0 0 12 8 48Pedestrians 0 0 0 0 0
Bicycles 0 0 0 0 0 0 0 0 0 0 0 3 3Railroad
Stopped Buses
Comments: N/A
Peak-Hour: 12:00 PM -- 1:00 PMPeak 15-Min: 12:10 PM -- 12:25 PM
0 0 0
22030
43
293
0 0
253
19
0
52
336
272
62
0
315
283
0.71 0.84
0.00
0.87
0.80
0.0 0.0 0.0
0.00.00.0
0.0
5.5
0.0 0.0
4.0
21.1
0.0
0.0
4.8
5.1
6.5
0.0
5.1
3.5
0
0
0 0
0 0 0
000
0
0
0 0
1
3
NA
NA
NA NA
NA
NA
NA NA

Type of peak hour being reported: User-Defined Method for determining peak hour: Total Entering Volume
Report generated on 9/18/2015 12:26 PM SOURCE: Quality Counts, LLC (http://www.qualitycounts.net) 1-877-580-2212
LOCATION: S 38th Ave -- Ahtanum Rd QC JOB #: 13391908CITY/STATE: Yakima, WA DATE: Sat, May 30 2015
5-Min CountPeriod
Beginning At
S 38th Ave(Northbound)
S 38th Ave(Southbound)
Ahtanum Rd(Eastbound)
Ahtanum Rd(Westbound)
Total HourlyTotals
Left Thru Right U Left Thru Right U Left Thru Right U Left Thru Right U
12:00 PM 0 0 0 0 2 0 0 0 1 24 0 0 0 22 0 0 4912:05 PM 0 0 0 0 0 0 0 0 0 26 0 0 0 17 1 0 44
12:10 PM 0 0 0 0 2 0 2 0 1 32 0 0 0 21 2 0 6012:15 PM 0 0 0 0 2 0 1 0 2 42 0 0 0 16 1 0 6412:20 PM 0 0 0 0 0 0 0 0 0 28 0 0 0 30 2 0 6012:25 PM 0 0 0 0 1 0 0 0 1 27 0 0 0 18 0 0 4712:30 PM 0 0 0 0 3 0 0 0 0 20 0 0 0 28 2 0 5312:35 PM 0 0 0 0 1 0 1 0 1 27 0 0 0 24 1 0 5512:40 PM 0 0 0 0 3 0 0 0 1 24 0 0 0 25 1 0 5412:45 PM 0 0 0 0 1 0 1 0 2 19 0 0 0 22 2 0 4712:50 PM 0 0 0 0 1 0 0 0 0 14 0 0 0 23 2 0 4012:55 PM 0 0 0 0 1 0 0 0 1 18 0 0 0 15 0 0 35 608
1:00 PM 0 0 0 0 2 0 0 0 1 18 0 0 0 18 1 0 40 5991:05 PM 0 0 0 0 1 0 2 0 1 19 0 0 0 19 2 0 44 5991:10 PM 0 0 0 0 1 0 2 0 1 13 0 0 0 28 1 0 46 5851:15 PM 0 0 0 0 2 0 2 0 1 27 0 0 0 20 0 0 52 5731:20 PM 0 0 0 0 0 0 0 0 1 12 0 0 0 28 0 0 41 5541:25 PM 0 0 0 0 1 0 0 0 0 26 0 0 0 21 1 0 49 5561:30 PM 0 0 0 0 1 0 1 0 1 21 0 0 0 15 0 0 39 5421:35 PM 0 0 0 0 3 0 0 0 0 23 0 0 0 18 1 0 45 5321:40 PM 0 0 0 0 2 0 2 0 1 21 0 0 0 19 1 0 46 5241:45 PM 0 0 0 0 1 0 1 0 0 21 0 0 0 13 1 0 37 5141:50 PM 0 0 0 0 2 0 0 0 1 26 0 0 0 24 1 0 54 5281:55 PM 0 0 0 0 1 0 0 0 1 17 0 0 0 25 0 0 44 537
Peak 15-Min Northbound Southbound Eastbound WestboundTotalFlowrates Left Thru Right U Left Thru Right U Left Thru Right U Left Thru Right U
All Vehicles 0 0 0 0 16 0 12 0 12 408 0 0 0 268 20 0 736Heavy Trucks 0 0 0 4 0 0 0 28 0 0 28 0 60Pedestrians 0 0 0 0 0
Bicycles 0 0 0 0 0 0 0 0 0 0 0 0 0Railroad
Stopped Buses
Comments: N/A
Peak-Hour: 12:00 PM -- 1:00 PMPeak 15-Min: 12:10 PM -- 12:25 PM
0 0 0
1705
10
301
0 0
261
14
0
22
311
275
24
0
318
266
0.74 0.85
0.00
0.69
0.83
0.0 0.0 0.0
11.80.00.0
0.0
5.6
0.0 0.0
6.1
0.0
0.0
9.1
5.5
5.8
0.0
0.0
6.0
6.0
0
0
0 0
0 0 0
000
0
0
0 0
0
0
NA
NA
NA NA
NA
NA
NA NA

Type of peak hour being reported: User-Defined Method for determining peak hour: Total Entering Volume
Report generated on 9/18/2015 12:26 PM SOURCE: Quality Counts, LLC (http://www.qualitycounts.net) 1-877-580-2212
LOCATION: S 16th Ave -- Ahtanum Rd QC JOB #: 13391910CITY/STATE: Yakima, WA DATE: Sat, May 30 2015
5-Min CountPeriod
Beginning At
S 16th Ave(Northbound)
S 16th Ave(Southbound)
Ahtanum Rd(Eastbound)
Ahtanum Rd(Westbound)
Total HourlyTotals
Left Thru Right U Left Thru Right U Left Thru Right U Left Thru Right U
12:00 PM 0 3 4 0 6 0 5 0 6 17 1 0 0 17 5 0 6412:05 PM 1 7 1 0 5 3 7 0 6 23 0 0 0 21 3 0 7712:10 PM 0 1 1 0 3 2 2 0 7 23 0 0 0 10 6 0 55
12:15 PM 2 3 1 0 10 1 3 0 4 32 1 0 1 23 6 0 8712:20 PM 2 1 2 0 3 0 2 0 9 26 1 0 4 24 4 0 7812:25 PM 1 3 2 0 8 3 5 0 4 23 1 0 0 16 6 0 7212:30 PM 1 0 3 0 4 1 3 0 9 21 1 0 1 21 2 0 6712:35 PM 1 3 3 0 4 4 2 0 4 17 1 0 1 29 8 0 7712:40 PM 1 1 0 0 7 1 1 0 3 23 1 0 1 20 9 0 6812:45 PM 6 3 5 0 6 1 3 0 4 20 1 0 0 13 8 0 7012:50 PM 1 3 0 0 6 4 5 0 4 16 2 0 1 23 7 0 7212:55 PM 0 4 1 0 4 2 2 0 2 15 2 0 0 14 1 0 47 834
1:00 PM 1 2 1 0 5 3 3 0 3 19 1 0 1 24 4 0 67 8371:05 PM 1 1 0 0 2 1 4 0 5 17 1 0 0 18 6 0 56 8161:10 PM 0 3 1 0 3 3 2 0 3 8 0 0 1 21 5 0 50 8111:15 PM 1 0 1 0 4 3 2 0 4 27 1 0 1 23 6 0 73 7971:20 PM 1 3 2 0 2 3 5 0 2 15 0 0 0 19 6 0 58 7771:25 PM 0 1 0 0 4 2 3 0 3 17 2 0 0 19 6 0 57 7621:30 PM 1 2 2 0 9 0 1 0 2 17 1 0 2 16 8 0 61 7561:35 PM 0 2 0 0 7 5 1 0 13 17 2 0 0 16 3 0 66 7451:40 PM 0 1 3 0 2 3 3 0 5 17 0 0 0 16 4 0 54 7311:45 PM 1 4 1 0 5 3 2 0 2 17 2 0 0 17 3 0 57 7181:50 PM 0 2 2 0 5 2 4 0 5 15 0 0 0 25 5 0 65 7111:55 PM 0 3 0 0 5 1 1 0 3 22 1 0 0 19 0 0 55 719
Peak 15-Min Northbound Southbound Eastbound WestboundTotalFlowrates Left Thru Right U Left Thru Right U Left Thru Right U Left Thru Right U
All Vehicles 20 28 20 0 84 16 40 0 68 324 12 0 20 252 64 0 948Heavy Trucks 0 0 0 4 4 4 8 24 0 0 12 4 60Pedestrians 0 0 0 0 0
Bicycles 0 0 0 0 0 0 0 0 0 0 0 0 0Railroad
Stopped Buses
Comments: N/A
Peak-Hour: 12:00 PM -- 1:00 PMPeak 15-Min: 12:15 PM -- 12:30 PM
16 32 23
662240
62
256
12 9
231
65
71
128
330
305
159
43
345
287
0.80 0.83
0.77
0.89
0.88
12.5 6.3 4.3
1.59.110.0
6.5
5.9
0.0 0.0
4.8
4.6
7.0
5.5
5.8
4.6
5.7
4.7
4.9
5.9
0
0
0 0
0 0 0
000
0
0
0 0
0
0
NA
NA
NA NA
NA
NA
NA NA

Type of peak hour being reported: User-Defined Method for determining peak hour: Total Entering Volume
Report generated on 9/18/2015 12:26 PM SOURCE: Quality Counts, LLC (http://www.qualitycounts.net) 1-877-580-2212
LOCATION: S 16th Ave -- W Valley Mall Blvd QC JOB #: 13391912CITY/STATE: Yakima, WA DATE: Sat, May 30 2015
5-Min CountPeriod
Beginning At
S 16th Ave(Northbound)
S 16th Ave(Southbound)
W Valley Mall Blvd(Eastbound)
W Valley Mall Blvd(Westbound)
Total HourlyTotals
Left Thru Right U Left Thru Right U Left Thru Right U Left Thru Right U
12:00 PM 14 0 2 0 0 0 0 0 0 34 9 0 5 42 0 0 10612:05 PM 10 0 6 0 0 0 0 0 0 46 11 0 2 32 0 0 10712:10 PM 9 0 7 0 0 0 0 0 0 33 13 0 1 41 0 0 10412:15 PM 9 0 3 0 0 0 0 0 0 33 4 0 2 37 0 0 8812:20 PM 10 0 5 0 0 0 0 0 0 31 3 0 1 38 0 0 88
12:25 PM 8 0 2 0 0 0 0 0 0 33 13 0 5 54 0 0 11512:30 PM 9 0 6 0 0 0 0 0 0 39 3 0 2 42 0 0 10112:35 PM 11 0 1 0 0 0 0 0 0 46 7 0 4 37 0 0 10612:40 PM 9 0 3 0 0 0 0 0 0 33 13 0 0 34 0 0 9212:45 PM 15 0 3 0 0 0 0 0 0 43 7 0 2 42 0 0 11212:50 PM 9 0 2 0 0 0 0 0 0 29 12 0 5 34 0 0 9112:55 PM 6 0 3 0 0 0 0 0 0 50 4 0 3 40 0 0 106 1216
1:00 PM 7 0 1 0 0 0 0 0 0 35 7 0 1 31 0 1 83 11931:05 PM 8 0 0 0 0 0 0 0 0 35 6 0 3 39 0 0 91 11771:10 PM 11 0 2 0 0 0 0 0 0 36 5 1 4 36 0 0 95 11681:15 PM 9 0 2 0 0 0 0 0 0 35 5 0 3 36 0 0 90 11701:20 PM 10 0 3 0 0 0 0 0 0 29 6 0 3 43 0 0 94 11761:25 PM 5 0 2 0 0 0 0 0 0 37 10 0 3 34 0 0 91 11521:30 PM 11 0 3 0 0 0 0 0 0 40 7 0 2 39 0 0 102 11531:35 PM 12 0 3 0 0 0 0 0 0 39 9 0 2 40 0 0 105 11521:40 PM 15 0 4 0 0 0 0 0 0 40 6 0 1 38 0 0 104 11641:45 PM 8 0 1 0 0 0 0 0 0 33 10 0 2 37 0 0 91 11431:50 PM 5 0 4 0 0 0 0 0 0 35 7 0 3 36 0 0 90 11421:55 PM 5 0 3 0 0 0 0 0 0 31 4 0 1 31 0 0 75 1111
Peak 15-Min Northbound Southbound Eastbound WestboundTotalFlowrates Left Thru Right U Left Thru Right U Left Thru Right U Left Thru Right U
All Vehicles 112 0 36 0 0 0 0 0 0 472 92 0 44 532 0 0 1288Heavy Trucks 8 0 4 0 0 0 0 8 0 0 0 0 20Pedestrians 0 0 0 0 0
Bicycles 0 0 0 0 0 0 0 0 0 0 0 0 0Railroad
Stopped Buses
Comments: N/A
Peak-Hour: 12:00 PM -- 1:00 PMPeak 15-Min: 12:25 PM -- 12:40 PM
119 0 43
000
0
450
99 32
473
0
162
0
549
505
0
131
493
592
0.92 0.88
0.84
0.00
0.94
5.9 0.0 4.7
0.00.00.0
0.0
0.9
4.0 6.3
0.2
0.0
5.6
0.0
1.5
0.6
0.0
4.6
1.2
1.4
0
0
0 0
0 0 0
000
0
1
0 0
0
0
NA
NA
NA NA
NA
NA
NA NA

Appendix B 2015 Existing Traffic Conditions
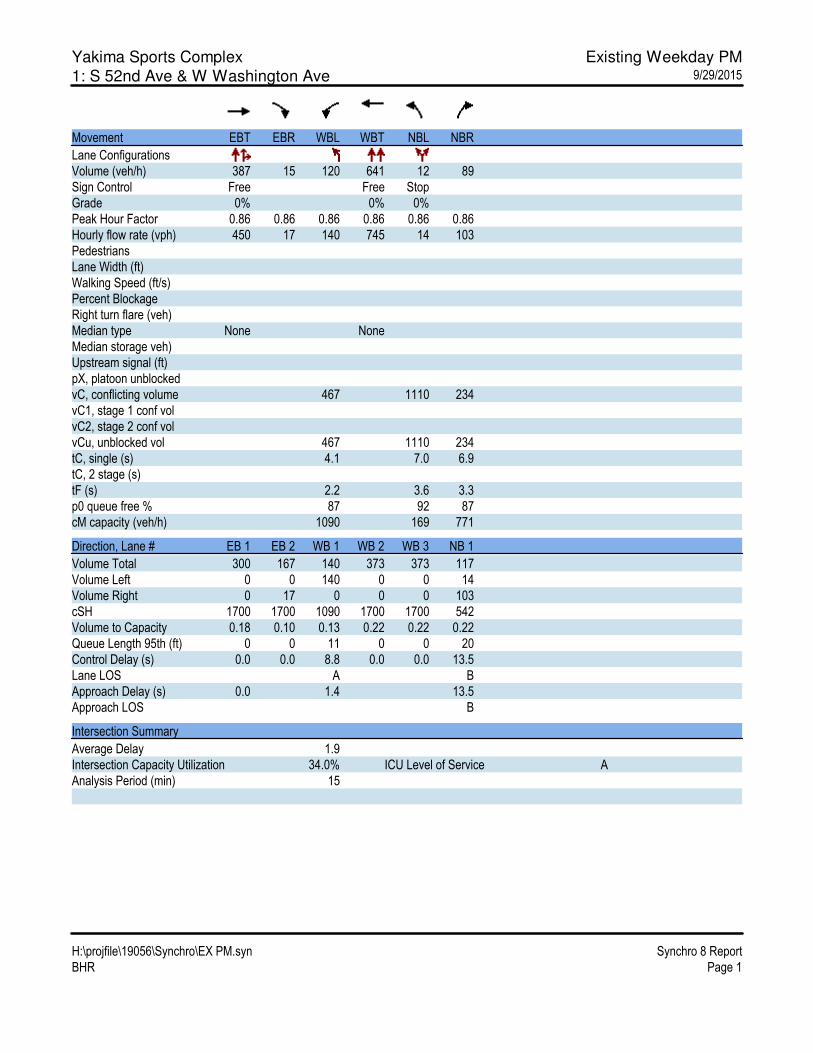
Yakima Sports Complex Existing Weekday PM1: S 52nd Ave & W Washington Ave 9/29/2015
H:\projfile\19056\Synchro\EX PM.syn Synchro 8 Report
BHR Page 1
Movement EBT EBR WBL WBT NBL NBR
Lane Configurations
Volume (veh/h) 387 15 120 641 12 89
Sign Control Free Free Stop
Grade 0% 0% 0%
Peak Hour Factor 0.86 0.86 0.86 0.86 0.86 0.86
Hourly flow rate (vph) 450 17 140 745 14 103
Pedestrians
Lane Width (ft)
Walking Speed (ft/s)
Percent Blockage
Right turn flare (veh)
Median type None None
Median storage veh)
Upstream signal (ft)
pX, platoon unblocked
vC, conflicting volume 467 1110 234
vC1, stage 1 conf vol
vC2, stage 2 conf vol
vCu, unblocked vol 467 1110 234
tC, single (s) 4.1 7.0 6.9
tC, 2 stage (s)
tF (s) 2.2 3.6 3.3
p0 queue free % 87 92 87
cM capacity (veh/h) 1090 169 771
Direction, Lane # EB 1 EB 2 WB 1 WB 2 WB 3 NB 1
Volume Total 300 167 140 373 373 117
Volume Left 0 0 140 0 0 14
Volume Right 0 17 0 0 0 103
cSH 1700 1700 1090 1700 1700 542
Volume to Capacity 0.18 0.10 0.13 0.22 0.22 0.22
Queue Length 95th (ft) 0 0 11 0 0 20
Control Delay (s) 0.0 0.0 8.8 0.0 0.0 13.5
Lane LOS A B
Approach Delay (s) 0.0 1.4 13.5
Approach LOS B
Intersection Summary
Average Delay 1.9
Intersection Capacity Utilization 34.0% ICU Level of Service A
Analysis Period (min) 15

Yakima Sports Complex Existing Weekday PM2: W Washington Ave & S 48th Ave 9/29/2015
H:\projfile\19056\Synchro\EX PM.syn Synchro 8 Report
BHR Page 2
Movement WBL WBR NBT NBR SBL SBT
Lane Configurations
Volume (veh/h) 4 88 548 24 32 864
Sign Control Stop Free Free
Grade 0% 0% 0%
Peak Hour Factor 1.00 1.00 1.00 1.00 1.00 1.00
Hourly flow rate (vph) 4 88 548 24 32 864
Pedestrians 1
Lane Width (ft) 12.0
Walking Speed (ft/s) 4.0
Percent Blockage 0
Right turn flare (veh)
Median type None None
Median storage veh)
Upstream signal (ft)
pX, platoon unblocked
vC, conflicting volume 1057 287 573
vC1, stage 1 conf vol
vC2, stage 2 conf vol
vCu, unblocked vol 1057 287 573
tC, single (s) 6.8 6.9 4.2
tC, 2 stage (s)
tF (s) 3.5 3.3 2.2
p0 queue free % 98 88 97
cM capacity (veh/h) 216 715 981
Direction, Lane # WB 1 NB 1 NB 2 SB 1 SB 2 SB 3
Volume Total 92 365 207 32 432 432
Volume Left 4 0 0 32 0 0
Volume Right 88 0 24 0 0 0
cSH 650 1700 1700 981 1700 1700
Volume to Capacity 0.14 0.21 0.12 0.03 0.25 0.25
Queue Length 95th (ft) 12 0 0 3 0 0
Control Delay (s) 11.5 0.0 0.0 8.8 0.0 0.0
Lane LOS B A
Approach Delay (s) 11.5 0.0 0.3
Approach LOS B
Intersection Summary
Average Delay 0.9
Intersection Capacity Utilization 36.2% ICU Level of Service A
Analysis Period (min) 15

Yakima Sports Complex Existing Weekday PM3: S 16th Ave & W Valley Mall Blvd 9/29/2015
H:\projfile\19056\Synchro\EX PM.syn Synchro 8 Report
BHR Page 3
Movement EBT EBR WBL WBT NBL NBR
Lane Configurations
Volume (vph) 571 200 66 654 190 35
Ideal Flow (vphpl) 1900 1900 1900 1900 1900 1900
Total Lost time (s) 4.9 4.0 4.9 4.9 4.6 4.6
Lane Util. Factor 0.95 1.00 1.00 0.95 1.00 1.00
Frt 1.00 0.85 1.00 1.00 1.00 0.85
Flt Protected 1.00 1.00 0.95 1.00 0.95 1.00
Satd. Flow (prot) 3539 1583 1752 3574 1752 1568
Flt Permitted 1.00 1.00 0.42 1.00 0.95 1.00
Satd. Flow (perm) 3539 1583 768 3574 1752 1568
Peak-hour factor, PHF 0.92 0.92 0.92 0.92 0.92 0.92
Adj. Flow (vph) 621 217 72 711 207 38
RTOR Reduction (vph) 0 0 0 0 0 27
Lane Group Flow (vph) 621 217 72 711 207 11
Heavy Vehicles (%) 2% 2% 3% 1% 3% 3%
Turn Type NA Free Perm NA Prot Perm
Protected Phases 2 6 8
Permitted Phases Free 6 8
Actuated Green, G (s) 17.1 37.0 17.1 17.1 10.4 10.4
Effective Green, g (s) 17.1 37.0 17.1 17.1 10.4 10.4
Actuated g/C Ratio 0.46 1.00 0.46 0.46 0.28 0.28
Clearance Time (s) 4.9 4.9 4.9 4.6 4.6
Vehicle Extension (s) 4.0 3.0 3.0 3.5 3.5
Lane Grp Cap (vph) 1635 1583 354 1651 492 440
v/s Ratio Prot 0.18 c0.20 c0.12
v/s Ratio Perm 0.14 0.09 0.01
v/c Ratio 0.38 0.14 0.20 0.43 0.42 0.02
Uniform Delay, d1 6.5 0.0 5.9 6.7 10.8 9.6
Progression Factor 1.00 1.00 1.00 1.00 1.00 1.00
Incremental Delay, d2 0.2 0.2 0.3 0.2 0.7 0.0
Delay (s) 6.7 0.2 6.2 6.9 11.5 9.7
Level of Service A A A A B A
Approach Delay (s) 5.0 6.8 11.2
Approach LOS A A B
Intersection Summary
HCM 2000 Control Delay 6.6 HCM 2000 Level of Service A
HCM 2000 Volume to Capacity ratio 0.43
Actuated Cycle Length (s) 37.0 Sum of lost time (s) 9.5
Intersection Capacity Utilization 46.6% ICU Level of Service A
Analysis Period (min) 15
c Critical Lane Group

Yakima Sports Complex Existing Weekday PM4: Ahtanum Rd & S 52nd Ave 9/29/2015
H:\projfile\19056\Synchro\EX PM.syn Synchro 8 Report
BHR Page 4
Movement EBL EBT WBT WBR SBL SBR
Lane Configurations
Volume (veh/h) 47 266 514 39 23 83
Sign Control Free Free Stop
Grade 0% 0% 0%
Peak Hour Factor 0.91 0.91 0.91 0.91 0.91 0.91
Hourly flow rate (vph) 52 292 565 43 25 91
Pedestrians
Lane Width (ft)
Walking Speed (ft/s)
Percent Blockage
Right turn flare (veh)
Median type None None
Median storage veh)
Upstream signal (ft)
pX, platoon unblocked
vC, conflicting volume 608 982 586
vC1, stage 1 conf vol
vC2, stage 2 conf vol
vCu, unblocked vol 608 982 586
tC, single (s) 4.1 6.4 6.2
tC, 2 stage (s)
tF (s) 2.2 3.5 3.3
p0 queue free % 95 90 82
cM capacity (veh/h) 981 260 512
Direction, Lane # EB 1 EB 2 WB 1 SB 1
Volume Total 52 292 608 116
Volume Left 52 0 0 25
Volume Right 0 0 43 91
cSH 981 1700 1700 423
Volume to Capacity 0.05 0.17 0.36 0.28
Queue Length 95th (ft) 4 0 0 28
Control Delay (s) 8.9 0.0 0.0 16.7
Lane LOS A C
Approach Delay (s) 1.3 0.0 16.7
Approach LOS C
Intersection Summary
Average Delay 2.3
Intersection Capacity Utilization 49.1% ICU Level of Service A
Analysis Period (min) 15

Yakima Sports Complex Existing Weekday PM5: Ahtanum Rd & S 38th Ave 9/29/2015
H:\projfile\19056\Synchro\EX PM.syn Synchro 8 Report
BHR Page 5
Movement EBL EBT WBT WBR SBL SBR
Lane Configurations
Volume (veh/h) 8 344 528 56 64 20
Sign Control Free Free Stop
Grade 0% 0% 0%
Peak Hour Factor 1.00 1.00 1.00 1.00 1.00 1.00
Hourly flow rate (vph) 8 344 528 56 64 20
Pedestrians
Lane Width (ft)
Walking Speed (ft/s)
Percent Blockage
Right turn flare (veh)
Median type None None
Median storage veh)
Upstream signal (ft)
pX, platoon unblocked
vC, conflicting volume 584 916 556
vC1, stage 1 conf vol
vC2, stage 2 conf vol
vCu, unblocked vol 584 916 556
tC, single (s) 4.2 6.4 6.2
tC, 2 stage (s)
tF (s) 2.3 3.5 3.3
p0 queue free % 99 79 96
cM capacity (veh/h) 962 300 534
Direction, Lane # EB 1 WB 1 SB 1
Volume Total 352 584 84
Volume Left 8 0 64
Volume Right 0 56 20
cSH 962 1700 335
Volume to Capacity 0.01 0.34 0.25
Queue Length 95th (ft) 1 0 24
Control Delay (s) 0.3 0.0 19.3
Lane LOS A C
Approach Delay (s) 0.3 0.0 19.3
Approach LOS C
Intersection Summary
Average Delay 1.7
Intersection Capacity Utilization 42.6% ICU Level of Service A
Analysis Period (min) 15

Yakima Sports Complex Existing Weekday PM6: S 16th Ave & Ahtanum Rd 9/29/2015
H:\projfile\19056\Synchro\EX PM.syn Synchro 8 Report
BHR Page 6
Movement EBL EBT EBR WBL WBT WBR NBL NBT NBR SBL SBT SBR
Lane Configurations
Volume (vph) 68 286 23 22 459 101 24 56 34 108 50 108
Ideal Flow (vphpl) 1900 1900 1900 1900 1900 1900 1900 1900 1900 1900 1900 1900
Total Lost time (s) 5.0 5.0 5.0 5.0 5.0 5.0 5.0 5.0 5.0 5.0
Lane Util. Factor 1.00 1.00 1.00 1.00 0.95 1.00 1.00 1.00 1.00 1.00
Frpb, ped/bikes 1.00 1.00 1.00 1.00 1.00 1.00 1.00 1.00 1.00 1.00
Flpb, ped/bikes 1.00 1.00 1.00 1.00 1.00 1.00 1.00 1.00 1.00 1.00
Frt 1.00 1.00 0.85 1.00 0.97 1.00 0.94 1.00 1.00 0.85
Flt Protected 0.95 1.00 1.00 0.95 1.00 0.95 1.00 0.95 1.00 1.00
Satd. Flow (prot) 1752 1810 1482 1583 3404 1736 1722 1735 1827 1615
Flt Permitted 0.42 1.00 1.00 0.57 1.00 0.72 1.00 0.69 1.00 1.00
Satd. Flow (perm) 782 1810 1482 955 3404 1319 1722 1268 1827 1615
Peak-hour factor, PHF 0.93 0.93 0.93 0.93 0.93 0.93 0.93 0.93 0.93 0.93 0.93 0.93
Adj. Flow (vph) 73 308 25 24 494 109 26 60 37 116 54 116
RTOR Reduction (vph) 0 0 12 0 30 0 0 29 0 0 0 91
Lane Group Flow (vph) 73 308 13 24 573 0 26 68 0 116 54 25
Confl. Peds. (#/hr) 1 1
Heavy Vehicles (%) 3% 5% 9% 14% 3% 4% 4% 2% 6% 4% 4% 0%
Turn Type Perm NA Perm Perm NA Perm NA Perm NA Perm
Protected Phases 6 2 8 4
Permitted Phases 6 6 2 8 4 4
Actuated Green, G (s) 21.1 21.1 21.1 21.1 21.1 8.6 8.6 8.6 8.6 8.6
Effective Green, g (s) 21.1 21.1 21.1 21.1 21.1 8.6 8.6 8.6 8.6 8.6
Actuated g/C Ratio 0.53 0.53 0.53 0.53 0.53 0.22 0.22 0.22 0.22 0.22
Clearance Time (s) 5.0 5.0 5.0 5.0 5.0 5.0 5.0 5.0 5.0 5.0
Vehicle Extension (s) 3.0 3.0 3.0 3.0 3.0 3.0 3.0 3.0 3.0 3.0
Lane Grp Cap (vph) 415 961 787 507 1809 285 373 274 395 349
v/s Ratio Prot c0.17 0.17 0.04 0.03
v/s Ratio Perm 0.09 0.01 0.03 0.02 c0.09 0.02
v/c Ratio 0.18 0.32 0.02 0.05 0.32 0.09 0.18 0.42 0.14 0.07
Uniform Delay, d1 4.8 5.3 4.4 4.5 5.2 12.4 12.7 13.4 12.6 12.4
Progression Factor 1.00 1.00 1.00 1.00 1.00 1.00 1.00 1.00 1.00 1.00
Incremental Delay, d2 0.2 0.2 0.0 0.0 0.1 0.1 0.2 1.1 0.2 0.1
Delay (s) 5.0 5.4 4.4 4.5 5.3 12.6 12.9 14.5 12.7 12.5
Level of Service A A A A A B B B B B
Approach Delay (s) 5.3 5.3 12.8 13.3
Approach LOS A A B B
Intersection Summary
HCM 2000 Control Delay 7.5 HCM 2000 Level of Service A
HCM 2000 Volume to Capacity ratio 0.35
Actuated Cycle Length (s) 39.7 Sum of lost time (s) 10.0
Intersection Capacity Utilization 56.1% ICU Level of Service B
Analysis Period (min) 15
c Critical Lane Group

Yakima Sports Complex Existing Saturday 1: S 52nd Ave & W Washington Ave 9/29/2015
H:\projfile\19056\Synchro\EX SAT.syn Synchro 8 Report
BHR Page 1
Movement EBT EBR WBL WBT NBL NBR
Lane Configurations
Volume (veh/h) 321 22 54 356 15 75
Sign Control Free Free Stop
Grade 0% 0% 0%
Peak Hour Factor 0.90 0.90 0.90 0.90 0.90 0.90
Hourly flow rate (vph) 357 24 60 396 17 83
Pedestrians
Lane Width (ft)
Walking Speed (ft/s)
Percent Blockage
Right turn flare (veh)
Median type None None
Median storage veh)
Upstream signal (ft)
pX, platoon unblocked
vC, conflicting volume 381 687 191
vC1, stage 1 conf vol
vC2, stage 2 conf vol
vCu, unblocked vol 381 687 191
tC, single (s) 4.2 7.3 7.0
tC, 2 stage (s)
tF (s) 2.2 3.8 3.3
p0 queue free % 95 95 90
cM capacity (veh/h) 1160 313 813
Direction, Lane # EB 1 EB 2 WB 1 WB 2 WB 3 NB 1
Volume Total 238 143 60 198 198 100
Volume Left 0 0 60 0 0 17
Volume Right 0 24 0 0 0 83
cSH 1700 1700 1160 1700 1700 642
Volume to Capacity 0.14 0.08 0.05 0.12 0.12 0.16
Queue Length 95th (ft) 0 0 4 0 0 14
Control Delay (s) 0.0 0.0 8.3 0.0 0.0 11.6
Lane LOS A B
Approach Delay (s) 0.0 1.1 11.6
Approach LOS B
Intersection Summary
Average Delay 1.8
Intersection Capacity Utilization 28.4% ICU Level of Service A
Analysis Period (min) 15

Yakima Sports Complex Existing Saturday 2: W Washington Ave & S 48th Ave 9/29/2015
H:\projfile\19056\Synchro\EX SAT.syn Synchro 8 Report
BHR Page 2
Movement WBL WBR NBT NBR SBL SBT
Lane Configurations
Volume (veh/h) 8 24 476 16 24 380
Sign Control Stop Free Free
Grade 0% 0% 0%
Peak Hour Factor 1.00 1.00 1.00 1.00 1.00 1.00
Hourly flow rate (vph) 8 24 476 16 24 380
Pedestrians
Lane Width (ft)
Walking Speed (ft/s)
Percent Blockage
Right turn flare (veh)
Median type None None
Median storage veh)
Upstream signal (ft)
pX, platoon unblocked
vC, conflicting volume 722 246 492
vC1, stage 1 conf vol
vC2, stage 2 conf vol
vCu, unblocked vol 722 246 492
tC, single (s) 7.2 7.0 4.1
tC, 2 stage (s)
tF (s) 3.7 3.3 2.2
p0 queue free % 97 97 98
cM capacity (veh/h) 318 748 1082
Direction, Lane # WB 1 NB 1 NB 2 SB 1 SB 2 SB 3
Volume Total 32 317 175 24 190 190
Volume Left 8 0 0 24 0 0
Volume Right 24 0 16 0 0 0
cSH 559 1700 1700 1082 1700 1700
Volume to Capacity 0.06 0.19 0.10 0.02 0.11 0.11
Queue Length 95th (ft) 5 0 0 2 0 0
Control Delay (s) 11.8 0.0 0.0 8.4 0.0 0.0
Lane LOS B A
Approach Delay (s) 11.8 0.0 0.5
Approach LOS B
Intersection Summary
Average Delay 0.6
Intersection Capacity Utilization 29.9% ICU Level of Service A
Analysis Period (min) 15

Yakima Sports Complex Existing Saturday 3: S 16th Ave & W Valley Mall Blvd 9/29/2015
H:\projfile\19056\Synchro\EX SAT.syn Synchro 8 Report
BHR Page 3
Movement EBT EBR WBL WBT NBL NBR
Lane Configurations
Volume (vph) 450 99 32 473 119 43
Ideal Flow (vphpl) 1900 1900 1900 1900 1900 1900
Total Lost time (s) 4.9 4.0 4.9 4.9 4.6 4.6
Lane Util. Factor 0.95 1.00 1.00 0.95 1.00 1.00
Frpb, ped/bikes 1.00 0.98 1.00 1.00 1.00 1.00
Flpb, ped/bikes 1.00 1.00 1.00 1.00 1.00 1.00
Frt 1.00 0.85 1.00 1.00 1.00 0.85
Flt Protected 1.00 1.00 0.95 1.00 0.95 1.00
Satd. Flow (prot) 3574 1521 1703 3610 1703 1538
Flt Permitted 1.00 1.00 0.48 1.00 0.95 1.00
Satd. Flow (perm) 3574 1521 857 3610 1703 1538
Peak-hour factor, PHF 0.94 0.94 0.94 0.94 0.94 0.94
Adj. Flow (vph) 479 105 34 503 127 46
RTOR Reduction (vph) 0 0 0 0 0 36
Lane Group Flow (vph) 479 105 34 503 127 10
Confl. Bikes (#/hr) 1
Heavy Vehicles (%) 1% 4% 6% 0% 6% 5%
Turn Type NA Free Perm NA Prot Perm
Protected Phases 2 6 8
Permitted Phases Free 6 8
Actuated Green, G (s) 16.1 32.5 16.1 16.1 6.9 6.9
Effective Green, g (s) 16.1 32.5 16.1 16.1 6.9 6.9
Actuated g/C Ratio 0.50 1.00 0.50 0.50 0.21 0.21
Clearance Time (s) 4.9 4.9 4.9 4.6 4.6
Vehicle Extension (s) 4.0 3.0 3.0 3.5 3.5
Lane Grp Cap (vph) 1770 1521 424 1788 361 326
v/s Ratio Prot 0.13 c0.14 c0.07
v/s Ratio Perm 0.07 0.04 0.01
v/c Ratio 0.27 0.07 0.08 0.28 0.35 0.03
Uniform Delay, d1 4.8 0.0 4.3 4.8 10.9 10.1
Progression Factor 1.00 1.00 1.00 1.00 1.00 1.00
Incremental Delay, d2 0.1 0.1 0.1 0.1 0.7 0.0
Delay (s) 4.9 0.1 4.4 4.9 11.6 10.2
Level of Service A A A A B B
Approach Delay (s) 4.0 4.9 11.2
Approach LOS A A B
Intersection Summary
HCM 2000 Control Delay 5.3 HCM 2000 Level of Service A
HCM 2000 Volume to Capacity ratio 0.30
Actuated Cycle Length (s) 32.5 Sum of lost time (s) 9.5
Intersection Capacity Utilization 39.4% ICU Level of Service A
Analysis Period (min) 15
c Critical Lane Group

Yakima Sports Complex Existing Saturday 4: Ahtanum Rd & S 52nd Ave 9/29/2015
H:\projfile\19056\Synchro\EX SAT.syn Synchro 8 Report
BHR Page 4
Movement EBL EBT WBT WBR SBL SBR
Lane Configurations
Volume (veh/h) 43 293 253 19 22 30
Sign Control Free Free Stop
Grade 0% 0% 0%
Peak Hour Factor 0.80 0.80 0.80 0.80 0.80 0.80
Hourly flow rate (vph) 54 366 316 24 28 38
Pedestrians
Lane Width (ft)
Walking Speed (ft/s)
Percent Blockage
Right turn flare (veh)
Median type None None
Median storage veh)
Upstream signal (ft)
pX, platoon unblocked
vC, conflicting volume 340 802 328
vC1, stage 1 conf vol
vC2, stage 2 conf vol
vCu, unblocked vol 340 802 328
tC, single (s) 4.1 6.4 6.2
tC, 2 stage (s)
tF (s) 2.2 3.5 3.3
p0 queue free % 96 92 95
cM capacity (veh/h) 1230 340 718
Direction, Lane # EB 1 EB 2 WB 1 SB 1
Volume Total 54 366 340 65
Volume Left 54 0 0 28
Volume Right 0 0 24 38
cSH 1230 1700 1700 489
Volume to Capacity 0.04 0.22 0.20 0.13
Queue Length 95th (ft) 3 0 0 11
Control Delay (s) 8.1 0.0 0.0 13.5
Lane LOS A B
Approach Delay (s) 1.0 0.0 13.5
Approach LOS B
Intersection Summary
Average Delay 1.6
Intersection Capacity Utilization 31.1% ICU Level of Service A
Analysis Period (min) 15

Yakima Sports Complex Existing Saturday 5: Ahtanum Rd & S 38th Ave 9/29/2015
H:\projfile\19056\Synchro\EX SAT.syn Synchro 8 Report
BHR Page 5
Movement EBL EBT WBT WBR SBL SBR
Lane Configurations
Volume (veh/h) 12 408 268 20 16 12
Sign Control Free Free Stop
Grade 0% 0% 0%
Peak Hour Factor 1.00 1.00 1.00 1.00 1.00 1.00
Hourly flow rate (vph) 12 408 268 20 16 12
Pedestrians
Lane Width (ft)
Walking Speed (ft/s)
Percent Blockage
Right turn flare (veh)
Median type None None
Median storage veh)
Upstream signal (ft)
pX, platoon unblocked
vC, conflicting volume 288 710 278
vC1, stage 1 conf vol
vC2, stage 2 conf vol
vCu, unblocked vol 288 710 278
tC, single (s) 4.1 6.5 6.2
tC, 2 stage (s)
tF (s) 2.2 3.6 3.3
p0 queue free % 99 96 98
cM capacity (veh/h) 1286 382 766
Direction, Lane # EB 1 WB 1 SB 1
Volume Total 420 288 28
Volume Left 12 0 16
Volume Right 0 20 12
cSH 1286 1700 486
Volume to Capacity 0.01 0.17 0.06
Queue Length 95th (ft) 1 0 5
Control Delay (s) 0.3 0.0 12.9
Lane LOS A B
Approach Delay (s) 0.3 0.0 12.9
Approach LOS B
Intersection Summary
Average Delay 0.7
Intersection Capacity Utilization 41.1% ICU Level of Service A
Analysis Period (min) 15

Yakima Sports Complex Existing Saturday 6: S 16th Ave & Ahtanum Rd 9/29/2015
H:\projfile\19056\Synchro\EX SAT.syn Synchro 8 Report
BHR Page 6
Movement EBL EBT EBR WBL WBT WBR NBL NBT NBR SBL SBT SBR
Lane Configurations
Volume (vph) 63 256 12 9 231 66 16 33 23 68 22 41
Ideal Flow (vphpl) 1900 1900 1900 1900 1900 1900 1900 1900 1900 1900 1900 1900
Total Lost time (s) 5.0 5.0 5.0 5.0 5.0 5.0 5.0 5.0 5.0 5.0
Lane Util. Factor 1.00 1.00 1.00 1.00 0.95 1.00 1.00 1.00 1.00 1.00
Frt 1.00 1.00 0.85 1.00 0.97 1.00 0.94 1.00 1.00 0.85
Flt Protected 0.95 1.00 1.00 0.95 1.00 0.95 1.00 0.95 1.00 1.00
Satd. Flow (prot) 1703 1792 1615 1805 3323 1612 1696 1770 1743 1468
Flt Permitted 0.55 1.00 1.00 0.58 1.00 0.74 1.00 0.72 1.00 1.00
Satd. Flow (perm) 984 1792 1615 1105 3323 1257 1696 1332 1743 1468
Peak-hour factor, PHF 0.88 0.88 0.88 0.88 0.88 0.88 0.88 0.88 0.88 0.88 0.88 0.88
Adj. Flow (vph) 72 291 14 10 262 75 18 38 26 77 25 47
RTOR Reduction (vph) 0 0 6 0 31 0 0 22 0 0 0 40
Lane Group Flow (vph) 72 291 8 10 306 0 18 42 0 77 25 7
Heavy Vehicles (%) 6% 6% 0% 0% 5% 5% 12% 6% 4% 2% 9% 10%
Turn Type Perm NA Perm Perm NA Perm NA Perm NA Perm
Protected Phases 6 2 8 4
Permitted Phases 6 6 2 8 4 4
Actuated Green, G (s) 22.7 22.7 22.7 22.7 22.7 5.7 5.7 5.7 5.7 5.7
Effective Green, g (s) 22.7 22.7 22.7 22.7 22.7 5.7 5.7 5.7 5.7 5.7
Actuated g/C Ratio 0.59 0.59 0.59 0.59 0.59 0.15 0.15 0.15 0.15 0.15
Clearance Time (s) 5.0 5.0 5.0 5.0 5.0 5.0 5.0 5.0 5.0 5.0
Vehicle Extension (s) 3.0 3.0 3.0 3.0 3.0 3.0 3.0 3.0 3.0 3.0
Lane Grp Cap (vph) 581 1059 954 653 1964 186 251 197 258 217
v/s Ratio Prot c0.16 0.09 0.02 0.01
v/s Ratio Perm 0.07 0.01 0.01 0.01 c0.06 0.00
v/c Ratio 0.12 0.27 0.01 0.02 0.16 0.10 0.17 0.39 0.10 0.03
Uniform Delay, d1 3.5 3.8 3.2 3.2 3.5 14.1 14.3 14.8 14.1 14.0
Progression Factor 1.00 1.00 1.00 1.00 1.00 1.00 1.00 1.00 1.00 1.00
Incremental Delay, d2 0.1 0.1 0.0 0.0 0.0 0.2 0.3 1.3 0.2 0.1
Delay (s) 3.6 4.0 3.2 3.2 3.6 14.4 14.6 16.1 14.3 14.1
Level of Service A A A A A B B B B B
Approach Delay (s) 3.9 3.6 14.5 15.1
Approach LOS A A B B
Intersection Summary
HCM 2000 Control Delay 6.4 HCM 2000 Level of Service A
HCM 2000 Volume to Capacity ratio 0.30
Actuated Cycle Length (s) 38.4 Sum of lost time (s) 10.0
Intersection Capacity Utilization 52.9% ICU Level of Service A
Analysis Period (min) 15
c Critical Lane Group

Appendix C Crash Data
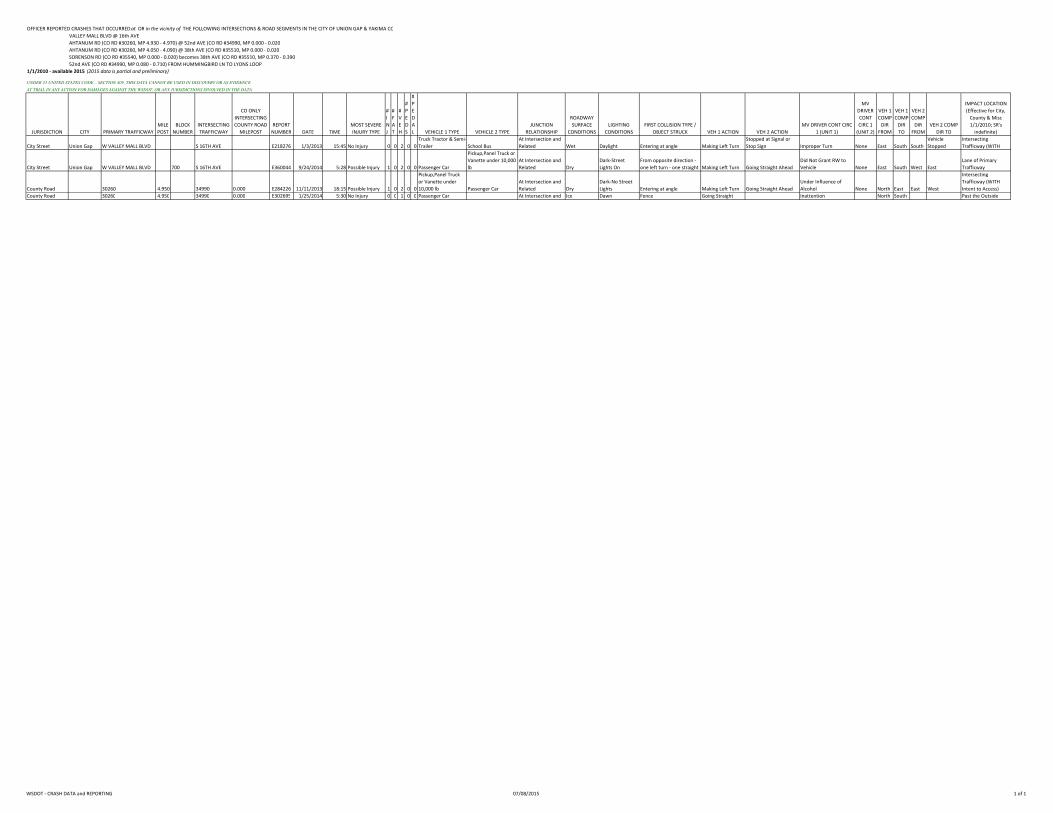
OFFICER REPORTED CRASHES THAT OCCURRED at OR in the vicinity of THE FOLLOWING INTERSECTIONS & ROAD SEGMENTS IN THE CITY OF UNION GAP & YAKIMA CO
VALLEY MALL BLVD @ 16th AVE
AHTANUM RD (CO RD #30260, MP 4.930 - 4.970) @ 52nd AVE (CO RD #34990, MP 0.000 - 0.020)
AHTANUM RD (CO RD #30260, MP 4.050 - 4.090) @ 38th AVE (CO RD #35510, MP 0.000 - 0.020)
SORENSON RD (CO RD #35540, MP 0.000 - 0.020) becomes 38th AVE (CO RD #35510, MP 0.370 - 0.390)
52nd AVE (CO RD #34990, MP 0.080 - 0.710) FROM HUMMINGBIRD LN TO LYONS LOOP
1/1/2010 - available 2015 (2015 data is partial and preliminary)
UNDER 23 UNITED STATES CODE – SECTION 409, THIS DATA CANNOT BE USED IN DISCOVERY OR AS EVIDENCE
AT TRIAL IN ANY ACTION FOR DAMAGES AGAINST THE WSDOT, OR ANY JURISDICTIONS INVOLVED IN THE DATA
JURISDICTION CITY PRIMARY TRAFFICWAY
MILE
POST
BLOCK
NUMBER
INTERSECTING
TRAFFICWAY
CO ONLY
INTERSECTING
COUNTY ROAD
MILEPOST
REPORT
NUMBER DATE TIME
MOST SEVERE
INJURY TYPE
#
I
N
J
#
F
A
T
#
V
E
H
#
P
E
D
S
#
P
E
D
A
L VEHICLE 1 TYPE VEHICLE 2 TYPE
JUNCTION
RELATIONSHIP
ROADWAY
SURFACE
CONDITIONS
LIGHTING
CONDITIONS
FIRST COLLISION TYPE /
OBJECT STRUCK VEH 1 ACTION VEH 2 ACTION
MV DRIVER CONT CIRC
1 (UNIT 1)
MV
DRIVER
CONT
CIRC 1
(UNIT 2)
VEH 1
COMP
DIR
FROM
VEH 1
COMP
DIR
TO
VEH 2
COMP
DIR
FROM
VEH 2 COMP
DIR TO
IMPACT LOCATION
(Effective for City,
County & Misc
1/1/2010; SR's
indefinite)
City Street Union Gap W VALLEY MALL BLVD S 16TH AVE E218276 1/3/2013 15:45 No Injury 0 0 2 0 0
Truck Tractor & Semi-
Trailer School Bus
At Intersection and
Related Wet Daylight Entering at angle Making Left Turn
Stopped at Signal or
Stop Sign Improper Turn None East South South
Vehicle
Stopped
Intersecting
Trafficway (WITH
City Street Union Gap W VALLEY MALL BLVD 700 S 16TH AVE E360044 9/24/2014 5:28 Possible Injury 1 0 2 0 0 Passenger Car
Pickup,Panel Truck or
Vanette under 10,000
lb
At Intersection and
Related Dry
Dark-Street
Lights On
From opposite direction -
one left turn - one straight Making Left Turn Going Straight Ahead
Did Not Grant RW to
Vehicle None East South West East
Lane of Primary
Trafficway
County Road 30260 4.950 34990 0.000 E284226 11/11/2013 18:15 Possible Injury 1 0 2 0 0
Pickup,Panel Truck
or Vanette under
10,000 lb Passenger Car
At Intersection and
Related Dry
Dark-No Street
Lights Entering at angle Making Left Turn Going Straight Ahead
Under Influence of
Alcohol None North East East West
Intersecting
Trafficway (WITH
Intent to Access)
County Road 30260 4.950 34990 0.000 E302695 1/25/2014 5:30 No Injury 0 0 1 0 0 Passenger Car At Intersection and Ice Dawn Fence Going Straight Inattention North South Past the Outside
WSDOT - CRASH DATA and REPORTING 07/08/2015 1 of 1

JURISDICTION PRIMARY TRAFFICWAY
BLOCK
NUMBER
INTERSECTING
TRAFFICWAY
REPORT
NUMBER DATE TIME
MOST SEVERE
INJURY TYPE # INJ #FAT
#
V
E
H
#
P
E
D
S
#
P
E
D
A
L VEHICLE 1 TYPE VEHICLE 2 TYPE
JUNCTION
RELATIONSHIP
ROADWAY
SURFACE
CONDITIONS
LIGHTING
CONDITIONS
FIRST COLLISION TYPE /
OBJECT STRUCK VEH 1 ACTION VEH 2 ACTION
MV DRIVER CONT CIRC 1 (UNIT
1)
MV DRIVER
CONT CIRC 1
(UNIT 2)
VEH 1
COMP DIR
FROM
VEH 1
COMP DIR
TO
VEH 2
COMP DIR
FROM
VEH 2
COMP DIR
TO
IMPACT LOCATION (Effective
for City, County & Misc
1/1/2010; SR's indefinite)
City Street S 16TH AVE ANTANUM RD 3541185 6/9/2011 11:30 No Injury 0 0 2 0 0
Pickup,Panel Truck or
Vanette under 10,000
lb
Pickup,Panel Truck or Vanette
under 10,000 lb
At Intersection and
Related Dry Daylight
From opposite direction - one
left turn - one straight Making Left Turn Going Straight Ahead Did Not Grant RW to Vehicle None North East South North Lane of Primary Trafficway
City Street S 16TH AVE W AHTANUM RD 3541410 9/4/2012 16:15 No Injury 0 0 2 0 0 Passenger Car
Pickup,Panel Truck or Vanette
under 10,000 lb
At Intersection and
Related Dry Daylight
From opposite direction - one
left turn - one straight Making Left Turn Going Straight Ahead Did Not Grant RW to Vehicle None North East South North Lane of Primary Trafficway
City Street S 16TH AVE 2400 W AHTANUM RD 3541134 5/31/2011 16:40 No Injury 0 0 2 0 0 Passenger Car
Pickup,Panel Truck or Vanette
under 10,000 lb
At Intersection and
Related Dry Daylight
From opposite direction - one
left turn - one straight Making Left Turn Going Straight Ahead Did Not Grant RW to Vehicle None North East South North Lane of Primary Trafficway
City Street S 16TH AVE 2600 W AHTANUM RD 3075140 8/12/2010 20:58 No Injury 0 0 2 0 0 Passenger Car Passenger Car
At Intersection and
Related Dry
Dark-Street Lights
On
From opposite direction - one
left turn - one straight Making Left Turn Going Straight Ahead Did Not Grant RW to Vehicle None North East South North Lane of Primary Trafficway
City Street S 16TH AVE 1500 W AHTANUM RD 3540914 7/14/2011 14:32 No Injury 0 0 2 0 0 Passenger Car Passenger Car
At Intersection and
Related Dry Daylight
From opposite direction - one
left turn - one straight Making Left Turn Going Straight Ahead Did Not Grant RW to Vehicle None North East South North Lane of Primary Trafficway
City Street S 16TH AVE 2600 W AHTANUM RD 3632307 10/8/2013 12:44 No Injury 0 0 2 0 0 Passenger Car
Pickup,Panel Truck or Vanette
under 10,000 lb
At Intersection and
Related Dry Daylight
From opposite direction - one
left turn - one straight Making Left Turn Going Straight Ahead Did Not Grant RW to Vehicle None West North East West Lane of Primary Trafficway
City Street S 16TH AVE 2400 W AHTANUM RD 3543152 4/3/2012 10:38 No Injury 0 0 2 0 0
Pickup,Panel Truck or
Vanette under 10,000
lb
Pickup,Panel Truck or Vanette
under 10,000 lb
At Intersection and
Related Dry Daylight Entering at angle
Going Straight
Ahead Going Straight Ahead
Driver Operating Handheld
Telecommunicat None West East South North Lane of Primary Trafficway
City Street S 16TH AVE 2600 W AHTANUM RD 3368342 5/10/2010 12:35 Possible Injury 1 0 2 0 0
Pickup,Panel Truck or
Vanette under 10,000
lb Truck (Flatbad,Van,etc)
At Intersection and
Related Wet Daylight Entering at angle
Going Straight
Ahead Going Straight Ahead Disregard Stop and Go Light None North South East West Lane of Primary Trafficway
City Street W AHTANUM RD 1600 S 16TH AVE 3610332 10/23/2012 18:25 Possible Injury 1 0 2 0 0
Truck - Double Trailer
Combinations Passenger Car
At Intersection and
Related Dry Dusk Entering at angle
Going Straight
Ahead Making Left Turn Disregard Stop and Go Light None East West North East Lane of Primary Trafficway
City Street W AHTANUM RD 1600 S 16TH AVE 3075290 7/30/2013 17:12 No Injury 0 0 2 0 0 Passenger Car Passenger Car At Intersection and Dry Daylight Entering at angle Going Straight Going Straight Ahead Disregard Stop and Go Light None West East North South Lane of Primary Trafficway
City Street W AHTANUM RD 1600 S 16TH AVE 3368071 5/22/2011 11:50 No Injury 0 0 2 0 0 Passenger Car
Pickup,Panel Truck or Vanette
under 10,000 lb
At Intersection and
Related Dry Daylight
From same direction - both
going straight - one stopped -
rear-end
Going Straight
Ahead Stopped for Traffic Exceeding Reas. Safe Speed None West East West
Vehicle
Stopped Lane of Primary Trafficway
City Street W WASHINGTON AVE 5200 S 52ND AVE 3632018 3/1/2013 7:55 No Injury 0 0 2 0 0 Passenger Car
Pickup,Panel Truck or Vanette
under 10,000 lb
At Intersection and
Related Dry Daylight Entering at angle Making Left Turn Going Straight Ahead Did Not Grant RW to Vehicle None South West West East Lane of Primary Trafficway
City Street W WASHINGTON AVE 5000 S 52ND AVE E431475 6/8/2015 10:30 Possible Injury 1 0 2 0 0 Passenger Car Passenger Car
At Intersection and
Related Dry Daylight
From opposite direction - one
left turn - one straight Making Left Turn Going Straight Ahead Did Not Grant RW to Vehicle None East South West East Lane of Primary Trafficway
City Street W WASHINGTON AVE 5200 S 52ND AVE 2941966 1/30/2013 1:54 Evident Injury 1 0 1 0 0 Passenger Car
At Intersection and
Related Dry
Dark-Street Lights
On Vehicle overturned Making Left Turn Exceeding Reas. Safe Speed East South
Past the Outside Shoulder of
Primary Trafficway
WSDOT - CRASH DATA and REPORTING 07/07/2015 1 of 1

1
Bart Rudolph
From: Brown, Julie <[email protected]>
Sent: Monday, September 14, 2015 9:48 AM
To: Bart Rudolph
Subject: RE: Crash Data
Hi Bart, I took another look at your data and the reports on the excel spreadsheet that show at or within the vicinity of the intersection of 48th Ave @ Washington Ave are for the north-leg of 48th Ave not the south-leg that you were looking for as shown on the map below. Hope this helps…if you have any questions please contact our office. Thanks, Julie
From: Bart Rudolph [mailto:[email protected]]
Sent: Friday, September 11, 2015 4:43 PM
To: Brown, Julie Subject: FW: Crash Data
Hi Julie -
I’m having some difficultly querying the crash data for the S 48th
Ave/S Washington Ave intersection. There appears to
be two intersections that fit this description and the block numbers range from 1600 to 5200 in the data set you
provided. Would it be possible for you to help me query just the crashes for the interaction marked below?

2
Thanks!

3
Bart Rudolph
Senior Planner
Kittelson & Associates, Inc.
Transportation Engineering / Planning
907.443.8107 (direct)
907.952.0785 (cell)
From: Brown, Julie [mailto:[email protected]]
Sent: Tuesday, July 07, 2015 9:51 AM To: Bart Rudolph
Cc: Mahugh, Jim Subject: Crash Data
Hi Bart, Here is the Crash Data you requested, I noticed that a couple of your intersections run through the City of Union Gap and a few in the County. If you need those segments please let me know and I can run just those for you. If you have any questions please contact our office. Thank you,
Julie Brown
WSDOT Crash Data and Reporting Branch 7345 Linderson Way SW PO BOX 47380 Tumwater WA 98504 Desk: 360-570-2464 Fax: 360-570-2449 [email protected]

Appendix D 2017 Background Traffic
Conditions


Yakima Sports Complex Background 2017 Weekday PM1: S 52nd Ave & W Washington Ave 9/29/2015
H:\projfile\19056\Synchro\BG PM.syn Synchro 8 Report
BHR Page 1
Movement EBT EBR WBL WBT NBL NBR
Lane Configurations
Volume (veh/h) 402 16 125 667 12 93
Sign Control Free Free Stop
Grade 0% 0% 0%
Peak Hour Factor 0.86 0.86 0.86 0.86 0.86 0.86
Hourly flow rate (vph) 467 19 145 776 14 108
Pedestrians
Lane Width (ft)
Walking Speed (ft/s)
Percent Blockage
Right turn flare (veh)
Median type None None
Median storage veh)
Upstream signal (ft)
pX, platoon unblocked
vC, conflicting volume 486 1155 243
vC1, stage 1 conf vol
vC2, stage 2 conf vol
vCu, unblocked vol 486 1155 243
tC, single (s) 4.1 7.0 6.9
tC, 2 stage (s)
tF (s) 2.2 3.6 3.3
p0 queue free % 86 91 86
cM capacity (veh/h) 1073 157 761
Direction, Lane # EB 1 EB 2 WB 1 WB 2 WB 3 NB 1
Volume Total 312 174 145 388 388 122
Volume Left 0 0 145 0 0 14
Volume Right 0 19 0 0 0 108
cSH 1700 1700 1073 1700 1700 528
Volume to Capacity 0.18 0.10 0.14 0.23 0.23 0.23
Queue Length 95th (ft) 0 0 12 0 0 22
Control Delay (s) 0.0 0.0 8.9 0.0 0.0 13.9
Lane LOS A B
Approach Delay (s) 0.0 1.4 13.9
Approach LOS B
Intersection Summary
Average Delay 2.0
Intersection Capacity Utilization 35.0% ICU Level of Service A
Analysis Period (min) 15

Yakima Sports Complex Background 2017 Weekday PM2: W Washington Ave & S 48th Ave 9/29/2015
H:\projfile\19056\Synchro\BG PM.syn Synchro 8 Report
BHR Page 2
Movement WBL WBR NBT NBR SBL SBT
Lane Configurations
Volume (veh/h) 4 92 570 25 33 900
Sign Control Stop Free Free
Grade 0% 0% 0%
Peak Hour Factor 1.00 1.00 1.00 1.00 1.00 1.00
Hourly flow rate (vph) 4 92 570 25 33 900
Pedestrians 1
Lane Width (ft) 12.0
Walking Speed (ft/s) 4.0
Percent Blockage 0
Right turn flare (veh)
Median type None None
Median storage veh)
Upstream signal (ft)
pX, platoon unblocked
vC, conflicting volume 1100 298 596
vC1, stage 1 conf vol
vC2, stage 2 conf vol
vCu, unblocked vol 1100 298 596
tC, single (s) 6.8 6.9 4.2
tC, 2 stage (s)
tF (s) 3.5 3.3 2.2
p0 queue free % 98 87 97
cM capacity (veh/h) 202 703 962
Direction, Lane # WB 1 NB 1 NB 2 SB 1 SB 2 SB 3
Volume Total 96 380 215 33 450 450
Volume Left 4 0 0 33 0 0
Volume Right 92 0 25 0 0 0
cSH 637 1700 1700 962 1700 1700
Volume to Capacity 0.15 0.22 0.13 0.03 0.26 0.26
Queue Length 95th (ft) 13 0 0 3 0 0
Control Delay (s) 11.6 0.0 0.0 8.9 0.0 0.0
Lane LOS B A
Approach Delay (s) 11.6 0.0 0.3
Approach LOS B
Intersection Summary
Average Delay 0.9
Intersection Capacity Utilization 37.5% ICU Level of Service A
Analysis Period (min) 15

Yakima Sports Complex Background 2017 Weekday PM3: S 16th Ave & W Valley Mall Blvd 9/29/2015
H:\projfile\19056\Synchro\BG PM.syn Synchro 8 Report
BHR Page 3
Movement EBT EBR WBL WBT NBL NBR
Lane Configurations
Volume (vph) 582 204 69 667 196 38
Ideal Flow (vphpl) 1900 1900 1900 1900 1900 1900
Total Lost time (s) 4.9 4.0 4.9 4.9 4.6 4.6
Lane Util. Factor 0.95 1.00 1.00 0.95 1.00 1.00
Frt 1.00 0.85 1.00 1.00 1.00 0.85
Flt Protected 1.00 1.00 0.95 1.00 0.95 1.00
Satd. Flow (prot) 3539 1583 1752 3574 1752 1568
Flt Permitted 1.00 1.00 0.41 1.00 0.95 1.00
Satd. Flow (perm) 3539 1583 759 3574 1752 1568
Peak-hour factor, PHF 0.92 0.92 0.92 0.92 0.92 0.92
Adj. Flow (vph) 633 222 75 725 213 41
RTOR Reduction (vph) 0 0 0 0 0 29
Lane Group Flow (vph) 633 222 75 725 213 12
Heavy Vehicles (%) 2% 2% 3% 1% 3% 3%
Turn Type NA Free Perm NA Prot Perm
Protected Phases 2 6 8
Permitted Phases Free 6 8
Actuated Green, G (s) 17.3 37.4 17.3 17.3 10.6 10.6
Effective Green, g (s) 17.3 37.4 17.3 17.3 10.6 10.6
Actuated g/C Ratio 0.46 1.00 0.46 0.46 0.28 0.28
Clearance Time (s) 4.9 4.9 4.9 4.6 4.6
Vehicle Extension (s) 4.0 3.0 3.0 3.5 3.5
Lane Grp Cap (vph) 1637 1583 351 1653 496 444
v/s Ratio Prot 0.18 c0.20 c0.12
v/s Ratio Perm 0.14 0.10 0.01
v/c Ratio 0.39 0.14 0.21 0.44 0.43 0.03
Uniform Delay, d1 6.6 0.0 6.0 6.8 10.9 9.7
Progression Factor 1.00 1.00 1.00 1.00 1.00 1.00
Incremental Delay, d2 0.2 0.2 0.3 0.2 0.7 0.0
Delay (s) 6.8 0.2 6.3 7.0 11.6 9.7
Level of Service A A A A B A
Approach Delay (s) 5.1 6.9 11.3
Approach LOS A A B
Intersection Summary
HCM 2000 Control Delay 6.7 HCM 2000 Level of Service A
HCM 2000 Volume to Capacity ratio 0.43
Actuated Cycle Length (s) 37.4 Sum of lost time (s) 9.5
Intersection Capacity Utilization 47.3% ICU Level of Service A
Analysis Period (min) 15
c Critical Lane Group

Yakima Sports Complex Background 2017 Weekday PM4: Ahtanum Rd & S 52nd Ave 9/29/2015
H:\projfile\19056\Synchro\BG PM.syn Synchro 8 Report
BHR Page 4
Movement EBL EBT WBT WBR SBL SBR
Lane Configurations
Volume (veh/h) 48 273 527 40 23 85
Sign Control Free Free Stop
Grade 0% 0% 0%
Peak Hour Factor 0.91 0.91 0.91 0.91 0.91 0.91
Hourly flow rate (vph) 53 300 579 44 25 93
Pedestrians
Lane Width (ft)
Walking Speed (ft/s)
Percent Blockage
Right turn flare (veh)
Median type None None
Median storage veh)
Upstream signal (ft)
pX, platoon unblocked
vC, conflicting volume 623 1007 601
vC1, stage 1 conf vol
vC2, stage 2 conf vol
vCu, unblocked vol 623 1007 601
tC, single (s) 4.1 6.4 6.2
tC, 2 stage (s)
tF (s) 2.2 3.5 3.3
p0 queue free % 95 90 81
cM capacity (veh/h) 968 250 502
Direction, Lane # EB 1 EB 2 WB 1 SB 1
Volume Total 53 300 623 119
Volume Left 53 0 0 25
Volume Right 0 0 44 93
cSH 968 1700 1700 414
Volume to Capacity 0.05 0.18 0.37 0.29
Queue Length 95th (ft) 4 0 0 29
Control Delay (s) 8.9 0.0 0.0 17.2
Lane LOS A C
Approach Delay (s) 1.3 0.0 17.2
Approach LOS C
Intersection Summary
Average Delay 2.3
Intersection Capacity Utilization 50.0% ICU Level of Service A
Analysis Period (min) 15

Yakima Sports Complex Background 2017 Weekday PM5: Ahtanum Rd & S 38th Ave 9/29/2015
H:\projfile\19056\Synchro\BG PM.syn Synchro 8 Report
BHR Page 5
Movement EBL EBT WBT WBR SBL SBR
Lane Configurations
Volume (veh/h) 8 353 542 57 65 20
Sign Control Free Free Stop
Grade 0% 0% 0%
Peak Hour Factor 1.00 1.00 1.00 1.00 1.00 1.00
Hourly flow rate (vph) 8 353 542 57 65 20
Pedestrians
Lane Width (ft)
Walking Speed (ft/s)
Percent Blockage
Right turn flare (veh)
Median type None None
Median storage veh)
Upstream signal (ft)
pX, platoon unblocked
vC, conflicting volume 599 940 570
vC1, stage 1 conf vol
vC2, stage 2 conf vol
vCu, unblocked vol 599 940 570
tC, single (s) 4.2 6.4 6.2
tC, 2 stage (s)
tF (s) 2.3 3.5 3.3
p0 queue free % 99 78 96
cM capacity (veh/h) 949 290 524
Direction, Lane # EB 1 WB 1 SB 1
Volume Total 361 599 85
Volume Left 8 0 65
Volume Right 0 57 20
cSH 949 1700 324
Volume to Capacity 0.01 0.35 0.26
Queue Length 95th (ft) 1 0 26
Control Delay (s) 0.3 0.0 20.0
Lane LOS A C
Approach Delay (s) 0.3 0.0 20.0
Approach LOS C
Intersection Summary
Average Delay 1.7
Intersection Capacity Utilization 43.5% ICU Level of Service A
Analysis Period (min) 15

Yakima Sports Complex Background 2017 Weekday PM6: S 16th Ave & Ahtanum Rd 9/29/2015
H:\projfile\19056\Synchro\BG PM.syn Synchro 8 Report
BHR Page 6
Movement EBL EBT EBR WBL WBT WBR NBL NBT NBR SBL SBT SBR
Lane Configurations
Volume (vph) 73 308 23 22 479 104 24 57 35 110 51 112
Ideal Flow (vphpl) 1900 1900 1900 1900 1900 1900 1900 1900 1900 1900 1900 1900
Total Lost time (s) 5.0 5.0 5.0 5.0 5.0 5.0 5.0 5.0 5.0 5.0
Lane Util. Factor 1.00 1.00 1.00 1.00 0.95 1.00 1.00 1.00 1.00 1.00
Frpb, ped/bikes 1.00 1.00 1.00 1.00 1.00 1.00 1.00 1.00 1.00 1.00
Flpb, ped/bikes 1.00 1.00 1.00 1.00 1.00 1.00 1.00 1.00 1.00 1.00
Frt 1.00 1.00 0.85 1.00 0.97 1.00 0.94 1.00 1.00 0.85
Flt Protected 0.95 1.00 1.00 0.95 1.00 0.95 1.00 0.95 1.00 1.00
Satd. Flow (prot) 1752 1810 1482 1583 3405 1736 1721 1735 1827 1615
Flt Permitted 0.41 1.00 1.00 0.56 1.00 0.72 1.00 0.69 1.00 1.00
Satd. Flow (perm) 764 1810 1482 935 3405 1317 1721 1265 1827 1615
Peak-hour factor, PHF 0.93 0.93 0.93 0.93 0.93 0.93 0.93 0.93 0.93 0.93 0.93 0.93
Adj. Flow (vph) 78 331 25 24 515 112 26 61 38 118 55 120
RTOR Reduction (vph) 0 0 12 0 29 0 0 30 0 0 0 94
Lane Group Flow (vph) 78 331 13 24 598 0 26 69 0 118 55 26
Confl. Peds. (#/hr) 1 1
Heavy Vehicles (%) 3% 5% 9% 14% 3% 4% 4% 2% 6% 4% 4% 0%
Turn Type Perm NA Perm Perm NA Perm NA Perm NA Perm
Protected Phases 6 2 8 4
Permitted Phases 6 6 2 8 4 4
Actuated Green, G (s) 21.2 21.2 21.2 21.2 21.2 8.6 8.6 8.6 8.6 8.6
Effective Green, g (s) 21.2 21.2 21.2 21.2 21.2 8.6 8.6 8.6 8.6 8.6
Actuated g/C Ratio 0.53 0.53 0.53 0.53 0.53 0.22 0.22 0.22 0.22 0.22
Clearance Time (s) 5.0 5.0 5.0 5.0 5.0 5.0 5.0 5.0 5.0 5.0
Vehicle Extension (s) 3.0 3.0 3.0 3.0 3.0 3.0 3.0 3.0 3.0 3.0
Lane Grp Cap (vph) 406 964 789 498 1813 284 371 273 394 348
v/s Ratio Prot c0.18 0.18 0.04 0.03
v/s Ratio Perm 0.10 0.01 0.03 0.02 c0.09 0.02
v/c Ratio 0.19 0.34 0.02 0.05 0.33 0.09 0.19 0.43 0.14 0.07
Uniform Delay, d1 4.8 5.3 4.4 4.5 5.3 12.5 12.7 13.5 12.6 12.4
Progression Factor 1.00 1.00 1.00 1.00 1.00 1.00 1.00 1.00 1.00 1.00
Incremental Delay, d2 0.2 0.2 0.0 0.0 0.1 0.1 0.2 1.1 0.2 0.1
Delay (s) 5.1 5.5 4.4 4.5 5.4 12.6 13.0 14.6 12.8 12.5
Level of Service A A A A A B B B B B
Approach Delay (s) 5.4 5.3 12.9 13.4
Approach LOS A A B B
Intersection Summary
HCM 2000 Control Delay 7.6 HCM 2000 Level of Service A
HCM 2000 Volume to Capacity ratio 0.37
Actuated Cycle Length (s) 39.8 Sum of lost time (s) 10.0
Intersection Capacity Utilization 56.8% ICU Level of Service B
Analysis Period (min) 15
c Critical Lane Group

Yakima Sports Complex Background 2017 Saturday 1: S 52nd Ave & W Washington Ave 9/29/2015
H:\projfile\19056\Synchro\BG SAT.syn Synchro 8 Report
BHR Page 1
Movement EBT EBR WBL WBT NBL NBR
Lane Configurations
Volume (veh/h) 334 23 56 370 16 78
Sign Control Free Free Stop
Grade 0% 0% 0%
Peak Hour Factor 0.90 0.90 0.90 0.90 0.90 0.90
Hourly flow rate (vph) 371 26 62 411 18 87
Pedestrians
Lane Width (ft)
Walking Speed (ft/s)
Percent Blockage
Right turn flare (veh)
Median type None None
Median storage veh)
Upstream signal (ft)
pX, platoon unblocked
vC, conflicting volume 397 714 198
vC1, stage 1 conf vol
vC2, stage 2 conf vol
vCu, unblocked vol 397 714 198
tC, single (s) 4.2 7.3 7.0
tC, 2 stage (s)
tF (s) 2.2 3.8 3.3
p0 queue free % 95 94 89
cM capacity (veh/h) 1144 299 803
Direction, Lane # EB 1 EB 2 WB 1 WB 2 WB 3 NB 1
Volume Total 247 149 62 206 206 104
Volume Left 0 0 62 0 0 18
Volume Right 0 26 0 0 0 87
cSH 1700 1700 1144 1700 1700 624
Volume to Capacity 0.15 0.09 0.05 0.12 0.12 0.17
Queue Length 95th (ft) 0 0 4 0 0 15
Control Delay (s) 0.0 0.0 8.3 0.0 0.0 11.9
Lane LOS A B
Approach Delay (s) 0.0 1.1 11.9
Approach LOS B
Intersection Summary
Average Delay 1.8
Intersection Capacity Utilization 29.0% ICU Level of Service A
Analysis Period (min) 15

Yakima Sports Complex Background 2017 Saturday 2: W Washington Ave & S 48th Ave 9/29/2015
H:\projfile\19056\Synchro\BG SAT.syn Synchro 8 Report
BHR Page 2
Movement WBL WBR NBT NBR SBL SBT
Lane Configurations
Volume (veh/h) 8 25 495 17 25 395
Sign Control Stop Free Free
Grade 0% 0% 0%
Peak Hour Factor 1.00 1.00 1.00 1.00 1.00 1.00
Hourly flow rate (vph) 8 25 495 17 25 395
Pedestrians
Lane Width (ft)
Walking Speed (ft/s)
Percent Blockage
Right turn flare (veh)
Median type None None
Median storage veh)
Upstream signal (ft)
pX, platoon unblocked
vC, conflicting volume 751 256 512
vC1, stage 1 conf vol
vC2, stage 2 conf vol
vCu, unblocked vol 751 256 512
tC, single (s) 7.2 7.0 4.1
tC, 2 stage (s)
tF (s) 3.7 3.3 2.2
p0 queue free % 97 97 98
cM capacity (veh/h) 304 737 1064
Direction, Lane # WB 1 NB 1 NB 2 SB 1 SB 2 SB 3
Volume Total 33 330 182 25 198 198
Volume Left 8 0 0 25 0 0
Volume Right 25 0 17 0 0 0
cSH 548 1700 1700 1064 1700 1700
Volume to Capacity 0.06 0.19 0.11 0.02 0.12 0.12
Queue Length 95th (ft) 5 0 0 2 0 0
Control Delay (s) 12.0 0.0 0.0 8.5 0.0 0.0
Lane LOS B A
Approach Delay (s) 12.0 0.0 0.5
Approach LOS B
Intersection Summary
Average Delay 0.6
Intersection Capacity Utilization 30.8% ICU Level of Service A
Analysis Period (min) 15

Yakima Sports Complex Background 2017 Saturday 3: S 16th Ave & W Valley Mall Blvd 9/29/2015
H:\projfile\19056\Synchro\BG SAT.syn Synchro 8 Report
BHR Page 3
Movement EBT EBR WBL WBT NBL NBR
Lane Configurations
Volume (vph) 459 101 35 482 123 46
Ideal Flow (vphpl) 1900 1900 1900 1900 1900 1900
Total Lost time (s) 4.9 4.0 4.9 4.9 4.6 4.6
Lane Util. Factor 0.95 1.00 1.00 0.95 1.00 1.00
Frpb, ped/bikes 1.00 0.98 1.00 1.00 1.00 1.00
Flpb, ped/bikes 1.00 1.00 1.00 1.00 1.00 1.00
Frt 1.00 0.85 1.00 1.00 1.00 0.85
Flt Protected 1.00 1.00 0.95 1.00 0.95 1.00
Satd. Flow (prot) 3574 1521 1703 3610 1703 1538
Flt Permitted 1.00 1.00 0.47 1.00 0.95 1.00
Satd. Flow (perm) 3574 1521 850 3610 1703 1538
Peak-hour factor, PHF 0.94 0.94 0.94 0.94 0.94 0.94
Adj. Flow (vph) 488 107 37 513 131 49
RTOR Reduction (vph) 0 0 0 0 0 38
Lane Group Flow (vph) 488 107 37 513 131 11
Confl. Bikes (#/hr) 1
Heavy Vehicles (%) 1% 4% 6% 0% 6% 5%
Turn Type NA Free Perm NA Prot Perm
Protected Phases 2 6 8
Permitted Phases Free 6 8
Actuated Green, G (s) 16.0 32.5 16.0 16.0 7.0 7.0
Effective Green, g (s) 16.0 32.5 16.0 16.0 7.0 7.0
Actuated g/C Ratio 0.49 1.00 0.49 0.49 0.22 0.22
Clearance Time (s) 4.9 4.9 4.9 4.6 4.6
Vehicle Extension (s) 4.0 3.0 3.0 3.5 3.5
Lane Grp Cap (vph) 1759 1521 418 1777 366 331
v/s Ratio Prot 0.14 c0.14 c0.08
v/s Ratio Perm 0.07 0.04 0.01
v/c Ratio 0.28 0.07 0.09 0.29 0.36 0.03
Uniform Delay, d1 4.9 0.0 4.4 4.9 10.8 10.1
Progression Factor 1.00 1.00 1.00 1.00 1.00 1.00
Incremental Delay, d2 0.1 0.1 0.1 0.1 0.7 0.0
Delay (s) 5.0 0.1 4.5 5.0 11.6 10.1
Level of Service A A A A B B
Approach Delay (s) 4.1 4.9 11.2
Approach LOS A A B
Intersection Summary
HCM 2000 Control Delay 5.4 HCM 2000 Level of Service A
HCM 2000 Volume to Capacity ratio 0.31
Actuated Cycle Length (s) 32.5 Sum of lost time (s) 9.5
Intersection Capacity Utilization 39.8% ICU Level of Service A
Analysis Period (min) 15
c Critical Lane Group

Yakima Sports Complex Background 2017 Saturday 4: Ahtanum Rd & S 52nd Ave 9/29/2015
H:\projfile\19056\Synchro\BG SAT.syn Synchro 8 Report
BHR Page 4
Movement EBL EBT WBT WBR SBL SBR
Lane Configurations
Volume (veh/h) 44 301 261 19 22 31
Sign Control Free Free Stop
Grade 0% 0% 0%
Peak Hour Factor 0.80 0.80 0.80 0.80 0.80 0.80
Hourly flow rate (vph) 55 376 326 24 28 39
Pedestrians
Lane Width (ft)
Walking Speed (ft/s)
Percent Blockage
Right turn flare (veh)
Median type None None
Median storage veh)
Upstream signal (ft)
pX, platoon unblocked
vC, conflicting volume 350 824 338
vC1, stage 1 conf vol
vC2, stage 2 conf vol
vCu, unblocked vol 350 824 338
tC, single (s) 4.1 6.4 6.2
tC, 2 stage (s)
tF (s) 2.2 3.5 3.3
p0 queue free % 95 92 95
cM capacity (veh/h) 1220 330 709
Direction, Lane # EB 1 EB 2 WB 1 SB 1
Volume Total 55 376 350 66
Volume Left 55 0 0 28
Volume Right 0 0 24 39
cSH 1220 1700 1700 480
Volume to Capacity 0.05 0.22 0.21 0.14
Queue Length 95th (ft) 4 0 0 12
Control Delay (s) 8.1 0.0 0.0 13.7
Lane LOS A B
Approach Delay (s) 1.0 0.0 13.7
Approach LOS B
Intersection Summary
Average Delay 1.6
Intersection Capacity Utilization 31.6% ICU Level of Service A
Analysis Period (min) 15

Yakima Sports Complex Background 2017 Saturday 5: Ahtanum Rd & S 38th Ave 9/29/2015
H:\projfile\19056\Synchro\BG SAT.syn Synchro 8 Report
BHR Page 5
Movement EBL EBT WBT WBR SBL SBR
Lane Configurations
Volume (veh/h) 12 418 276 20 16 12
Sign Control Free Free Stop
Grade 0% 0% 0%
Peak Hour Factor 1.00 1.00 1.00 1.00 1.00 1.00
Hourly flow rate (vph) 12 418 276 20 16 12
Pedestrians
Lane Width (ft)
Walking Speed (ft/s)
Percent Blockage
Right turn flare (veh)
Median type None None
Median storage veh)
Upstream signal (ft)
pX, platoon unblocked
vC, conflicting volume 296 728 286
vC1, stage 1 conf vol
vC2, stage 2 conf vol
vCu, unblocked vol 296 728 286
tC, single (s) 4.1 6.5 6.2
tC, 2 stage (s)
tF (s) 2.2 3.6 3.3
p0 queue free % 99 96 98
cM capacity (veh/h) 1277 373 758
Direction, Lane # EB 1 WB 1 SB 1
Volume Total 430 296 28
Volume Left 12 0 16
Volume Right 0 20 12
cSH 1277 1700 476
Volume to Capacity 0.01 0.17 0.06
Queue Length 95th (ft) 1 0 5
Control Delay (s) 0.3 0.0 13.0
Lane LOS A B
Approach Delay (s) 0.3 0.0 13.0
Approach LOS B
Intersection Summary
Average Delay 0.7
Intersection Capacity Utilization 41.7% ICU Level of Service A
Analysis Period (min) 15

Yakima Sports Complex Background 2017 Saturday 6: S 16th Ave & Ahtanum Rd 9/29/2015
H:\projfile\19056\Synchro\BG SAT.syn Synchro 8 Report
BHR Page 6
Movement EBL EBT EBR WBL WBT WBR NBL NBT NBR SBL SBT SBR
Lane Configurations
Volume (vph) 68 277 12 9 247 67 16 34 23 70 22 44
Ideal Flow (vphpl) 1900 1900 1900 1900 1900 1900 1900 1900 1900 1900 1900 1900
Total Lost time (s) 5.0 5.0 5.0 5.0 5.0 5.0 5.0 5.0 5.0 5.0
Lane Util. Factor 1.00 1.00 1.00 1.00 0.95 1.00 1.00 1.00 1.00 1.00
Frt 1.00 1.00 0.85 1.00 0.97 1.00 0.94 1.00 1.00 0.85
Flt Protected 0.95 1.00 1.00 0.95 1.00 0.95 1.00 0.95 1.00 1.00
Satd. Flow (prot) 1703 1792 1615 1805 3328 1612 1698 1770 1743 1468
Flt Permitted 0.54 1.00 1.00 0.57 1.00 0.74 1.00 0.71 1.00 1.00
Satd. Flow (perm) 965 1792 1615 1081 3328 1257 1698 1331 1743 1468
Peak-hour factor, PHF 0.88 0.88 0.88 0.88 0.88 0.88 0.88 0.88 0.88 0.88 0.88 0.88
Adj. Flow (vph) 77 315 14 10 281 76 18 39 26 80 25 50
RTOR Reduction (vph) 0 0 6 0 31 0 0 22 0 0 0 43
Lane Group Flow (vph) 77 315 8 10 326 0 18 43 0 80 25 7
Heavy Vehicles (%) 6% 6% 0% 0% 5% 5% 12% 6% 4% 2% 9% 10%
Turn Type Perm NA Perm Perm NA Perm NA Perm NA Perm
Protected Phases 6 2 8 4
Permitted Phases 6 6 2 8 4 4
Actuated Green, G (s) 22.4 22.4 22.4 22.4 22.4 5.7 5.7 5.7 5.7 5.7
Effective Green, g (s) 22.4 22.4 22.4 22.4 22.4 5.7 5.7 5.7 5.7 5.7
Actuated g/C Ratio 0.59 0.59 0.59 0.59 0.59 0.15 0.15 0.15 0.15 0.15
Clearance Time (s) 5.0 5.0 5.0 5.0 5.0 5.0 5.0 5.0 5.0 5.0
Vehicle Extension (s) 3.0 3.0 3.0 3.0 3.0 3.0 3.0 3.0 3.0 3.0
Lane Grp Cap (vph) 567 1053 949 635 1956 188 254 199 260 219
v/s Ratio Prot c0.18 0.10 0.03 0.01
v/s Ratio Perm 0.08 0.01 0.01 0.01 c0.06 0.01
v/c Ratio 0.14 0.30 0.01 0.02 0.17 0.10 0.17 0.40 0.10 0.03
Uniform Delay, d1 3.5 3.9 3.3 3.3 3.6 14.0 14.1 14.7 14.0 13.8
Progression Factor 1.00 1.00 1.00 1.00 1.00 1.00 1.00 1.00 1.00 1.00
Incremental Delay, d2 0.1 0.2 0.0 0.0 0.0 0.2 0.3 1.3 0.2 0.1
Delay (s) 3.6 4.1 3.3 3.3 3.6 14.2 14.4 16.0 14.1 13.9
Level of Service A A A A A B B B B B
Approach Delay (s) 4.0 3.6 14.4 15.0
Approach LOS A A B B
Intersection Summary
HCM 2000 Control Delay 6.4 HCM 2000 Level of Service A
HCM 2000 Volume to Capacity ratio 0.32
Actuated Cycle Length (s) 38.1 Sum of lost time (s) 10.0
Intersection Capacity Utilization 53.0% ICU Level of Service A
Analysis Period (min) 15
c Critical Lane Group

Appendix E 2017 Total Traffic Conditions

Yakima Sports Complex Total Weekday PM1: S 52nd Ave & W Washington Ave 10/13/2015
H:\projfile\19056\Synchro\Total PM.syn Synchro 8 Report
BHR Page 1
Movement EBT EBR WBL WBT NBL NBR
Lane Configurations
Volume (veh/h) 425 16 125 678 12 93
Sign Control Free Free Stop
Grade 0% 0% 0%
Peak Hour Factor 0.86 0.86 0.86 0.86 0.86 0.86
Hourly flow rate (vph) 494 19 145 788 14 108
Pedestrians
Lane Width (ft)
Walking Speed (ft/s)
Percent Blockage
Right turn flare (veh)
Median type None None
Median storage veh)
Upstream signal (ft)
pX, platoon unblocked
vC, conflicting volume 513 1188 256
vC1, stage 1 conf vol
vC2, stage 2 conf vol
vCu, unblocked vol 513 1188 256
tC, single (s) 4.1 7.0 6.9
tC, 2 stage (s)
tF (s) 2.2 3.6 3.3
p0 queue free % 86 91 86
cM capacity (veh/h) 1049 148 746
Direction, Lane # EB 1 EB 2 WB 1 WB 2 WB 3 NB 1
Volume Total 329 183 145 394 394 122
Volume Left 0 0 145 0 0 14
Volume Right 0 19 0 0 0 108
cSH 1700 1700 1049 1700 1700 511
Volume to Capacity 0.19 0.11 0.14 0.23 0.23 0.24
Queue Length 95th (ft) 0 0 12 0 0 23
Control Delay (s) 0.0 0.0 9.0 0.0 0.0 14.2
Lane LOS A B
Approach Delay (s) 0.0 1.4 14.2
Approach LOS B
Intersection Summary
Average Delay 1.9
Intersection Capacity Utilization 35.6% ICU Level of Service A
Analysis Period (min) 15

Yakima Sports Complex Total Weekday PM2: W Washington Ave & S 48th Ave 10/13/2015
H:\projfile\19056\Synchro\Total PM.syn Synchro 8 Report
BHR Page 2
Movement WBL WBR NBT NBR SBL SBT
Lane Configurations
Volume (veh/h) 15 136 570 48 123 900
Sign Control Stop Free Free
Grade 0% 0% 0%
Peak Hour Factor 1.00 1.00 1.00 1.00 1.00 1.00
Hourly flow rate (vph) 15 136 570 48 123 900
Pedestrians 1
Lane Width (ft) 12.0
Walking Speed (ft/s) 4.0
Percent Blockage 0
Right turn flare (veh)
Median type None None
Median storage veh)
Upstream signal (ft)
pX, platoon unblocked
vC, conflicting volume 1291 310 619
vC1, stage 1 conf vol
vC2, stage 2 conf vol
vCu, unblocked vol 1291 310 619
tC, single (s) 6.8 6.9 4.2
tC, 2 stage (s)
tF (s) 3.5 3.3 2.2
p0 queue free % 89 80 87
cM capacity (veh/h) 137 691 943
Direction, Lane # WB 1 NB 1 NB 2 SB 1 SB 2 SB 3
Volume Total 151 380 238 123 450 450
Volume Left 15 0 0 123 0 0
Volume Right 136 0 48 0 0 0
cSH 493 1700 1700 943 1700 1700
Volume to Capacity 0.31 0.22 0.14 0.13 0.26 0.26
Queue Length 95th (ft) 32 0 0 11 0 0
Control Delay (s) 15.5 0.0 0.0 9.4 0.0 0.0
Lane LOS C A
Approach Delay (s) 15.5 0.0 1.1
Approach LOS C
Intersection Summary
Average Delay 2.0
Intersection Capacity Utilization 43.3% ICU Level of Service A
Analysis Period (min) 15

Yakima Sports Complex Total Weekday PM3: S 16th Ave & W Valley Mall Blvd 10/13/2015
H:\projfile\19056\Synchro\Total PM.syn Synchro 8 Report
BHR Page 3
Movement EBT EBR WBL WBT NBL NBR
Lane Configurations
Volume (vph) 582 226 125 667 207 66
Ideal Flow (vphpl) 1900 1900 1900 1900 1900 1900
Total Lost time (s) 4.9 4.0 4.9 4.9 4.6 4.6
Lane Util. Factor 0.95 1.00 1.00 0.95 1.00 1.00
Frt 1.00 0.85 1.00 1.00 1.00 0.85
Flt Protected 1.00 1.00 0.95 1.00 0.95 1.00
Satd. Flow (prot) 3539 1583 1752 3574 1752 1568
Flt Permitted 1.00 1.00 0.41 1.00 0.95 1.00
Satd. Flow (perm) 3539 1583 759 3574 1752 1568
Peak-hour factor, PHF 0.92 0.92 0.92 0.92 0.92 0.92
Adj. Flow (vph) 633 246 136 725 225 72
RTOR Reduction (vph) 0 0 0 0 0 51
Lane Group Flow (vph) 633 246 136 725 225 21
Heavy Vehicles (%) 2% 2% 3% 1% 3% 3%
Turn Type NA Free Perm NA Prot Perm
Protected Phases 2 6 8
Permitted Phases Free 6 8
Actuated Green, G (s) 18.3 38.9 18.3 18.3 11.1 11.1
Effective Green, g (s) 18.3 38.9 18.3 18.3 11.1 11.1
Actuated g/C Ratio 0.47 1.00 0.47 0.47 0.29 0.29
Clearance Time (s) 4.9 4.9 4.9 4.6 4.6
Vehicle Extension (s) 4.0 3.0 3.0 3.5 3.5
Lane Grp Cap (vph) 1664 1583 357 1681 499 447
v/s Ratio Prot 0.18 c0.20 c0.13
v/s Ratio Perm 0.16 0.18 0.01
v/c Ratio 0.38 0.16 0.38 0.43 0.45 0.05
Uniform Delay, d1 6.6 0.0 6.6 6.8 11.4 10.1
Progression Factor 1.00 1.00 1.00 1.00 1.00 1.00
Incremental Delay, d2 0.2 0.2 0.7 0.2 0.8 0.1
Delay (s) 6.8 0.2 7.3 7.0 12.2 10.1
Level of Service A A A A B B
Approach Delay (s) 5.0 7.1 11.7
Approach LOS A A B
Intersection Summary
HCM 2000 Control Delay 6.8 HCM 2000 Level of Service A
HCM 2000 Volume to Capacity ratio 0.44
Actuated Cycle Length (s) 38.9 Sum of lost time (s) 9.5
Intersection Capacity Utilization 47.9% ICU Level of Service A
Analysis Period (min) 15
c Critical Lane Group

Yakima Sports Complex Total Weekday PM4: Ahtanum Rd & S 52nd Ave 10/13/2015
H:\projfile\19056\Synchro\Total PM.syn Synchro 8 Report
BHR Page 4
Movement EBL EBT WBT WBR SBL SBR
Lane Configurations
Volume (veh/h) 48 284 533 40 23 85
Sign Control Free Free Stop
Grade 0% 0% 0%
Peak Hour Factor 0.91 0.91 0.91 0.91 0.91 0.91
Hourly flow rate (vph) 53 312 586 44 25 93
Pedestrians
Lane Width (ft)
Walking Speed (ft/s)
Percent Blockage
Right turn flare (veh)
Median type None None
Median storage veh)
Upstream signal (ft)
pX, platoon unblocked
vC, conflicting volume 630 1025 608
vC1, stage 1 conf vol
vC2, stage 2 conf vol
vCu, unblocked vol 630 1025 608
tC, single (s) 4.1 6.4 6.2
tC, 2 stage (s)
tF (s) 2.2 3.5 3.3
p0 queue free % 95 90 81
cM capacity (veh/h) 962 244 498
Direction, Lane # EB 1 EB 2 WB 1 SB 1
Volume Total 53 312 630 119
Volume Left 53 0 0 25
Volume Right 0 0 44 93
cSH 962 1700 1700 407
Volume to Capacity 0.05 0.18 0.37 0.29
Queue Length 95th (ft) 4 0 0 30
Control Delay (s) 9.0 0.0 0.0 17.4
Lane LOS A C
Approach Delay (s) 1.3 0.0 17.4
Approach LOS C
Intersection Summary
Average Delay 2.3
Intersection Capacity Utilization 50.3% ICU Level of Service A
Analysis Period (min) 15

Yakima Sports Complex Total Weekday PM5: Ahtanum Rd & S 38th Ave 10/13/2015
H:\projfile\19056\Synchro\Total PM.syn Synchro 8 Report
BHR Page 5
Movement EBL EBT WBT WBR SBL SBR
Lane Configurations
Volume (veh/h) 19 353 542 158 115 26
Sign Control Free Free Stop
Grade 0% 0% 0%
Peak Hour Factor 1.00 1.00 1.00 1.00 1.00 1.00
Hourly flow rate (vph) 19 353 542 158 115 26
Pedestrians
Lane Width (ft)
Walking Speed (ft/s)
Percent Blockage
Right turn flare (veh)
Median type None None
Median storage veh)
Upstream signal (ft)
pX, platoon unblocked
vC, conflicting volume 700 1012 621
vC1, stage 1 conf vol
vC2, stage 2 conf vol
vCu, unblocked vol 700 1012 621
tC, single (s) 4.2 6.4 6.2
tC, 2 stage (s)
tF (s) 2.3 3.5 3.3
p0 queue free % 98 56 95
cM capacity (veh/h) 870 259 491
Direction, Lane # EB 1 WB 1 SB 1
Volume Total 372 700 141
Volume Left 19 0 115
Volume Right 0 158 26
cSH 870 1700 284
Volume to Capacity 0.02 0.41 0.50
Queue Length 95th (ft) 2 0 65
Control Delay (s) 0.7 0.0 29.5
Lane LOS A D
Approach Delay (s) 0.7 0.0 29.5
Approach LOS D
Intersection Summary
Average Delay 3.7
Intersection Capacity Utilization 52.8% ICU Level of Service A
Analysis Period (min) 15
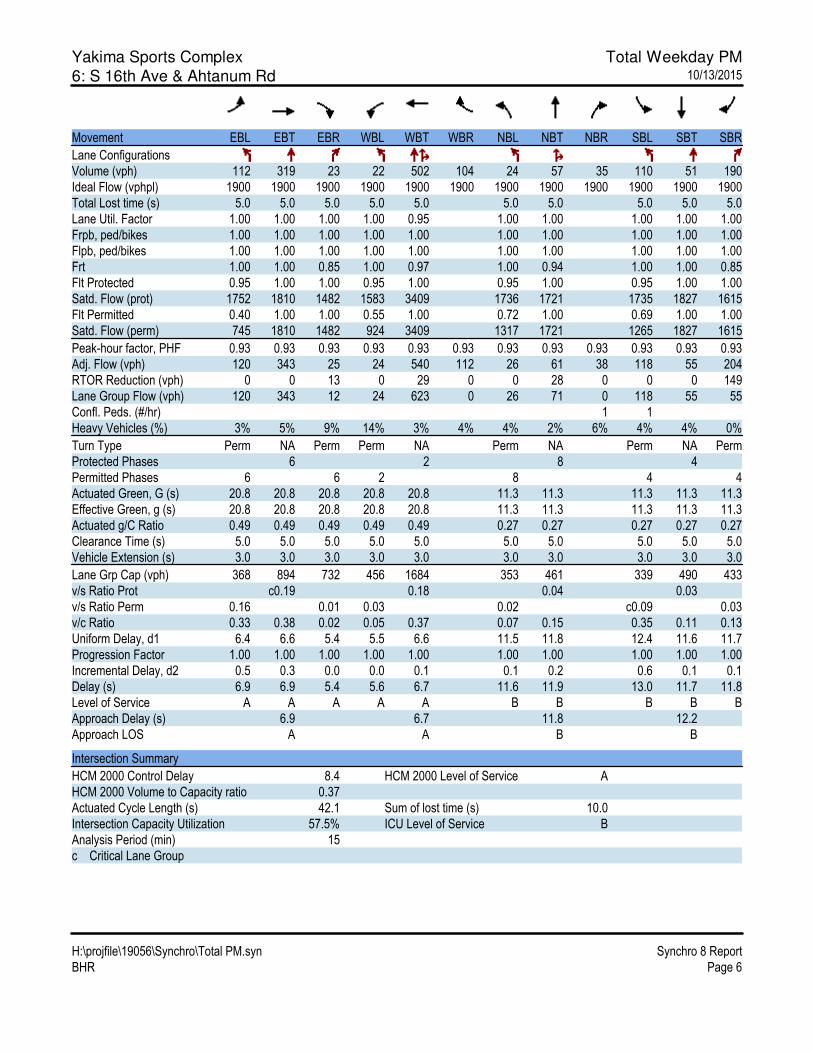
Yakima Sports Complex Total Weekday PM6: S 16th Ave & Ahtanum Rd 10/13/2015
H:\projfile\19056\Synchro\Total PM.syn Synchro 8 Report
BHR Page 6
Movement EBL EBT EBR WBL WBT WBR NBL NBT NBR SBL SBT SBR
Lane Configurations
Volume (vph) 112 319 23 22 502 104 24 57 35 110 51 190
Ideal Flow (vphpl) 1900 1900 1900 1900 1900 1900 1900 1900 1900 1900 1900 1900
Total Lost time (s) 5.0 5.0 5.0 5.0 5.0 5.0 5.0 5.0 5.0 5.0
Lane Util. Factor 1.00 1.00 1.00 1.00 0.95 1.00 1.00 1.00 1.00 1.00
Frpb, ped/bikes 1.00 1.00 1.00 1.00 1.00 1.00 1.00 1.00 1.00 1.00
Flpb, ped/bikes 1.00 1.00 1.00 1.00 1.00 1.00 1.00 1.00 1.00 1.00
Frt 1.00 1.00 0.85 1.00 0.97 1.00 0.94 1.00 1.00 0.85
Flt Protected 0.95 1.00 1.00 0.95 1.00 0.95 1.00 0.95 1.00 1.00
Satd. Flow (prot) 1752 1810 1482 1583 3409 1736 1721 1735 1827 1615
Flt Permitted 0.40 1.00 1.00 0.55 1.00 0.72 1.00 0.69 1.00 1.00
Satd. Flow (perm) 745 1810 1482 924 3409 1317 1721 1265 1827 1615
Peak-hour factor, PHF 0.93 0.93 0.93 0.93 0.93 0.93 0.93 0.93 0.93 0.93 0.93 0.93
Adj. Flow (vph) 120 343 25 24 540 112 26 61 38 118 55 204
RTOR Reduction (vph) 0 0 13 0 29 0 0 28 0 0 0 149
Lane Group Flow (vph) 120 343 12 24 623 0 26 71 0 118 55 55
Confl. Peds. (#/hr) 1 1
Heavy Vehicles (%) 3% 5% 9% 14% 3% 4% 4% 2% 6% 4% 4% 0%
Turn Type Perm NA Perm Perm NA Perm NA Perm NA Perm
Protected Phases 6 2 8 4
Permitted Phases 6 6 2 8 4 4
Actuated Green, G (s) 20.8 20.8 20.8 20.8 20.8 11.3 11.3 11.3 11.3 11.3
Effective Green, g (s) 20.8 20.8 20.8 20.8 20.8 11.3 11.3 11.3 11.3 11.3
Actuated g/C Ratio 0.49 0.49 0.49 0.49 0.49 0.27 0.27 0.27 0.27 0.27
Clearance Time (s) 5.0 5.0 5.0 5.0 5.0 5.0 5.0 5.0 5.0 5.0
Vehicle Extension (s) 3.0 3.0 3.0 3.0 3.0 3.0 3.0 3.0 3.0 3.0
Lane Grp Cap (vph) 368 894 732 456 1684 353 461 339 490 433
v/s Ratio Prot c0.19 0.18 0.04 0.03
v/s Ratio Perm 0.16 0.01 0.03 0.02 c0.09 0.03
v/c Ratio 0.33 0.38 0.02 0.05 0.37 0.07 0.15 0.35 0.11 0.13
Uniform Delay, d1 6.4 6.6 5.4 5.5 6.6 11.5 11.8 12.4 11.6 11.7
Progression Factor 1.00 1.00 1.00 1.00 1.00 1.00 1.00 1.00 1.00 1.00
Incremental Delay, d2 0.5 0.3 0.0 0.0 0.1 0.1 0.2 0.6 0.1 0.1
Delay (s) 6.9 6.9 5.4 5.6 6.7 11.6 11.9 13.0 11.7 11.8
Level of Service A A A A A B B B B B
Approach Delay (s) 6.9 6.7 11.8 12.2
Approach LOS A A B B
Intersection Summary
HCM 2000 Control Delay 8.4 HCM 2000 Level of Service A
HCM 2000 Volume to Capacity ratio 0.37
Actuated Cycle Length (s) 42.1 Sum of lost time (s) 10.0
Intersection Capacity Utilization 57.5% ICU Level of Service B
Analysis Period (min) 15
c Critical Lane Group
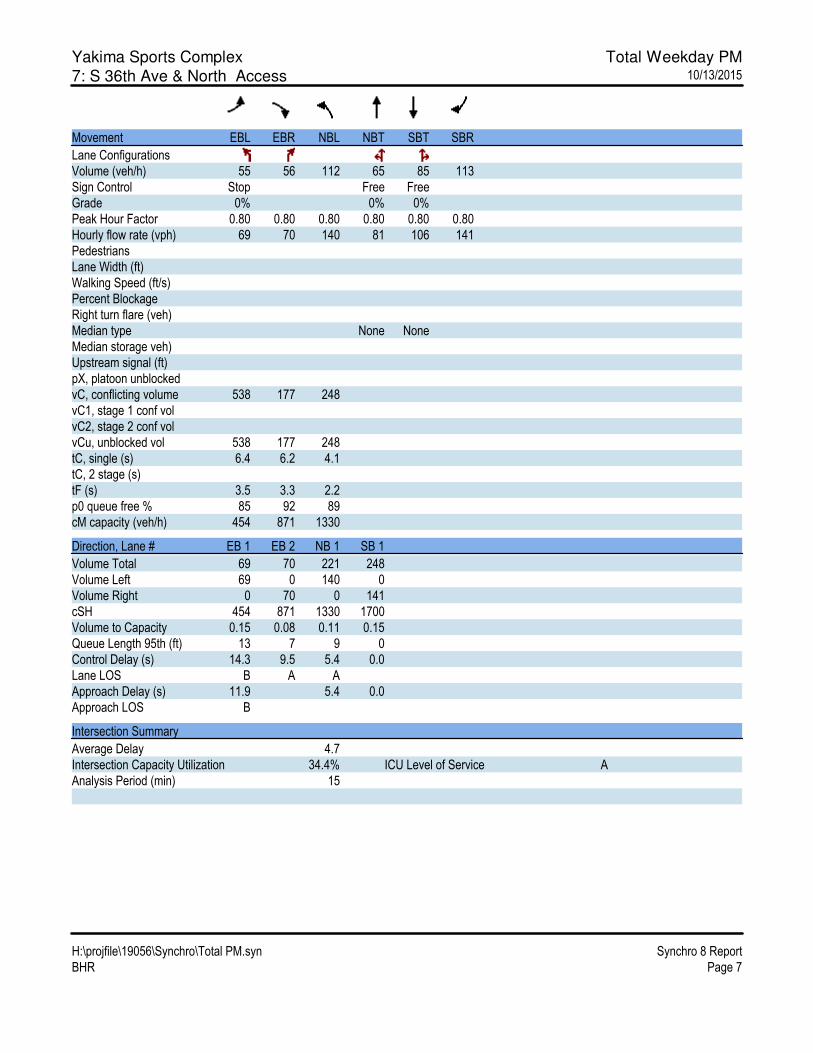
Yakima Sports Complex Total Weekday PM7: S 36th Ave & North Access 10/13/2015
H:\projfile\19056\Synchro\Total PM.syn Synchro 8 Report
BHR Page 7
Movement EBL EBR NBL NBT SBT SBR
Lane Configurations
Volume (veh/h) 55 56 112 65 85 113
Sign Control Stop Free Free
Grade 0% 0% 0%
Peak Hour Factor 0.80 0.80 0.80 0.80 0.80 0.80
Hourly flow rate (vph) 69 70 140 81 106 141
Pedestrians
Lane Width (ft)
Walking Speed (ft/s)
Percent Blockage
Right turn flare (veh)
Median type None None
Median storage veh)
Upstream signal (ft)
pX, platoon unblocked
vC, conflicting volume 538 177 248
vC1, stage 1 conf vol
vC2, stage 2 conf vol
vCu, unblocked vol 538 177 248
tC, single (s) 6.4 6.2 4.1
tC, 2 stage (s)
tF (s) 3.5 3.3 2.2
p0 queue free % 85 92 89
cM capacity (veh/h) 454 871 1330
Direction, Lane # EB 1 EB 2 NB 1 SB 1
Volume Total 69 70 221 248
Volume Left 69 0 140 0
Volume Right 0 70 0 141
cSH 454 871 1330 1700
Volume to Capacity 0.15 0.08 0.11 0.15
Queue Length 95th (ft) 13 7 9 0
Control Delay (s) 14.3 9.5 5.4 0.0
Lane LOS B A A
Approach Delay (s) 11.9 5.4 0.0
Approach LOS B
Intersection Summary
Average Delay 4.7
Intersection Capacity Utilization 34.4% ICU Level of Service A
Analysis Period (min) 15

Yakima Sports Complex Total Saturday1: S 52nd Ave & W Washington Ave 10/13/2015
H:\projfile\19056\Synchro\Total SAT.syn Synchro 8 Report
BHR Page 1
Movement EBT EBR WBL WBT NBL NBR
Lane Configurations
Volume (veh/h) 362 23 56 400 16 78
Sign Control Free Free Stop
Grade 0% 0% 0%
Peak Hour Factor 0.86 0.86 0.86 0.86 0.86 0.86
Hourly flow rate (vph) 421 27 65 465 19 91
Pedestrians
Lane Width (ft)
Walking Speed (ft/s)
Percent Blockage
Right turn flare (veh)
Median type None None
Median storage veh)
Upstream signal (ft)
pX, platoon unblocked
vC, conflicting volume 448 797 224
vC1, stage 1 conf vol
vC2, stage 2 conf vol
vCu, unblocked vol 448 797 224
tC, single (s) 4.1 7.0 6.9
tC, 2 stage (s)
tF (s) 2.2 3.6 3.3
p0 queue free % 94 94 88
cM capacity (veh/h) 1109 294 783
Direction, Lane # EB 1 EB 2 WB 1 WB 2 WB 3 NB 1
Volume Total 281 167 65 233 233 109
Volume Left 0 0 65 0 0 19
Volume Right 0 27 0 0 0 91
cSH 1700 1700 1109 1700 1700 610
Volume to Capacity 0.17 0.10 0.06 0.14 0.14 0.18
Queue Length 95th (ft) 0 0 5 0 0 16
Control Delay (s) 0.0 0.0 8.4 0.0 0.0 12.2
Lane LOS A B
Approach Delay (s) 0.0 1.0 12.2
Approach LOS B
Intersection Summary
Average Delay 1.7
Intersection Capacity Utilization 29.8% ICU Level of Service A
Analysis Period (min) 15

Yakima Sports Complex Total Saturday2: W Washington Ave & S 48th Ave 10/13/2015
H:\projfile\19056\Synchro\Total SAT.syn Synchro 8 Report
BHR Page 2
Movement WBL WBR NBT NBR SBL SBT
Lane Configurations
Volume (veh/h) 38 145 495 45 135 395
Sign Control Stop Free Free
Grade 0% 0% 0%
Peak Hour Factor 1.00 1.00 1.00 1.00 1.00 1.00
Hourly flow rate (vph) 38 145 495 45 135 395
Pedestrians 1
Lane Width (ft) 12.0
Walking Speed (ft/s) 4.0
Percent Blockage 0
Right turn flare (veh)
Median type None None
Median storage veh)
Upstream signal (ft)
pX, platoon unblocked
vC, conflicting volume 986 271 541
vC1, stage 1 conf vol
vC2, stage 2 conf vol
vCu, unblocked vol 986 271 541
tC, single (s) 6.8 6.9 4.2
tC, 2 stage (s)
tF (s) 3.5 3.3 2.2
p0 queue free % 82 80 87
cM capacity (veh/h) 215 732 1009
Direction, Lane # WB 1 NB 1 NB 2 SB 1 SB 2 SB 3
Volume Total 183 330 210 135 198 198
Volume Left 38 0 0 135 0 0
Volume Right 145 0 45 0 0 0
cSH 488 1700 1700 1009 1700 1700
Volume to Capacity 0.37 0.19 0.12 0.13 0.12 0.12
Queue Length 95th (ft) 43 0 0 12 0 0
Control Delay (s) 16.7 0.0 0.0 9.1 0.0 0.0
Lane LOS C A
Approach Delay (s) 16.7 0.0 2.3
Approach LOS C
Intersection Summary
Average Delay 3.4
Intersection Capacity Utilization 43.6% ICU Level of Service A
Analysis Period (min) 15

Yakima Sports Complex Total Saturday3: S 16th Ave & W Valley Mall Blvd 10/13/2015
H:\projfile\19056\Synchro\Total SAT.syn Synchro 8 Report
BHR Page 3
Movement EBT EBR WBL WBT NBL NBR
Lane Configurations
Volume (vph) 459 128 104 482 153 121
Ideal Flow (vphpl) 1900 1900 1900 1900 1900 1900
Total Lost time (s) 4.9 4.0 4.9 4.9 4.6 4.6
Lane Util. Factor 0.95 1.00 1.00 0.95 1.00 1.00
Frt 1.00 0.85 1.00 1.00 1.00 0.85
Flt Protected 1.00 1.00 0.95 1.00 0.95 1.00
Satd. Flow (prot) 3539 1583 1752 3574 1752 1568
Flt Permitted 1.00 1.00 0.47 1.00 0.95 1.00
Satd. Flow (perm) 3539 1583 865 3574 1752 1568
Peak-hour factor, PHF 0.92 0.92 0.92 0.92 0.92 0.92
Adj. Flow (vph) 499 139 113 524 166 132
RTOR Reduction (vph) 0 0 0 0 0 96
Lane Group Flow (vph) 499 139 113 524 166 36
Heavy Vehicles (%) 2% 2% 3% 1% 3% 3%
Turn Type NA Free Perm NA Prot Perm
Protected Phases 2 6 8
Permitted Phases Free 6 8
Actuated Green, G (s) 14.9 33.6 14.9 14.9 9.2 9.2
Effective Green, g (s) 14.9 33.6 14.9 14.9 9.2 9.2
Actuated g/C Ratio 0.44 1.00 0.44 0.44 0.27 0.27
Clearance Time (s) 4.9 4.9 4.9 4.6 4.6
Vehicle Extension (s) 4.0 3.0 3.0 3.5 3.5
Lane Grp Cap (vph) 1569 1583 383 1584 479 429
v/s Ratio Prot 0.14 c0.15 c0.09
v/s Ratio Perm 0.09 0.13 0.02
v/c Ratio 0.32 0.09 0.30 0.33 0.35 0.08
Uniform Delay, d1 6.1 0.0 6.0 6.1 9.8 9.1
Progression Factor 1.00 1.00 1.00 1.00 1.00 1.00
Incremental Delay, d2 0.2 0.1 0.4 0.1 0.5 0.1
Delay (s) 6.2 0.1 6.4 6.2 10.3 9.2
Level of Service A A A A B A
Approach Delay (s) 4.9 6.3 9.8
Approach LOS A A A
Intersection Summary
HCM 2000 Control Delay 6.4 HCM 2000 Level of Service A
HCM 2000 Volume to Capacity ratio 0.34
Actuated Cycle Length (s) 33.6 Sum of lost time (s) 9.5
Intersection Capacity Utilization 41.5% ICU Level of Service A
Analysis Period (min) 15
c Critical Lane Group

Yakima Sports Complex Total Saturday4: Ahtanum Rd & S 52nd Ave 10/13/2015
H:\projfile\19056\Synchro\Total SAT.syn Synchro 8 Report
BHR Page 4
Movement EBL EBT WBT WBR SBL SBR
Lane Configurations
Volume (veh/h) 44 315 276 19 22 31
Sign Control Free Free Stop
Grade 0% 0% 0%
Peak Hour Factor 0.91 0.91 0.91 0.91 0.91 0.91
Hourly flow rate (vph) 48 346 303 21 24 34
Pedestrians
Lane Width (ft)
Walking Speed (ft/s)
Percent Blockage
Right turn flare (veh)
Median type None None
Median storage veh)
Upstream signal (ft)
pX, platoon unblocked
vC, conflicting volume 324 757 314
vC1, stage 1 conf vol
vC2, stage 2 conf vol
vCu, unblocked vol 324 757 314
tC, single (s) 4.1 6.4 6.2
tC, 2 stage (s)
tF (s) 2.2 3.5 3.3
p0 queue free % 96 93 95
cM capacity (veh/h) 1247 358 729
Direction, Lane # EB 1 EB 2 WB 1 SB 1
Volume Total 48 346 324 58
Volume Left 48 0 0 24
Volume Right 0 0 21 34
cSH 1247 1700 1700 510
Volume to Capacity 0.04 0.20 0.19 0.11
Queue Length 95th (ft) 3 0 0 10
Control Delay (s) 8.0 0.0 0.0 13.0
Lane LOS A B
Approach Delay (s) 1.0 0.0 13.0
Approach LOS B
Intersection Summary
Average Delay 1.5
Intersection Capacity Utilization 32.3% ICU Level of Service A
Analysis Period (min) 15

Yakima Sports Complex Total Saturday5: Ahtanum Rd & S 38th Ave 10/13/2015
H:\projfile\19056\Synchro\Total SAT.syn Synchro 8 Report
BHR Page 5
Movement EBL EBT WBT WBR SBL SBR
Lane Configurations
Volume (veh/h) 26 418 276 144 151 27
Sign Control Free Free Stop
Grade 0% 0% 0%
Peak Hour Factor 1.00 1.00 1.00 1.00 1.00 1.00
Hourly flow rate (vph) 26 418 276 144 151 27
Pedestrians
Lane Width (ft)
Walking Speed (ft/s)
Percent Blockage
Right turn flare (veh)
Median type None None
Median storage veh)
Upstream signal (ft)
pX, platoon unblocked
vC, conflicting volume 420 818 348
vC1, stage 1 conf vol
vC2, stage 2 conf vol
vCu, unblocked vol 420 818 348
tC, single (s) 4.2 6.4 6.2
tC, 2 stage (s)
tF (s) 2.3 3.5 3.3
p0 queue free % 98 55 96
cM capacity (veh/h) 1108 337 700
Direction, Lane # EB 1 WB 1 SB 1
Volume Total 444 420 178
Volume Left 26 0 151
Volume Right 0 144 27
cSH 1108 1700 366
Volume to Capacity 0.02 0.25 0.49
Queue Length 95th (ft) 2 0 64
Control Delay (s) 0.7 0.0 23.8
Lane LOS A C
Approach Delay (s) 0.7 0.0 23.8
Approach LOS C
Intersection Summary
Average Delay 4.4
Intersection Capacity Utilization 60.0% ICU Level of Service B
Analysis Period (min) 15

Yakima Sports Complex Total Saturday6: S 16th Ave & Ahtanum Rd 10/13/2015
H:\projfile\19056\Synchro\Total SAT.syn Synchro 8 Report
BHR Page 6
Movement EBL EBT EBR WBL WBT WBR NBL NBT NBR SBL SBT SBR
Lane Configurations
Volume (vph) 173 307 12 9 275 67 16 34 23 70 22 140
Ideal Flow (vphpl) 1900 1900 1900 1900 1900 1900 1900 1900 1900 1900 1900 1900
Total Lost time (s) 5.0 5.0 5.0 5.0 5.0 5.0 5.0 5.0 5.0 5.0
Lane Util. Factor 1.00 1.00 1.00 1.00 0.95 1.00 1.00 1.00 1.00 1.00
Frpb, ped/bikes 1.00 1.00 1.00 1.00 1.00 1.00 0.99 1.00 1.00 1.00
Flpb, ped/bikes 1.00 1.00 1.00 1.00 1.00 1.00 1.00 1.00 1.00 1.00
Frt 1.00 1.00 0.85 1.00 0.97 1.00 0.94 1.00 1.00 0.85
Flt Protected 0.95 1.00 1.00 0.95 1.00 0.95 1.00 0.95 1.00 1.00
Satd. Flow (prot) 1752 1810 1482 1583 3396 1736 1714 1735 1827 1615
Flt Permitted 0.53 1.00 1.00 0.56 1.00 0.74 1.00 0.72 1.00 1.00
Satd. Flow (perm) 983 1810 1482 936 3396 1355 1714 1309 1827 1615
Peak-hour factor, PHF 0.93 0.93 0.93 0.93 0.93 0.93 0.93 0.93 0.93 0.93 0.93 0.93
Adj. Flow (vph) 186 330 13 10 296 72 17 37 25 75 24 151
RTOR Reduction (vph) 0 0 6 0 33 0 0 20 0 0 0 120
Lane Group Flow (vph) 186 330 7 10 335 0 17 42 0 75 24 31
Confl. Peds. (#/hr) 1 1
Heavy Vehicles (%) 3% 5% 9% 14% 3% 4% 4% 2% 6% 4% 4% 0%
Turn Type Perm NA Perm Perm NA Perm NA Perm NA Perm
Protected Phases 6 2 8 4
Permitted Phases 6 6 2 8 4 4
Actuated Green, G (s) 21.6 21.6 21.6 21.6 21.6 8.3 8.3 8.3 8.3 8.3
Effective Green, g (s) 21.6 21.6 21.6 21.6 21.6 8.3 8.3 8.3 8.3 8.3
Actuated g/C Ratio 0.54 0.54 0.54 0.54 0.54 0.21 0.21 0.21 0.21 0.21
Clearance Time (s) 5.0 5.0 5.0 5.0 5.0 5.0 5.0 5.0 5.0 5.0
Vehicle Extension (s) 3.0 3.0 3.0 3.0 3.0 3.0 3.0 3.0 3.0 3.0
Lane Grp Cap (vph) 532 979 802 506 1838 281 356 272 380 335
v/s Ratio Prot 0.18 0.10 0.02 0.01
v/s Ratio Perm c0.19 0.00 0.01 0.01 c0.06 0.02
v/c Ratio 0.35 0.34 0.01 0.02 0.18 0.06 0.12 0.28 0.06 0.09
Uniform Delay, d1 5.2 5.1 4.2 4.2 4.7 12.7 12.8 13.3 12.7 12.8
Progression Factor 1.00 1.00 1.00 1.00 1.00 1.00 1.00 1.00 1.00 1.00
Incremental Delay, d2 0.4 0.2 0.0 0.0 0.0 0.1 0.1 0.6 0.1 0.1
Delay (s) 5.6 5.3 4.2 4.3 4.7 12.8 13.0 13.8 12.8 12.9
Level of Service A A A A A B B B B B
Approach Delay (s) 5.4 4.7 12.9 13.2
Approach LOS A A B B
Intersection Summary
HCM 2000 Control Delay 7.2 HCM 2000 Level of Service A
HCM 2000 Volume to Capacity ratio 0.33
Actuated Cycle Length (s) 39.9 Sum of lost time (s) 10.0
Intersection Capacity Utilization 54.2% ICU Level of Service A
Analysis Period (min) 15
c Critical Lane Group

Yakima Sports Complex Total Saturday7: S 36th Ave & North Access 10/13/2015
H:\projfile\19056\Synchro\Total SAT.syn Synchro 8 Report
BHR Page 7
Movement EBL EBR NBL NBT SBT SBR
Lane Configurations
Volume (veh/h) 150 150 138 32 28 138
Sign Control Stop Free Free
Grade 0% 0% 0%
Peak Hour Factor 0.80 0.80 0.80 0.80 0.80 0.80
Hourly flow rate (vph) 188 188 172 40 35 172
Pedestrians
Lane Width (ft)
Walking Speed (ft/s)
Percent Blockage
Right turn flare (veh)
Median type None None
Median storage veh)
Upstream signal (ft)
pX, platoon unblocked
vC, conflicting volume 506 121 208
vC1, stage 1 conf vol
vC2, stage 2 conf vol
vCu, unblocked vol 506 121 208
tC, single (s) 6.4 6.2 4.1
tC, 2 stage (s)
tF (s) 3.5 3.3 2.2
p0 queue free % 60 80 87
cM capacity (veh/h) 463 935 1376
Direction, Lane # EB 1 EB 2 NB 1 SB 1
Volume Total 188 188 212 208
Volume Left 188 0 172 0
Volume Right 0 188 0 172
cSH 463 935 1376 1700
Volume to Capacity 0.40 0.20 0.13 0.12
Queue Length 95th (ft) 48 19 11 0
Control Delay (s) 18.0 9.8 6.7 0.0
Lane LOS C A A
Approach Delay (s) 13.9 6.7 0.0
Approach LOS B
Intersection Summary
Average Delay 8.3
Intersection Capacity Utilization 37.6% ICU Level of Service A
Analysis Period (min) 15

Appendix F Signal Warrant Analysis
Worksheets
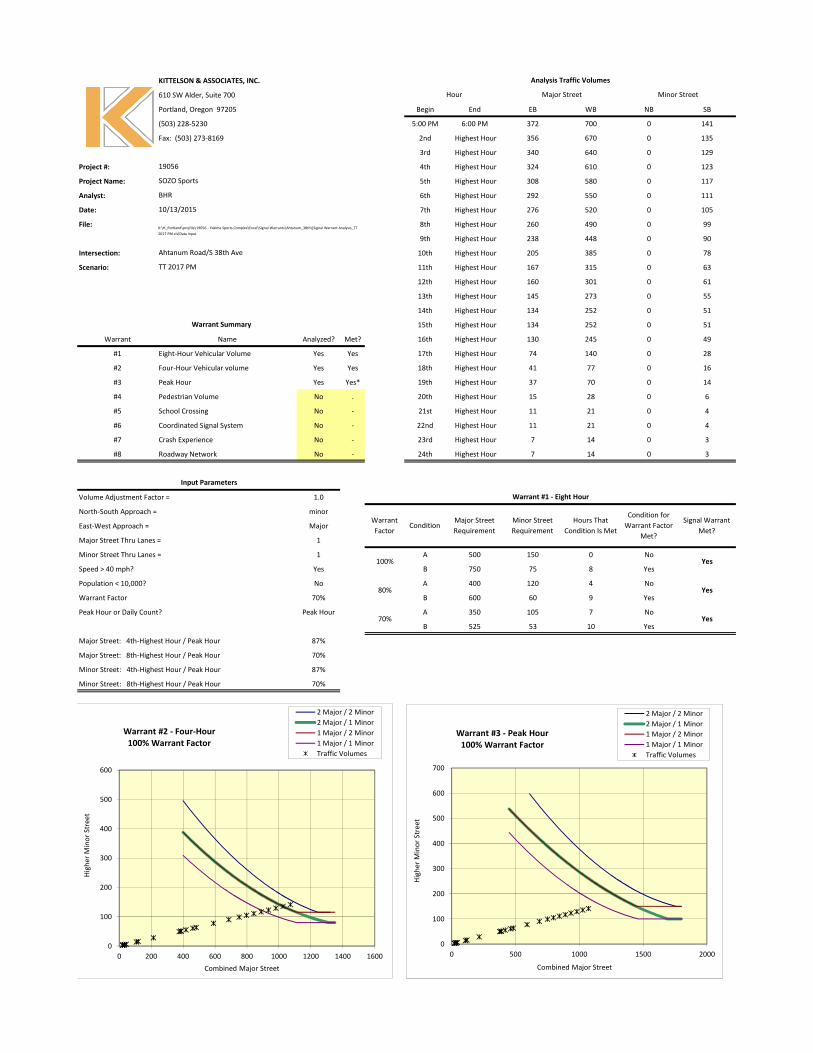
KITTELSON & ASSOCIATES, INC.
610 SW Alder, Suite 700
Portland, Oregon 97205 Begin End EB WB NB SB
(503) 228-5230 5:00 PM 6:00 PM 372 700 0 141
Fax: (503) 273-8169 2nd Highest Hour 356 670 0 135
3rd Highest Hour 340 640 0 129
Project #: 4th Highest Hour 324 610 0 123
Project Name: 5th Highest Hour 308 580 0 117
Analyst: 6th Highest Hour 292 550 0 111
Date: 7th Highest Hour 276 520 0 105
File: 8th Highest Hour 260 490 0 99
9th Highest Hour 238 448 0 90
Intersection: 10th Highest Hour 205 385 0 78
Scenario: 11th Highest Hour 167 315 0 63
12th Highest Hour 160 301 0 61
13th Highest Hour 145 273 0 55
14th Highest Hour 134 252 0 51
15th Highest Hour 134 252 0 51
Warrant Name Analyzed? Met? 16th Highest Hour 130 245 0 49
#1 Eight-Hour Vehicular Volume Yes Yes 17th Highest Hour 74 140 0 28
#2 Four-Hour Vehicular volume Yes Yes 18th Highest Hour 41 77 0 16
#3 Peak Hour Yes Yes* 19th Highest Hour 37 70 0 14
#4 Pedestrian Volume No . 20th Highest Hour 15 28 0 6
#5 School Crossing No - 21st Highest Hour 11 21 0 4
#6 Coordinated Signal System No - 22nd Highest Hour 11 21 0 4
#7 Crash Experience No - 23rd Highest Hour 7 14 0 3
#8 Roadway Network No - 24th Highest Hour 7 14 0 3
Volume Adjustment Factor = 1.0
North-South Approach = minor
East-West Approach = Major
Major Street Thru Lanes = 1
Minor Street Thru Lanes = 1 A 500 150 0 No
Speed > 40 mph? Yes B 750 75 8 Yes
Population < 10,000? No A 400 120 4 No
Warrant Factor 70% B 600 60 9 Yes
Peak Hour or Daily Count? Peak Hour A 350 105 7 No
B 525 53 10 Yes
Major Street: 4th-Highest Hour / Peak Hour 87%
Major Street: 8th-Highest Hour / Peak Hour 70%
Minor Street: 4th-Highest Hour / Peak Hour 87%
Minor Street: 8th-Highest Hour / Peak Hour 70%
Warrant Summary
TT 2017 PM
19056
SOZO Sports
BHR
10/13/2015
K:\H_Portland\projfile\19056 - Yakima Sports Complex\Excel\Signal Warrants\Ahtanum_38th\[Signal Warrant Analysis_TT
2017 PM.xls]Data Input
Input Parameters
Hour Major Street Minor Street
Analysis Traffic Volumes
Ahtanum Road/S 38th Ave
Warrant #1 - Eight Hour
Warrant
FactorCondition
Major Street
Requirement
Minor Street
Requirement
Hours That
Condition Is Met
Condition for
Warrant Factor
Met?
Signal Warrant
Met?
70% Yes
100% Yes
80% Yes
0
100
200
300
400
500
600
0 200 400 600 800 1000 1200 1400 1600
Hig
he
r M
ino
r S
tre
et
Combined Major Street
Warrant #2 - Four-Hour
100% Warrant Factor
2 Major / 2 Minor
2 Major / 1 Minor
1 Major / 2 Minor
1 Major / 1 Minor
Traffic Volumes
0
100
200
300
400
500
600
700
0 500 1000 1500 2000
Hig
he
r M
ino
r S
tre
et
Combined Major Street
Warrant #3 - Peak Hour
100% Warrant Factor
2 Major / 2 Minor
2 Major / 1 Minor
1 Major / 2 Minor
1 Major / 1 Minor
Traffic Volumes