a framework for collaborative filtering recommender systems
TRANSCRIPT
Expert Systems with Applications 38 (2011) 14609–14623
Contents lists available at ScienceDirect
Expert Systems with Applications
journal homepage: www.elsevier .com/locate /eswa
A framework for collaborative filtering recommender systems
Jesus Bobadilla ⇑, Antonio Hernando, Fernando Ortega, Jesus BernalUniversidad Politecnica de Madrid & FilmAffinity.com research team, Crta. De Valencia, Km. 7, 28031 Madrid, Spain
a r t i c l e i n f o
Keywords:Recommender systemsFrameworkSimilarity measuresTrustNoveltyQualityCollaborative filtering
0957-4174/$ - see front matter � 2011 Elsevier Ltd. Adoi:10.1016/j.eswa.2011.05.021
Abbreviations: RS, recommender systems; CF, coll⇑ Corresponding author. Address: Universidad Pol
Valencia, Km. 7, 28031 Madrid, Spain. Tel.: +34 3365E-mail address: [email protected] (J. Bobadi
a b s t r a c t
As the use of recommender systems becomes more consolidated on the Net, an increasing need arises todevelop some kind of evaluation framework for collaborative filtering measures and methods which iscapable of not only testing the prediction and recommendation results, but also of other purposes whichuntil now were considered secondary, such as novelty in the recommendations and the users’ trust inthese. This paper provides: (a) measures to evaluate the novelty of the users’ recommendations and trustin their neighborhoods, (b) equations that formalize and unify the collaborative filtering process and itsevaluation, (c) a framework based on the above-mentioned elements that enables the evaluation of thequality results of any collaborative filtering applied to the desired recommender systems, using fourgraphs: quality of the predictions, the recommendations, the novelty and the trust.
� 2011 Elsevier Ltd. All rights reserved.
1. Introduction
Recommender systems (RS) are developed to attempt to reducepart of the information overload problem produced on the Net. Asopposed to other traditional help systems, such as search engines(Google, Yahoo, etc.), RS generally base their operation on a Collab-orative Filtering (CF) process, which provides personalized recom-mendations to active users of websites where different elements(products, films, holidays, etc.) can be rated.
RS are inspired by human social behavior, where it is commonto take into account the tastes, opinions and experiences of ouracquaintances when making all kinds of decisions (choosing filmsto watch, selecting schools for our children, choosing products tobuy, etc.). Obviously, our decisions are modulated according toour interpretation of the similarity that exists between us andour group of acquaintances, in such a way that we rate the opin-ions and experiences of some more highly than others.
By emulating each step of our own behavior insofar as is possi-ble, the CF process of RS firstly selects the group of users from the RSwebsite that is most similar to us, and then provides us with a groupof recommendations of elements that we have not rated yet(assuming in this way that they are new to us) and which have beenrated the best by the group of users with similar tastes to us. Thisway, a trip to the Canary Islands could be recommended to an indi-vidual who has rated different destinations in the Caribbean veryhighly, based on the positive ratings about the holiday destination
ll rights reserved.
aborative filtering.itecnica de Madrid, Crta. De133; fax: +34 913367522.lla).
of ‘‘Canary Islands’’ of an important number of individuals who alsorated destinations in the Caribbean very highly. This suggestion(recommendation) will often provide the user of the service withinspiring information from the collective knowledge of all otherusers of the service.
RS cover a wide variety of applications (Baraglia & Silvestri,2004; Bobadilla, Serradilla, & Hernando, 2009; Fesenmaier et al.,2002; Jinghua, Kangning, & Shaohong, 2007; Serrano, Viedma,Olivas, Cerezo, & Romero, 2011), although those related to movierecommendations are by far the best and most widely-used inthe research field (Antonopoulus & Salter, 2006; Konstan, Miller,& Riedl, 2004).
A substantial part of the research in the area of CF focuses on howto determine which users are similar to the given one; in order totackle this task, there are fundamentally three approaches: mem-ory-based methods, model-based methods and hybrid approaches.
Memory-based methods (Bobadilla, Ortega, & Hernando, inpress; Bobadilla, Serradilla, & Bernal, 2010; Kong, Sun, & Ye,2005; Sanchez, Serradilla, Martinez, & Bobadilla, 2008; Symeonidis,Nanopoulos, & Manolopoulos, 2008) use similarity metrics and actdirectly on the ratio matrix that contains the ratings of all userswho have expressed their preferences on the collaborative service;these metrics mathematically express a distance between twousers based on each of their ratios. Model-based methods(Adomavicius & Tuzhilin, 2005) use the ratio matrix to create amodel from which the sets of similar users will be established.Among the most widely used models we have: Bayesian classifiers(Cho, Hong, & Park, 2007), neural networks (Ingoo, Kyong, & Tae,2003) and fuzzy systems (Yager, 2003). Generally, commercial RSuse memory-based methods (Giaglis & Lekakos, 2006), whilstmodel-based methods are usually associated with research RS.
14610 J. Bobadilla et al. / Expert Systems with Applications 38 (2011) 14609–14623
Regardless of the method used in the CF stage, the technical aimgenerally pursued is to minimize the prediction errors, by makingthe accuracy (Fuyuki, Quan, & Shinichi, 2006; Giaglis & Lekakos,2006; Li & Yamada, 2004; Manolopoulus, Nanopoulus, Papadopou-lus, & Symeonidis, 2007; Su & Khoshgoftaar, 2009) of the RS as highas possible; nevertheless, there are other purposes that need to betaken into account: avoid overspecialization phenomena, find gooditems, trust of recommendations, novelty, precision and recallmeasures, sparsity, cold start issues, etc.
The framework proposed in the paper gives special importanceto the quality of the predictions and the recommendations, as wellas to the novelty and trust results. Whilst the importance of thequality obtained in the predictions and recommendations has beenstudied in detail since the start of the RS, the quality results in nov-elty and trust provided by the different methods and metrics usedin CF have not been evaluated in depth.
Measuring the quality of the trust results in recommendationsbecomes even more complicated as we are entering a particularlysubjective field, where each specific user can grant more or lessimportance to various aspects that are selected as relevant to gaintheir trust in the recommendations offered (recommendation ofrecent elements, such as film premieres, introduction of novel ele-ments, etc.). Another additional problem is the number of nuancesthat can be taken into account together with the lack of consensusto define them; in this way we can find studies on trust, reputation,credibility, importance, expertise, competence, reliability, etc.which sometimes pursue the same objective and other times donot.
In Buhwan, Jaewook, and Hyunbo (2009) we can see some novelmemory-based methods that incorporate the level of a user creditinstead of using similarity between users. In Kwiseok, Jinhyung,and Yongtae (2009) they employ a multidimensional credibilitymodel, source credibility from consumer psychology, and providea credible neighbor selection method, although the equations in-volved require a great number of parameters of difficult or arbi-trary adjustment. O’Donovan and Smyth (2005) presents twocomputational models of trust and show how they can be readilyincorporated into CF frameworks. Kitisin and Neuman (2006) pro-pose an approach to include the social factors e.g. user’s pastbehaviors and reputation together as an element of trust that canbe incorporated into the RS. Zhang (2008) and Hijikata et al.,2009 tackle the novelty issue: in the first paper they propose a no-vel topic diversity metric which explores hierarchical domainknowledge, whilst in the second paper they infer items that a userdoes not know by calculating the similarity of users or items basedon information about what items users already know. An aspectrelated to the trust measures is the capacity to provide justifica-tions for the recommendations made; in Symeonidis et al. (2008)they propose an approach that attains both accurate and justifiablerecommendations, constructing a feature profile for the users to re-veal their favorite features.
To date, various publications have been written which tacklethe way the RS are evaluated, among the most significant wehave Herlocker, Konstan, Riedl, and Terveen (2004) which reviewsthe key decisions in evaluating CF RS: the user tasks, the type ofanalysis and datasets being used, the ways in which predictionquality is measured and the user-based evaluation of the systemas a whole. Hernández and Gaudioso (2008) is a current studywhich proposes a recommendation filtering process based onthe distinction between interactive and non-interactive subsys-tems. General publications and reviews also exist which includethe most commonly accepted metrics, aggregation approachesand evaluation measures: mean absolute error, coverage, preci-sion, recall and derivatives of these: mean squared error, normal-ized mean absolute error, ROC and fallout; Goldberg, Roeder,Gupta, and Perkins (2001) focus on the aspects not related to
the evaluation, Breese, Heckerman, and Kadie (1998) comparethe predictive accuracy of various methods in a set of representa-tive problem domains. Candillier, Meyer, and Boullé (2007) andSchafer, Frankowski, Herlocker, and Sen, 2007 review the mainCF methods proposed in the literature.
Among the most significant papers that propose a CF frame-work is Herlocker, Konstan, Borchers, and Riedl (1999) which eval-uates the following: similarity weight, significance weighting,variance weighting, selecting neighborhood and rating normaliza-tion; Hernández and Gaudioso (2008) propose a framework inwhich any RS is formed by two different subsystems, one of themto guide the user and the other to provide useful/interesting items.Koutrika, Bercovitz, and Garcia (2009) is a recent and very interest-ing framework which introduces levels of abstraction in CF process,making the modifications in the RS more flexible.
The RS frameworks proposed until now present two deficien-cies which we aim to tackle in this paper. The first of these is thelack of formalization in the evaluation methods; although the qual-ity metrics are well defined, there are a variety of details in theimplementation of the methods which, in the event they are notspecified, can lead to the generation of different results in similarexperiments. The second deficiency is the absence of quality mea-sures of the results in aspects such as novelty and trust of therecommendations.
The following section of this paper develops a complete series ofmathematical formalizations based on sets theory, backed by arunning example which aids understanding and by cases of studieswhich show clarifying results of the aspects and alternativesshown; in this section, we also obtain the combination of metric,aggregation approach and standardization method which providesthe best results, enabling it to be used as a reference to evaluatemetrics designed by the scientific community. In Section 3 wespecify the evaluation measures proposed in the framework, whichinclude the quality analysis of the following aspects: predictions(estimations), recommendations, novelty and trust; this same sec-tion shows the results obtained by using MovieLens 1M and NetF-lix. Finally, we set our most relevant conclusions.
2. Framework specifications
This section provides both the equations on which the predic-tion/recommendation process in the CF stage is based and the equa-tions that support the quality evaluation process offered in theproposed framework; between these last two we have the tradi-tional MAE, coverage, precision, recall and those developed specif-ically to complete the framework: novelty-precision, novelty-recall,trust-precision, trust-recall.
The objective of formalizing the prediction, recommendationand evaluation processes is to ensure that the experiments carriedout by different researchers can be reproduced and are not alteredby different decisions made on behalf of different implementationdetails: e.g. deciding how to act when no k-neighborhoods havevoted for a specific item (we could say not predict, or predict withthe average votes of all users on that item), whether we apply astandardization process to the input data or to the weightings ofthe aggregation approach, whether on finding an error in a predic-tion we take the decimal values of the prediction or round them offto the nearest whole value, etc.
The formalization presented here is fundamental when specify-ing a framework, where the same experiments carried out by dif-ferent researchers must give the same results, in order to be ableto compare the metrics and methods developed over time at differ-ent research centers.
Throughout the section, a running example is provided to helpto understand and follow the underlying ideas in each group of
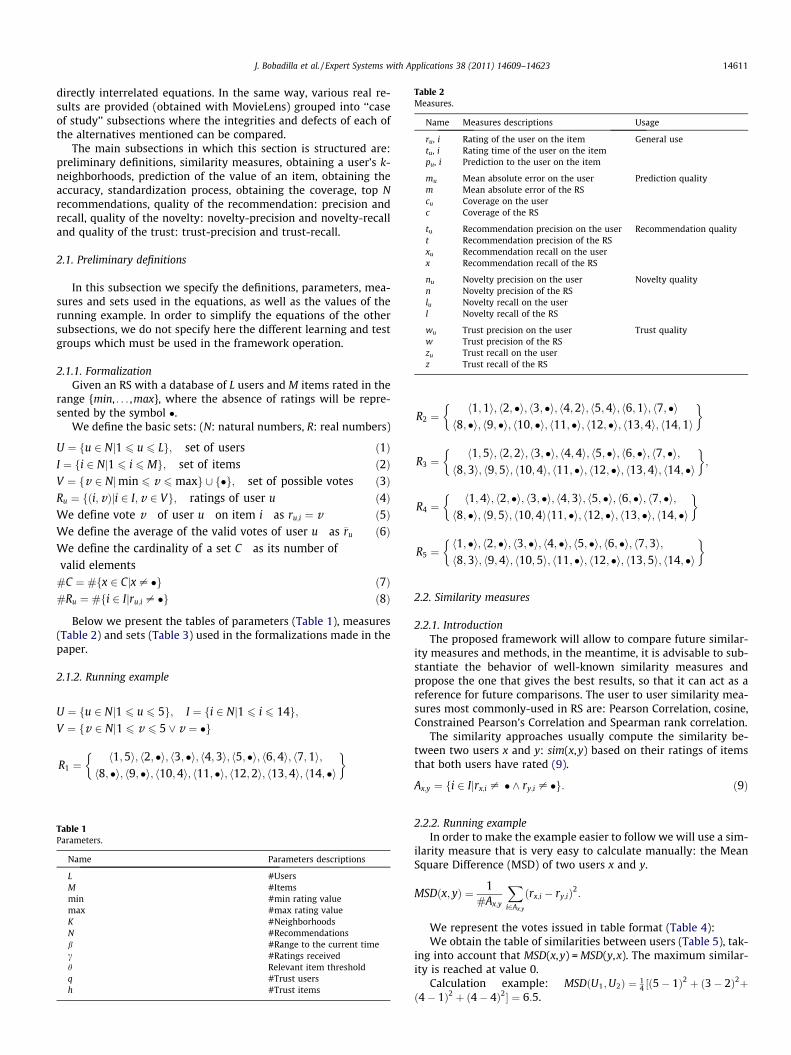
Table 2Measures.
Name Measures descriptions Usage
ru, i Rating of the user on the item General usetu, i Rating time of the user on the itempu, i Prediction to the user on the item
mu Mean absolute error on the user Prediction qualitym Mean absolute error of the RScu Coverage on the userc Coverage of the RS
tu Recommendation precision on the user Recommendation qualityt Recommendation precision of the RSxu Recommendation recall on the userx Recommendation recall of the RS
nu Novelty precision on the user Novelty qualityn Novelty precision of the RSlu Novelty recall on the userl Novelty recall of the RS
wu Trust precision on the user Trust qualityw Trust precision of the RSzu Trust recall on the userz Trust recall of the RS
J. Bobadilla et al. / Expert Systems with Applications 38 (2011) 14609–14623 14611
directly interrelated equations. In the same way, various real re-sults are provided (obtained with MovieLens) grouped into ‘‘caseof study’’ subsections where the integrities and defects of each ofthe alternatives mentioned can be compared.
The main subsections in which this section is structured are:preliminary definitions, similarity measures, obtaining a user’s k-neighborhoods, prediction of the value of an item, obtaining theaccuracy, standardization process, obtaining the coverage, top Nrecommendations, quality of the recommendation: precision andrecall, quality of the novelty: novelty-precision and novelty-recalland quality of the trust: trust-precision and trust-recall.
2.1. Preliminary definitions
In this subsection we specify the definitions, parameters, mea-sures and sets used in the equations, as well as the values of therunning example. In order to simplify the equations of the othersubsections, we do not specify here the different learning and testgroups which must be used in the framework operation.
2.1.1. FormalizationGiven an RS with a database of L users and M items rated in the
range {min, . . . ,max}, where the absence of ratings will be repre-sented by the symbol �.
We define the basic sets: (N: natural numbers, R: real numbers)
U ¼ fu 2 Nj1 6 u 6 Lg; set of users ð1ÞI ¼ fi 2 Nj1 6 i 6 Mg; set of items ð2ÞV ¼ fv 2 Njmin 6 v 6 maxg [ f�g; set of possible votes ð3ÞRu ¼ fði;vÞji 2 I; v 2 Vg; ratings of user u ð4ÞWe define vote v of user u on item i as ru;i ¼ v ð5ÞWe define the average of the valid votes of user u as �ru ð6ÞWe define the cardinality of a set C as its number ofvalid elements
#C ¼ #fx 2 Cjx – �g ð7Þ#Ru ¼ #fi 2 Ijru;i – �g ð8Þ
Below we present the tables of parameters (Table 1), measures(Table 2) and sets (Table 3) used in the formalizations made in thepaper.
2.1.2. Running example
U ¼ fu 2 Nj1 6 u 6 5g; I ¼ fi 2 Nj1 6 i 6 14g;V ¼ fv 2 Nj1 6 v 6 5 _ v ¼ �g
R1 ¼h1;5i; h2; �i; h3; �i; h4;3i; h5; �i; h6;4i; h7;1i;
h8; �i; h9; �i; h10;4i; h11; �i; h12;2i; h13;4i; h14; �i
� �
Table 1Parameters.
Name Parameters descriptions
L #UsersM #Itemsmin #min rating valuemax #max rating valueK #NeighborhoodsN #Recommendationsb #Range to the current timec #Ratings receivedh Relevant item thresholdq #Trust usersh #Trust items
R2 ¼h1;1i; h2; �i; h3; �i; h4;2i; h5;4i; h6;1i; h7; �i
h8; �i; h9; �i; h10; �i; h11; �i; h12; �i; h13;4i; h14;1i
� �
R3 ¼h1;5i; h2;2i; h3; �i; h4;4i; h5; �i; h6; �i; h7; �i;
h8;3i; h9;5i; h10;4i; h11; �i; h12; �i; h13;4i; h14; �i
� �;
R4 ¼h1;4i; h2; �i; h3; �i; h4;3i; h5; �i; h6; �i; h7; �i;
h8; �i; h9;5i; h10;4ih11; �i; h12; �i; h13; �i; h14; �i
� �
R5 ¼h1; �i; h2; �i; h3; �i; h4; �i; h5; �i; h6; �i; h7;3i;h8;3i; h9;4i; h10;5i; h11; �i; h12; �i; h13;5i; h14; �i
� �
2.2. Similarity measures
2.2.1. IntroductionThe proposed framework will allow to compare future similar-
ity measures and methods, in the meantime, it is advisable to sub-stantiate the behavior of well-known similarity measures andpropose the one that gives the best results, so that it can act as areference for future comparisons. The user to user similarity mea-sures most commonly-used in RS are: Pearson Correlation, cosine,Constrained Pearson’s Correlation and Spearman rank correlation.
The similarity approaches usually compute the similarity be-tween two users x and y: sim(x,y) based on their ratings of itemsthat both users have rated (9).
Ax;y ¼ fi 2 Ijrx;i – � ^ ry;i – �g: ð9Þ
2.2.2. Running exampleIn order to make the example easier to follow we will use a sim-
ilarity measure that is very easy to calculate manually: the MeanSquare Difference (MSD) of two users x and y.
MSDðx; yÞ ¼ 1#Ax;y
Xi2Ax;y
ðrx;i � ry;iÞ2:
We represent the votes issued in table format (Table 4):We obtain the table of similarities between users (Table 5), tak-
ing into account that MSD(x,y) = MSD(y,x). The maximum similar-ity is reached at value 0.
Calculation example: MSDðU1;U2Þ ¼ 14 ½ð5� 1Þ2 þ ð3� 2Þ2þ
ð4� 1Þ2 þ ð4� 4Þ2� ¼ 6:5.

Table 3Sets.
Name Sets descriptions Parameters
U Users LI Items MV Rating values min, maxRu User ratings userKu Neighborhoods of the user user, kPu Predictions to the user user, kXu Top recommended items to the user user, k, hZu Top N recommended items to the user user, k, N, hY Items voted of the most by c users cTu User’s neighborhoods taking into account b user, k, b, qQu Trust users user, k, b, hHu Trust pairs (user, item) user, k, bAx,y Items rated simultaneously by users x and y user1,
user2Gu,i User’s neighborhoods which have rated item i user, kBu,i Users who have voted for item i, exceptuser user, itemOu Items that the user has voted for and on which
predictions existuser, k
O Users from whom a MAE can be obtained kCu Items that the user has not voted for and on which
predictions existuser, k
Du Items that the user has not voted for user, kC Pairs (user, item) that have not been voted for and
accept predictionsk
D Pairs (user, item) that have not been voted forEx,y Items that have recently been voted for by both user x
and user yb, user1,user2
Su User’s recent votes user, b
Table 4Running example: RS database.
ru,i I1 I2 I3 I4 I5 I6 I7 I8 I9 I10 I11 I12 I13 I14
U1 5 � � 3 � 4 1 � � 4 � 2 4 �U2 1 � � 2 4 1 � � � � � � 4 1U3 5 2 � 4 � � � 3 5 4 � � 4 �U4 4 � � 3 � � � � 5 4 � � � �U5 � � � � � � 3 3 4 5 � � 5 �
Table 6Running example: 2 and 3 neighbors of each user.
Ku U1 U2 U3 U4 U5
K = 2 {U3,U4} {U5,U4} {U1,U4} {U1,U3} {U3,U2}K = 3 {U3,U4,U5} {U5,U4,U1} {U1,U4,U2} {U1,U3,U5} {U3,U2,U4}
Table 5Running example: users similarities.
MSD U1 U2 U3 U4 U5
U1 0 6.5 0.25 0.33 2U2 6.5 0 6.66 5 1U3 0.25 6.66 0 0.5 0.75U4 0.33 5 0.5 0 1U5 2 1 0.75 1 0
14612 J. Bobadilla et al. / Expert Systems with Applications 38 (2011) 14609–14623
2.3. Obtaining a user’s K-neighbors
2.3.1. FormalizationWe define Ku as the set of K neighbors of the user u.The following must be true:
Ku � U ^#Ku ¼ k ^ u R Ku; ð10Þ8x 2 Ku; 8y 2 ðU � KuÞ; simðu; xÞP simðu; yÞ: ð11Þ
2.3.2. Running exampleTable 6 shows the sets of neighbors using K = 2 and K = 3:
2.4. Prediction of the value of an item
2.4.1. FormalizationBased on the information provided by the K-neighbors of a user
u, the CF process enables the value of an item to be predicted asfollows:
Let Pu ¼ fði;pÞji 2 I;p 2 Rg;set of prediction to the user u ðR : real numbersÞ ð12Þ
We will assign the value of the prediction pmade to user u on item i as pu;i ¼ p ð13Þ
Once the set of K users (neighbors) similar to active u has beencalculated (Ku), in order to obtain the prediction of item i on useru(12), one of the following aggregation approaches is often used:the average (15), the weighted sum (16) and the adjusted weightedaggregation (Deviation-From-Mean) (17).
Let Gu;i ¼ fn 2 Kuj9rn;i – �g ð14Þ
pu;i ¼1
#Gu;i
Xn2Gu;i
rn;i () Gu;i – £ ð15Þ
pu;i ¼ lu;i
Xn2Gu;i
simðu;nÞrn;i () Gu;i – £ ð16Þ
pu;i ¼ �ru þ lu;i
Xn2Gu;i
simðu;nÞðrn;i � �rnÞ () Gu;i – £ ð17Þ
where l serves as a normalizing factor, usually computed:
lu;i ¼ 1X
n2Gu;i
simðu;nÞ () Gu;i – £
,ð18Þ
When it is not possible to make the prediction of an item asnone of the K-neighbors has voted for this item, we can decide tomake use of the average ratings given to that item by all users ofthe RS who have voted for it; in this case, Eqs. (14)–(18) are com-plemented with Eqs. (19)–(23):
where Bu;i ¼ fn 2 Ujn – u; rn;i – �g ð19Þ
pu;i ¼1
#Bu;i
Xn2Bu;i
rn;i () Gu;i ¼£ ^ Bu;i – £ ð20Þ
pu;i ¼ lu;i
Xn2Bu;i
simðu;nÞrn;i () Gu;i ¼£ ^ Bu;i – £ ð21Þ
pu;i ¼ �ru þ lu;i
Xn2Bu;i
simðu;nÞðrn;i � �rnÞ () Gu;i ¼£ ^ Bu;i – £ ð22Þ
lu;i ¼ 1=X
n2Bu;i
simðu;nÞ () Gu;i ¼£ ^ Bu;i – £ ð23Þ
Finally, in RS cases exist in which it is impossible to make pre-dictions on some items that any other user has voted for:
pu;i ¼ � () Gu;i ¼£ ^ Bu;i ¼£ ð24Þ
2.4.2. Running exampleBy using the simplest prediction Eq. (15) we obtain the predic-
tions that the users can receive using K = 3 neighbors. Table 7shows these predictions.
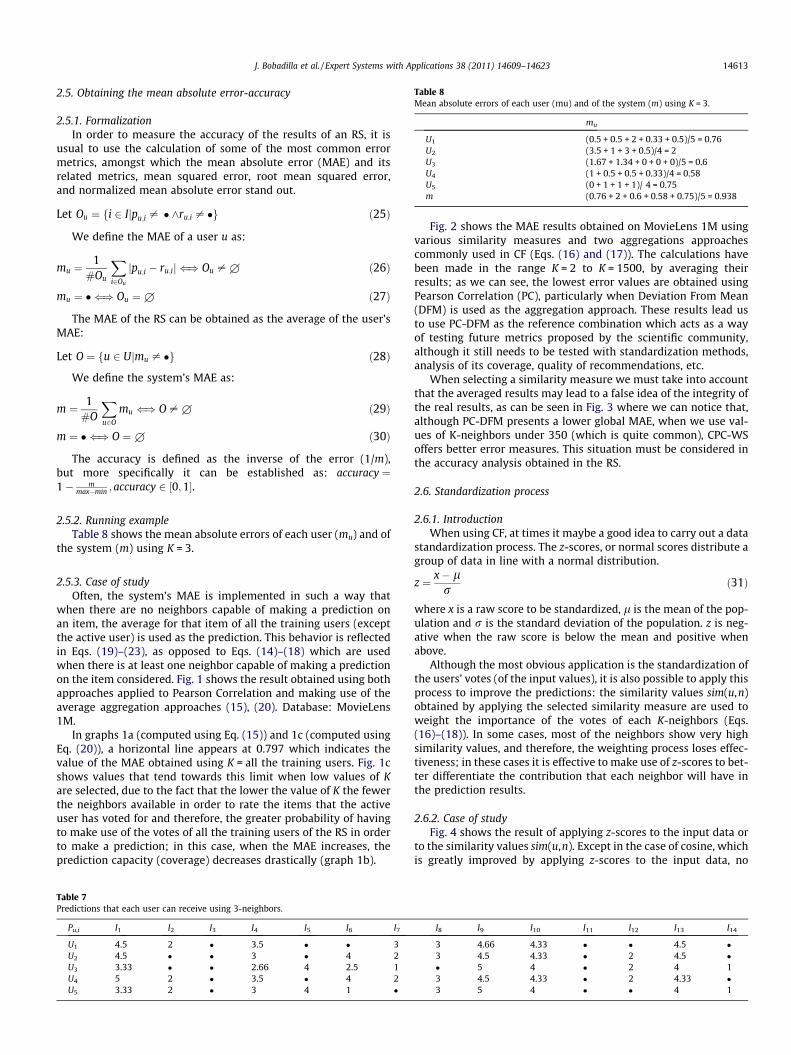
Table 8Mean absolute errors of each user (mu) and of the system (m) using K = 3.
mu
U1 (0.5 + 0.5 + 2 + 0.33 + 0.5)/5 = 0.76U2 (3.5 + 1 + 3 + 0.5)/4 = 2U3 (1.67 + 1.34 + 0 + 0 + 0)/5 = 0.6U4 (1 + 0.5 + 0.5 + 0.33)/4 = 0.58U5 (0 + 1 + 1 + 1)/ 4 = 0.75m (0.76 + 2 + 0.6 + 0.58 + 0.75)/5 = 0.938
J. Bobadilla et al. / Expert Systems with Applications 38 (2011) 14609–14623 14613
2.5. Obtaining the mean absolute error-accuracy
2.5.1. FormalizationIn order to measure the accuracy of the results of an RS, it is
usual to use the calculation of some of the most common errormetrics, amongst which the mean absolute error (MAE) and itsrelated metrics, mean squared error, root mean squared error,and normalized mean absolute error stand out.
Let Ou ¼ fi 2 Ijpu;i – � ^ru;i – �g ð25Þ
We define the MAE of a user u as:
mu ¼1
#Ou
Xi2Ou
jpu;i � ru;ij () Ou – £ ð26Þ
mu ¼ � () Ou ¼£ ð27Þ
The MAE of the RS can be obtained as the average of the user’sMAE:
Let O ¼ fu 2 Ujmu – �g ð28Þ
We define the system’s MAE as:
m ¼ 1#O
Xu2O
mu () O – £ ð29Þ
m ¼ � () O ¼£ ð30Þ
The accuracy is defined as the inverse of the error (1/m),but more specifically it can be established as: accuracy ¼1� m
max�min ; accuracy 2 ½0;1�.
2.5.2. Running exampleTable 8 shows the mean absolute errors of each user (mu) and of
the system (m) using K = 3.
2.5.3. Case of studyOften, the system’s MAE is implemented in such a way that
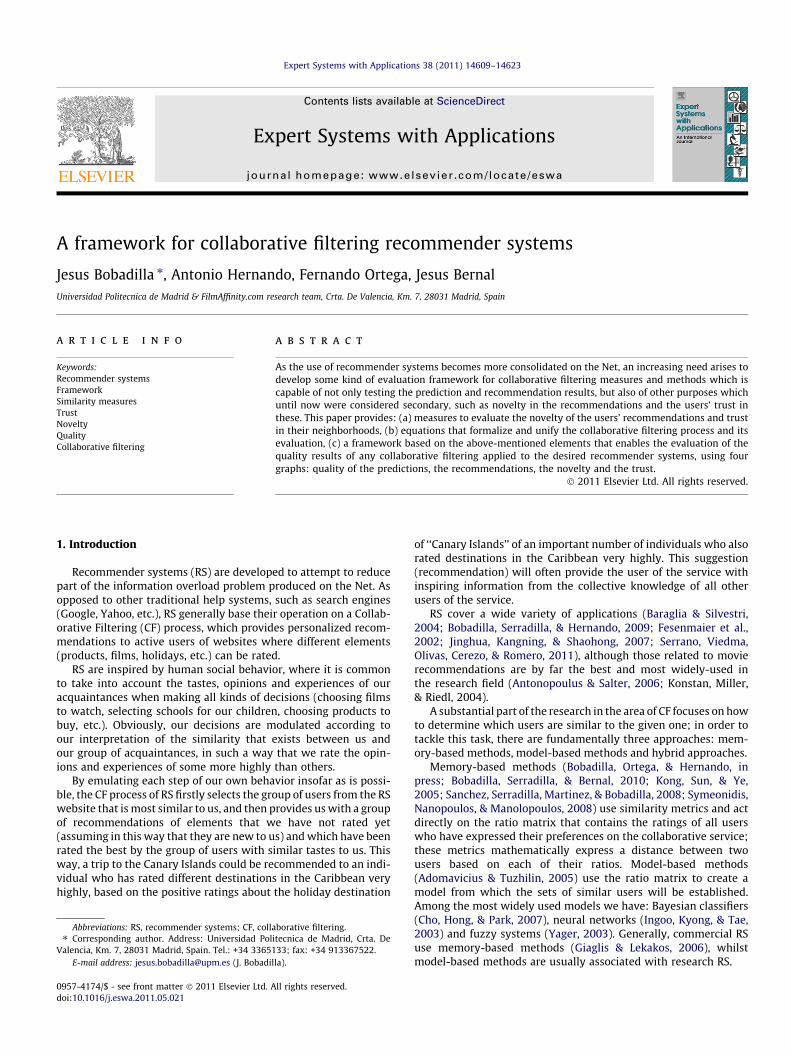
when there are no neighbors capable of making a prediction onan item, the average for that item of all the training users (exceptthe active user) is used as the prediction. This behavior is reflectedin Eqs. (19)–(23), as opposed to Eqs. (14)–(18) which are usedwhen there is at least one neighbor capable of making a predictionon the item considered. Fig. 1 shows the result obtained using bothapproaches applied to Pearson Correlation and making use of theaverage aggregation approaches (15), (20). Database: MovieLens1M.
In graphs 1a (computed using Eq. (15)) and 1c (computed usingEq. (20)), a horizontal line appears at 0.797 which indicates thevalue of the MAE obtained using K = all the training users. Fig. 1cshows values that tend towards this limit when low values of Kare selected, due to the fact that the lower the value of K the fewerthe neighbors available in order to rate the items that the activeuser has voted for and therefore, the greater probability of havingto make use of the votes of all the training users of the RS in orderto make a prediction; in this case, when the MAE increases, theprediction capacity (coverage) decreases drastically (graph 1b).
Table 7Predictions that each user can receive using 3-neighbors.
Pu,i I1 I2 I3 I4 I5 I6 I7
U1 4.5 2 � 3.5 � � 3U2 4.5 � � 3 � 4 2U3 3.33 � � 2.66 4 2.5 1U4 5 2 � 3.5 � 4 2U5 3.33 2 � 3 4 1 �
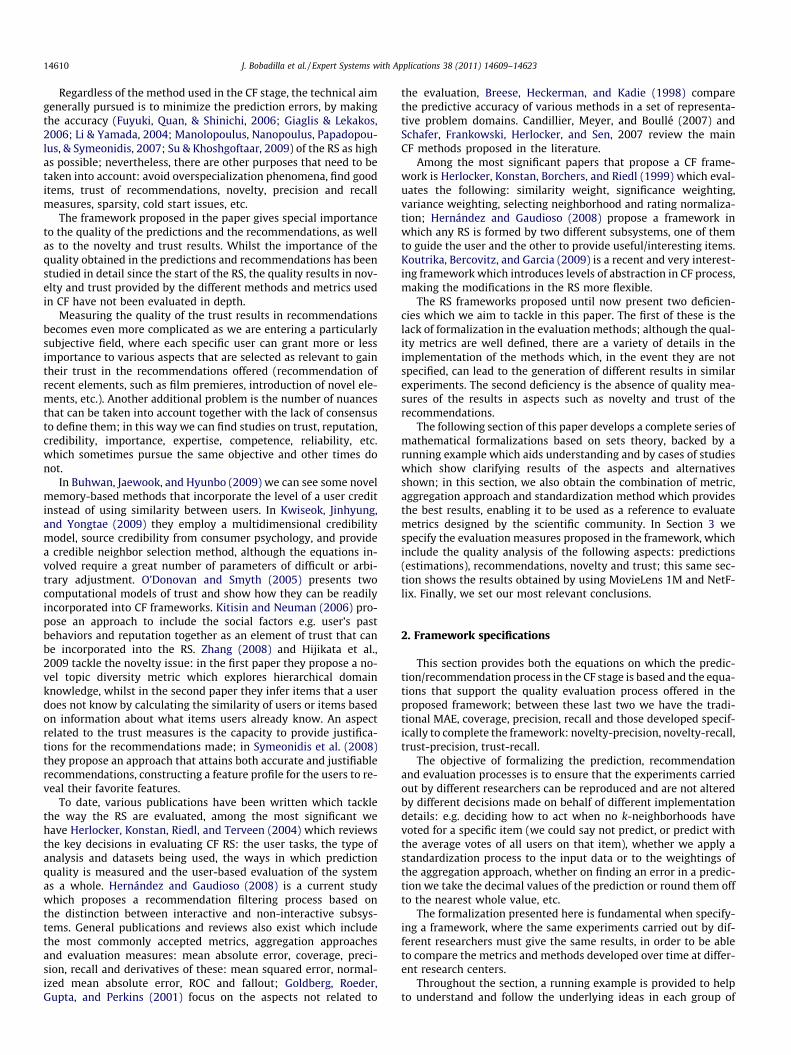
Fig. 2 shows the MAE results obtained on MovieLens 1M usingvarious similarity measures and two aggregations approachescommonly used in CF (Eqs. (16) and (17)). The calculations havebeen made in the range K = 2 to K = 1500, by averaging theirresults; as we can see, the lowest error values are obtained usingPearson Correlation (PC), particularly when Deviation From Mean(DFM) is used as the aggregation approach. These results lead usto use PC-DFM as the reference combination which acts as a wayof testing future metrics proposed by the scientific community,although it still needs to be tested with standardization methods,analysis of its coverage, quality of recommendations, etc.
When selecting a similarity measure we must take into accountthat the averaged results may lead to a false idea of the integrity ofthe real results, as can be seen in Fig. 3 where we can notice that,although PC-DFM presents a lower global MAE, when we use val-ues of K-neighbors under 350 (which is quite common), CPC-WSoffers better error measures. This situation must be considered inthe accuracy analysis obtained in the RS.
2.6. Standardization process
2.6.1. IntroductionWhen using CF, at times it maybe a good idea to carry out a data
standardization process. The z-scores, or normal scores distribute agroup of data in line with a normal distribution.
z ¼ x� lr
ð31Þ
where x is a raw score to be standardized, l is the mean of the pop-ulation and r is the standard deviation of the population. z is neg-ative when the raw score is below the mean and positive whenabove.
Although the most obvious application is the standardization ofthe users’ votes (of the input values), it is also possible to apply thisprocess to improve the predictions: the similarity values sim(u,n)obtained by applying the selected similarity measure are used toweight the importance of the votes of each K-neighbors (Eqs.(16)–(18)). In some cases, most of the neighbors show very highsimilarity values, and therefore, the weighting process loses effec-tiveness; in these cases it is effective to make use of z-scores to bet-ter differentiate the contribution that each neighbor will have inthe prediction results.
2.6.2. Case of studyFig. 4 shows the result of applying z-scores to the input data or
to the similarity values sim(u,n). Except in the case of cosine, whichis greatly improved by applying z-scores to the input data, no
I8 I9 I10 I11 I12 I13 I14
3 4.66 4.33 � � 4.5 �3 4.5 4.33 � 2 4.5 �� 5 4 � 2 4 13 4.5 4.33 � 2 4.33 �3 5 4 � � 4 1

Fig. 1. (a) MAE obtained by only using the votes of the K-neighbors of each active user; (b) coverage; (c) MAE obtained using the votes of all the training users when the K-neighbors cannot make a prediction.
Fig. 2. MAE results obtained on MovieLens 1M using the similarity measures:Constrained Pearson Correlation (CPC), Pearson Correlation (PC), Spearman rankcorrelation (SPR), cosine (COS) and Mean Squared Differences (MSD), and making useof the aggregation approaches: Weighted Sum (WS) and Deviation From Mean (DFM).
14614 J. Bobadilla et al. / Expert Systems with Applications 38 (2011) 14609–14623
significant improvements can be seen in the other metrics, how-ever, by studying the details of the impact of the standardizationprocesses for different K-neighbors (Fig. 5), we can see that by
using Pearson Correlation DFM the effects of using z-scores onthe similarity values (PC-DFM-Z) begin to produce improvementsafter a certain value of K: in the case of MovieLens 1M fromK = 500 and with MovieLens 100 K from K = 100.
2.7. Obtaining the coverage
2.7.1. FormalizationThe coverage could be defined as the capacity of predicting from
a metric applied to a specific RS. In short, it calculates the percent-age of situations in which at least one K-neighbor of each activeuser can rate an item that has not been rated yet by that active user.
Let Cu ¼ fi 2 Ijru;i ¼ � ^ Gu;i – £g ð32ÞLet Du ¼ fi 2 Ijru;i ¼ �g ð33Þ
Coverage of user u:
cu ¼ 100� #Cu
#Du() Du – £; cu ¼ � () Du ¼£ ð34Þ
Coverage of the system:
Let C ¼ fðu; iÞju 2 U; i 2 I; ru;i ¼ �;Gu;i – £g ð35ÞLet D ¼ fðu; iÞju 2 U; i 2 I; ru;i ¼ �g ð36Þ
c ¼ 100x#C#D
ð37Þ

Fig. 3. Breakdown of the MAE obtained on MovieLens 1M using the similarity measures: Constrained Pearson Correlation (CPC) combined with Weighted Sum (WS) andPearson Correlation (PC) combined with Deviation From Mean (DFM).
J. Bobadilla et al. / Expert Systems with Applications 38 (2011) 14609–14623 14615
2.7.2. Running exampleTable 9 shows the coverage measures using MSD and values
K = 2 and K = 3.
2.7.3. Case of studyBy comparing Fig. 6 with Fig. 4 we can see that there is a reverse
trend between accuracy and coverage, to the extent that whenchoosing a metric we must not take only one of these measuresas a reference. In Fig. 6 the similarity measure Mean Square Differ-ences (MSD) shows much better results than the other metrics,however, as we have seen, it also has the worst accuracy. Alongthe same lines, Pearson Correlation using z-scores provides us withvery low coverage values, in contrast to its good accuracy results.
Fig. 7 shows the breakdown of the coverage results using Pear-son correlation with and without z-scores. As we can see, the use ofthis standardization process is justified in order to improve theaccuracy, due to its minimum impact on the coverage.
2.8. Top N recommendations
2.8.1. FormalizationWe define Xu as the set of recommendations to user u, and Z�u as
the set of N recommendations to user u.The following must be true:
Xu � I ^ 8i 2 Xu; ru;i ¼ �; pu;i – �; ð38ÞZu # Xu; #Zu ¼ N; 8x 2 Zu; 8y 2 Xu : pu;x P pu;y ð39Þ
Fig. 4. MAE results obtained on MovieLens 1M using the similarity measures: Constrain(SPR), cosine (COS) and Mean Squared Differences (MSD), making use of the aggregation ain the input data (Z�) or in similarity values during the prediction process (�Z).
If we want to impose a minimum recommendation value: h 2 R,we add pu,i P h
2.8.2. Running exampleBy making use of Eqs. (38) and (39), as an example, we obtain
the recommendations that can be made to user U3 with N = 2 toN = 5, using K = 2. Table 10 shows these values.
2.9. Quality of the recommendation: precision and recall
2.9.1. FormalizationFirst, we redefine the Eq. (38)
Xu � I ^ 8i 2 Xu; ru;i – �; pu;i – �
We will use tu to represent the quality precision measure forrecommendations obtained by making N test recommendationsto the user u, taking a h relevancy threshold. Similarly, xu will rep-resent the recall measure obtained by making the same N recom-mendations to user u.
Assuming that all users accept N test recommendations:
tu ¼#fi 2 Zujru;i P hg
Nð40Þ
xu ¼#fi 2 Zujru;i P hg
#fi 2 Zujru;i P hg þ#fi 2 Zcujru;i – � ^ru;i P hg
ð41Þ
ed Pearson Correlation (CPC), Pearson Correlation (PC), Spearman rank correlationpproaches: Weighted Sum (WS) and Deviation From Mean (DFM) and using z-scores

Fig. 5. Breakdown of the MAE obtained on MovieLens 1M using Deviation From Mean (DFM) Pearson Correlation (PC) using and not using z-scores in the similarity valuesduring the prediction process (�Z).
Table 9Coverage measures using MSD and values K = 2 and K = 3.
#Du K = 2#Cu K = 3#Cu K = 2cu K = 3cu
U1 7 #{I2, I8, I9} = 3 #{I2, I8, I9} = 3 42, 85% 42, 85%U2 8 #{I7, I8, I9, I10} = 4 #{I7, I8, I9, I10, I12} = 5 50% 62.5%U3 7 #{I6, I7, I12} = 3 #{I5, I6, I7, I12, I14} = 5 42, 85% 71, 42%U4 10 #{I2, I6, I7, I8, I12, I13} = 6 #{I2, I6, I7, I8, I12, I13} = 6 60% 60%U5 9 #{I1, I2, I4, I5, I6, I14} = 6 #{I1, I2, I4, I5, I6, I14} = 6 66, 66% 66, 66%
c 22/41% 25/41%
Fig. 7. Breakdown of the coverage obtained on MovieLens 1M using PearsonCorrelation (PC).
Table 10Sets of recommendations that user U3 could receive, K = 2.
eZu N = 2 N = 3 N = 4 N = 5
U3 {I5, I6} {I5, I6, I12} {I5, I6, I12, I7} {I5, I6, I12, I7, I14}
Fig. 6. Coverage results obtained on MovieLens 1M using the similarity measures:Constrained Pearson Correlation (CPC), Pearson Correlation (PC), Spearman rankcorrelation (SPR), cosine (COS) and Mean Squared Differences (MSD).
14616 J. Bobadilla et al. / Expert Systems with Applications 38 (2011) 14609–14623
t ¼ 1#U
Xu2U
tu ð42Þ
x ¼ 1#U
Xu2U
xu ð43Þ
2.9.2. Running exampleIn this example we will give parameters N and h values 4 and 4.
Table 11 shows the recommendations Zu made to each Ui (bottomrow of each user) and the votes issued (top row of each user) andTable 12 shows the precision and recall values obtained using N = 4and h = 4.
2.9.3. Case of studyFig. 8 shows the average results for precision and recall
obtained using the most common similarity measures. Mean
Square Differences (MSD) has been rejected due to its poor generalresults. As may be seen, there is a direct relation between the pre-cision and recall values obtained in each of the cases. It is alsoimportant to highlight the fact that, by using similarity measures,high values of accuracy (low values of MAE) do not guaranteethe best values for recommendation quality (as is the case in ourcase study with CPC-WS), in the same way that bad accuracy val-ues can be combined with good results for recommendation qual-ity (see PC-Z-WS). We must take into account that MAE provides uswith a measure of the quality of the predictions, whilst precisionand recall provide us with a measure of the quality of a small sub-group of the predictions: the N with the highest rating and whichare over a certain threshold.
2.10. Quality of novelty: novelty-precision and novelty-recall
2.10.1. FormalizationWe will define the novelty group Y as the group of items which
have been voted at the most by c users.
Y ¼ fi 2 Ij#fu 2 Ujru;i – �g 6 cg ð44Þ
We will use nu to represent the quality precision measure fornovelty obtained by making N test recommendations to user uand requiring a novelty measure c. Similarly, lu will represent the

Table 12Values of precision and recall using N = 4, h = 4.
U1 U2 U3 U4 U5 Average
tu 3/4 1/4 4/4 3/4 3/4 t = 0.70xu 3/(3 + 1) 1/(1 + 1) 4/(4 + 1) 3/(3 + 0) 3/(3 + 0) x = 0.81
J. Bobadilla et al. / Expert Systems with Applications 38 (2011) 14609–14623 14617
recall measure obtained by making the sameN recommendationsto user u.
Assuming that all the users accept N test recommendations:
nu ¼#fi 2 Zuji 2 Yg
Nð45Þ
lu ¼#fi 2 Zuji 2 Yg
#fi 2 Zuji 2 Yg þ#fi 2 Zcuji 2 Yg
ð46Þ
n ¼ 1#U
Xu2U
nu ð47Þ
l ¼ 1#U
Xu2U
lu ð48Þ
2.10.2. Running exampleFirstly, we find the number of votes received for each item,
which we represent in the last row of Table 13; later we establisha threshold of novelty (c = 3). The set of items belonging to thenovelty set is as follows:
Y ¼ f2;3;5;6;7;8;9;11;12;14g
Table 14 shows the recommendations made to each of the usersusing N = 4 and h = 4(Zu); the items belonging to Y (in the firstrow) are framed. Table 15 shows the novelty-precision and nov-elty-recall results obtained by each of the users and the total nov-elty-precision and novelty-recall obtained in the example.
2.10.3. Case of studyFirstly, in order to be able to adjust parameter c to a suitable
value in the RS used, it is valuable to know the distribution ofthe votes regarding the items. As an example, Fig. 9 shows this dataobtained in MovieLens 100 K. Thus, we can determine, for instance,that 600 items of the RS have been voted for by 13 or less users.
Figs. 10 and 11, respectively, show the novelty-precision andnovelty-recall results obtained using MovieLens 100 K with valuesof c:13, 17, 21 and 25. A general increase in the precision may benoted as we take higher values of c, due to the gradual increase thatthis implies in the number of relevant recommended elements.
2.11. Quality of trust: trust-precision and trust-recall
2.11.1. FormalizationAs follows from actual results obtained in an experiment carried
out on a group of users of the filmaffinity.com website, the trust ofuser x towards another user y could be based on the following 3aspects:
� Similarity in the votes.� Greater importance to the last items voted.
Table 11Relevant recommended: values with diagonal lines; relevant not recommended: values w
I1 I2 I3 I4 I5 I6
U1 r1,i 5 � � 3 � 4eZ14.5 � � 3.5 � �
U2 r2,i 1 � � 2 4 1eZ24.5 � � 3 � 4
U3 r3,i 5 2 � 4 � �eZ33.33 � � � � �
U4 r4,i 4 � � 3 � �eZ45 � � 3.5 � �
U5 r5,i � � � � � �eZ5� � � � � �
� Number of items that both x and y have voted for(rx,i – � ^ ry,i – �) in relation to the total number of items votedfor by both.
In order to include time in our model, we extend formulas (4)and (5) to contain a time value in timestamp format.
Ru ¼ fði; v; tÞji 2 I;v 2 V ; t 2 �g ð49Þru;i ¼ v ^ tu;i ¼ t ð50Þ
We define Ex,y as the group of items that both x and y have votedfor most recently. Most recently means within a period of b days asregards the current time (tc)
Ex;y ¼ fi 2 Ijrx;i – � ^ry;i – � ^tc � tx;i 6 b ^ tc � ty;i 6 bg ð51Þ
We define Su as the group of votes of user u which have beenmade in the time interval b as regards the current time.
Su ¼ fði;v ; tÞji 2 I;v 2 V ; t 2 �; tc � tu;i 6 bg ð52Þ
If the votes’ time information is not available, Eq. (51) can besimplified in the following way:
Ex;y ¼ Ax;y ¼ fi 2 Ijrx;i – � ^ry;i – �g ð53Þ
From the group of items defined in (51), or failing that, in (53),we use the similarity measure which each user will intuitively useto compare their votes with those of each of their neighbors: theMean Absolute Difference (MAD):
MADðx; y;bÞ ¼ MADðy; x;bÞ
¼ 1#Ex;y
Xi2Ex;y
jrx;i � ry;ij () Ex;y – / ð54Þ
As a list of common votes among users, as regards the total, weuse Jaccard:
Jaccardðx; y;bÞ ¼ Jaccardðy; x;bÞ ¼ Sx \ Sy
Sx [ Syð55Þ
Willing to obtain similar importance to metrics (54) and (55),we place the MAD results on the scale [0, 1], where 1 representsthe greatest possible similitude and 0 the least possible. We com-bine both metrics by multiplying them, so that when either ofthem is low the total similitude is highly affected.
ith horizontal lines.
I7 I8 I9 I10 I11 I12 I13 I14
1 � � 4 � 2 4 �� � � 4.33 � � 4.5 �
� � � � � � 4 1� � � � � � 4.5 �
� 3 5 4 � � 4 �� � 5 4 � � 4 �
� � 5 4 � � � �� � 4.5 4.33 � � � �
3 3 4 5 � � 5 �� 3 5 4 � � 4 �
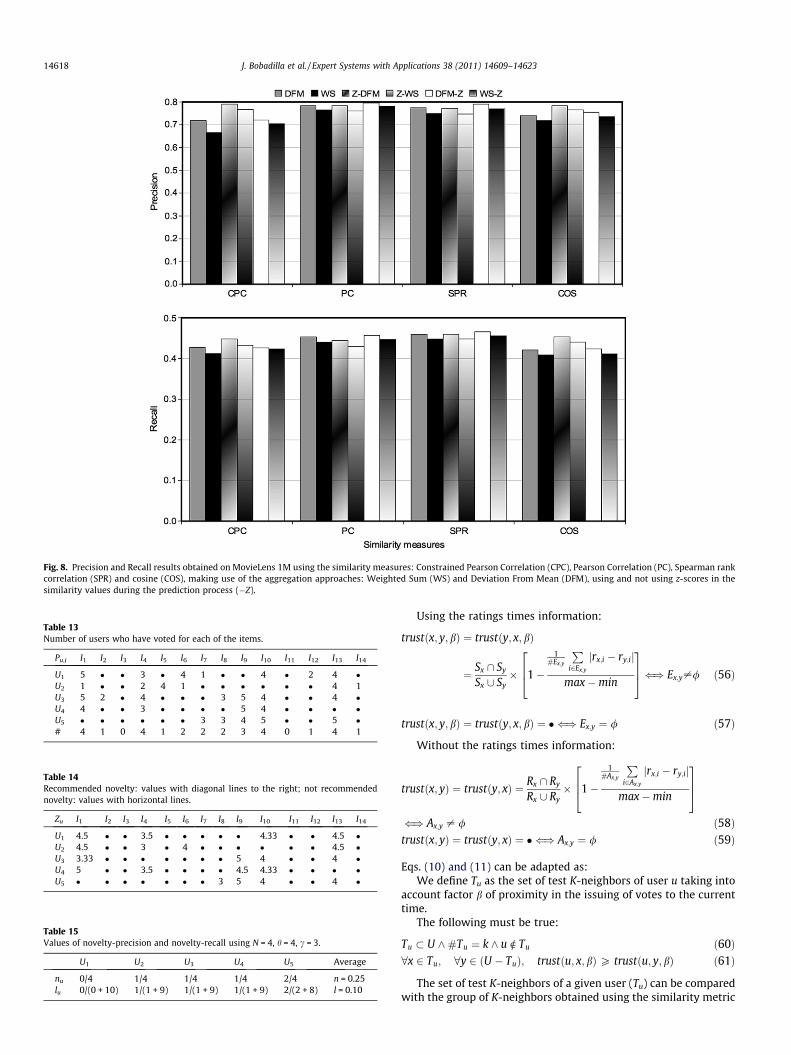
Fig. 8. Precision and Recall results obtained on MovieLens 1M using the similarity measures: Constrained Pearson Correlation (CPC), Pearson Correlation (PC), Spearman rankcorrelation (SPR) and cosine (COS), making use of the aggregation approaches: Weighted Sum (WS) and Deviation From Mean (DFM), using and not using z-scores in thesimilarity values during the prediction process (�Z).
Table 13Number of users who have voted for each of the items.
Pu,i I1 I2 I3 I4 I5 I6 I7 I8 I9 I10 I11 I12 I13 I14
U1 5 � � 3 � 4 1 � � 4 � 2 4 �U2 1 � � 2 4 1 � � � � � � 4 1U3 5 2 � 4 � � � 3 5 4 � � 4 �U4 4 � � 3 � � � � 5 4 � � � �U5 � � � � � � 3 3 4 5 � � 5 �# 4 1 0 4 1 2 2 2 3 4 0 1 4 1
Table 14Recommended novelty: values with diagonal lines to the right; not recommendednovelty: values with horizontal lines.
Zu I1 I2 I3 I4 I5 I6 I7 I8 I9 I10 I11 I12 I13 I14
U1 4.5 � � 3.5 � � � � � 4.33 � � 4.5 �U2 4.5 � � 3 � 4 � � � � � � 4.5 �U3 3.33 � � � � � � � 5 4 � � 4 �U4 5 � � 3.5 � � � � 4.5 4.33 � � � �U5 � � � � � � � 3 5 4 � � 4 �
Table 15Values of novelty-precision and novelty-recall using N = 4, h = 4, c = 3.
U1 U2 U3 U4 U5 Average
nu 0/4 1/4 1/4 1/4 2/4 n = 0.25lu 0/(0 + 10) 1/(1 + 9) 1/(1 + 9) 1/(1 + 9) 2/(2 + 8) l = 0.10
14618 J. Bobadilla et al. / Expert Systems with Applications 38 (2011) 14609–14623
Using the ratings times information:
trustðx; y;bÞ ¼ trustðy; x; bÞ
¼ Sx \ Sy
Sx [ Sy� 1�
1#Ex;y
Pi2Ex;y
jrx;i � ry;ij
max�min
264375() Ex;y–/ ð56Þ
trustðx; y;bÞ ¼ trustðy; x; bÞ ¼ � () Ex;y ¼ / ð57Þ
Without the ratings times information:
trustðx; yÞ ¼ trustðy; xÞ ¼ Rx \ Ry
Rx [ Ry� 1�
1#Ax;y
Pi2Ax;y
jrx;i � ry;ij
max�min
264375
() Ax;y – / ð58Þtrustðx; yÞ ¼ trustðy; xÞ ¼ � () Ax;y ¼ / ð59Þ
Eqs. (10) and (11) can be adapted as:We define Tu as the set of test K-neighbors of user u taking into
account factor b of proximity in the issuing of votes to the currenttime.
The following must be true:
Tu � U ^#Tu ¼ k ^ u R Tu ð60Þ8x 2 Tu; 8y 2 ðU � TuÞ; trustðu; x;bÞP trustðu; y;bÞ ð61Þ
The set of test K-neighbors of a given user (Tu) can be comparedwith the group of K-neighbors obtained using the similarity metric

Fig. 10. Precision results obtained on MovieLens 100 K, by taking values ofN = [2. . .20], K = 250, and using Pearson Correlation.
Fig. 11. Recall results obtained on MovieLens 100 K, by taking values ofN = [2. . .20], K = 250, and using Pearson Correlation.
Fig. 9. Number of items (y axis) which have been voted for a maximum of n (x axis)times. MovieLens 100 K Database.
Table 17Measures of trust between users.
Trust U1 U2 U3 U4 U5
U1 – – – – –U2 1/8⁄1 = 0.12 – – – –U3 2/10 ⁄ 1 = 0.2 1/8 ⁄ 1 = 0.12 – – –U4 1/6 ⁄ 1 = 0.16 0/4 ⁄ � = � 1/6 ⁄ 1 = 0.16 – –U5 3/8 ⁄ 0.66 = 0.24 1/7 ⁄ 0,75 = 0.10 4/7 ⁄ 0.81 = 0.46 1/5 ⁄ 0,75 = 0.15 –
Table 16Users’ votes; recent not crossed out, not recent (as regards tc � b) crossed out.
ru,i I1 I2 I3 I4 I5 I6 I7 I8 I9 I10 I11 I12 I13 I14
U1 5 � � 3 � 4 1 � � 4 � 2 4 �U2 1 � � 2 4 1 � � � � � � 4 1U3 5 2 � 4 � � � 3 5 4 � � 4 �U4 4 � � 3 � � � � 5 4 � � � �U5 � � � � � � 3 3 4 5 � � 5 �
J. Bobadilla et al. / Expert Systems with Applications 38 (2011) 14609–14623 14619
to be tested (Ku), this way we can create the confusion matrix andobtain the measures of trust-precision and trust-recall.
In addition, this approach allows us to offer each user u the fol-lowing personalized information regarding the measure of trustoffered to them by the recommendation process: the set of ‘‘q’’users over which the recommendations have been made offeringthe most trust to the active user (recommended), and for each ofthese users, group of ‘‘h’’ items whose ratings have been closestto that of the active user and have been made most recently (b).This information aims to show the active user the subgroup of datathat played a part in the recommendation that best matches whatan average user understands to be their soul mates (users whovoted similarly in the most relevant items).
Qu ¼ fKu \ Tugj#Q u 6 q ^ 8x 2 Q u;
8y 2 Q cutrustðu; x; bÞP trustðu; y;bÞ ð62Þ
Hu ¼ fðu; iÞ;u 2 Q u; i 2 I;#Hu 6 h 8x 2 Q u;8y 2 Q cu !
�� ��ru;i � rx;ij6 jru;i � ry;ijg ð63Þ
We will use wu to represent the quality precision measure fortrust requiring a measure of proximity in time to the current timeb. Similarly, zu will represent the measure recall.
wu ¼#fu 2 Kuju 2 Tug
#Kuð64Þ
zu ¼#fu 2 Kuju 2 Tug
#fu 2 Kuju 2 Tug þ# u 2 Kcuju 2 Tu
� � ð65Þ
w ¼ 1#U
Xu2U
wu ð66Þ
z ¼ 1#U
Xu2U
zu ð67Þ
2.11.2. Running exampleLet’s assume that by establishing a time value b, the values of
Table 16 which are crossed out are excluded from the process toobtain trust measures. Table 17 shows the trust values betweenusers ‘‘trust(x,y)’’ obtained by applying Eqs. (56) and (57). As anexample, Table 18 shows the group of K = 2 trust neighbors of eachof the users, obtained from Table 17, by applying Eqs. (60) and (61).
If we wish to test a similarity metric between users applicableto the CF of the RS, we would obtain, via the usual procedure,the K-neighbors of each user by applying Eqs. (10) and (11). Inour running example we will assume that, by using K = 2, weobtain the groups represented in Table 19. By creating the confu-sion matrix between the relevant (Table 18) and the retrieved (Ta-ble 19) values and by applying Eqs. (64)–(67) we can obtain themeasures of trust-precision and trust-recall outlined in Table 20.
Finally, Table 21 shows the information considered most appro-priate to provide to each with the aim that they can easily under-stand relevant aspects of the recommendation process. Its resultsare obtained by applying Eqs. (62) and (63) with values k = 2,q = 2 and h = 2.
2.11.3. Case of studyIn order to suitably adjust parameter b in the RS used, it is valu-
able to know the distribution of the votes with regard to theirdates. As an example, Fig. 12 shows this data obtained in Movielens
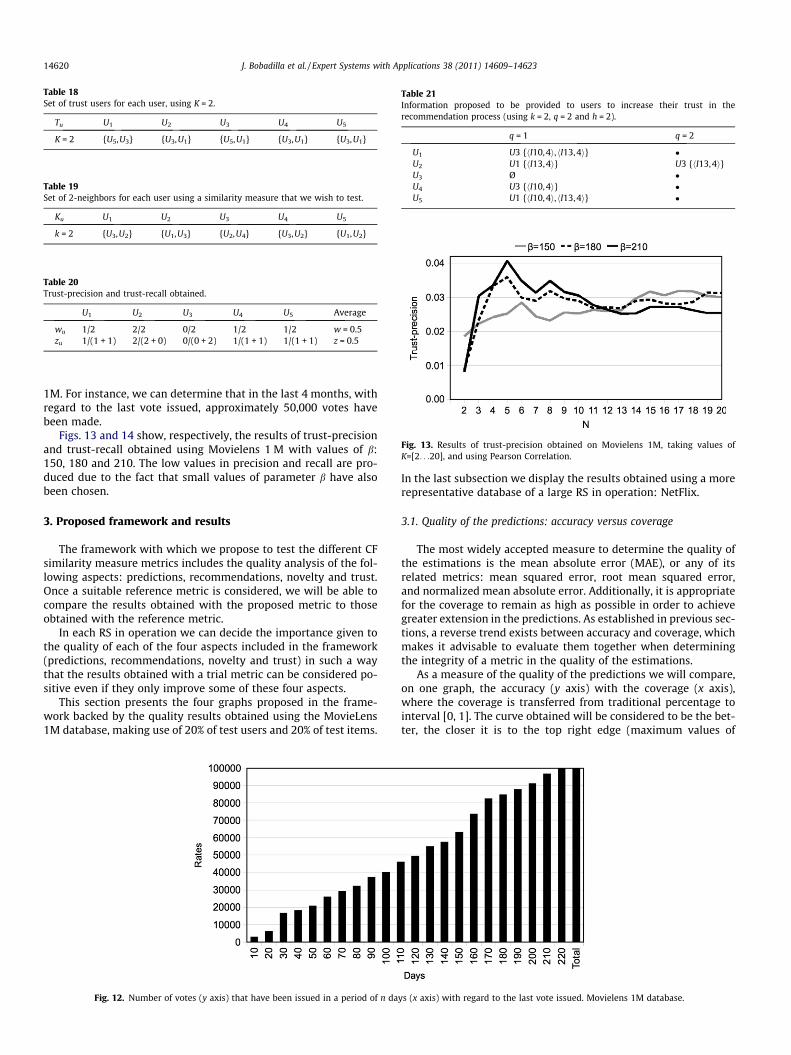
Table 18Set of trust users for each user, using K = 2.
Tu U1 U2 U3 U4 U5
K = 2 {U5,U3} {U3,U1} {U5,U1} {U3,U1} {U3,U1}
Table 19Set of 2-neighbors for each user using a similarity measure that we wish to test.
Ku U1 U2 U3 U4 U5
k = 2 {U3,U2} {U1,U3} {U2,U4} {U3,U2} {U1,U2}
Table 20Trust-precision and trust-recall obtained.
U1 U2 U3 U4 U5 Average
wu 1/2 2/2 0/2 1/2 1/2 w = 0.5zu 1/(1 + 1) 2/(2 + 0) 0/(0 + 2) 1/(1 + 1) 1/(1 + 1) z = 0.5
Table 21Information proposed to be provided to users to increase their trust in therecommendation process (using k = 2, q = 2 and h = 2).
q = 1 q = 2
U1 U3 {hI10,4i, hI13,4i} �U2 U1 {hI13,4i} U3 {hI13,4i}U3 Ø �U4 U3 {hI10,4i} �U5 U1 {hI10,4i, hI13,4i} �
Fig. 13. Results of trust-precision obtained on Movielens 1M, taking values ofK=[2. . .20], and using Pearson Correlation.
14620 J. Bobadilla et al. / Expert Systems with Applications 38 (2011) 14609–14623
1M. For instance, we can determine that in the last 4 months, withregard to the last vote issued, approximately 50,000 votes havebeen made.
Figs. 13 and 14 show, respectively, the results of trust-precisionand trust-recall obtained using Movielens 1 M with values of b:150, 180 and 210. The low values in precision and recall are pro-duced due to the fact that small values of parameter b have alsobeen chosen.
3. Proposed framework and results
The framework with which we propose to test the different CFsimilarity measure metrics includes the quality analysis of the fol-lowing aspects: predictions, recommendations, novelty and trust.Once a suitable reference metric is considered, we will be able tocompare the results obtained with the proposed metric to thoseobtained with the reference metric.
In each RS in operation we can decide the importance given tothe quality of each of the four aspects included in the framework(predictions, recommendations, novelty and trust) in such a waythat the results obtained with a trial metric can be considered po-sitive even if they only improve some of these four aspects.
This section presents the four graphs proposed in the frame-work backed by the quality results obtained using the MovieLens1M database, making use of 20% of test users and 20% of test items.
Fig. 12. Number of votes (y axis) that have been issued in a period of n da
In the last subsection we display the results obtained using a morerepresentative database of a large RS in operation: NetFlix.
3.1. Quality of the predictions: accuracy versus coverage
The most widely accepted measure to determine the quality ofthe estimations is the mean absolute error (MAE), or any of itsrelated metrics: mean squared error, root mean squared error,and normalized mean absolute error. Additionally, it is appropriatefor the coverage to remain as high as possible in order to achievegreater extension in the predictions. As established in previous sec-tions, a reverse trend exists between accuracy and coverage, whichmakes it advisable to evaluate them together when determiningthe integrity of a metric in the quality of the estimations.
As a measure of the quality of the predictions we will compare,on one graph, the accuracy (y axis) with the coverage (x axis),where the coverage is transferred from traditional percentage tointerval [0, 1]. The curve obtained will be considered to be the bet-ter, the closer it is to the top right edge (maximum values of
ys (x axis) with regard to the last vote issued. Movielens 1M database.
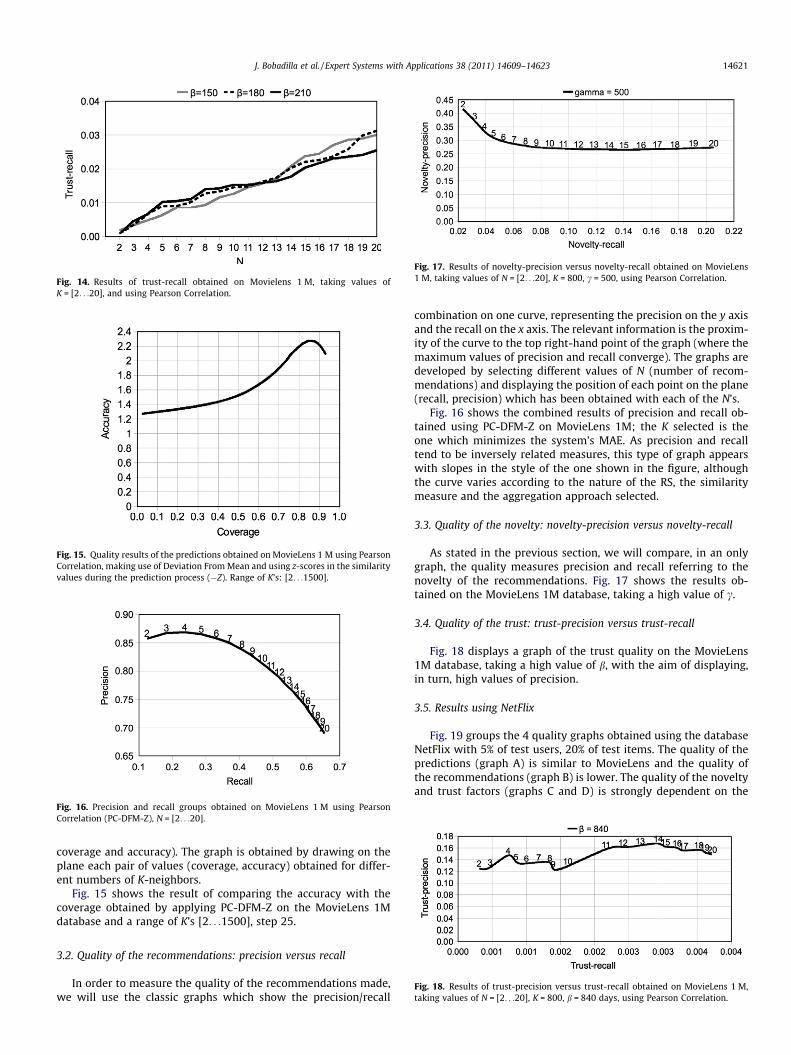
Fig. 14. Results of trust-recall obtained on Movielens 1 M, taking values ofK = [2. . .20], and using Pearson Correlation.
Fig. 15. Quality results of the predictions obtained on MovieLens 1 M using PearsonCorrelation, making use of Deviation From Mean and using z-scores in the similarityvalues during the prediction process (�Z). Range of K’s: [2. . .1500].
Fig. 16. Precision and recall groups obtained on MovieLens 1 M using PearsonCorrelation (PC-DFM-Z), N = [2. . .20].
Fig. 17. Results of novelty-precision versus novelty-recall obtained on MovieLens1 M, taking values of N = [2. . .20], K = 800, c = 500, using Pearson Correlation.
J. Bobadilla et al. / Expert Systems with Applications 38 (2011) 14609–14623 14621
coverage and accuracy). The graph is obtained by drawing on theplane each pair of values (coverage, accuracy) obtained for differ-ent numbers of K-neighbors.
Fig. 15 shows the result of comparing the accuracy with thecoverage obtained by applying PC-DFM-Z on the MovieLens 1Mdatabase and a range of K’s [2. . .1500], step 25.
Fig. 18. Results of trust-precision versus trust-recall obtained on MovieLens 1 M,taking values of N = [2. . .20], K = 800, b = 840 days, using Pearson Correlation.
3.2. Quality of the recommendations: precision versus recall
In order to measure the quality of the recommendations made,we will use the classic graphs which show the precision/recall
combination on one curve, representing the precision on the y axisand the recall on the x axis. The relevant information is the proxim-ity of the curve to the top right-hand point of the graph (where themaximum values of precision and recall converge). The graphs aredeveloped by selecting different values of N (number of recom-mendations) and displaying the position of each point on the plane(recall, precision) which has been obtained with each of the N’s.
Fig. 16 shows the combined results of precision and recall ob-tained using PC-DFM-Z on MovieLens 1M; the K selected is theone which minimizes the system’s MAE. As precision and recalltend to be inversely related measures, this type of graph appearswith slopes in the style of the one shown in the figure, althoughthe curve varies according to the nature of the RS, the similaritymeasure and the aggregation approach selected.
3.3. Quality of the novelty: novelty-precision versus novelty-recall
As stated in the previous section, we will compare, in an onlygraph, the quality measures precision and recall referring to thenovelty of the recommendations. Fig. 17 shows the results ob-tained on the MovieLens 1M database, taking a high value of c.
3.4. Quality of the trust: trust-precision versus trust-recall
Fig. 18 displays a graph of the trust quality on the MovieLens1M database, taking a high value of b, with the aim of displaying,in turn, high values of precision.
3.5. Results using NetFlix
Fig. 19 groups the 4 quality graphs obtained using the databaseNetFlix with 5% of test users, 20% of test items. The quality of thepredictions (graph A) is similar to MovieLens and the quality ofthe recommendations (graph B) is lower. The quality of the noveltyand trust factors (graphs C and D) is strongly dependent on the
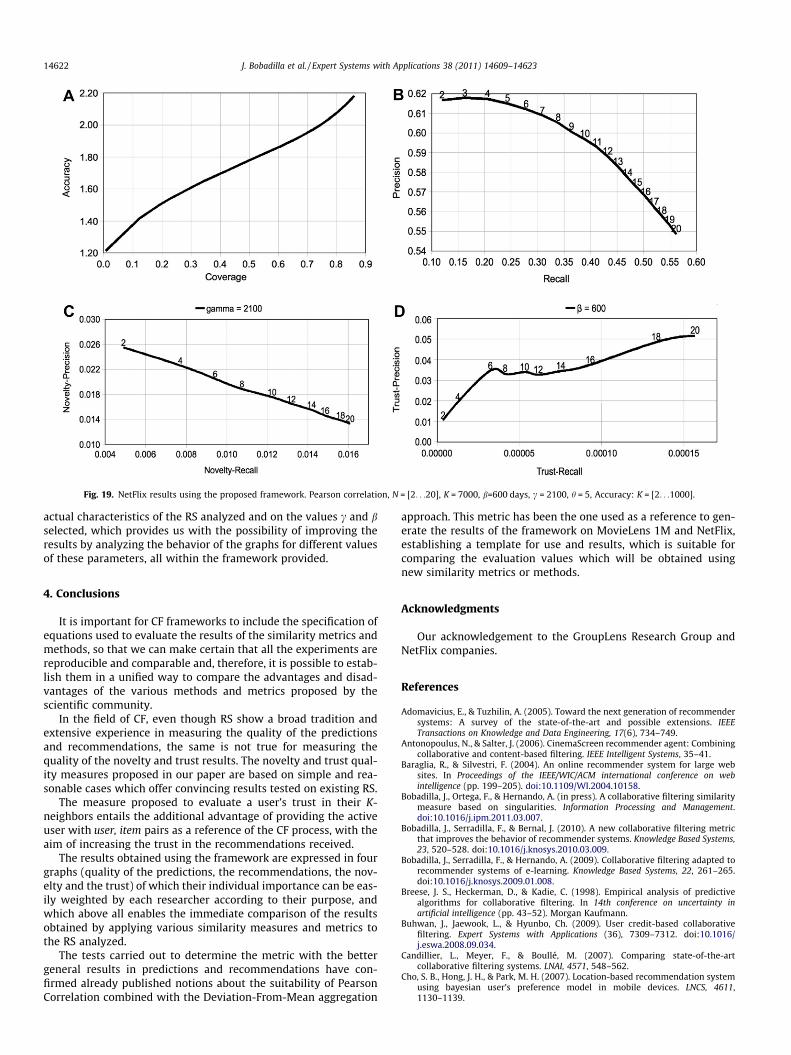
Fig. 19. NetFlix results using the proposed framework. Pearson correlation, N = [2. . .20], K = 7000, b=600 days, c = 2100, h = 5, Accuracy: K = [2. . .1000].
14622 J. Bobadilla et al. / Expert Systems with Applications 38 (2011) 14609–14623
actual characteristics of the RS analyzed and on the values c and bselected, which provides us with the possibility of improving theresults by analyzing the behavior of the graphs for different valuesof these parameters, all within the framework provided.
4. Conclusions
It is important for CF frameworks to include the specification ofequations used to evaluate the results of the similarity metrics andmethods, so that we can make certain that all the experiments arereproducible and comparable and, therefore, it is possible to estab-lish them in a unified way to compare the advantages and disad-vantages of the various methods and metrics proposed by thescientific community.
In the field of CF, even though RS show a broad tradition andextensive experience in measuring the quality of the predictionsand recommendations, the same is not true for measuring thequality of the novelty and trust results. The novelty and trust qual-ity measures proposed in our paper are based on simple and rea-sonable cases which offer convincing results tested on existing RS.
The measure proposed to evaluate a user’s trust in their K-neighbors entails the additional advantage of providing the activeuser with user, item pairs as a reference of the CF process, with theaim of increasing the trust in the recommendations received.
The results obtained using the framework are expressed in fourgraphs (quality of the predictions, the recommendations, the nov-elty and the trust) of which their individual importance can be eas-ily weighted by each researcher according to their purpose, andwhich above all enables the immediate comparison of the resultsobtained by applying various similarity measures and metrics tothe RS analyzed.
The tests carried out to determine the metric with the bettergeneral results in predictions and recommendations have con-firmed already published notions about the suitability of PearsonCorrelation combined with the Deviation-From-Mean aggregation
approach. This metric has been the one used as a reference to gen-erate the results of the framework on MovieLens 1M and NetFlix,establishing a template for use and results, which is suitable forcomparing the evaluation values which will be obtained usingnew similarity metrics or methods.
Acknowledgments
Our acknowledgement to the GroupLens Research Group andNetFlix companies.
References
Adomavicius, E., & Tuzhilin, A. (2005). Toward the next generation of recommendersystems: A survey of the state-of-the-art and possible extensions. IEEETransactions on Knowledge and Data Engineering, 17(6), 734–749.
Antonopoulus, N., & Salter, J. (2006). CinemaScreen recommender agent: Combiningcollaborative and content-based filtering. IEEE Intelligent Systems, 35–41.
Baraglia, R., & Silvestri, F. (2004). An online recommender system for large websites. In Proceedings of the IEEE/WIC/ACM international conference on webintelligence (pp. 199–205). doi:10.1109/WI.2004.10158.
Bobadilla, J., Ortega, F., & Hernando, A. (in press). A collaborative filtering similaritymeasure based on singularities. Information Processing and Management.doi:10.1016/j.ipm.2011.03.007.
Bobadilla, J., Serradilla, F., & Bernal, J. (2010). A new collaborative filtering metricthat improves the behavior of recommender systems. Knowledge Based Systems,23, 520–528. doi:10.1016/j.knosys.2010.03.009.
Bobadilla, J., Serradilla, F., & Hernando, A. (2009). Collaborative filtering adapted torecommender systems of e-learning. Knowledge Based Systems, 22, 261–265.doi:10.1016/j.knosys.2009.01.008.
Breese, J. S., Heckerman, D., & Kadie, C. (1998). Empirical analysis of predictivealgorithms for collaborative filtering. In 14th conference on uncertainty inartificial intelligence (pp. 43–52). Morgan Kaufmann.
Buhwan, J., Jaewook, L., & Hyunbo, Ch. (2009). User credit-based collaborativefiltering. Expert Systems with Applications (36), 7309–7312. doi:10.1016/j.eswa.2008.09.034.
Candillier, L., Meyer, F., & Boullé, M. (2007). Comparing state-of-the-artcollaborative filtering systems. LNAI, 4571, 548–562.
Cho, S. B., Hong, J. H., & Park, M. H. (2007). Location-based recommendation systemusing bayesian user’s preference model in mobile devices. LNCS, 4611,1130–1139.

J. Bobadilla et al. / Expert Systems with Applications 38 (2011) 14609–14623 14623
Fesenmaier, D. R., Gretzel, U., Knoblock, C., Paris, C., Ricci, C., Stabb, S., et al. (2002).Intelligent systems for tourism. Intelligent Systems, 17(6), 53–66.
Fuyuki, I., Quan, T. K., & Shinichi, H. (2006). Improving accuracy of recommendersystems by clustering items based on stability of user similarity. In IEEEinternational conference on intelligent agents, web technologies and internetcommerce (p. 61). doi:10.1109/CIMCA.2006.123.
Giaglis, GM., & Lekakos, G. (2006). Improving the prediction accuracy ofrecommendation algorithms: approaches anchored on human factors.Interacting with Computers, 18(3), 410–431.
Goldberg, K., Roeder, T., Gupta, D., & Perkins, C. (2001). Eigentaste: A constant timecollaborative filtering algorithm. Information Retrieval, 4(2), 133–151.
Herlocker, J. L., Konstan, J. A., Borchers, A., & Riedl, J. (1999). An algorithmicframework for performing collaborative filtering. SIGIR, 230–237.
Herlocker, J. L., Konstan, J. A., Riedl, J. T., & Terveen, L. G. (2004). Evaluatingcollaborative filtering recommender systems. ACM Transactions on InformationSystems, 22(1), 5–53.
Hernández, F., & Gaudioso, E. (2008). Evaluation of recommender systems: A newapproach. Expert Systems with Applications, 1(35), 790–804. doi:10.1016/j.eswa.2007.07.047.
Hijikata, Y., Shimizu, T., & Nishida S. (2009). Discovery-oriented collaborativefiltering for improving user satisfaction. In Proceedings of 14th internationalconference on Intelligent user interface (pp. 67–76). doi:10-1145/1502650.1502663.
Ingoo, H., Kyong, J. O., & Tae, H. R. (2003). The collaborative filteringrecommendation based on SOM cluster-indexing CBR. Expert Systems withApplications, 25, 413–423.
Jinghua, H., Kangning, W., & Shaohong, F. (2007). A survey of e-commercerecommender systems. In Proceedings of the international conference on servicesystems and service management (pp. 1–5). doi:10.1109/ICSSSM.2007.4280214.
Kitisin, S., & Neuman, C. (2006). Reputation-based trust-aware recommendersystem. Securecomm, 1–7. doi:10.1109/SECCOMW.2006.359555.
Kong, F., Sun, X., Ye, S. (2005). A comparison of several algorithms for collaborativefiltering in startup stage. In Proceedings of IEEE network, sensing and control (pp.25–28).
Konstan, J. A., Miller, B. N., & Riedl, J. (2004). PocketLens: Toward a personalrecommender system. ACM Transactions on Information Systems, 22(3), 437–476.
Koutrika, G., Bercovitz, B., & Garcia, H. (2009). FlexRecs: Expressing and combiningflexible recommendations. SIGMOD, 745–757.
Kwiseok, K., Jinhyung, Ch., & Yongtae, P. (2009). Multidimensional credibility modelfor neighbor selection in collaborative recommendation. Expert Systems withApplications (36), 7114–7122. doi:10.1016/j.eswa.2008.08.071.
Li, P., & Yamada, S. (2004). A movie recommender system based on inductivelearning. In IEEE conference on cybernetics and intelligent systems (Vol. 1, pp.318–323). doi:10.1109/ICCIS.2004.1460433.
Manolopoulus, Y., Nanopoulus, A., Papadopoulus, A. N., & Symeonidis, P. (2007).Collaborative recommender systems: Combining effectiveness and efficiency.Expert Systems with Applications, 4(34), 2995–3013. doi:10.1016/j.eswa.2007.05.013.
O’Donovan, J., & Smyth, B. (2005). Trust in recommender systems. In IUI’05 (pp. 9–12).
Sanchez, J. L., Serradilla, F., Martinez, E., & Bobadilla, J. (2008). Choice of metricsused in collaborative filtering and their impact on recommender systems. IEEEDEST, 432–436. doi:10.1109/DEST.2008.4635147.
Schafer, J. B., Frankowski, D., Herlocker, J. L., & Sen, S. (2007). Collaborative filteringrecommender systems. LNCS, 4321, 291–324.
Serrano, J., Viedma, E. H., Olivas, J. A., Cerezo, A., & Romero, F. P. (2011). A Googlewave-based fuzzy recommender system to disseminate information inuniversity digital libraries 2.0. Information Sciences, 181(8), 1503–1516.
Su, X., & Khoshgoftaar, T. M. (2009). A survey of collaborative filtering techniques.Advances in Artificial Intelligence, 2–19. doi:10.1155/2009/421425.
Symeonidis, P., Nanopoulos, A., & Manolopoulos, Y. (2008). Providing justificationsin recommender systems. IEEE Transactions on Systems, Man and Cybernetics,38(6), 1262–1272. doi:10.1109/TSMCA.2008.2003969.
Yager, R. R. (2003). Fuzzy logic methods in recommender systems. Fuzzy Sets andSystems, 136(2), 133–149.
Zhang, F. (2008). Research on recommendation list diversity of recommendersystems. ICMECG, 72–76. doi:10.1109/ICMECG.2008.32.