a formal specification scheme for network diagrams that facilitates automated design
TRANSCRIPT
Journal of Visual Languages and Computing (1991) 2, 395-414
A Formal Specification Scheme for Network Diagrams That Facilitates Automated Design
JOE MARKS::"
Center for Research in Computing Technology, Harvard University, Cambridge, Massachussetts 02138, U.S.A.
Received forpublication 1 March 1991 and aecepted IS July 1991
The Automated Network Diagram Designer (ANDD) designs network diagrams automatically to communicate given information. ANDD makes all the design decisions a human graphic designer would make when designing a network diagram: it determines how different types of information should be expressed graphically, specifies a desirable perceptual organization for the diagram, picks appropriate graphical-property values for symbols in the diagram and computes an aesthetic layout that exhibits appropriate perceptual groupings. The ANDD system uses a formal specification scheme for describing the syntax, semantics and pragmatics of network diagrams. The network-diagram syntax described below differs from previous work in two ways: perceptual organization is represented explicitly and syntax is specified using constraints rather than term-rewriting rules. The semantic/pragmatic specification used by ANDD is also novel: it supports the notion of mutable semantics and'relates the information to be communicated directly to the graphical properties of symbols and to the overall perceptual organization of a diagram.
1. I n t r o d u c t i o n
IN THE NOT TOO DISTANT FUTURE we can expect to see the development of collaborative computer systems that work with people to complete various problem-solving tasks. Indeed, research on the planning and discourse aspects of collaborative systems has been under way for some years in the A I community [2]. The computer-human interaction aspects of collaborative systems present unique challenges to the user interface designer. In particular, the nature of computer-to-human communication can be expected to change radically, with increased reliance on natural language and informational graphics. The notion of collaborative system essentially precludes the use of 'canned' natural language utterances and graphics: because such a system will be used to collaborate on problems not previously encountered, we require it to be both linguistically articulate and graphically articulate so that new situations can be described effectively. In other words, a collaborative system must be capable of composing natural language utterances and designing informational graphics auto- matically to communicate new and arbitrary inforination.
The automated design of informational graphics is a relatively new field. Previous research has addressed the automated design of iconic displays [3, 4], chart graphs [5,
An earlier version of this paper was presented at the 1990 IEEE Workshop on Visual Languages [1]. This research was funded under a contract from US WEST Advanced Technologies.
* The author's current address is Digital Equipment Corporation, Cambridge Research Laboratory, One Kendall Square, Building 700, Cambridge, Massachussetts 02139.
1045-926X/91/040395 + 20 $03.00/0 (~) 1991 Academic Press Limited
396 j. MARKS
6, 7], scientific visualizations [8] and 3-D illustrations of physical objects and actions [9, 10]. Network diagrams (also called networks, node-link diagrams, circle-and- arrow diagrams, charts and graphs) are another important graphic form used for information presentation [11]. Previous work on automating the design of network diagrams has focused almost exclusively on the subtask of aesthetic layout [12]." The Automated Network Diagram Designer (ANDD) is an application-independent system that designs network diagrams automatically to communicate given informa- tion [15]. ANDD makes all the design decisions a human graphic designer is required to make when designing a network diagram: the system determines how different types of information should be expressed graphically, specifies a desirable perceptual organization for the diagram, picks suitable graphical-property values for each symbol in the diagram and computes an aesthetic layout that exhibits appropriate perceptual groupings. A key aspect of the ANDD system is its reliance on a formal specification scheme for describing the syntax, semantics and pragmatics of network diagrams that has been formulated with the express purpose of facilitating automated design. The specification scheme is the topic of this paper.
The approach to network diagram specification described in this paper differs from previous work in a number of significant ways. Any approach to automated graphic design must include (implicitly or explicitly) knowledge about the perceptual- organization characteristics of the human visual system [16, 17]. A novel aspect of the network diagram syntax presented below is the explicit representation of perceptual grouping (by proximity, similarity, alignment, etc.), perceptual ordering, and per- ceived magnitude relationships between the symbols in a diagram. Another novel aspect is the description of syntax in terms of constraints ranging over the graphical properties and layout of symbols, in contrast to the more traditional approach of using a grammar of term-rewriting rules (e.g., [18, 19]). b The semantic/pragmatic specification used by ANDD is also novel: the specification scheme supports the notion of mutable sematics (i.e. different network diagrams designed by ANDD can have different semantic interpretation rules), and relates the information to be communicated directly to the graphical properties of symbols and to the overall perceptual organization of a network diagram.
2. How the Design Task Influences Specification
The nature of the formal specification scheme described in later sections reflects the purpose for which it is used, namely automated graphic design. In order to under- stand better the design process and its influence on the specification scheme, we first review a representative selection of network diagrams designed by the ANDD system, and then discuss guidelines for network-diagram design.
, I
~A notable exception is the TRIP system, due to Kamada and Kawai [13]. The TRIP system is based on many of the same premises as the ANDD system, but it uses a comparatively limited network diagram syntax, lacks an adequate representation for semantics and pragmatics, does not support fully automated design (substantial explicit design direction must be supplied by the human user) and uses a relatively weak laYbOUt algorithm [14].
The use of constraints in visual language specification may be an emerging trend: two recent examples are the aforementioned TRIP system [13], and the hybrid picture layout grammars of Golin and Reiss that consist of term-rewriting rules that can be applied only when associated constraints are satisfied [20].
FORMAL SPECIFICATION SCHEME FOR NETWORK DIAGRAMS 397
2.1. Network Diagrams Designed by ANDD
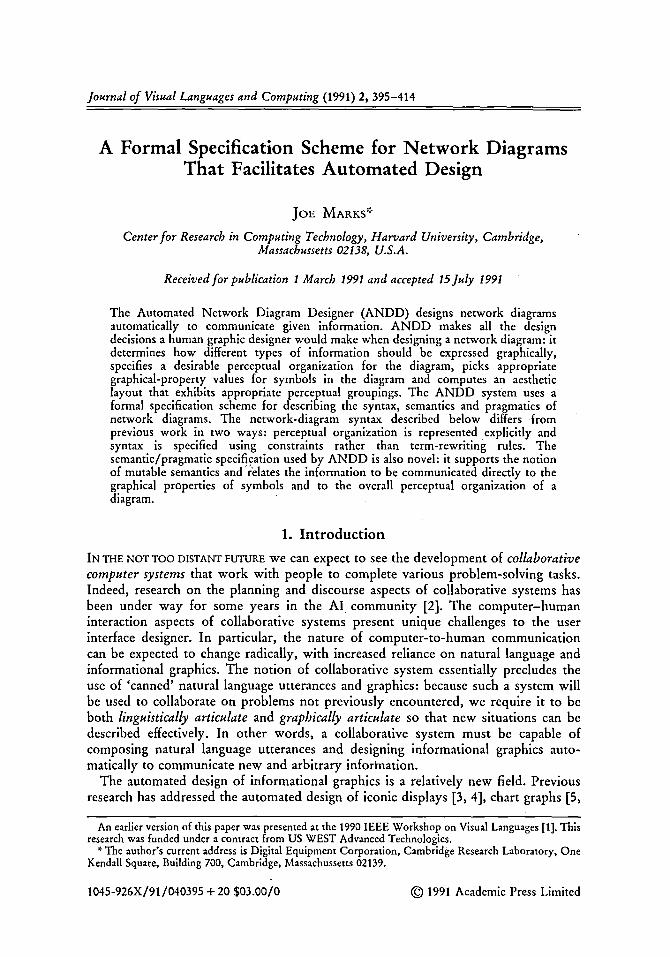
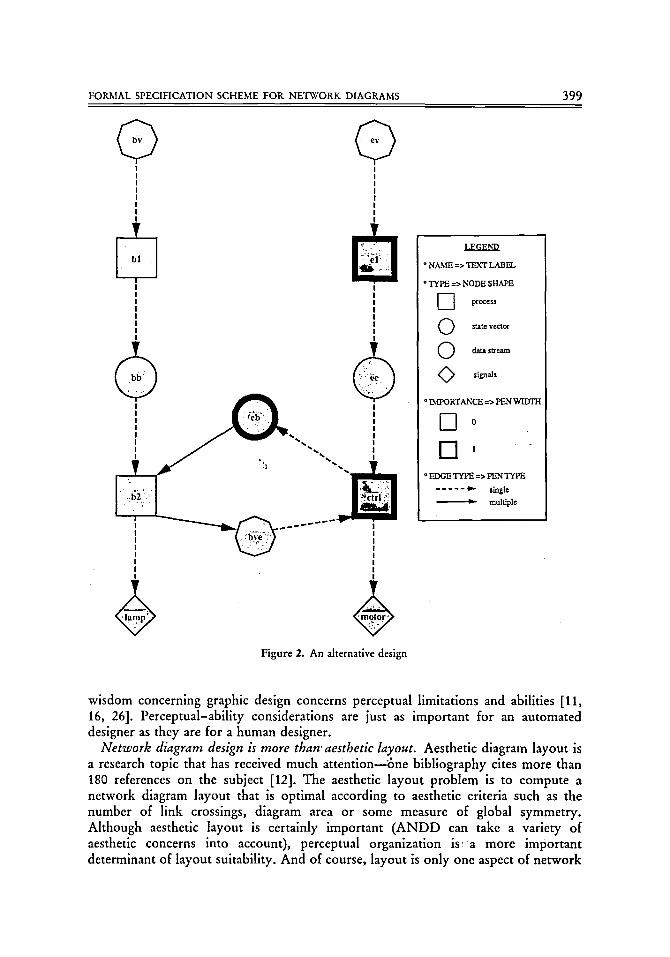
Figures 1 and 2 contain network diagrams designed by ANDD that communicate the same information, but in different ways. c The main difference between the two diagrams is how they communicate the application-dependent types of the depicted vertices: this information is conveyed by means of labeled enclosure boxes in Figure 1, whereas the same information is conveyed by node shape in Figure 2. Another significant diffrence between the diagrams is their very different perceptual organiza- tions. The layout of nodes is such that different perceptual groupings are evident in each diagram: nodes in the first diagram form perceptual gestalts due to grouping by proximity, symmetry and closure; the relevant perceptual gestalts in the second diagram are due to perceptual grouping by evenly spaced alignment, d Other perceptual gestalts are evident in Figure 3, which contains a network diagram with different informational content.
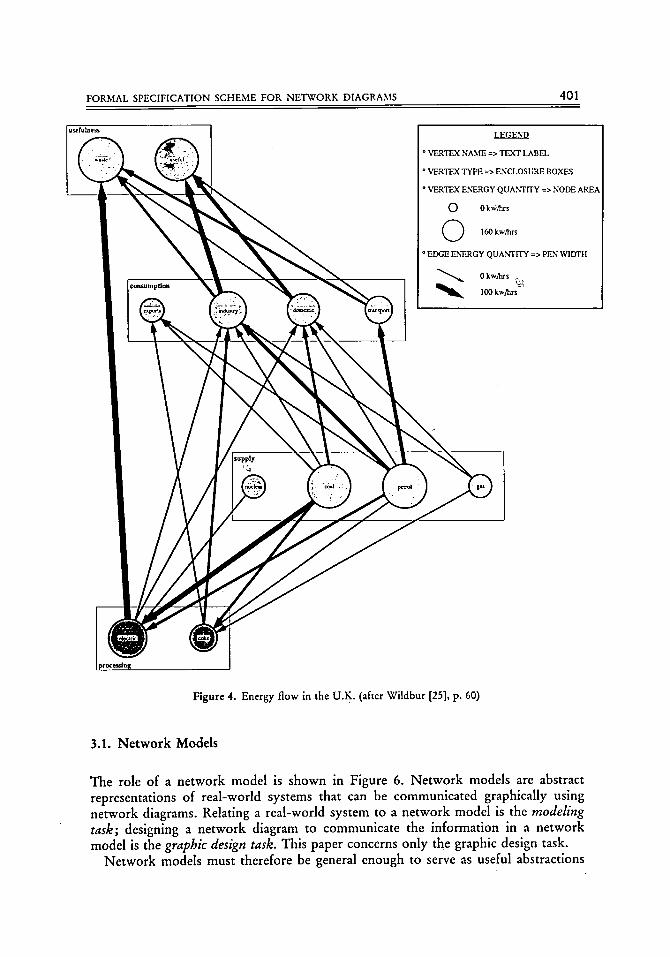
The diagrams above illustrate how topological connectivity, nominal data and ordinal data can be communicated effectively by network diagrams. Although chart graphics (i.e. bar charts, line graphs, pie charts, etc.) are the most useful graphic form for communicating quantitative data, network diagrams can also be useful in this regard. Figure 4 contains a diagram that communicates quantitative data in addition to other types of non-quantitative information.
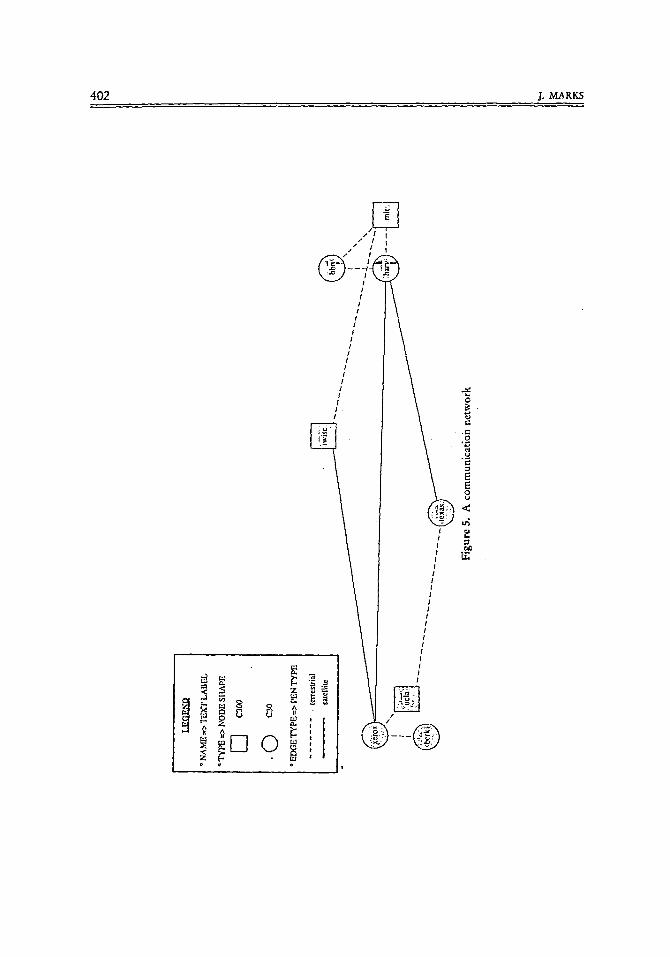
In the previous diagrams layout is dictated by perceptual-organization and aesthetic considerations. The interesting aspect of the network diagram in Figure 5 is the approximate correspondence between the layout of the diagram and the geography of the communication network it depicts (i.e. the layout of the diagram expresses a notion of approximate geography), which makes it easy to find particular hosts.
2.2. Design Considerations
Figures 1-5 show that ANDD is capable of designing network diagrams that conform to accepted principles of good graphic design [11, 26]. In this subsection I summarize the design considerations that I consider most important for the automated design of network diagrams.
Good designers use the entire gamut of graphical properties to communicate information. A good graphic designer will try to determine the most effective graphical expression for .the information to be communicated, using whatever graphical properties are most appropriate. Conversely, a designer who makes restricted use of available graphical properties will exhibit limited design flexibility, e
c ANDD designed all aspects of the network diagrams shown, save for the diagram legends. The legends are specified symbolically by ANDD, but drawn by hand. Side-by-side comparisons of human-designed network diagrams with ANDD-designed diagrams that communicate the same information can be found in Marks [21].
a The terminology used to describe the various kinds of perceptual grouping exhibited in the diagrams is not the standard terminology used by perceptual psychologists [22,23J---some of the groupings shown would probably be classified as Good Continuation of Good Form gestalts--but is more resonant with the context.
�9 Color is an important graphical property that is not evident in Figures 1-5, because the ANDD system used a graphical palette suited to a monochrome display when designing the network diagrams in these figures. When passed a suitable graphical palette, ANDD is capable of incorporating color into its designs.
398 j. MARKS
I.EGEN'D
* NA.~,fl~ => TEXT L A B E L
* TYPE ---> ENCLOSURE BOXES
* LMPORTANCE --> PEN WIDTH
� 9
0 ~ * EDGE TYPE => PEN TYPE
. . . . . ~ " shaglc
multiple
Q I I �9 I �9
I I �9 I �9 I I q I
I 1 q I $ I I �9 I �9
�9 1 �9 I �9 I I �9 I �9
�9 1 �9 I �9 �9 1 �9 I �9
I 1 �9 I �9
/ I I - - | II I | I It I I 1 I I I I It I I I I I I
$
I,
|
' i ! I | I I | I | I I I l I
1
1
I
slat~..~'eclor
I �9
I I I I I �9 | |
I | I I I I | I I "
| ! I I I I I
- - - !
I I I | I | I I I I I I | I I
I I I | I I I I |
1 ! I I |
I
! I I I | I I I I I I | I I I I I I I I | | I
I I
G Figure 1. A system for controlling elevators (after Sanden [24], p. 337)
Network diagrams have a mutable.,sematics. A corollary to the previous point is that a designer of network diagrams should be capable of drawing diagrams with mutable sematics, i.e. diagrams with different rules of sematic interpretation. The semantic interpretation rules that apply to a particular diagram are usually described in an accompanying legend. The legends in Figures 1-5 illustrate the variety of ways in which different types of information can be expressed graphically.
Respect perceptual limitations; exploit perceptual abilities. Much of the conventional
F O R M A L S P E C I F I C A T I O N S C H E M E F O R N E T W O R K D I A G R A M S 399
Q Q
13 ~
o NAME --'> TEXT L A B I t
TYPE => NODE SHAPE
[ ~ process
signals
~ IMPORTANCE => PEN WIDTH
D o R '
o t~IX3E TYPE => P E N ' r Y ~
. . . . . 4~ single
w, multiple
$ $ Figure 2. An alternative design
wisdom concerning graphic design concerns perceptual limitations and abilities [11, 16, 26]. Perceptual-ability considerations are just as important for an automated designer as they are for a human designer.
Network diagram design is more than'aesthetic layout. Aesthetic diagram layout is a research topic that has received much attention--6ne bibliography cites more than 180 references on the subject [12]. The aesthetic layout problem is to compute a network diagram layout that is optimal according to aesthetic criteria such as the number of link crossings, diagram area or some measure of global symmetry. Although aesthetic layout is certainly important (ANDD can take a variety of aesthetic concerns into account), perceptual organization is~a more important determinant of layout suitability. And of course, layout is only one aspect of network

400 J. MARKS
/ -. ) ',, Q ,, ,, ,.. / -, -... ',.
ss SrS ~ ~%,~ oss SS
\ ) �9
| ',, / \ i | .... |
�9 ............. "@ ~ VERTEX AFFILIATION => NODE SHAPE . - " " " " " i "''"" "-.
r-) :,0,,,-~, <S>"" <~ ""<8>
o @," ,8> "r sales office
"EDGE TYPE => LINK PEN TYPE
no. 7 signalling . . . . . . . network voice !
dampa~s :
Figure 3. A design that exhibits various perceptual gestalts
diagram design: there are many design issues that concern the non-layout-related graphical properties of the various symbols--nodes, links, enclosure boxes and text labelsmthat can appear in network diagrams.
Inappropriate perceptual organization leads to inferior designs. To restate and amplify the previous point, appropriate perceptual organization is the key to superior graphic design [!6, 17]. Moreover, inappropriate perceptual organization can lead to false graphical implicatures if the viewer is led to draw incorrect inferences due to the presence of misleading perceptual groupings or orderings [15, 27]. It is no accident that the perceptual groupings in Figures 1-5, for example, conform so well to the information being commufiicated: the ANDD system reasons about perceptual organization as part of its automated design process.
The influence of these design considerations can be seen in the formal specification scheme for network diagrams described in the following three sections.
3. I n f o r m a t i o n R e p r e s e n t a t i o n
In this section I describe a representation scheme for the information that can be communicated by network diagrams. Information is represented as attributed graphs (i.e., graphs in which the vertices and edges can have attribute-value pairs associated with them) that I call network models. The ANDD system takes a network model as input, along with optional pragmatic design directives that are explained below, and produces as output a network diagram that depicts the network model.
F O R M A L S P E C I F I C A T I O N S C H E M E F O R N E T W O R K D I A G R A M S 401
u~fu~e~
coasumpOom
LEGEND
~ VERTEX NAME => TEXT LABEL
~ VERTEX TYPE => ENCLOSURE BOXES
~ VERTEX ENERGY QUANTITY => NODE AREt
0 0 k~;/~s
Q 160 kw/hts
~ EDGE ENERGY QUANTITY => PEN WIDTH
0 kwAas
100 kw/l~rs
supply
Figure 4. Energy flow in the U.K. (after Wildbur [25] , p . 60)
3.1. Network Models
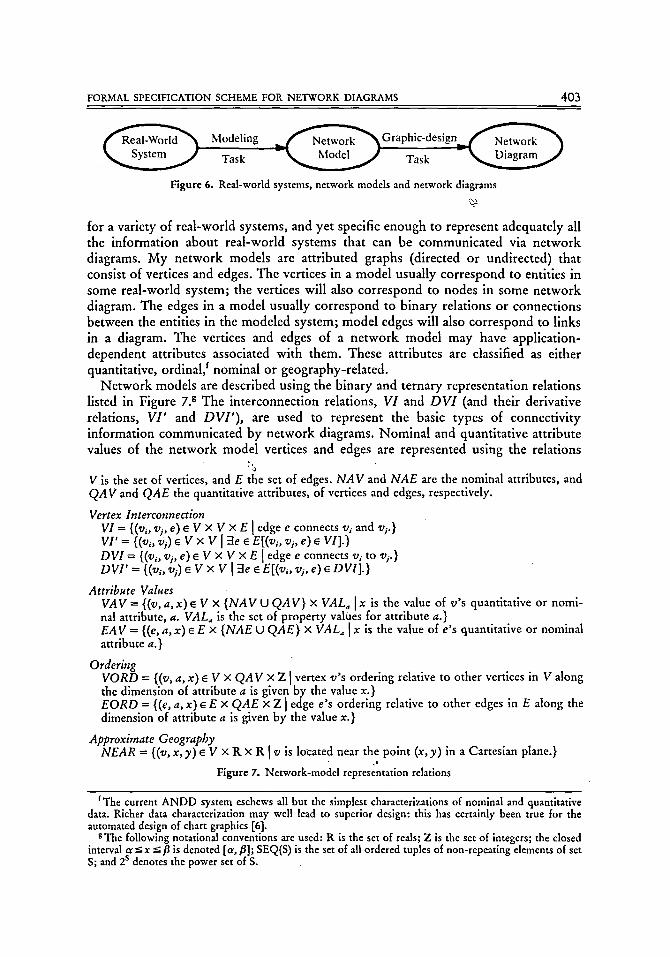
The role of a network model is shown in Figure 6. Network models are abstract representations of real-world systems that can be communicated graphically using network diagrams. Relating a real-world system to a network model is the modeling task; designing a network diagram to communicate the information in a network model is the graphic design task. This paper concerns only the graphic design task.
Network models must therefore be general enough to serve as useful abstractions
4 0 2 j. MARKS
Z
o i~ - ~ 0 o z
~iDOg
/ !
/
I I I I
/ I
I !
/
!!
t2
E E 8
r !
I
I I I I I I I I I I
/ I I I
N /
FORMAL SPECIFICATION SCHEME FOR NETWORK DIAGRAMS 403
~ Modeling ~ G r a p h i c - d e s i g n ~
Task - ~ Task - ~
Figure 6. Real-world systems, network models and network diagrams
for a variety of real-world systems, and yet specific enough to represent adequately all the information about real-world systems that can be communicated via network diagrams. My network models are attributed graphs (directed or undirected) that consist of vertices and edges. The vertices in a model usually correspond to entities in some real-world system; the vertices will also correspond to nodes in some network diagram. The edges in a model usually correspond to binary relations or connections between the entities in the modeled system; model edges will also correspond to links in a diagram. The vertices and edges of a network model may have application- dependent attributes associated with them. These attributes are classified as either quantitative, ordinal, t nominal or geography-related.
Network models are described using the binary and ternary representation relations listed in Figure 7. g The interconnection relations, V I and D V I (and their derivative relations, V I ' and D V I ' ) , are used to represent the basic types of connectivity information communicated by network diagrams. Nominal and quantitative attribute values of the network model vertices and edges are represented using the relations
r5 V is the set of vertices, and E the set of edges. N A V and N A E are the nominal attributes, and Q A V and QAE the quantitative attributes, of vertices and edges, respectively.
Vertex Interconnection VI = {(vi, v i, e) ~ V • V • E [ edge e connects vi and vi. } VI' = {(vi, v i) ~ V x V ] 3e ~ E[(vl, vi, e) ~ VII.} DVI = {(v;, vi, e) e V x V x E I edge e connects vi to vi. } DVI ' = {(v~, vi) e V x V 1 3e ~ E[(v,, v i, e) ~ DVI].}
Attribute Values VAV = {(v, a, x) e V x { N A V U Q A V } x VAL, I x is the value of v's quantitative or nomi- nal attribute, a. VAL, is the set of property values for attribute a.} EA V = {(e, a, x) e E • { NAE U QAE } x VAL, [ x is the value of e's quantitative or nominal attribute a.}
Ordering VORD = {(v, a, x) E V x Q A V x Z I vertex v's ordering relative to other vertices in V along the dimension of attribute a is given by the value x.} EORD = {(e, a, x) ~ E x QAE x Z [ edge e s ordering relative to other edges in E along the dimension of attribute a is given by the value x.}
Approximate Geography NEAR = {(v, x, y) ~ V • R • R [ v is lo'cated near the point (x, y) in a Cartesian plane.}
., Figure 7. Network-model representation relations
fThe current ANDD system eschews all but the simplest characterizations of nominal and quantitative data. Richer data characterization may well lead to superior design: this has certainly been true for the automated design of chart graphics [6].
gThe following notational conventions are used: R is the set of reals; Z is the set of integers; the closed interval ~-<x -<,B is denoted [o~,/8]; SEQ(S) is the set of all ordered tuples of non-repeating elements of set S; and 2 s denotes the power set of S.

404 J. MARKS
GRAPH. DEFINITION VERTICES: {vl, v2, v3, v4, v5, v6, v7, v8, v9, vl0, v11, v12} EDGES: {el, e2, e3, e4, e5, e6, e7, e8, e9, elO,el l , e12) DVI = {(vl, v3, el), (v2, v4, e2), (v3, vS, e3), (v4, vT, e4), (vS, v8, e5), (v8, v6, e6),
(v6, vl0, e7), (v7, vlO, e8), (v9, vS, e9), (vl0, v9, elO), (v8, v11, e11), (vl0, v12, e12)}
ATTRIBUTE VALUES VA V = {(vl, name, ev ), (v 2, name, by), (v 3, name, el), (v4, name, bl), (v5, name, ee ),
(v6, name, eb ), (v7, name, bb ), (v8, name, ctrl), (v9, name, bye), (vl0, name, b 2), (v11, name, motor), (v12, name, lamp), (vl, vertex_type, state_vector), (v2, vertex_type, state_vector), (v3, vertex_type, process), (v4, vertex_type, process), (v5, vertex_type, data_stream), (v6, vertex_type, data_stream), ( v 7, vertex_type, data_stream), ( v 8, vertex_type, process), (v9, vertex_type, state_vector), (vl0, vertex_type, process), (vll , vertex_type, signals), (v12, vertex_type, signals))
VORD = {(vl, importance, 0), (v2, importance, 0), (v3, importance, 1), (v4, importance, 0), (v5, importance, 0), (v6, importance, 0), (v7, importance, 1), (v8, importance, 1), (v9, importance, 0), (vlO, importance, 0), (vl 1, importance, 0), (v12, importance, 0)}
EA V = {(el, edge_type, single), (e2, edge_type, single), (e3, edge_type, single), (e4, edge_type, single), (e5, edge_type, single), (e6, edge_type, single), (e7, edge_type, multiple), (e8, edge_type, single), (e9, edge_type, single), (elO, edge_type, multiple), (ell, edge_type, single), (el2, edge_type, single)}
Hgure 8. A sample network model
"VAV and EAV. Veltices and edges can be ranked in order (this is ordinal information) using the V O R D and E O R D relations. A ne twork diagram is not a map insofar as diagram layout is not constrained to be geographically correct when the vertices correspond to application-domain entities that have a geographic location. Nevertheless, we have seen that organizing the nodes in a network diagram in a way that approximates geographic layout is often a very effective graphic design technique. This 'approximate-geographical' information is represented using the relation NEAR. h Figure 8 contains a sample network model that served a s t h e input that led to the network diagrams in Figures 1 and 2. i
3.2. Pragmatic Design Directives
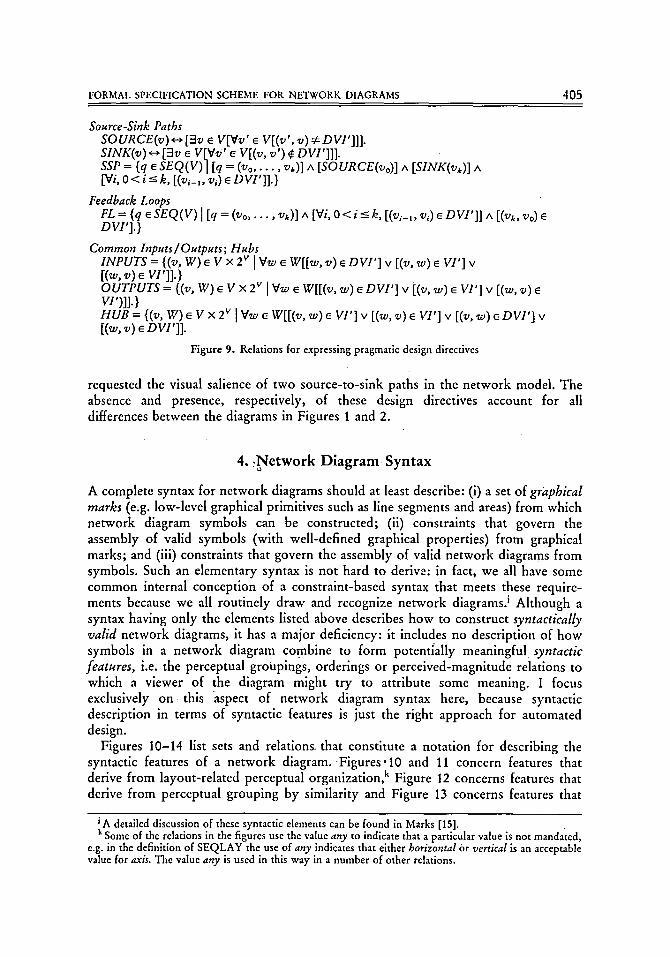
Information is not the only input we might want to pass to an automated graphic designer. Additional inputs that influence the presentation of information can have great utility. In designing network diagrams, for example, it is useful to be able to request that certain aspects of a network model's interconnection pattern, such as source-to-sink paths and feedback loops, be made salient in the diagram being designed. In the current A N D D system, this kind of pragmatic design direction can be expressed by means of the design-directive relations listed in Figure 9.
The design of the ne twork diagram in Figure 1 was not influenced by any design directives, but the design of the diagram in Figure 2 was influenced by directives that
h The NEAR relation could also be used to represent non-geographic information that is readily mapped onto an absolute or relative positioning in the Cartesian plane.
i Representation relations used to describe network models are stored as Prolog predicates in the ANDD system.
FORMAL SPECIFICATION SCHEME FOR NETWORK DIAGRAMS 405
Source-Sink Paths S O U R C E ( v ) o [ 3 v ~ V[Vv' ~ V[(v', v ) ~ DVI']]]. SINK(v)<-->[3v �9 V[Vv' �9 V[(v, v ') ~ DVI']]]. SSP = {q �9 SEQ(V) I [ q = (v0 . . . . . vk)] ^ [SOURCE(vo)] ^ [SINK(vk)] ^ [Vi, 0 < i <- k, [ (vi-,, vi) ~ D VI']]. )
Feedback Loops FL = {q �9 SEQ(V) [ [q = (Vo . . . . . vk)] ^ [Vi, 0 < i -< k, [(vi-t, v,) e D VI']] ^ [(vk, v0) �9 Dvr].}
Common Inputs~Outputs; Hubs INPUTS = {(v, W) ~ V x 2 v I Vw �9 W[[w, v) �9 DVI'] v [(v, w) �9 VI'] v [(w, v) �9 vI']].} OUTPUTS = {(v, W) ~ V x 2 v I Vw �9 W[[(v, w) �9 DVI'] v [(v, w) �9 171'] v [(w, v) vi,)]].} HUB = {(v, W) ~ V x 2 v I Vw �9 W[[(v, w) �9 VI'] v [(w, v) ~ VI'] v [(v, w) �9 DVI'] v [(w, v) ~ DVI']].
Figure 9. Relations for expressing pragmatic design directives
requested the visual salience of two source-to-sink paths in the network model. The absence and presence, respectively, of these design directives account for all differences between the diagrams in Figures 1 and 2.
4, : N e t w o r k D i a g r a m S y n t a x
A complete syntax for network diagrams should at least describe: (i) a set of graphical marks (e.g. low-level graphical primitives such as line segments and areas) from which network diagram symbols can be constructed; (ii) constraints that govern the assembly of valid symbols (with well-defined graphical properties) from graphical marks; and (iii) constraints that govern the assembly of valid network diagrams from symbols. Such an elementary syntax is not hard to derive: in fact, we all have some common internal conception of a constraint-based syntax that meets these require- ments because we all routinely draw and recognize network diagrams, i Although a syntax having only the elements listed above describes how to construct syntactically valid network diagrams, it has a major deficiency: it includes no description of how symbols in a network diagram combine to form potenti'ally meaningful syntactic features, i.e. the perceptual groupings, orderings or perceived-magnitude relations to which a viewer of the diagram might try to attribute some meaning. I focus exclusively on this aspect of network diagram syntax here, because syntactic description in terms of syntactic features is just the right approach for automated design.
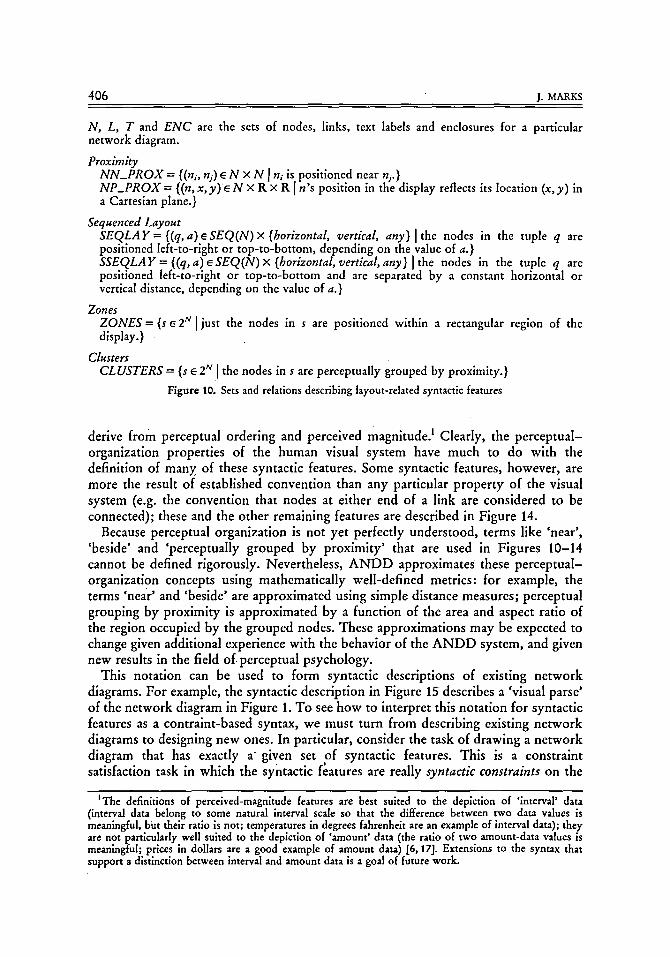
Figures 10-14 list sets and relations, that constitute a notation for describing the syntactic features of a network diagram. Figures,10 and 11 concern features that derive from layout-related perceptual organization, k Figure 12 concerns features that derive from perceptual grouping by similarity and Figure 13 concerns features that
i A detailed discussion of these syntactic elements can be found in Marks [15]. k Some of the relations in the figures use the value any to indicate that a particular value is not mandated,
e.g. in the definition of SEQLAY the use of any indicates that either horizontal or vertical is an acceptable value for axis. The value any is used in this way in a number of other relations.
406 j. MARKS
N, L, T and ENC are the sets of nodes, links, text labels and enclosures for a particular network diagram.
Proximity NN_PROX = {(ni, hi) ~ N • N I ni is positioned near ni. } NP_PROX = {(n,x, y) ~ N • R x R I n s position in the display reflects its location (x, y) in a Cartesian plane.}
Sequenced Layout SEQLAY= {(q,a)~SEQ(N)• {horizontal, vertical, any} I the nodes in the tuple q are positioned left-to-right or top-to-bottom, depending on the value of a.} SSEQLA Y = {(q, a) ~ SEQ(N) • {horizontal, vertical, any} I the nodes in the tuple q are positioned left-to-right or top-to-bottom and are separated by a constant horizontal or vertical distance, depending on the value of a.}
Zones ZONES = {s r 2Nl/ust the nodes in s are positioned within a rectangular region of the display.}
Clusters CLUSTERS = {s r 2N ] the nodes in s are perceptually grouped by proximity.}
Figure I0. Sets and relations describing layout-related syntactic features
derive from perceptual ordering and perceived magnitude, l Clearly, the perceptual- organization properties of the human visual system have much to do with the definition of many. of these syntactic features. Some syntactic features, however, are more the result of established convention than any particular property of the visual system (e.g. the convention that nodes at either end of a link are considered to be connected); these and the other remaining features are described in Figure 14.
Because perceptual organization is not yet perfectly understood, terms like 'near', 'beside' and 'perceptually grouped by proximity' that are used in Figures 10-14 cannot be defined rigorously. Nevertheless, A N D D approximates these perceptual- organization concepts using mathematically well-defined metrics: for example, the terms 'near' and 'beside' are approximated using simple distance measures; perceptual grouping by proximity is approximated by a function of the area and aspect ratio of the region occupied by the grouped nodes. These approximations may be expected to change given additional experience with the behavior of the A N D D system, and given new results in the field o f perceptual psychology.
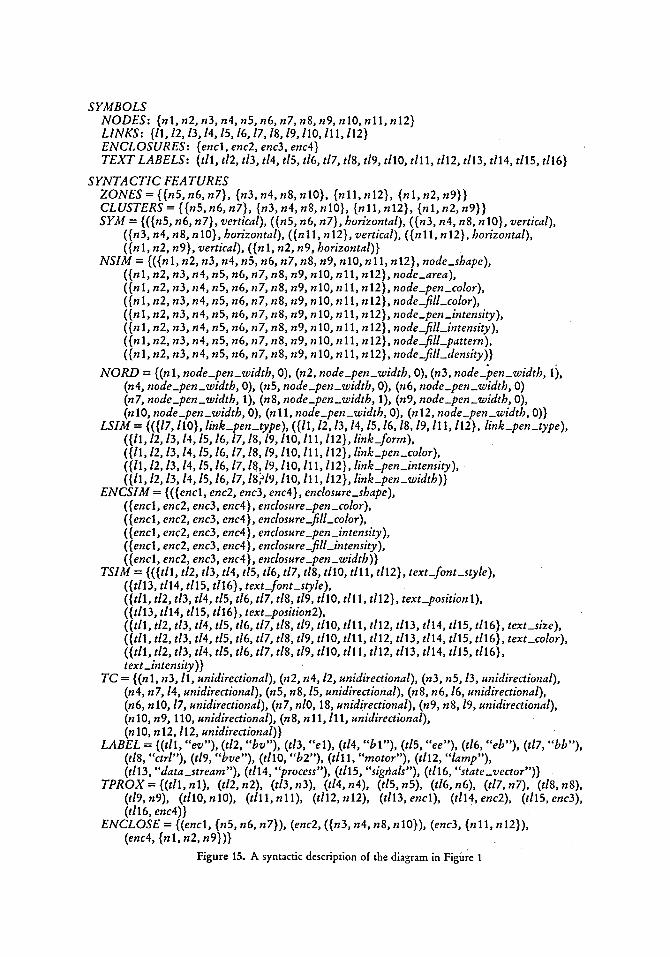
This notation can be used to form syntactic descriptions of existing network diagrams. For example, the syntactic description in Figure 15 describes a 'visual parse' of the network diagram in Figure 1. To see how to interpret this notation for syntactic features as a contraint-based syntax, we must turn from describing existing network diagrams to designing new ones. In particular, consider the task of drawing a network
of features. This is a constraint diagram that has exactly a" given s e t , syntactic satisfaction task in which the syntactic features are really syntactic constraints on the
J The definitions of perceived-magnitude features are best suited to the depiction of 'interval' data (interval data belong to some natural interval scale so that the difference between two data values is meaningful, but their ratio is not; temperatures in degrees fahrenheit are an example of interval data); they are not particularly well suited to the depiction of 'amount' data (the ratio of two amount-data values is meaningful; prices in dollars are a good example of amount data) [6, 17]. Extensions to the syntax that support a distinction between interval and amount data is a goal of future work.

FORMAL SPECIFICATION SCHEME F O R N E T W O R K DIAGRAMS 407
Alignment A L I = {(s, a, p) �9 2 ctr u ENC u r) X {horizontal, vertical, any} • {center, top, bottom, left, fight, any}l all the symbols in s are aligned as indicated by the values of a and p.} SALI = {(s, a, p) �9 2 t" u wee u r) x {horizontal, vertical, any } • {center, top, bottom, left, fight, any } |a l l the symbols in s are aligned as indicated by the values of a and p, and are separated b y a constant distance along the alignment axis.}
Symmetry SYM = {(s, a) �9 2 N x {horizontal, vertical, any} I the nodes in s are symmetric about a horizontal or vertical axis.}
T-shape T_SHAPE = {(t, s) �9 N x 2 N I 3a,, a, �9 {horizontal, vertical}[[( { t } U s, a,) �9 SYM] A [(s, a,, center) �9 SALI] A [an :/= a2]]-}
Circumferential Layout PERIMETER = { ( s ,p ) �9215 {circle, rectangle, any}l all nodes in s are positioned on the boundary of a circle or rectangle.} PERIMETER CYCLE = {(q, p) �9 SEQ(N) x {circle, rectangle, any} I all nodes in q are posi- tioned sequentially in clockwise order on the boundary of a circle or rectangle.} H U B = { ( e , s , p ) e N x 2 N x {circle, rectangle, any}l all nodes in s are positioned on the boundary of a circle or rectangle, with node e positioned at its center.} HUB_CYCLE = {(c, q, p) �9 N x SEQ(N) • {circle, rectangle, any} I all nodes in q are posi- tioned sequentially in clockwise order on the boundary of a circle or rectangle, with node c positioned at its center.}
Figure 11. More relations describing layout-related syntactic features
design. In fact, the syntactic descript ion in Figure 15 was used in such a role: it was generated as an intermediate p roduc t of the A N D D system pr ior to the final creation of the ne twork diagram in Figure 1.
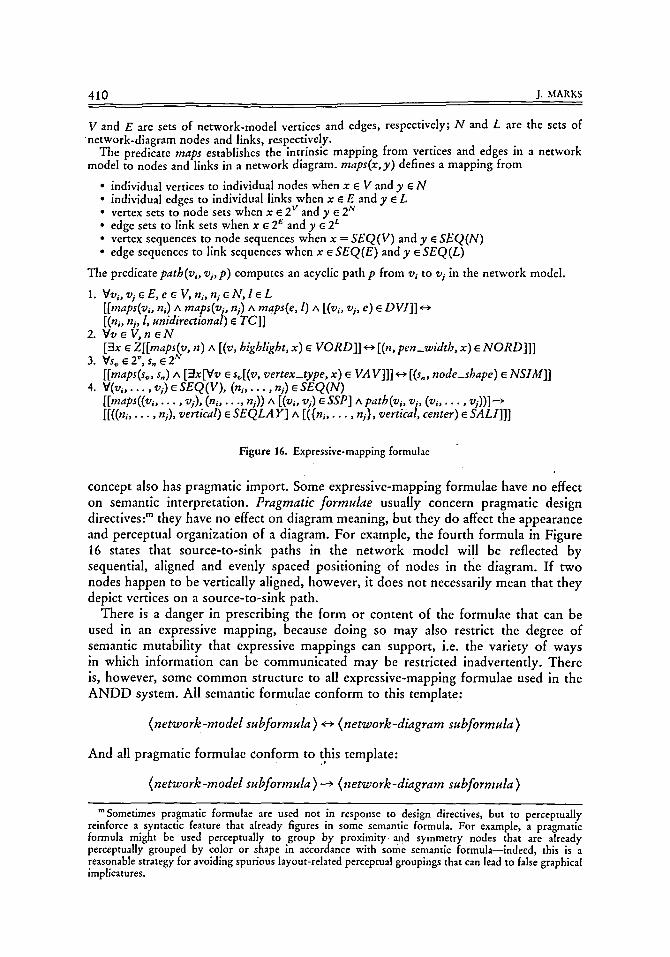
5. Network-diagram Semantics/Pragmatics There is an obvious intrinsic mapping f rom vertices and edges in a ne twork model tO nodes and links in its corresponding ne twork diagram. O t h e r relationships between a ne twork model and a ne twork diagram must be established by the (human o r automated) designer: these relationships const i tute an expressive mapping. Figure 16 contains some sample expressive-mapping formulae f rom the expressive mapping for the ne twork diagram in Figure 2.
GPN, GPL, GPTL and GPENC are the graphical properties of nodes, links, text labels, and enclosures, respectively.
Similarity NSIM = {(s, p) �9 2 N x GPN ] all nodes in.s have the same value for the graphical property p, and all nodes in N - s have a different value for p.} .,
/. LSIM = {(s ,p) �9 2 • GPL ] all links in s have the same value for the graphical property p, and all links in L - s have a different value for p.} ENCISM= {(s ,p) �9 GPENC]all enclosures in s have the same value for the graphical p roper ty , , and all enclosures in E N C - s have a different value for p.} TSIM = {(s, p) �9 2 x GPT ] all text labels in s have the same value for the graphical property p, and all text labels in T - s have a different value for p. �9
Figure 12. Relations describing perceptual grouping by similarity

408 J. MARKS
GPNORD, GPLORD, G P E N C O R D and G P T O R D are the graphical properties of nodes, links, text labels, and enclosures, respectively, whose values are perceptually ordered.
Ordering N O R D = {(n, p, r) ~ N • G P N O R D x Z [ the number r indicates the perceptual ranking of node n relative to the other nodes in N along the dimension of graphical property p.} L O R D = {(l,p, r) ~ L • G P L O R D x Z ] the number r indicates the perceptual ranking of link I relative to the other links in L along the dimension of graphical property p.} E N C O R D = {(e,p, r) ~ E N C • G P E N C O R D • Z ] the number r indicates the perceptual ranking of enclosure e relative to the other enclosures in E along the dimension of graphical property p.) T O R D = {(t,p, r) ~ T • G P T O R D • Z ] the number r indicates the perceptual ranking of text label t relative to the other text labels in T along the dimension of graphical property p.}
Perceived Magnitude N M A G -- {(n,p, x) ~ N x G P N O R D x [0-0, 1-0] ] the number x indicates the relative mag- nitude of the perceived value of n's graphical property p.} L M A G = {(1, p, x) ~ L x G P L O R D • [0"0, 1-0] ] the number x indicates the relative mag- nitude of the perceived value of l's graphical property p.}
Figure 13. Relations describing perceived order and magnitude
Expressive-mapping relationships are stated as formulae in the predicate calculus. The first formula in Figure 16 establishes the relationship between the connectivity relation in the network model and the topological-connectivity relation in the network diagram. The second formula states that the ordering relation indicated by the values of the net~cork model vertex attribute importance will be reflected in a perceptual ordering by node pen width (line thickness) in the network diagram. The third formula states that all nodes corresponding to network-model vertices with similar values for the attribute vertex type will have similar shapes. Semant ic f o rmu lae like these map types of information onto types of syntactic feature. They indicate (and constrain) how network model attribute values may be mapped onto graphical property values and instances of syntactic features, but they do not specify actual value mappings. For example, the third formula in Figure 16 maps a particular vertex attribute onto node shape, but it does not specify which attribute values correspond to which node shapes. However, instantiating a network diagram that is consistent wi th a comprehensive expressive mapping will define valid value mappings implicitly. Both expressive mapping formulae and actual value mappings are usually described in a diagram's legend.
In addition to being central to network diagram semantics, the expressive-mapping
Topological Connectivity TC = { ( h i , n i, l, t) ~ N • N • L • {unidirectional, bidirectional) ] link l connects n i and ni, and is of type t.}
Labeling LABEL = {(t, z )e T • ~* I label t consists of the alphanumeric string z (~ is the set of alphanumeric characters).) T P R O X = {(t, x) e T x {N U L O ENC} ] label t is positioned inside or near symbol x.}
Enclosures ENCLOSE = {(e, s) ~ E N C • 2 tr exactly the nodes in s are enclosed by enclosure e.}
Figure 14. Relations that concern links, enclosure boxes and text labels
SYMBOLS NODES: {nl, n2, n3, n4, n5, n6, n7, n8, n9, hi0, n11, n12} LINKS: {ll, 12, 13,14,15, 16,17,18,19, llO, l l l , 112} ENCLOSURES: {encl, enc2, enc3, enc4} TEXT LABELS: {t/l, tl2, tl3, tl4, tl5, tl6, tl7, tl8, tl9, tllO, t i l l , t112, tll3, tll4, tll5, tll6}
SYNTACTXC FEATURES ZONES = {{n5, n6, n7}, {n3, n4, n8, n10}, {n11, n12}, {nl, n2, n9}) CLUSTERS = {{n5, n6, n7}, {n3, n4, n8, nlO}, {nll , n12}, {nl, n2, n9}} SYM = {({n5, n6, n7}, vertical), ({n5, n6, n7}, horizontal), ({n3, n4, n8, nlO}, vertical),
({n3, n4, n8, nlO}, horizontal), ({nl 1, n12}, vertical), ({nl 1, n12}, horizontal), ({nl, n2, n9}, vertical), ({nl, n2, n9, horizontal)}
NSIM = {({n 1, n2, n3, n4, n5, n6, n7, n8, n9, nlO, n l l , n12}, node_shape), ({nl, n2, n3, n4, n5, n6, n7, n8, n9, nlO, n l l , n12}, node_area), ({nl, n2, n3, n4, n5, n6, n7, n8, n9, nlO, n l l , n12}, node_pen_color), ({nl, n2, n3, n4, n5, n6, n7, n8, n9, nlO, n l l , n12}, node_fill_color), ({nl, n2, n3, n4, n5, n6, n7, n8, n9, nlO, n l l , n12}, node_pen_intensity), ({nl, n2, n3, n4, n5, n6, n7, n8, n9, nlO, n l l , n12}, node_fill_intensity), ({nl, n2, n3, n4, n5, n6, n7, n8, n9, nlO, nl l , n12}, node_fill_pattern), ({nl, n2, n3, n4, n5, n6, n7, n8, n9, nlO, n l l , n12}, node_fill_density)}
N O R D = {(n 1, node_pen_width, 0), (n2, node_pen_width, 0), (n3, node_pen_width, 15, (n4, node_pen_width, 0), (n5, node_pen_width, 0), (n6, node_pen_width, O) (n 7, node_pen_width, 1), (n8, node_pen_width, 1), (n9, node_pen_width, 0), (n 10, node_pen_width, 0), (n 11, node_pen_width, 0), (n 12, node_pen_width, 0)}
LSIM = {({17, llO}, link_pen_type), ({ll, 12,13, 14, 15,16, 18, 19,111,112}, link_pen_type), ({ll, 12, 13,14,15,16,17,18, 19,110,111,112}, link_form), ({ll, 12, 13,14,15,16,17,18, 19, llO, ll l, 112}, link_pen_color), ({ll, 12, 13,14, 15,16,17,18, 19,110,111,112}, link_pen_intensity), ({ll, 12, 13,14,15,16,17,18~19, l l O, 111,112}, link_pen_width)}
EN CS I M = { ( { enc l, ene2, eric3, enc4 } , enclosure_shape), ( { enc l , enc2, enc3, enc4 } , enclosure_pen_color), ( { enc l, enc2, enc3, enc4 }, enclosure_fill_color), ( { enc l, enc2, enc3, enc4}, enclosure_pen_intensity), ( { enc l, enc2, enc3, enc4 }, endosure_fill_intensity ), ( { enc l , enc2, enc3, enc4 } , endosure_pen_width ) }
TSI M = { ( { tl l, tl2, tl3, tl 4, tl5, tl6, tl7, tl8, tl10, t i l l , tl l2 }, text_font_style), ({tl13, t114, t115, t116}, text_font_style), ({ill, tl2, tl3, tl4, tl5, tl6, tl7, tl8, tl9, tl 1 O, tll 1, t112}, text_position 1), ({tll3, t114, t115, t116}, text_position2), ({tll, tl2, tl3, tl4, tl5, tl6, tl7, tl8, tl9, tllO, tll 1, ill2, tll3, tll 4, tll5, t116}, text_size), ({t/l, tl2, tl3, tl4, tl5, tl6, tl7, tl8, tl9, tllO, t i l l , tll2, tll3, ill4, tll5, t116}, text_color), ({tll, tl2, tl3, tl4, tl5, tl6, tl7, tl8, tl9, tllO, tll l, tll2, tll3, tll4, ill5, t116}, text_intensity)}
TC = {(nl, n3, ll, unidirectional), (n2, n 4,12, unidirectional), (n3, n5, 13, unidirectional), (n4, n7,14, unidirectional), (n5, n8,15, unidirectional), (n8, n6,16, unidirectional), (n6, nlO, 17, unidirectional), (n7, nlO, 18, unidirectional), (n9, n8, 19, unidirectional), (n 10, n9, 110, unidirectional), (n 8, n 11,111, unidirectional), (nlO, n12,112, unidirectional)}
LABEL = {(t/l, "ev"), (t12, "by"), (t13, "el), (t14, "bl"), (t15, "ee"), (t16, "eb"), (t17, "bb"), (t18, "ctrl"), (t19, "bye"), (tll0, "b2"), (till, "motor"), (tl12, "lamp"), (tll3, "data_stream"), (tll4, "process"), (tl15, "sigrlals"), (tll6, "state_vector")}
TPROX = {(t/l, nl), (tl2, n2), (tl3, n3), (tl4, n4), (tl5, n5), (tl6, n6), (t17, n7), (tl8, n8), (tl9, n9), (tll0, nl0), (till, ni l ) , (tll2, nl2), (tll3, encl), (tll4, enc2), (tll5, enc3), (tll 6, enc4)}
ENCLOSE = {(encl, {n5, n6, n7}), (enc2, (in3, n4, n8, nl0}), (enc3, {nil , n12}), (enc4, {nl, n2, n9})}
Figure 15. A syntactic description of the diagram in Figure 1
410 i. MARKS
V and E are sets of network-model vertices and edges, respectively; N and L are the sets of �9 network-diagram nodes and links, respective!y.
The predicate maps establishes the intrinsic mapping from vertices and edges in a network model to nodes and links in a network diagram, maps(x,y) defines a mapping from
�9 individual vertices to individual nodes when x e V and y e N �9 individual edges to individual links when x e E and y �9 L
vertex sets to node sets when x �9 2 v and y �9 2 N edge sets to link sets when x �9 2 E and y �9 2 L
�9 vertex sequences to node sequences when x = SEQ(V) and y �9 SEQ(N) �9 edge sequences to link sequences when x �9 SEQ(E) and y �9 SEQ(L)
The predicate path(vi, vi, p) computes an acyclic path p from vi to vj in the network model.
1. Vvi, v i e E , e e V , n u n ~ � 9 l e L [[maps(vi, hi) ^ maps(v i, n i) A maps(e,/) A [(vi, V i, e) �9 D VI]] <--> [(n;, hi, l, unidirectional) �9 TC]]
2. V v e V , n e N [3x �9 Z[[maps( v, n) A [(v, highlight, x) �9 V O RD ]] <-~ [ (n, pen_width, x) �9 N O RD ]]]
3. Vs~ �9 2 ~, s, �9 2 N [[maps(s~, s,) A [::lx[Vv �9 s~[(v, vertex_type, x) �9 VA V]]] <-> [(s,, node_shape) �9 NSIM]]
4. V(v, . . . . . vi) �9 Ss (ha . . . . . hi) �9 SEQ(N) [[maps((vs . . . . . vi), (hi . . . . . ni) ) A [(vu v i) e SSP] A path(vi, v i, (vi . . . . . vi))]--> [[((n/ . . . . . hi), vertical) �9 SEQLA Y] A [({hi . . . . . ni}, vertical, center) �9 SALI]]]
Figure 16. Expressive-mapping formulae
concept also has pragmatic import. Some expressive-mapping formulae have no effect on semantic interpretation. Pragmatic formulae usually concern pragmatic design directives: m they have no effect on diagram meaning, but they do affect the appearance and perceptual organization of a diagram. For example, the fourth formula in Figure 16 states that source-to-sink paths in the network model will be reflected by sequential, aligned and evenly spaced positioning of nodes in the diagram. If two nodes happen to be vertically aligned, however, it does not necessarily mean that they depict vertices on a source-to-sink path.
There is a danger in prescribing the form or content of the formulae that can be used in an expressive mapping, because doing so may also restrict the degree of semantic mutability that expressive mappings can support, i.e. the variety of ways in which information can be communicated may be restricted inadvertently. There is, however, some common structure to all expressive-mapping formulae used in the ANDD system. All semantic formulae conform to this template:
( ne twork -mode l subformula ) <-> (ne twork-d iagram subformula )
And all pragmatic formulae conform to this template: .1
(ne twork -mode l subformula ) --> (ne twork-d iagram subformula )
mSometimes pragmatic formulae are used not in response to design directives, but to perceptually reinforce a syntactic feature that already figures in some semantic formula. For example, a pragmatic formula might be used perceptually to group by proximity, and symmetry nodes that are already perceptually grouped by color or shape in accordance with some semantic formula--indeed, this is a reasonable strategy for avoiding spurious layout-related perceptual groupings that can lead to false graphical implicatures.
FORMAL SPECIFICATION SCHEME FOR NETWORK DIAGRAMS 411
The network-model relations described in Figures 7 and 9 appear as predicates only in network-model subformulae; the network-diagram relations described in Figures 10-14 appear as predicates only in network-diagram subformulae. This common structure (which is reflected in the Prolog implementation of expressive-mapping formulae) helps to clarify the purpose and effect of each formula.
In summary, the expressive-mapping concept ties together syntax, semantics and pragmatics for network diagrams. In the next section we shall see tha t the expressive-mapping concept is also at the heart of a computational paradigm for designing network diagrams.
6. A Computational Design Paradigm
The formal specification scheme presented above leads naturally to a computational paradigm for designing network diagrams. This paradigm specifies two design tasks: forming an expressive mapping and instantiating a diagram.
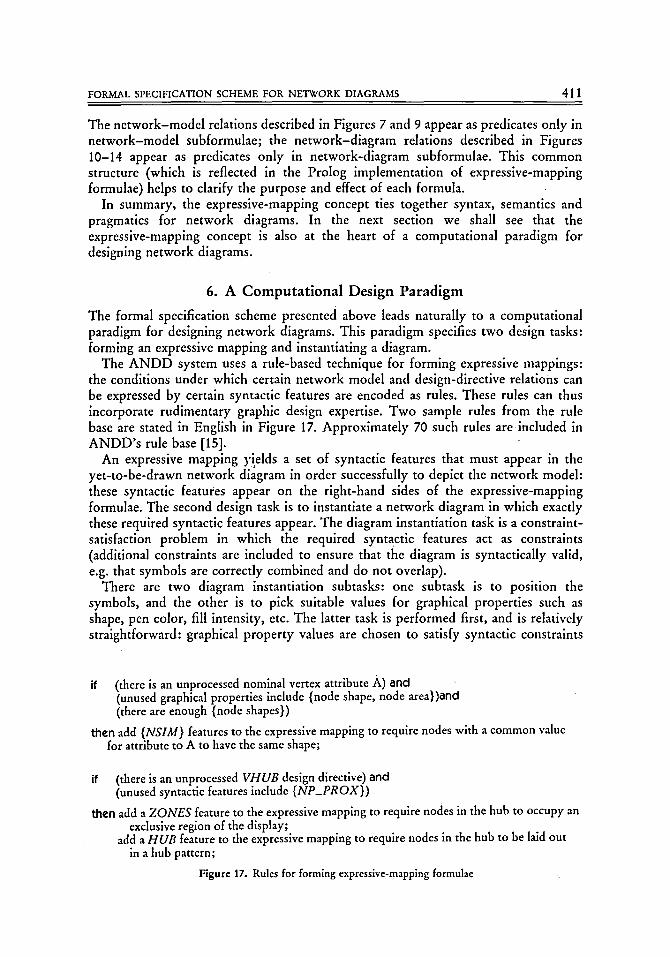
The ANDD system uses a rule-based technique for forming expressive mappings: the conditions under which certain network model and design-directive relations can be expressed by certain syntactic features are encoded as rules. These rules can thus incorporate rudimentary graphic design expertise. Two sample rules from the rule base are stated in English in Figure 17. Approximately 70 such rules areincluded in ANDD's rule base [15].
An expressive mapping )'gelds a set of syntactic features that must appear in the yet-to-be-drawn network diagram in order successfully to depict the network model: these syntactic features appear on the right-hand sides of the expressive-mapping formulae. The second design task is to instantiate a network diagram in which exactly these required syntactic features appear. The diagram instantiation task is a constraint- satisfaction problem in which the required syntactic features act as constraints (additional constraints are included to ensure that the diagram is syntactically valid, e.g. that symbols are correctly combined and do not overlap).
There are two diagram instantiation subtasks: one subtask is to position the symbols, and the other is to pick suitable values for graphical properties such as shape, pen color, fill intensity, etc. The latter task is performed first, and is relatively straightforward: graphical property values are chosen to satisfy syntactic constraints
if (there is an unprocessed nominal vertex attribute A) and (unused graphical properties include {node shape, node area})and (there are enough {node shapes})
then add {NSIM} features to the expressive mapping to require nodes with a common value for attribute to A to have the same shape;
if (there is an unprocessed VHUB design directive) and (unused syntactic features include {NP_PROX})
then add a ZONES feature to the expressive mapping to require nodes in the hub to occupy an exclusive region of the display;
add a HUB feature to the expressive mapping to require nodes in the hub to be laid out in a hub pattern;
Figure 17. Rules for forming expressive-mapping formulae
412 I. MARKS
governing the perceptual organization relations of similarity, ordering and perceived magnitude. This subtask is also performed using a rule-based technique.
The layout subtask is much more difficult. An ideal layout algorithm would have the following desirable characteristics: it would compute layouts that exhibit whatever layout-related syntactic features are required; it would compute layouts that are optimal according to standard layout-aesthetic criteria such as the number of link crossings; and it would run in near real time. Unfortunately, this constrained-layout problem is different from the standard aesthetic diagram layout problem, for which many algorithms have been developed [12]. Furthermore, constrained layout can be shown to be computationally intractable even when aesthetic criteria are ignored [15]. The current ANDD system can use one of two different heuristic algorithms for the constrained layout problem, depending on how the system is configured. One algorithm uses a rule-based approach: sublayout patterns that exhibit certain layout-~'elated syntactic features are generated by the application of layout rules; rules are applied repeatedly until a complete layout is produced [15,28]. The second heuristic algorithm takes a stochastic approach to solving what is essentially an intractable constrained optimization problem. This algorithm is a parallel genetic algorithm [28-30]. The diagrams in Figures 1, 2 and 4 were laid out using this algorithm; the diagrams in Figures 3 and 5 were laid out using the rule-based algorithm.
7. Conclus ions and F u t u r e W o r k
The ANDD system is unique in its ability to design automatically network diagrams that communicate given information. A key aspect of the ANDD system is its reliance on a formal specification scheme for describing the syntax, semantics and pragmatics of network diagrams. Distinctive features of the syntax are its ability to represent all aspects of perceptual organization, and its formulation in terms of constraints. A distinctive feature of the semantics/pragmatics formulation is the variety of ways in which information and design directives can be related to syntactic structure.
The development of improved algorithms for the various design tasks is a primary objective of current research. Other necessary improvements concern the formal specification scheme: in particular, several additions (e.g., polyline links, more flexible text labels and the inclusion of a syntactic feature that represents isomorphic layout) will be made to the syntactic specification. A long-term goal is the incorporation of ANDD into a complete collaborative computer system: this will involve the coordination of natural language generation and the automated design of sequences of related network diagrams to achieve specified communicative goals (some preliminary results are discussed in Marks [31]).
AcknoWledgments
I am indebted to Tony Cox, Mark FriedeU, Barbara Grosz, Stuart Shieber and the members of the computer-graphics and natural-language research groups at Harvard for their support and insights.
References
1. J. Marks (1990) A syntax and semantics for network diagrams. In: Proceedings of the 1990 IEEE Workshop on Visual Languages. Skokie, Illinois, October, pp. 104-110.
FORMAL SPECIFICATION SCHEME FOR NETWORK DIAGRAMS 413
2. B. Grosz & C. Sidner (1990) Plans for discourse. In: Intentions in Communication (P. Cohen, J. Morgan and M. Pollack, eds) Bradford Books, MIT Press, pp. 417-444.
3. M. Friedell, J. Barnett & D. Kramlieh (1982) Context-sensitive, graphic presentations of information. Computer Graphics 16(3), 181-188.
4. M. Friedell (1984) Automatic synthesis of graphical object descriptions. Computer Graphics 18(3), 53-62.
5. J. Mackinlay (1986) Automating the design of graphical presentations of relational information. ACM Transactions on Graphics 5, 110-141.
6. S. Roth & J. Mattis (1990) Data characterization for intelligent graphics presentation. In: CH1 "90 Proceedings, pp. 193-200.
7. S. Casner (1991) Automated task-analytic design of visual information displays. ACM Transactions on Graphics 10, 111-151.
8. H. Senay & E. Ignatius (1991) Compositional analysis and synthesis of scientific data visualization techniques. In: Scientific Visualization of Physical Phenomena (Proceedings of CG International "91) (N. Patrikalakis, ed.). Tokyo, pp. 269-282.
9. Feiner, S. (1985) APEX: an experiment in the automated creation of pictorial explanations. 1EEE Computer Graphics and Applications 5(I0), 29--37.
10. D. Seligmann & S. Feiner (1989) Specifying composite illustrations with communicative goals. In: Proceedings of the ACM SIGGRAPH Symposium on User Interface Software and Technology (UIST "89). Williamsburg, Virginia, pp. 1-9.
I1. J. Bertin (1983) Semiology of Graphics: Diagrams, Networks, Maps (translated by W. J. Berg), University of Wisconsin Press, Madison, Wisconsin.
12. P. Eades & R. Tamassia (1989) Algorithms for drawing graphs: an annotated bibliography. Brown University, Department of Computer Science, Technical report no. CS-89-09 (revised version).
13. T. Kamada & S. Kawai (1991) A general framework for visualizing abstract objects and relations. ACM Transactions on Graphics 10, 1-39.
14. T. Kamada & S. Kawai (1989) An algorithm for drawing general undirected graphs. Information Processing Letters 31, 7-15.
15. J. Marks (1991) Automating the design of network diagrams. PhD. dissertation. Division of Applied Sciences, Harvard University, Cambridge, Massachusetts.
16. S. Kosslyn (1985) Graphics and human information processing. Journal of the American Statistical Association 80, 499-512.
17. S. Kosslyn (1989) Understanding charts and graphs. Applied Cognitive Pscyhology 3, 185-226.
18. H. G&tler (1983) Attributed graph grammars for graphics. In: Graph-Grammars and their Application to Computer Science (H. Ehrig, M. Nagl and G. Rozenberg, eds) Springer- Verlag, pp. 130-147.
19. M. Harada & T. Kunii (1984) A recursive graph theory--as a formal basis for a visual design language. In: Proceedings of the 1984 IEEE Workshop on Visual Languages. Hiroshima, Japan, pp. 124-135.
20. E. Golin & S. Reiss (1990) The specification of visual language syntax. Journal of Visual Languages and Computing 1, 141-157.
21. J. Marks (1991) The competence of an automated graphic designer. In: Proceedings of the 1991 Long Island Conference on Artificial Intelligence and Computer Graphics. New York, pp. 53-61.
22. W. KiShler (1947) Gestalt Psychology,. an Introduction to New Concepts in Modern Psychology Liveright, New York. .,
23. L. Kaufman (1974) Sight and Mind: An Introduction to Visual Perception Oxford University Press, New York.
24. B. Sanden (1989) An entity-life modeling approach to the design of concurrent software. CACM, 32, 330-343.
25. P. Wildbur (1989) Information Graphics Van Nostrand Reinhold, New York, 1989. 26. A. Marcus (1980) Computer-assisted chart making from the graphic designer's perspective.
Computer Graphics 14, 247-253. 27. J. Marks & E. Reiter (1990) Avoiding unwanted conversational implicatures in text and
graphics. In: Proceedings of the Eighth National Conference on Artificial Intelligence (AAAI'90). Boston, Massachusetts, pp. 450-456.

414 j. MARKS
28. C. Kosak, J. Marks & S. Shieber New approaches to automating network-diagram layout. (In preparation).
29. C. Kosak, J. Marks & S. Shieber (1991) A parallel genetic algorithm for the layout of network diagrams. In: Proceedings of the Fourth International Conference on Genetic Algorithms. UCSD, California.
30. L. Davis, ed. Handbook of Genetic Algorithms Van Nostrand Reinhold, New York. 31. J. Marks (1991) Discourse coherence and the consistent design of informational graphics. In:
Proceedings of the AAAI'91 Workshop on Intelligent Multimedia User Interfaces. Anaheim, California.