a fare price for net zero aviation?
TRANSCRIPT
A fare price for net zero aviation?
1
A fare price for net zero aviation?
Oxera 2021
Decarbonising aviation
The UK has set an ambitious and legally binding target to reach net zero emissions by 2050.1 However, the impact of different carbon abatement measures on market outcomes is still not well understood.
While aviation contributes to only 2–3% of global greenhouse gas emissions today,2 it is expected to account for a significant proportion of emissions by 2050. A one-way flight from Tokyo to London currently emits 1.55 tonnes of CO2 per passenger,3 which is equivalent to the amount of CO2 a tree would absorb over 288 years.4 Under a business-as-usual projection where international flights grow at a rate of 5% per year, aviation emissions are expected to account for 27% of the overall carbon budget to keep global temperatures at less than 1.5°C above preindustrial levels (a target stated in the Paris Agreement).5,6 Given that the UK is hosting the UN Climate Change Conference 2021 (COP26), it has a unique opportunity to steer climate change policy internationally.
The Department for Transport (DfT) has recently published a ‘Jet Zero’ consultation with proposals on several policies to reach net zero in the aviation sector by 2050. A number of these proposals are likely to be difficult to achieve—for example, requiring significant investment from airlines and increases in operational costs as a result of the adoption of green technologies.
While the Jet Zero consultation discusses the technological challenges associated with achieving net zero, it has not considered the implications of the proposed measures on market outcomes, such as connectivity, competition, airline business models and fares. A better understanding of this is needed to help business and governments prepare for the impact of achieving net zero in the sector (for example, the potential distributional effects of the policy on stakeholders in the sector).
In this note, based on Oxera’s extensive experience in the aviation sector and competition economics, and on its new ability to compile and maintain a large-scale dataset of airline fares and frequencies, we provide a methodology for assessing the impact of different carbon abatement measures on these market outcomes.
Michele GranatsteinPartner
Estimating the impact of carbon abatement policies
The DfT has proposed five policy measures to achieve net zero in the aviation sector by 2050: system efficiencies,7 sustainable aviation fuels, zero emissions aircraft, markets and removals, and influencing consumers. The impact of these measures on market outcomes can be estimated by representing each policy in terms of its carbon abatement costs—i.e. the additional money that an airline needs to spend in order to reduce or offset a tonne of CO2 emissions.
The impact of the different policy measures can be estimated using the following steps.
1. Estimating abatement costs per tonne of CO2 emissions for each airline on a given route—as noted in the DfT’s Jet Zero consultation evidence document, estimates of abatement costs are highly uncertain and depend on whether breakthroughs are achieved on particular technologies. We provide a number of illustrative scenarios in the next section.
2. Estimating CO2 emissions per seat for each airline on the route—a readily available source is Google Flights, which estimates CO2 emissions per seat based on a methodology from the European Environmental Agency.
3. Multiplying abatement costs per tonne of CO2 emissions with the emissions estimate per seat to calculate the abatement costs per seat—a more in-depth analysis could account for load factors: a flight with fewer
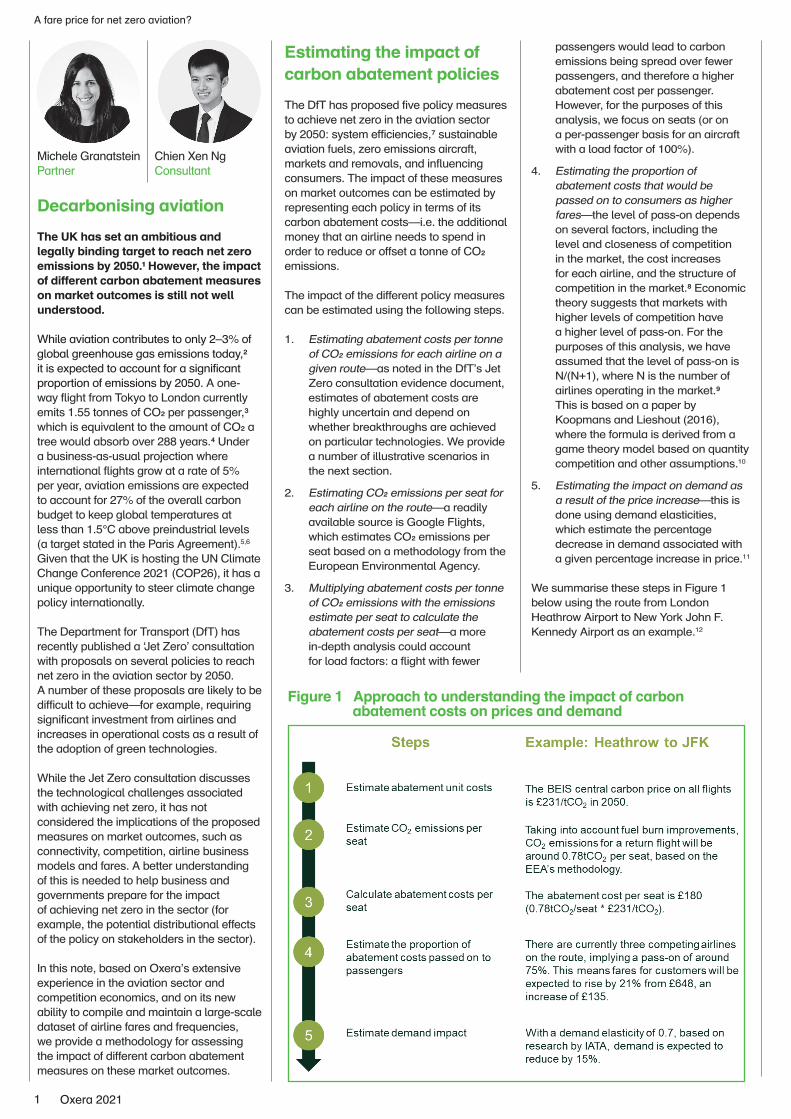
Figure 1 Approach to understanding the impact of carbon abatement costs on prices and demand
passengers would lead to carbon emissions being spread over fewer passengers, and therefore a higher abatement cost per passenger. However, for the purposes of this analysis, we focus on seats (or on a per-passenger basis for an aircraft with a load factor of 100%).
4. Estimating the proportion of abatement costs that would be passed on to consumers as higher fares—the level of pass-on depends on several factors, including the level and closeness of competition in the market, the cost increases for each airline, and the structure of competition in the market.8 Economic theory suggests that markets with higher levels of competition have a higher level of pass-on. For the purposes of this analysis, we have assumed that the level of pass-on is N/(N+1), where N is the number of airlines operating in the market.9 This is based on a paper by Koopmans and Lieshout (2016), where the formula is derived from a game theory model based on quantity competition and other assumptions.10
5. Estimating the impact on demand as a result of the price increase—this is done using demand elasticities, which estimate the percentage decrease in demand associated with a given percentage increase in price.11
We summarise these steps in Figure 1 below using the route from London Heathrow Airport to New York John F. Kennedy Airport as an example.12
Chien Xen NgConsultant

2
A fare price for net zero aviation?
Oxera 2021
London to Munich: 0.121tCO2 = 22 tree years
London to Edinburgh: 0.081tCO2 = 15 tree years
London to Tokyo: 1.55tCO2 = 288 tree years
London to New York: 0.75tCO2 = 139 tree years
3
A fare price for net zero aviation?
Oxera 2021
Illustrative scenarios and results
As noted above, the Jet Zero consultation focuses on five measures to achieve net zero emission flights by 2050.13 A number of these measures—notably sustainable aviation fuels (SAFs), zero emission flights (ZEFs), and greenhouse gas removal (GGRs)—involve nascent technologies, with various forecast abatement costs.
Rather than examining each of the five measures, their individual abatement costs, and their impacts on market outcomes separately, the relevant factor to consider is the overall abatement cost faced by airlines. As it is still quite early to identify the optimal mix of technologies to reach net zero, the DfT has stated that it will focus on the development of all of these technologies over the coming decade. Further, a high abatement cost may incentivise airlines to invest in different green technologies to avoid carbon emissions, which may not be linked to any single technological approach.
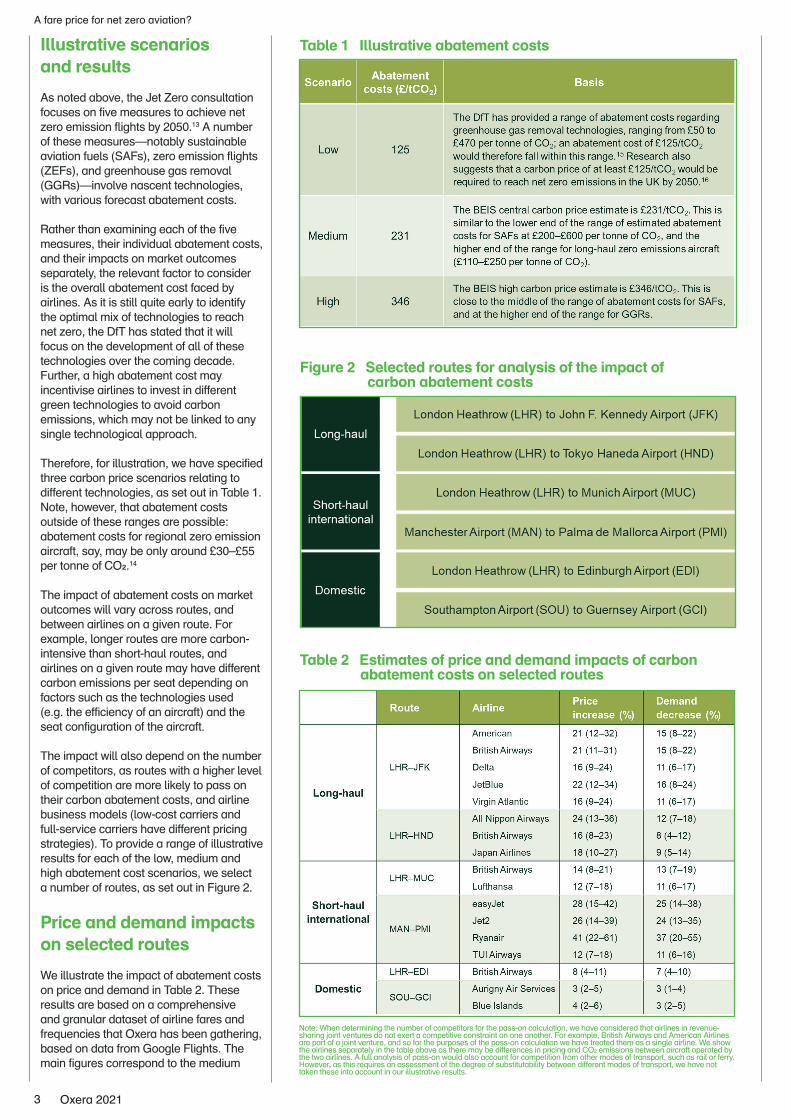
Therefore, for illustration, we have specified three carbon price scenarios relating to different technologies, as set out in Table 1. Note, however, that abatement costs outside of these ranges are possible: abatement costs for regional zero emission aircraft, say, may be only around £30–£55 per tonne of CO2.14
The impact of abatement costs on market outcomes will vary across routes, and between airlines on a given route. For example, longer routes are more carbon-intensive than short-haul routes, and airlines on a given route may have different carbon emissions per seat depending on factors such as the technologies used (e.g. the efficiency of an aircraft) and the seat configuration of the aircraft.
The impact will also depend on the number of competitors, as routes with a higher level of competition are more likely to pass on their carbon abatement costs, and airline business models (low-cost carriers and full-service carriers have different pricing strategies). To provide a range of illustrative results for each of the low, medium and high abatement cost scenarios, we select a number of routes, as set out in Figure 2.
Price and demand impacts on selected routes
We illustrate the impact of abatement costs on price and demand in Table 2. These results are based on a comprehensive and granular dataset of airline fares and frequencies that Oxera has been gathering, based on data from Google Flights. The main figures correspond to the medium
Table 1 Illustrative abatement costs
Figure 2 Selected routes for analysis of the impact of carbon abatement costs
Note: When determining the number of competitors for the pass-on calculation, we have considered that airlines in revenue-sharing joint ventures do not exert a competitive constraint on one another. For example, British Airways and American Airlines are part of a joint venture, and so for the purposes of the pass-on calculation we have treated them as a single airline. We show the airlines separately in the table above as there may be differences in pricing and CO2 emissions between aircraft operated by the two airlines. A full analysis of pass-on would also account for competition from other modes of transport, such as rail or ferry. However, as this requires an assessment of the degree of substitutability between different modes of transport, we have not taken these into account in our illustrative results.
Table 2 Estimates of price and demand impacts of carbon abatement costs on selected routes

4
A fare price for net zero aviation?
Oxera 2021
LHR–HND: 19%
LHR–JFK: 19%
SOU–GCI: 3%
LHR–EDI: 8%
LHR–MUC: 13%
MAN–PMI: 27%
abatement cost scenario, while the values in parentheses show the price and demand changes under the low and high abatement cost scenarios.
The results indicate that the percentage price increases on these long-haul routes tend to be higher than on short-haul routes, holding other factors constant (such as the business model of the airlines operating on the route). This is because long-haul flights have much higher carbon emissions than short-haul flights: a flight from London to Tokyo emits 19 times the carbon emissions of a flight from London to Edinburgh.
However, short-haul routes served primarily by low-cost carriers, such as Manchester Airport (MAN) to Palma de Mallorca (PMI), have low average prices relative to carbon abatement costs. This means that it is possible for the percentage price increase on the short-haul routes to exceed that of the long-haul routes.
For example, the average Ryanair fare on this route is c. £79.17 Approximately 0.18 tonnes of CO2 is emitted,18 leading to
abatement costs of c. £42 under the medium scenario,19 with £32 being passed on to passengers.
However, for routes where prices are high relative to carbon abatement costs, the percentage increase in prices is likely to be low. On the Southampton to Guernsey route, less than 5kg of CO2 emissions may be emitted for a return flight in 2050, while prices are relatively high at around £170 for a return flight. Therefore, the impact of carbon abatement costs on routes with higher average fares may be more limited.
Our methodology is based on calculating carbon emissions and abatement costs on a per-seat basis. The percentage price increase therefore assumes that all seats on an aircraft are occupied by passengers (i.e. a 100% load factor). A further refinement would be to calculate the percentage price increase taking account of the load factors on each aircraft. In particular, if an airline typically has low load factors, abatement costs would be spread over a low number of passengers, leading to a higher percentage price increase per passenger.
The level of pass-on may also play an important role in determining outcomes. For example, on the LHR–EDI, LHR–MUC and SOU–GCI routes where there are only one or two competitors, the proportion of abatement costs passed on is likely to be lower, leading to lower percentage price increases. In comparison, there are four competitors on the MAN–EDI route, leading to higher levels of pass-on.
The demand impact on short-haul routes may be high even if the percentage price increase is lower than on long-haul routes. For example, on the Heathrow to Munich route, the expected demand decrease ranges from 11% to 13%, while on the Heathrow to Haneda route, it is 9–12%, despite the latter having a more significant price increase. This is driven by the greater price-sensitivity of passengers on short-haul flights relative to passengers on long-haul routes. This may have certain policy implications—for example, market-based mechanisms may be less effective on long-haul routes.
Figure 3 Average percentage price increases as a result of abatement costs for selected routes

5
A fare price for net zero aviation?
Oxera 2021
Due to the factors considered above, and since airlines may operate with differing carbon efficiency, there may be variable outcomes for airlines on a given route. For example, Delta and Virgin Atlantic’s flights on the LHR–JFK route are more carbon-efficient than those of American, British Airways and JetBlue, leading to a price increase of 16% compared with the other airlines at 21–22%. This suggests that in the future, the carbon efficiency of flights may be an important determinant of competitiveness in the sector.
In relation to uncertainty around future abatement costs and the optimal mix of technologies to achieve net zero, the results show that there can be a wide range of market outcomes between our low and high abatement cost scenarios. For example, the price increase in the medium scenario for British Airways on the LHR–JFK route is 21%, although there is a high degree of variability, with price increases of only 9% in the low scenario and up to 31% in the high scenario.
This has implications for whether the DfT’s emissions targets should be based on in-sector emissions or include offsets and removals. While in-sector targets may lead to stronger incentives for the aviation sector to invest in greener solutions and eliminate the issue that the quality of carbon offsets is often difficult to verify, in-sector technologies are still in their nascency, and accordingly could lead to significant increases in abatement costs. As such, these factors need to be carefully considered and weighed.
Concluding thoughts
The aviation sector has an important role to play in reducing greenhouse gas emissions. However, it is essential to understand the range of potential outcomes in the sector as a result of different carbon abatement measures to ensure that governments and companies are well placed to support the transition to a net zero aviation sector, and that appropriate policies are put in place.
Our analysis shows that abatement costs are likely to be a significant component of fares in the future. It is therefore important to consider the effect this has on the affordability of air travel and its implications on regional connectivity. The ability of each airline to manage its abatement costs may be an important factor affecting competition in the sector, with potentially significant distributional impacts between airlines operating different business models.
The methodology and illustrative results presented above provide an indication of market outcomes in 2050 under a net zero scenario and form the basis for further work
Contact
Michele Granatstein
Chien Xen Ng
Vanja Reinkowski
Notes1 UK Parliament (2021), ‘Climate change targets: the road to net zero’, https://bit.ly/3yOWaxZ.
2 Department for Transport (2021), ‘Jet Zero Consultation’, p. 4. 3 Based on CO2 emissions data from Google Flights. See the second section above for further details. 4 A one-way flight from London to Tokyo emits 1.55 tonnes of CO2. Based on the CCC’s estimates that planting c. 100m trees per year from 2024 will sequester 14MtCO2e each year by 2050, we estimate that each tree absorbs about 5.4kg of CO2 per year (as 100m trees per year from 2024 implies 2.6bn trees in total by 2050, and so if the total volume of CO2 absorbed per year is 14MtCO2 in 2050, 14/2.6=5.4kg of CO2 per year). See Committee on Climate Change (2020), ‘Land use: policies for a net zero UK’, January, p. 8. Therefore, the London to Tokyo flight emits 288 tree years of CO2 per year. 5 European Commission, ‘Paris Agreement’, https://bit.ly/3halAjS. 6 Carbon Brief (2016), ‘Analysis: aviation could consume a quarter of 1.5°C carbon budget by 2050’, https://bit.ly/38Nz40s, based on International Civil Aviation Authority (2016), ‘2016 Environmental report’, https://bit.ly/3DX67NW. 7 Although the DfT has stated that system efficiencies are likely to result in an overall reduction in costs for airlines.
8 For example, this may be either price (Bertrand) or quantity (Cournot) competition. Economic theory suggests that, under a number of assumptions, markets in which firms set capacity and then price may be simply modelled by quantity competition. See Koopmans, C. and Lieshout, R. (2016), ‘Airline cost changes: to what extent are they passed through to the passenger?’, Journal of Air Transport Management, 53, June, pp. 1–11.
9 In order to obtain more precise estimates of the pass-on, a more comprehensive assessment of the structure of each market would be needed.
10 These assumptions are: homogenous products, linear demand, equal market shares and a sector-wide cost change. See See Koopmans, C. and Lieshout, R. (2016), ‘Airline cost changes: to what extent are they passed through to the passenger?’, Journal of Air Transport Management, 53, June, pp. 1–11, Table 2.
11 IATA (2008), ‘Air Travel Demand. IATA economics briefing 9’, p. 8.
12 We have used data gathered from Google Flights on prices (gathered between 26 March and 24 July 2021) and carbon emissions (which does not vary significantly over time) as the basis for our calculations, although a more comprehensive assessment could also account for changes in the market structure in the future and use data when the aviation sector has recovered from the COVID-19 pandemic.
13 These include: system efficiencies, sustainable aviation fuels (SAFs), zero-emission flights (ZEFs), markets and removals, and influencing consumers.
14 Department for Transport (2021), ‘Jet Zero consultation: evidence and analysis’, July, para. 2.11.
15 Ibid., para. 2.20.
16 Grantham Research Institute on Climate Change and the Environment and Centre for Climate Change Economics and Policy (2019), ‘Policy brief. How to price carbon to reach net-zero emissions in the UK’.
17 Based on data gathered between 26 March and 24 July 2021.
18 Accounting for anticipated fuel efficiency improvements by 2050.
19 Under a scenario of medium abatement costs of £231/tCO2.
20 Other additions could be made to our methodology, such as accounting for load factors, capturing competition on a city-pair rather than airport-pair basis, and accounting for the impact of COVID-19 on the underlying data.
Oxera Consulting LLP is a limited liability partnership registered in England no. OC392464, registered office: Park Central, 40/41 Park End Street, Oxford OX1 1JD, UK; in Belgium, no. 0651 990 151, branch office: Avenue Louise 81, 1050 Brussels, Belgium; and in Italy, REA no. RM - 1530473, branch office: Via delle Quattro Fontane 15, 00184 Rome, Italy. Oxera Consulting (France) LLP, a French branch, registered office: 60 Avenue Charles de Gaulle, CS 60016, 92573 Neuilly-sur-Seine, France and registered in Nanterre, RCS no. 844 900 407 00025. Oxera Consulting (Netherlands) LLP, a Dutch branch, registered office: Strawinskylaan 3051, 1077 ZX Amsterdam, The Netherlands and registered in Amsterdam, KvK no. 72446218. Oxera Consulting GmbH is registered in Germany, no. HRB 148781 B (Local Court of Charlottenburg), registered office: Rahel-Hirsch-Straße 10, Berlin 10557, Germany.Although every effort has been made to ensure the accuracy of the material and the integrity of the analysis presented herein, Oxera accepts no liability for any actions taken on the basis of its contents.No Oxera entity is either authorised or regulated by any Financial Authority or Regulation within any of the countries within which it operates or provides services. Anyone considering a specific investment should consult their own broker or other investment adviser. Oxera accepts no liability for any specific investment decision, which must be at the investor’s own risk.© Oxera 2021. All rights reserved. Except for the quotation of short passages for the purposes of criticism or review, no part may be used or reproduced without permission.
in investigating likely outcomes in the sector. For example, a more comprehensive analysis could also include an assessment of other factors, such as a financial assessment at the route and airline level. This would help determine the financial viability of operating particular routes, as well as the financial impact of abatement costs on airlines.20