a. el wahabi, h.-j. dittfeld(a) and z. simon(b) · a. el wahabi, h.-j. dittfeld(a) and z. simon(b)...
TRANSCRIPT

A. EL WAHABI, H.-J. DITTFELD(a) and Z. SIMON(b)
Observatoire Royal de Belgique
Avenue Circulaire 3, Bruxelles, B-1180 Belgique(E-mail : [email protected])
Abstract
Lately, the interest of measuring gravity on volcanoes has been increasing. However, the springgravimeters we use are strongly influenced by the Earth tides and the meteorological parameters. So, itis necessary to remove their effects in order to obtain reliable gravity residuals which could be relatedto some geophysical phenomena such as the volcanic activity.
The effect of the Earth tides can be modelised precisely and then removed easily. The influence of
the atmospheric pressure has been removed using a single regression coefficient which is normally closeto -0.3 microgal/mbar. Generally, continuous gravity recordings show a large annual variation of thedrift as a common feature, with a magnitude ranging from hundreds of microgals to a few mgals. Thisdrift usually presents for the LCR gravimeters an obvious correlation with temperature variations and anegative correlation with air humidity measurements, both with a large phase lag. In the case ofAskania gravimeters, we point out the fact that the humidity presents a positive correlation with thegravity data.
Previously, it has been suggested that the external temperature is the origin of this apparent drift.
But, the experiment of Bastien et al (1990) in a controlled environment has shown that the air humiditymay be directly responsible for the gravimeters drift as well. Moreover, in some stations (Pecny,Potsdam) where the temperature is controlled with an accuracy of ± 0.1°C, tidal gravimeters still showlarge annual variations in their drift. Finally, another spring gravimeter installed in a mine(Walferdange) where the temperature and the humidity are very stable shows only a linear drift.
All these examples led us to consider that the air humidity is one of the major meteorological
parameters affecting the drift of the spring gravimeters. I. Introduction
When studying gravity measurements in volcanic areas, we have always to cope with the fact that thegravity changes due to volcanic activity are very small compared to other geophysical or instrumental effects.Therefore, several corrections are needed to get reliable gravity residuals susceptible to reflect the volcaniceffect. (a) Geoforschungszentrum Potsdam, Telegrafenberg A 17- D14473 - Potsdam – GERMANY (E-mail : [email protected]).
(b) Research Institute of Geodesy, Topography and Cartography, CZ25066 - Zdiby 98 – Praha-vychod.
METEOROLOGICAL INFLUENCE http://www.upf.pf/ICET/bim/text/10403.html
1 of 13 2/18/2011 2:58 PM

Many effects influence gravity measurements; they can be :
§ instrumental effects such as :– temperature and/or relative humidity,– atmospheric air pressure if it is not well compensated by the gravimeter.
§ geophysical effects such as :– Earth tides,– atmospheric air pressure, – rainfall and snow,– water table,– geology of the area.
§ volcanic effects through variations of elevation or changes in mass/density.
§ a coupling effect tilt/apparent gravity : the tilt variations induce an instrumental effecton the gravimeters producing apparent gravity changes.
II. Order of magnitude
Volcanic activities produce gravity changes of some tens of microgals. If we want to detect thoseeffects, we have to correct the data with a precision of at least 10 µgal. This corresponds to :
Ÿ 4% of the Earth Tides,
Ÿ 30 mbar of air pressure variations,
Ÿ 3 cm of elevation,
Ÿ attraction of a 10 cm thick rock layer.
On what concerns the temperature and the humidity, they cause an instrumental effect on spring gravimeterswhich can reaches an amplitude of about one mgal as a mean value on yearly period. The tilt effect isnegligible if the gravimeter is properly adjusted; if not, the tilt can have a non linear effect. III. Earth tides effect
We first analyse the Earth tides effect (Eterna, Wenzel 1996) which can be thus modelised with highaccuracy and removed efficiently from the gravity measurements. If we are only interested in long periodgravity variations, we can use a low-pass filtering. IV. Air pressure effect
Considering the fact that, for the final residuals, we are looking for a precision of about 1 µgal for aperiod of one day, a simple linear regression using the local pressure (see table 1) is sufficient to correct theair pressure effect. We notice that the regression coefficient is near to –0.3 µgal/mbar except for the LCR3and LCR8 where it is very high indicating that these gravimeters are not well compensated any more for airpressure variations and this probably because the pressure seals are not more airtight (El Wahabi et al, 1997;1998).
METEOROLOGICAL INFLUENCE http://www.upf.pf/ICET/bim/text/10403.html
2 of 13 2/18/2011 2:58 PM

Table 1 : Pressure regression coefficients in µgal/mbar (computed using Eterna Software).
They are around –0.3 µgal/mbar except for the LCR3 and LCR8 which present obviousanomalies for air pressure.
V. Temperature and humidity effects
The relative humidity is closely dependent on the temperature. Therefore, it is difficult to separate theireffects on gravimeters. Moreover, these effects depend on the frequency band which can be divided in threeparts : short, medium and long periods.
1. Short periods
By short periods, we mean the periods from some minutes to a few hours. A typical example of a quickchange of the temperature can be the switching on or off of the viewing lamp of gravimeters. This inducessome perturbations due to the fact that the thermostat of the gravimeter needs a certain time to adjust itself.Fortunately, this takes only some minutes and so has no significant influence.
2. Medium periods
By medium periods, we mean the periods from some days to a few weeks, and for this band offrequencies, unfortunately, we have no example. For this reason, we decided to make an experiment in thefundamental station of the Royal Observatory of Belgium in order to study the temperature and humidityinfluences on spring gravimeters. The station, which is in the cellar, is thermostatised while the humidity is notcontrolled. Some exchanges of air masses are possible, especially, when opening the station door. We have atour disposal, a LaCoste & Romberg G8 and high precision pressure and temperature/humidity sensors. Ourobjectives are the following :
* the determination of the transfer function of the couple temperature/humidity between inside and
outside the station, * the study of the gravity changes with the temperature variations in a stable humidity environment, * the study of the gravity changes with the humidity variations in a temperature controlled environment,
* the study of the correlation between temperature and humidity for each frequency band to decide which
parameter is more suitable to determine the transfer function for the gravimeter responses.
As first results, we can notice in the figure 1 a large temperature perturbation (an increase of about 4°C)during three days (around 18 November 1998) to which corresponds a gravity residuals variation with achange in the slope following immediately after the steep fall of the temperature. This suggests a link betweenthe gravity change and the corresponding temperature perturbation.
METEOROLOGICAL INFLUENCE http://www.upf.pf/ICET/bim/text/10403.html
3 of 13 2/18/2011 2:58 PM

Another example given on the figure 2 shows a large perturbation in the temperature, a decrease of
about 5°C, which is also correlated to the gravity residuals with a phase lag. Comparing the temperature andthe relative humidity records, there is no clear correlation between these two parameters. We notice indeed,during the beginning of March 1999, a large increase in the relative humidity of about 11% in one day whilethe temperature remains stable and no significant change appears in the gravity residuals. However, in themiddle of March, a decrease of relative humidity appears to be anti-correlated with the man madetemperature perturbation. As a conclusion, it seems that the temperature has an effect on spring gravimetersfor medium periods while the humidity might need more time to influence the gravimeter response.
Figure 1 : Illustration of the LCR G8 drift with temperature variations in Brussels.From top to bottom : gravity residuals after removing the Earth tides and air pressureeffects, gravity residuals reduced by a polynomial fit and temperature records with abig man made perturbation.
METEOROLOGICAL INFLUENCE http://www.upf.pf/ICET/bim/text/10403.html
4 of 13 2/18/2011 2:58 PM

Figure 2 : Illustration of the LCR G8 drift with temperature and relative humidityvariations in Brussels. From top to bottom : gravity residuals after removing the Earth tidesand air pressure effects (also reduced by a polynomial fit), temperature records and relativeair humidity measurements.
3. Long periods
Usually by long periods, we mean the periods of several months and especially the yearly cycles. Weshall hereafter call the drift the non tidal apparent gravity variations after removing the pressure effect.Generally, the recordings of spring gravimeters present an annual oscillation of the drift which is correlatedwith the temperature and the relative humidity variations. The question is now to determine whether both ofthe two parameters are responsible of this drift or only one of them and, in this latter case, which one. Theanswer will be illustrated by means of the following examples.
The first one came from Centuripe, a station in the Etna area (Sicily), where the LaCoste Romberg
(LCR) G3 was installed in September 1992. The obvious annual periodicity, that we see in the gravityresiduals, is perfectly correlated with the temperature records (see figure 3). However, during the beginning ofthe measurements, the gravity residuals show a large perturbation (see figure 3 and 4) which coincides withthe setting of a door in the station room. We think that the door could have limited the air circulation betweeninside and outside so that a new regime set in the air and heat exchanges. Looking at the station roomtemperature, no significant perturbation was recorded for the same period proving the fact that the driftperturbation was not due to the temperature effect (El Wahabi et al., 1997; 1998).
METEOROLOGICAL INFLUENCE http://www.upf.pf/ICET/bim/text/10403.html
5 of 13 2/18/2011 2:58 PM

Figure 3 : Illustration of the LCR G3 annual oscillation with temperature variations inCenturipe. From top to bottom : temperature and gravity residuals after removing theEarth tides and air pressure effects.
Figure 4 : Illustration of the LCR G3 drift perturbation with temperature variations in
Centuripe (initial part of figure 3). From top to bottom : temperature and gravityresiduals after removing the Earth tides and air pressure effects.
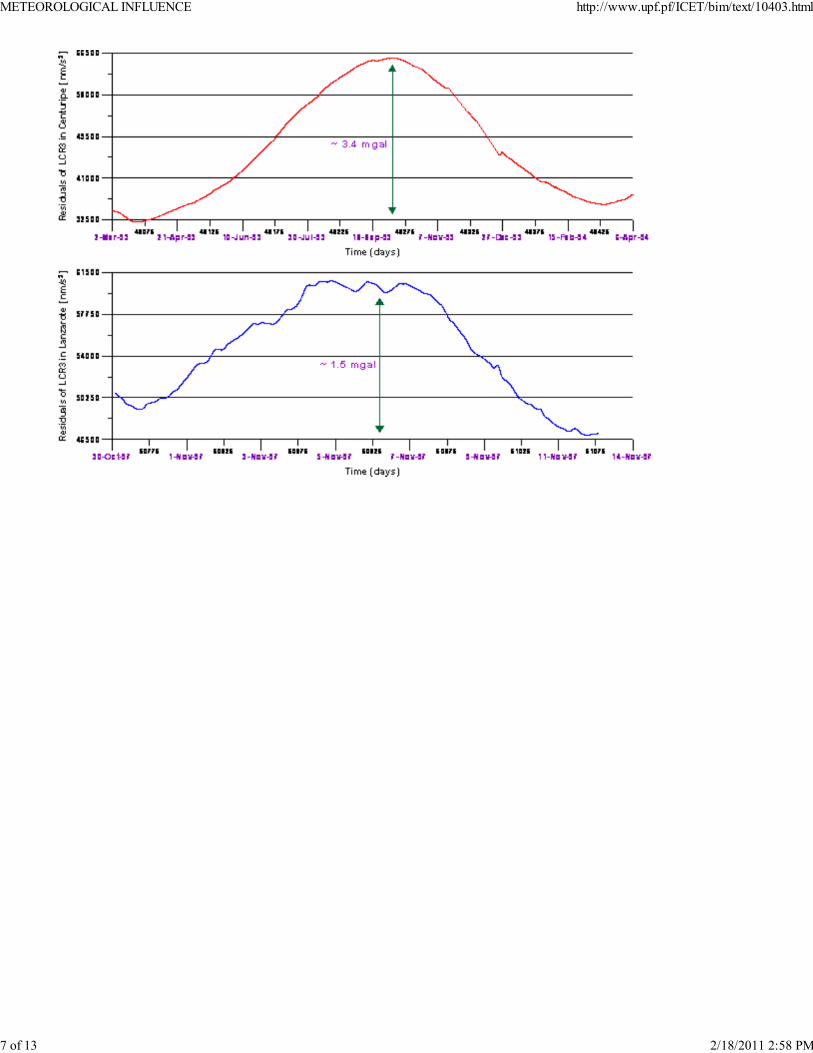
Now, comparing the annual oscillation of the same gravimeter, the LCR G3, in two different stations(Centuripe in Sicily and Lanzarote in the Canary Islands), we see in the figure 5 that the drift amplitude ismore than twice bigger in Centuripe than in Lanzarote. Therefore, the annual periodicity is due to theenvironment where we put the gravimeters.
METEOROLOGICAL INFLUENCE http://www.upf.pf/ICET/bim/text/10403.html
6 of 13 2/18/2011 2:58 PM
METEOROLOGICAL INFLUENCE http://www.upf.pf/ICET/bim/text/10403.html
7 of 13 2/18/2011 2:58 PM

Figure 5 : Illustration of the LCR G3 annual periodicity in Centuripe (Top) and in Lanzarote
(Bottom). In Centuripe the gravimeter had more than twice the drift amplitude recorded inLanzarote.
In the other station in the Etna area, Serra-la-Nave, the LCR G8 was installed in January 1992. Due to a
lack of heating power, the station room was imperfectly thermostatised. We decided later, in June 1994, tolower the thermostat. The result was a drop of the mean temperature in the station from 23 °C to 19 °C (seefigure 6). This strong variation was not noticeable in the drift curve of the LCR G8, so that the roomtemperature was not the responsible parameter of the annual oscillation (El Wahabi et al., 1998). A cross-correlation shows a phase lag of about 44 days between the temperature outside the station (in the open air)and the temperature inside the station which itself is leading the gravity signal by about 25 days. The station isthus acting like a low-pass filter between the temperature outside and inside the station, as well as thegravimeter which is also acting like a low-pass filter between the temperature excitation in the station and thegravity response.
Looking now at the residuals of the gravimeters LCR/ZLS G385 (see figure 7) and LCR D2 (see figure8) which are installed in Potsdam station, we see clearly an anti-correlation with the relative humidity whilethe temperature is stabilised in a range of ±0.1 °C. The phase difference between gravity and relativehumidity signals is close to 180 degree.
Figure 6 : Illustration of the LCR G8 annual periodicity with temperature variations in Serra-La-Nave. From top to bottom : gravity residuals after removing the Earth tides and air pressureeffects, the temperature recorded in the station room and the temperature recorded in the openair. The phase lag between the temperature outside and inside the station is about 44 days; andbetween the inside temperature excitation and the gravimeter response is about 25 days.
METEOROLOGICAL INFLUENCE http://www.upf.pf/ICET/bim/text/10403.html
8 of 13 2/18/2011 2:58 PM

Figure 7 : Illustration of the LCR/ZLS G385 annual drift (Top) with humidity variations(Bottom) in Potsdam. The temperature is stabilised at 25°C ± 0.1°C. The lower curve on thetop graph shows the annual drift reduced by a linear fit.
Figure 8 : Illustration of the LCR D2 annual drift (Top) with humidity variations(Bottom) in Potsdam. The temperature is stabilised at 25°C ± 0.1°C. The lower curve onthe top graph shows the annual drift reduced by a linear fit.
Some examples of Askania gravimeters come from Pecny, Potsdam and Walferdange stations. In
Pecny, where the station is thermostatised with a precision of ±0.1 °C, the gravity residuals of the Askania228 show a correlation -instead of an anti-correlation like in the case of LCR gravimeters- with the air
METEOROLOGICAL INFLUENCE http://www.upf.pf/ICET/bim/text/10403.html
9 of 13 2/18/2011 2:58 PM

humidity and a large apparent phase lag of about three months (see figure 9).
Figure 9 : Illustration of the Askania Gs 228 annual periodicity with temperature andhumidity variations in Pecny. From top to bottom : gravity residuals after removing Earthtides, temperature and humidity records. The lower curve on the top graph shows theannual drift reduced by a polynomial fit.
The Askania 222 in Potsdam presents the same feature as the previous one (see figure 10). In 1989, anexperiment has been made in Potsdam by putting the Askania 222 in an air-sealed container. Afterwards,the annual oscillation disappeared completely (see figure 11).
Figure 10 : Illustration of the Askania Gs 222 annual periodicity (Top) with humidityVariations (Bottom) in Potsdam. The temperature is stabilised at 25°C ± 0.1°C. The lowercurve on the top graph shows the annual drift reduced by a polynomial fit. The temperatureis controlled with an accuracy of ±0.1 °C.
METEOROLOGICAL INFLUENCE http://www.upf.pf/ICET/bim/text/10403.html
10 of 13 2/18/2011 2:58 PM

Figure 11 :Illustration of
the Askania Gs222 annual
oscillation (Top)with humidity
variations(Bottom) inPotsdam.Thetemperatureis stabilisedat 25°C ±0.1°C.Afterputting thegravimeter
in an air sealed container (14 July 1989), the annual drift disappeared.In Walferdange, the Askania 191/BN01 was installed in the mine where the temperature and the
humidity are very stable around 11°C and 80% respectively. The gravity residuals show only a linear drift(see figure 12) proving that one of these two meteorological parameters or both of them are responsible forthe annual oscillation.
Figure 12 : Illustration of the Askania Gs 191/BN01 drift in the mine of Walferdange.
The Earth tides and the air pressure effect are removed. No annual component is visible. Bastien and Goodacre (1990) made an experiment with the LCR ET12. They put the gravimeter in a
temperature controlled environment with low and high humidity level. The result is that the annual driftapparently disappeared during the period of the experiment with opposite quasi-linear drift rates for low andhigh humidity level (see figure 13).
METEOROLOGICAL INFLUENCE http://www.upf.pf/ICET/bim/text/10403.html
11 of 13 2/18/2011 2:58 PM

Figure 13 : Illustration of the LCR G12 annual periodicity in Ottawa. The drift
behaviour between 1985/1987 disappears after putting the gravimeter in controlledenvironment.
VI. Conclusions
With these examples, we see clearly that the humidity has an effect on spring gravimeters for longperiod variations. It should be noticed that all the gravimeters are equipped with the capacitive transducersand, therefore, the humidity can indeed change the dielectric constant of the air. However, Askaniagravimeters are completely sealed against pressure variations and the LCR gravimeters are sealed with dryinert gas inside. There should thus be no direct influence of humidity on the capacitance, while most of theelectronic parts are exposed to the humidity changes.
When monitoring the gravity on volcanoes, we have to record in addition at least three other parameters
: the air pressure, the temperature and the relative humidity. Acknowledgements
We are first very grateful to Prof. P. Pâquet for his help and encouragements. We thank Prof. B.Ducarme as well for his valuable advice and support. We acknowledge also Mr. M. Hendrickx for his help.Many thanks go to Mr. N. d’Oreye for providing the data of Askania 191. References Bastien R. and Goodacre A.K., 1990, The effect of humidity variations on long-term tidal gravity recordings,Bull. Inf. Marées Terrestres, 106, p. 7506-7510. El Wahabi A., Ducarme B., Van Ruymbeke M., d’Oreye N. and Somerhausen A. , 1998a, Continuous gravityobservations at Mount Etna (Sicily) and correlations between temperature and gravimetric records, Cahiersdu Centre Européen de Géodynamique et de Séismologie, Vol.14, p.105-120, 1997. El Wahabi A., Ducarme B., Van Ruymbeke M., d’Oreye N. and Somerhausen A. , 1998b, Four years ofcontinuous gravity observations at Mount Etna (Sicily), Proceedings of the 13th International Symposium onEarth Tides, p.477-479, 1998. Wenzel H.-G., 1996, The nanogal software : Earth tide data processing package : Eterna 3.3, Bull. Inf.Marées Terrestres, 124, p. 9425-9439.
METEOROLOGICAL INFLUENCE http://www.upf.pf/ICET/bim/text/10403.html
12 of 13 2/18/2011 2:58 PM

For any request please contact: Bernard DUCARME
Observatoire Royal de BelgiqueAvenue Circulaire 3BRUSSELS B-1180BELGIUM
Tel: +32 2 373 0248Fax: +32 2 374 9822
METEOROLOGICAL INFLUENCE http://www.upf.pf/ICET/bim/text/10403.html
13 of 13 2/18/2011 2:58 PM