a dynamical framework for the origin of the diagonal south
TRANSCRIPT

Quarterly Journal of the Royal Meteorological Society Q. J. R. Meteorol. Soc. 141: 1997–2010, July 2015 B DOI:10.1002/qj.2508
A dynamical framework for the origin of the diagonal South Pacificand South Atlantic Convergence Zones
Karin van der Wiel,a,b* Adrian J. Matthews,a,b,c David P. Stevensa,c and Manoj M. Joshia,b,d
aCentre for Ocean and Atmospheric Sciences, University of East Anglia, Norwich, UKbSchool of Environmental Sciences, University of East Anglia, Norwich, UK
cSchool of Mathematics, University of East Anglia, Norwich, UKdClimatic Research Unit, University of East Anglia, Norwich, UK
*Correspondence to: K. van der Wiel, School of Environmental Sciences, University of East Anglia,Norwich Research Park, Norwich NR4 7TJ, UK. E-mail: [email protected]
The South Pacific Convergence Zone (SPCZ) and South Atlantic Convergence Zone (SACZ)are diagonal bands of precipitation that extend from the Equator southeastward into theSouthern Hemisphere over the western Pacific and Atlantic Oceans, respectively. Withmean precipitation rates over 5 mm day−1, they are a major component of the tropical andglobal climate in austral summer. However, their basic formation mechanism is not fullyunderstood. Here, a conceptual framework for the diagonal convergence zones is developed,based on calculations of the vorticity budget from reanalysis and Rossby wave theory.
Wave trains propagate eastward along the Southern Hemisphere subtropical jet, withinitially quasi-circular vorticity centres. In the zonally sheared environment on theequatorward flank of the jet, these vorticity centres become elongated and develop anorthwest–southeast tilt. Ray-tracing diagnostics in a non-divergent, barotropic Rossbywave framework then explain the observed equatorward propagation of these diagonalvorticity structures toward the westerly ducts over the equatorial Pacific and Atlantic. Thebaroclinic component of these circulations leads to destabilisation and ascent ahead of thecyclonic vorticity anomaly in the wave, triggering deep convection because of the high seasurface temperatures in this region. Latent heat release then forces additional ascent andstrong upper-tropospheric divergence, with an associated anticyclonic vorticity tendency.A vorticity budget shows that this cancels out the advective cyclonic vorticity tendency inthe wave train over the SPCZ, and dissipates the wave within a day. The mean SPCZ isconsequently comprised of the sum of these pulses of diagonal bands of precipitation.
Similar mechanisms also operate in the SACZ. However, the vorticity anomalies in thewave trains are stronger, and the precipitation and negative feedback from the divergenceand anticyclonic vorticity tendency are weaker, resulting in continued propagation of thewave and a more diffuse diagonal convergence zone.
Key Words: SPCZ; SACZ; tropical–extratropical interaction; Rossby waves
Received 15 September 2014; Revised 5 December 2014; Accepted 15 December 2014; Published online in Wiley OnlineLibrary 17 February 2015
1. Introduction
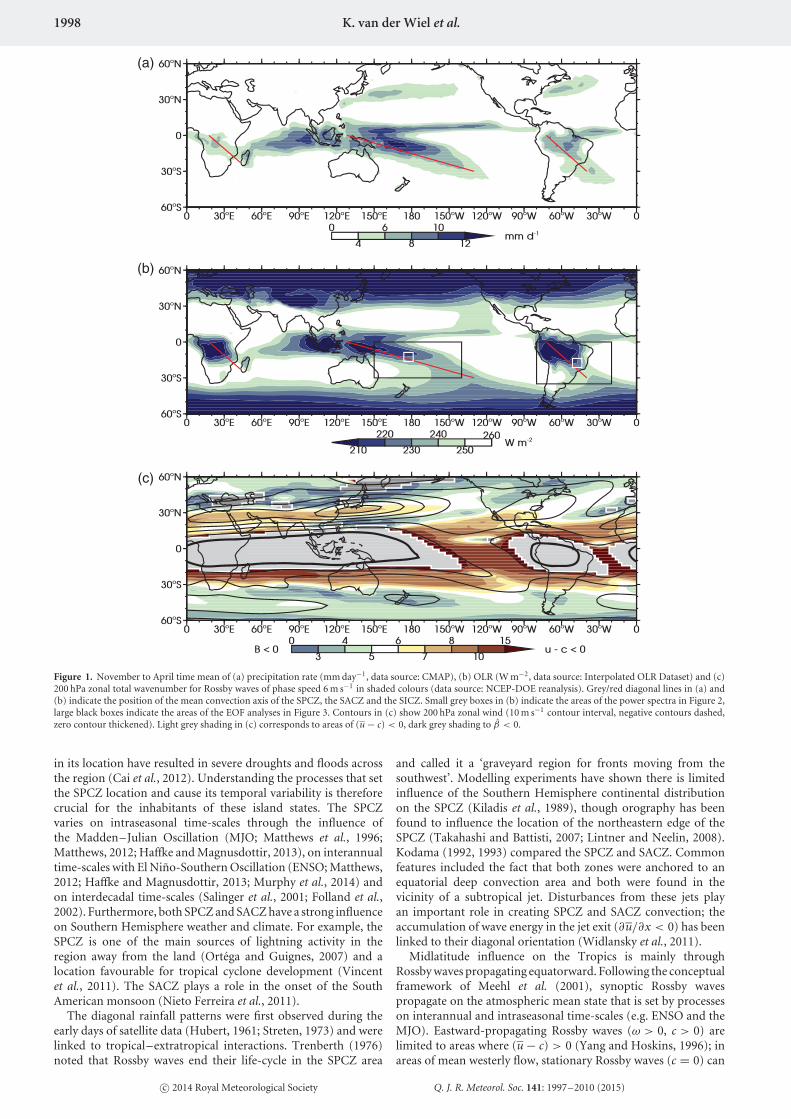
During austral summer, precipitation in the Southern Hemi-sphere is organised in three large-scale diagonal bands: theSouth Pacific Convergence Zone (SPCZ), the South AtlanticConvergence Zone (SACZ) and the less significant South IndianConvergence Zone (SICZ) (Figure 1(a)). By contrast, in theNorthern Hemisphere there are no such diagonal bands of rain-fall; in their place is the zonal Intertropical Convergence Zone(ITCZ). The SPCZ stretches diagonally from New Guinea inthe equatorial warm pool to approximately 30◦S, 120◦W. At its
tropical boundary, the SPCZ becomes more zonal and joins theITCZ over the Indian Ocean (Vincent, 1994). The SACZ extendsfrom the Amazon, over southern Brazil towards the western SouthAtlantic (Todd et al., 2003). The SICZ over southern Africa andMadagascar is less distinct than the SPCZ and SACZ and doesnot extend as far into the midlatitudes. Even though it has beenlinked to large-scale circulation patterns and convergence (Cook,2000), the focus here will mainly be on the SPCZ and SACZ.
Though the SPCZ lies mostly over the South Pacific Ocean,there are many small island states that depend on its rainfall (e.g.Griffiths et al., 2003; Kumar et al., 2006). Small displacements
c© 2014 Royal Meteorological Society
1998 K. van der Wiel et al.
(a)
(b)
(c)
Figure 1. November to April time mean of (a) precipitation rate (mm day−1, data source: CMAP), (b) OLR (W m−2, data source: Interpolated OLR Dataset) and (c)200 hPa zonal total wavenumber for Rossby waves of phase speed 6 m s−1 in shaded colours (data source: NCEP-DOE reanalysis). Grey/red diagonal lines in (a) and(b) indicate the position of the mean convection axis of the SPCZ, the SACZ and the SICZ. Small grey boxes in (b) indicate the areas of the power spectra in Figure 2,large black boxes indicate the areas of the EOF analyses in Figure 3. Contours in (c) show 200 hPa zonal wind (10 m s−1 contour interval, negative contours dashed,zero contour thickened). Light grey shading in (c) corresponds to areas of (u − c) < 0, dark grey shading to β < 0.
in its location have resulted in severe droughts and floods acrossthe region (Cai et al., 2012). Understanding the processes that setthe SPCZ location and cause its temporal variability is thereforecrucial for the inhabitants of these island states. The SPCZvaries on intraseasonal time-scales through the influence ofthe Madden–Julian Oscillation (MJO; Matthews et al., 1996;Matthews, 2012; Haffke and Magnusdottir, 2013), on interannualtime-scales with El Nino-Southern Oscillation (ENSO; Matthews,2012; Haffke and Magnusdottir, 2013; Murphy et al., 2014) andon interdecadal time-scales (Salinger et al., 2001; Folland et al.,2002). Furthermore, both SPCZ and SACZ have a strong influenceon Southern Hemisphere weather and climate. For example, theSPCZ is one of the main sources of lightning activity in theregion away from the land (Ortega and Guignes, 2007) and alocation favourable for tropical cyclone development (Vincentet al., 2011). The SACZ plays a role in the onset of the SouthAmerican monsoon (Nieto Ferreira et al., 2011).
The diagonal rainfall patterns were first observed during theearly days of satellite data (Hubert, 1961; Streten, 1973) and werelinked to tropical–extratropical interactions. Trenberth (1976)noted that Rossby waves end their life-cycle in the SPCZ area
and called it a ‘graveyard region for fronts moving from thesouthwest’. Modelling experiments have shown there is limitedinfluence of the Southern Hemisphere continental distributionon the SPCZ (Kiladis et al., 1989), though orography has beenfound to influence the location of the northeastern edge of theSPCZ (Takahashi and Battisti, 2007; Lintner and Neelin, 2008).Kodama (1992, 1993) compared the SPCZ and SACZ. Commonfeatures included the fact that both zones were anchored to anequatorial deep convection area and both were found in thevicinity of a subtropical jet. Disturbances from these jets playan important role in creating SPCZ and SACZ convection; theaccumulation of wave energy in the jet exit (∂u/∂x < 0) has beenlinked to their diagonal orientation (Widlansky et al., 2011).
Midlatitude influence on the Tropics is mainly throughRossby waves propagating equatorward. Following the conceptualframework of Meehl et al. (2001), synoptic Rossby wavespropagate on the atmospheric mean state that is set by processeson interannual and intraseasonal time-scales (e.g. ENSO and theMJO). Eastward-propagating Rossby waves (ω > 0, c > 0) arelimited to areas where (u − c) > 0 (Yang and Hoskins, 1996); inareas of mean westerly flow, stationary Rossby waves (c = 0) can
c© 2014 Royal Meteorological Society Q. J. R. Meteorol. Soc. 141: 1997–2010 (2015)

A Dynamical Framework for the Origin of the Diagonal SPCZ and SACZ 1999
freely propagate. These waves propagate through jet regions thatact as wave guides and are refracted towards latitudes with higherzonal total wavenumber
Kω =(
βM
uM − c
)1/2
, (1)
where β is the meridional gradient of absolute vorticity, u is thezonal wind, c is the zonal phase speed and subscript M denotesa Mercator projection (Karoly, 1983; Hoskins and Ambrizzi,1993). Figure 1(c) shows the November to April time meangeographical distribution of Kω at 200 hPa for Rossby waveswith a typical phase speed of 6 m s−1. Rossby waves from thesubtropical jet are refracted equatorward towards the westerlywinds over the eastern equatorial Pacific. This ‘westerly duct’allows for cross-equatorial Rossby wave propagation (Websterand Holton, 1982). Rossby waves from the jet southwest ofAustralia pass over the SPCZ area; Rossby waves refractingtowards the westerly duct in the equatorial Atlantic pass over theSACZ area. During austral winter, the westerly ducts disappearand equatorward refraction of midlatitude Rossby waves stops(Ambrizzi et al., 1995); coincidentally the SPCZ and SACZ aremuch less pronounced.
These Rossby waves can directly trigger convection over theSPCZ and SACZ regions. Poleward flow ahead of cyclonicanomaly centres in the waves is associated with ascentand decreased static stability according to quasi-geostrophicdynamics. The Tropics are sensitive to such forcing (highsea surface temperatures, conditionally unstable atmosphericconditions) and deep convection and precipitation can betriggered. Observational analysis has shown that transientconvection in the ITCZ during austral summer can be explainedby this sequence of events (Kiladis and Weickmann, 1992a, 1992bKiladis, 1998). Aquaplanet experiments have demonstrated theimportance of equatorward propagating midlatitude disturbancesin setting up a diagonal rainfall band (Nieto Ferreira and Chao,2013). In the SACZ region a similar configuration of upper-tropospheric Rossby wave and convection is found (Liebmannet al., 1999; Robertson and Mechoso, 2000). Besides their influenceon tropical convection, these Rossby waves have an importantrole in setting the momentum balance of the atmosphere (Kiladis,1998).
For the SPCZ area, the Rossby wave forcing of convectionfollowing the mechanism described above is discussed byMatthews (2012). It is noted that the wave decays within a day afterconvection is triggered. A hypothesis is proposed of a possible linkand negative feedback between the convection and precipitationtriggered by the transient wave and the subsequent decay ofthe wave. The diabatic heating released from condensationassociated with the anomalous convection is substantial. Thisheating forces extra ascent and upper-tropospheric divergence.The divergence is a source of anticyclonic vorticity (vortexstretching, ∂ζ/∂t = −fD, where ζ is relative vorticity, t is time,f is the planetary vorticity and D is horizontal divergence). Bymeans of a scale analysis, it is shown that this anticyclonic vorticitytendency is large enough to remove the cyclone in the transientwave and dissipate the wave.
In this article, observation-based data will be used to investigatethe diagonal orientation of both convergence zones. The analysisof Matthews (2012) will be extended with a full vorticitybudget, which quantifies the strength of the proposed negativefeedback mechanism. Rossby ray-tracing techniques will be usedto investigate Rossby wave propagation in the region. The analysiswill be repeated for the SACZ. In the next section, all data productsthat are used will be discussed. In section 3 we investigate temporaland spatial variability patterns for both regions. In section 4 thetemporal evolution of transient waves are discussed. A frameworkfor the diagonal SACZ is presented in section 5, followed by aframework for the diagonal SPCZ in section 6. The results aresummarized in section 7 together with a discussion of theirimplications for global climate.
2. Data
In tropical regions where precipitation is mostly from deepconvection, outgoing long-wave radiation (OLR) can be used asa proxy for precipitation (e.g. Lau and Chan, 1983; Janowiakand Arkin, 1991; Xie and Arkin, 1998). The annual cycle oftemperature is small, therefore the strongest variations of OLRare the result of the presence of deep convective clouds (Salby,2012). Figure 1(a,b) show time mean patterns of precipitationand OLR, respectively. In the Tropics (approximately 30◦S–30◦N)more negative OLR values correspond to enhanced convectionand more positive precipitation values; the SPCZ, SACZ andITCZ can be identified in both panels. Higher OLR values areassociated with reduced convection and negative precipitationanomalies, e.g. over the east Pacific dry zone. Polewards of30◦S/N, OLR decreases due to decreasing surface and atmospherictemperatures.
For OLR, the Interpolated OLR Dataset is used. These areestimates from the NOAA/NESDIS∗ polar-orbiting satellitesproviding space and time interpolated data; the interpolationalgorithm is described by Liebmann and Smith (1996). Data usedare daily means from 1979 to 2013 on a 2.5◦× 2.5◦ grid.
Additionally, precipitation data from the Climate PredictionCenter Merged Analysis of Precipitation (CMAP) project are used(Xie and Arkin, 1997). This is a precipitation product based ongauge observations from the Global Precipitation ClimatologyCenter (GPCC, Rudolf et al., 1994), five different satellite-basedprecipitation estimates and the NCEP–NCAR† reanalysis (Kalnayet al., 1996). The satellite estimates included are the GeostationaryOperational Environmental Satellite (GOES) Precipitation Index(Arkin and Meisner, 1987), the OLR Precipitation Index (OPI;Xie and Arkin, 1998), Spencer (Spencer, 1993), NOAA/NESDIS(Grody, 1991) and Chang (Wilheit et al., 1991). Data are availableon a 2.5◦× 2.5◦ grid as pentad values from 1979 to 2008; foranalysis purposes these have been linearly interpolated to dailyvalues.
Horizontal wind and vertical velocity data are taken fromthe NCEP–Department of Energy (DOE) reanalysis (Kanamitsuet al., 2002). Data were used on a 2.5◦× 2.5◦ grid with 12 verticallevels (1000 to 100 hPa) and covered the same period as wasavailable for OLR (1979–2013).
The analysis in this article covers the months November toApril when the SPCZ and SACZ are strongest. Anomalies werecomputed by removing the annual cycle from the data; theannual cycle was defined as the mean plus the first three (fivefor precipitation data) annual harmonics. To separate synoptic-scale variability from variability at longer time-scales, a 20-dayhigh-pass Lanczos filter (Duchon, 1979) was used.
3. Patterns of variability
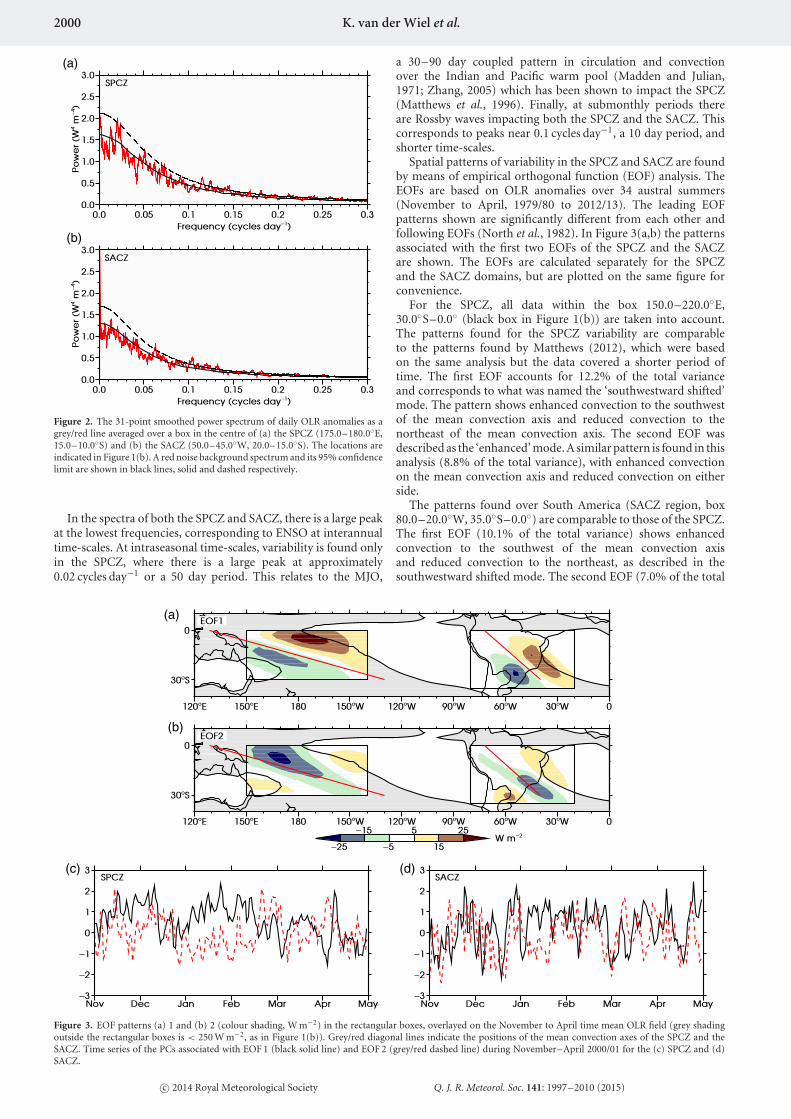
Time series of daily OLR anomalies are defined in the centreof the SPCZ (175.0–180.0◦E, 15.0–10.0◦S, small grey box inFigure 1(b)) and SACZ (50.0–45.0◦W, 20.0–15.0◦S). To assessthe dominant modes of temporal variability in the SPCZ andSACZ, smoothed power spectra of these time series are shown inFigure 2. Smoothing is based on a L = 31 point running mean.A red-noise theoretical background spectrum is added in black,based on the assumption that the time series were generated bya first-order Markov process and using the lag-1 autocorrelationcoefficient (r = 0.69 for SPCZ and r = 0.72 for SACZ) of thetime series (Wilks, 2006). The 95% confidence interval (dashedblack line) was calculated by a chi-squared test using 2L degreesof freedom.
∗(US) National Oceanographic and Atmospheric Administration/NationalEnvironmental Satellite Data and Information System.†(US) National Centers for Environmental Prediction/National ClimateResearch Center.
c© 2014 Royal Meteorological Society Q. J. R. Meteorol. Soc. 141: 1997–2010 (2015)
2000 K. van der Wiel et al.
(a)
(b)
Figure 2. The 31-point smoothed power spectrum of daily OLR anomalies as agrey/red line averaged over a box in the centre of (a) the SPCZ (175.0–180.0◦E,15.0–10.0◦S) and (b) the SACZ (50.0–45.0◦W, 20.0–15.0◦S). The locations areindicated in Figure 1(b). A red noise background spectrum and its 95% confidencelimit are shown in black lines, solid and dashed respectively.
In the spectra of both the SPCZ and SACZ, there is a large peakat the lowest frequencies, corresponding to ENSO at interannualtime-scales. At intraseasonal time-scales, variability is found onlyin the SPCZ, where there is a large peak at approximately0.02 cycles day−1 or a 50 day period. This relates to the MJO,
a 30–90 day coupled pattern in circulation and convectionover the Indian and Pacific warm pool (Madden and Julian,1971; Zhang, 2005) which has been shown to impact the SPCZ(Matthews et al., 1996). Finally, at submonthly periods thereare Rossby waves impacting both the SPCZ and the SACZ. Thiscorresponds to peaks near 0.1 cycles day−1, a 10 day period, andshorter time-scales.
Spatial patterns of variability in the SPCZ and SACZ are foundby means of empirical orthogonal function (EOF) analysis. TheEOFs are based on OLR anomalies over 34 austral summers(November to April, 1979/80 to 2012/13). The leading EOFpatterns shown are significantly different from each other andfollowing EOFs (North et al., 1982). In Figure 3(a,b) the patternsassociated with the first two EOFs of the SPCZ and the SACZare shown. The EOFs are calculated separately for the SPCZand the SACZ domains, but are plotted on the same figure forconvenience.
For the SPCZ, all data within the box 150.0–220.0◦E,30.0◦S–0.0◦ (black box in Figure 1(b)) are taken into account.The patterns found for the SPCZ variability are comparableto the patterns found by Matthews (2012), which were basedon the same analysis but the data covered a shorter period oftime. The first EOF accounts for 12.2% of the total varianceand corresponds to what was named the ‘southwestward shifted’mode. The pattern shows enhanced convection to the southwestof the mean convection axis and reduced convection to thenortheast of the mean convection axis. The second EOF wasdescribed as the ‘enhanced’ mode. A similar pattern is found in thisanalysis (8.8% of the total variance), with enhanced convectionon the mean convection axis and reduced convection on eitherside.
The patterns found over South America (SACZ region, box80.0–20.0◦W, 35.0◦S–0.0◦) are comparable to those of the SPCZ.The first EOF (10.1% of the total variance) shows enhancedconvection to the southwest of the mean convection axisand reduced convection to the northeast, as described in thesouthwestward shifted mode. The second EOF (7.0% of the total
(a)
(b)
(c) (d)
Figure 3. EOF patterns (a) 1 and (b) 2 (colour shading, W m−2) in the rectangular boxes, overlayed on the November to April time mean OLR field (grey shadingoutside the rectangular boxes is < 250 W m−2, as in Figure 1(b)). Grey/red diagonal lines indicate the positions of the mean convection axes of the SPCZ and theSACZ. Time series of the PCs associated with EOF 1 (black solid line) and EOF 2 (grey/red dashed line) during November–April 2000/01 for the (c) SPCZ and (d)SACZ.
c© 2014 Royal Meteorological Society Q. J. R. Meteorol. Soc. 141: 1997–2010 (2015)

A Dynamical Framework for the Origin of the Diagonal SPCZ and SACZ 2001
variance) is the enhanced SACZ, with enhanced convection overthe coastal and oceanic portion of the SACZ mean convectionaxis and reduced convection to the southwest and northeast.Note that in this case the largest variability is not locatedover the region of most intense rainfall, the Amazon, withinthe box.
Figure 3(c, d) show time series of the principal components(PCs) associated with the EOF patterns for the sample season ofNovember 2000 to April 2001. These are daily amplitudes scaledto have standard deviation σ = 1.0. In both SPCZ and SACZ, thedominant mode of variability is on short, synoptic time-scales.Variability on intraseasonal time-scales is only visible in the SPCZregion as was concluded from the power spectra earlier. Laggedcorrelations between the time series of PC 1 and PC 2 in the SPCZ(calculated over all years) do not exceed r = 0.02 for lags up toa week. This is not significant at a p = 95% level according tothe Pearson correlation coefficient statistical test. Therefore thereis no evidence of a phase relationship between the patterns ofEOF 1 and EOF 2, i.e. the southwestward shifted SPCZ mode doesnot develop into the enhanced SPCZ mode. For the SACZ thereare significant cross-correlations from PC 1 to PC 2. For lagsof 1–3 days, these are r = 0.320, 0.271 and 0.130 respectively.This indicates that the OLR anomalies propagate towards thenortheast, as the southwestward shifted mode develops into theenhanced mode. Hence, both the SPCZ and SACZ experiencevariability at submonthly periods associated with Rossby waveactivity. The spatial patterns associated with this variability arecomparable for both regions, with respectively a southwestwardshifted mode and an enhanced mode for EOFs 1 and 2. For theSPCZ these are similar to the patterns found in earlier analysis(Matthews, 2012).
Even though the variability patterns for the SPCZ and SACZare similar, the temporal evolution is fundamentally different.In the SPCZ there is no evidence of propagation from EOF 1to EOF 2. In the SACZ, significant lagged correlations are foundfrom the time series of EOF 1 to EOF 2. The OLR anomalies of thesouthwestward shifted SACZ mode propagate northeastward inabout 1–2 days to form the enhanced mode. In the next sectionthese differences in temporal evolution will be discussed in moredetail.
4. Wave propagation
Events of the southwestward shifted SPCZ and SACZ modes areinvestigated by means of composite analysis. A ‘convective event’is defined when two criteria are met:
1. PC 1 >1.0 σ ; and2. PC 1 is a maximum relative to 5 days before and 5 days
after the event.
In total, 204 months were taken into account (November–April,1979/80 to 2012/13). In this period there were 197 SPCZconvective events and 361 SACZ convective events based onthe above criteria. Composites were computed by taking themean of a field over all event days.
Figure 4(a) shows the SPCZ composites of OLR, 200 hPavorticity and 200 hPa wind anomalies; negative OLR anomalies(enhanced convection) lie to the southwest of the meanconvection axis and positive OLR anomalies (reduced convection)to the northeast. More enhanced convection is found over theMaritime Continent. The vorticity anomalies form a wave-like structure of cyclones (negative anomalies in the SouthernHemisphere) and anticyclones (positive anomalies). This is theRossby wave train propagating from the subtropical jet streamtowards the equatorial westerly duct which has been related totransient convection in the SPCZ (e.g Kiladis and Weickmann,1992a; Widlansky et al., 2011). Deep anomalous convectionis found southwest of the mean convection axis, in the samelocation as the poleward, ascending flow ahead of a cyclonicanomaly. Northeast of the mean convection axis, equatorwarddescending flow ahead of an anticyclonic anomaly coincides withreduced convection. The precipitation anomalies associated withthis pattern (not shown) are +5.3 mm day−1 southwest of themean convection axis and –6.3 mm day−1 northeast of the meanconvection axis.
Over South America the composite mean shows a similarcombination of events (Figure 4(b)). A Rossby wave trainpropagates from the Pacific towards the Atlantic westerly duct,with vorticity anomalies that are stronger than in the SPCZ region(note the different red contour intervals in the figures). Aheadof the cyclonic vorticity anomaly, poleward wind is associated
(a)
(b)
Figure 4. Composite anomalies of OLR (colour shading, W m−2), 200 hPa vorticity (grey/red contours, with 3 ×10⁻⁶ s−1 contour interval for (a) SPCZ and 6 ×10⁻⁶
s−1 for (b) SACZ, with zero contour omitted and negative contours dashed) and 200 hPa wind (vectors, m s−1, reference vector bottom left). The rectangle indicatesthe EOF region, the bold diagonal line the mean convection axis and the curved line an approximate wave propagation path.
c© 2014 Royal Meteorological Society Q. J. R. Meteorol. Soc. 141: 1997–2010 (2015)

2002 K. van der Wiel et al.
(a)
(b)
(c)
(d)
Figure 5. As Figure 4(b), but now lagged composites of 20 day high-pass filtered data, for time lags (a) event −2 days, (b) event, (c) event +1 day and (d) event+2 days.
with convection southwest of the mean convection axis. To thenortheast and southwest of this region, anticyclonic vorticitycentres and equatorward flow weaken convection. The associatedprecipitation anomalies are weaker than in the SPCZ region: in theenhanced convection an additional 2.4 mm day−1 of precipitationis generated, and the reduced convection decreases precipitationby 2.3 mm day−1. This is despite similar sized OLR anomaliesand is because mean precipitation in the SACZ is less than in theSPCZ (Figure 1(a)).
In the next two sections the SPCZ and SACZ will be discussedseperately. Analysis has shown the mechanism forcing the SACZis simpler than the mechanism for the SPCZ, therefore the SACZwill be discussed first. Based on the lagged composite analysis,the temporal evolution of the equatorward propagating wave andthe convection will be investigated. To separate the synoptic-scale variability of interest from variability at longer time-scales(e.g. MJO and ENSO), all subsequent data have been high-passfiltered before the composites are computed. Section 2 givesdetails.
5. A framework for diagonal SACZ development
5.1. Observational overview
Lagged composites of the days before and after the selectedconvective events give information on the temporal evolution ofthe wave train and convection anomalies (Figure 5). The Rossbywave train in the SACZ region can be tracked back into thecentral Pacific Ocean. In the days leading up to the convectiveevent, quasi-circular vorticity anomalies propagate eastward.The vorticity anomalies are refracted equatorwards towardthe upper-tropospheric mean westerlies over the equatorialAtlantic (Figure 1(c)). In this process the circular vorticitycentres are deformed and obtain a northwest–southeast diagonalorientation.
In front of the cyclonic anomaly, anomalous poleward windis found. Following quasi-geostrophic dynamics, poleward windis associated with ascent and reduced static stability. In theconditionally unstable tropical atmosphere, this gives rise to deep
c© 2014 Royal Meteorological Society Q. J. R. Meteorol. Soc. 141: 1997–2010 (2015)

A Dynamical Framework for the Origin of the Diagonal SPCZ and SACZ 2003
convection starting 2 days before the main convective event. Thisregion of enhanced convection (negative OLR anomaly) travelswith the wave along the propagation path and remains ahead ofthe cyclone at all times, intensifying with time. The oppositemechanism gives reduced convection ahead of anticyclonicvorticity. On the day of the convective event (Figure 5(b)) thevorticity anomalies lie parallel to the mean SACZ convection axis.By design of the composites, the convection peaks at the eventdate southwest of the mean convection axis. The precipitationrate that day (not shown) is 1.1 mm day−1. A day after the event,the convective anomaly is located at the mean convection axisand reflects the enhanced SACZ mode. This is in agreement withpreviously found cross-correlations between the PCs of EOFs 1and 2 (section 3). At event +2 days the convection has weakenedand now lies to the northeast of the mean convection axis, thepattern resembling a weak negative southwestward shifted mode.
5.2. Development of the diagonal orientation from Rossby wavedynamics
Rossby wave propagation from the Subtropics towards theEquator and coincident deformation of the vorticity centresis a core mechanism in the development of the diagonal band ofconvection forced along the SACZ. Over the central Pacific, thevorticity centres inititally have an approximately circular shape;a northwest–southeast orientation is subsequently developedduring their travel eastward and equatorward (e.g. Figure 5(b)).Here, two different models are used to test possible mechanismsfor this deformation. First, the role of simple horizontal advectionby the mean background wind (u,v) is determined. Thirty pointsin a circle around 105◦W, 45◦S form a circular patch that modelsa vorticity centre in the jet (Figure 6(a)). Vorticity is advectedonly; there is no refraction by a Rossby wave mechanism. Theadvection and changing location of the tracer in time has beencomputed by means of a fourth-order Runge–Kutta scheme witha time step of 60 s. The plotted daily location of the vorticitytracer shows that in time the circular shape does evolve into adiagonally orientated shape due to shear on the northern side ofthe jet. However there is no discernible equatorward propagationdue to the weak meridional wind.
(a)
(b)
Figure 6. Two different wave propagation models for the SACZ. (a) Horizontaladvection of a tracer by the 200 hPa November–April mean wind, with tracerpositions for consecutive days in grey/red contours, and wind (vectors, m s−1,reference vector bottom left). (b) Rossby ray propagation for the SACZ on the200 hPa November–April mean wind, bolder grey/red lines show ray paths,thinner grey/red lines connect these at daily intervals. Vorticity anomalies are asin Figure 5(b) in colour shading (s−1).
The second model demonstrates the role of non-divergentbarotropic Rossby wave dynamics. The ray-tracing technique ofKaroly (1983) for low-frequency Rossby waves is applied; scaleseparation between waves and mean flow is assumed. Rossbywaves with initial zonal wavenumber k0 = 1.2 × 10⁻⁶ m−1 andmeridional wavenumber l0 = 6.9 × 10⁻⁷ m−1 are initiated atX0 = 105◦W and six different latitudes across the jet between35 and 60◦S (Figure 6(b)). The change of the ray positionand wavenumbers are integrated forward in time by the sameRunge–Kutta scheme as in the first model. From their initialposition, the Rossby rays take about 2 days to reach the SACZ area;during this time they become aligned with the vorticity centres thatwere found in the composite analysis. In contrast to the advection-only model, the meridional movement is strong enough toshow clear equatorward propagation of the rays initiated onthe northern edge of the jet. Once convection is triggered, thenon-divergent dry model becomes a less valid description of thesituation. However, during the approach to the SACZ region, theRossby waves are dry and as a first approximation this simplemodel does show that barotropic Rossby wave dynamics can createthe elongated, northwest–southeast oriented vorticity anomaliesand equatorward propagation that lead to SACZ convection.
5.3. Vertical structure
Although barotropic non-divergent Rossby wave circulations canaccount for the diagonal orientation of the vorticity anomalies thatforce the SACZ, the baroclinic component of these circulationsand their associated vertical motion then leads to triggering ofconvection. The vertical structure of the wave train is shown inFigure 7(a), which shows a section along the approximate wavepath at the day of the event (curved black line in Figure 5(b)).The vorticity anomalies are strongest at 200 hPa and extend downto the surface in the SACZ region (the vertical line denotes theposition of the mean convection axis). The pressure velocityanomalies are approximately in quadrature with the vorticityanomalies. Rising motions are found ahead of the cyclonicanomaly west of the mean convection axis, and descendingmotions in front of anticyclonic anomalies east of the meanconvection axis. The strong rising motion is accompanied byconvergence in the lower troposphere and divergence in the uppertroposphere. The anticyclones up- and downstream of the cycloneare weaker but do give downward motion. Therefore convectionis inhibited and upper-level convergence is found ahead of those.
The temporal development of the wave train and the associatedconvection anomaly along the curved propagation path is shownin a Hovmoller diagram (Figure 7(b)). Grey dashed lines indicatean approximate group velocity based on the Rossby ray-tracingresults. The main region of vorticity activity lies within this groupvelocity envelope, consistent with the wave being governed byRossby wave dynamics. The effects of phase and group velocityare visible. The leading edge of the wave packet propagates atthe greater group velocity of approximately 29 m s−1 (dashedgrey line in Figure 7(b) passing through 100◦W, lag −5 days).Individual vorticity anomalies are initiated at this leading edge,e.g. the anticyclonic positive vorticity anomaly that begins around110◦W, lag −5 days (yellow shading). These vorticity anomaliespropagate at the slower phase speed of approximately 7 m s−1,increasing in amplitude as the centre of the energy envelope thatdefines the wave packet passes through them. Finally the trailingedge of the wave packet passes through, also at the group velocityof 29 m s−1. At this point, the individual vorticity anomalies decay(around 10◦W, lag +2 days for the positive vorticity anomaly)and eventually disappear.
Two days before the event, the cyclonic anomaly triggersconvection. Together, the vorticity and convection anomalypropagate onwards. Two days after the event both anomaliesweaken and the convective anomaly disappears.
A hypothesis of a possible link between wave propagationand the convection triggered by the wave was proposed in
c© 2014 Royal Meteorological Society Q. J. R. Meteorol. Soc. 141: 1997–2010 (2015)

2004 K. van der Wiel et al.
(a)
Pre
ssur
e (h
Pa)
Lag
(day
)
(b)
Figure 7. (a) Vertical cross-section of anomalies at the SACZ convective event along the curved propagation path (curved line in Figure 5(b)), vorticity (colourshading, s−1), divergence (grey/red contours, 2 × 10⁻⁶ s−1 contour interval, zero contour omitted, negative contours dashed) and pressure velocity (vectors, Pa s−1,reference vector bottom left). (b) Hovmoller diagram of lagged composite anomalies along the curved propagation path in the SACZ; 200 hPa vorticity (colourshading, s−1) and OLR (grey/red contours, 10 W m−2 contour interval, zero contour omitted, negative contours dashed). Grey dashed lines indicate an approximategroup wave speed, taken from Figure 6(b). All data are 20 day high-pass filtered. Horizontal axes are irregular longitude (bottom) or regular distance (top, 2000 kmintervals) along the path. Vertical line indicates the position of the mean SACZ convection axis.
Matthews (2012): ascent in the Rossby wave triggers convectionand precipitation. The diabatic heating released is substantial andenhances the ascent and upper-level divergence (Figure 7(a)).Divergence is a source of anticyclonic vorticity. As discussedbefore, the convection signal is in quadrature with the vorticityanomalies in the wave, with enhanced convection aheadof a cyclonic anomaly. The eastward propagating cyclonethat triggered convection therefore encounters the generatedanticyclonic vorticity when it moves along the wave path. Therelative size of these two opposite vorticity terms ultimatelydetermines whether or not the Rossby wave propagation cancontinue downstream of the triggered convection.
5.4. Vorticity budget
A quantitative analysis of the size of the different vorticityinfluences is needed to find the strength of the proposed negativefeedback between wave dynamics and diabatic heating. Thereforeall terms in the vorticity equation have been computed:
∂ζ
∂t︸︷︷︸I
= −u∂ζ
∂x− v
∂ζ
∂y︸ ︷︷ ︸II
−ω∂ζ
∂p︸ ︷︷ ︸III
−fD − ζD︸ ︷︷ ︸IV
−βv︸ ︷︷ ︸V
−∂ω
∂x
∂v
∂p+ ∂ω
∂y
∂u
∂p︸ ︷︷ ︸VI
, (2)
where x and y are horizontal axes in the eastward and northwarddirections, respectively, p is pressure, u, v and ω are velocitycomponents, and β = df /dy is the northward gradient ofplanetary vorticity (Holton, 2004, p. 103). The relative vorticity
tendency (term I) is the result of the sum of the effects of horizontal(term II) and vertical (term III) advection of relative vorticity,vortex stretching (term IV), meridional advection of planetaryvorticity (term V) and the tilting and twisting terms (term VI).Using 6 h NCEP–DOE reanalysis data at three levels (150, 200,250 hPa), all terms in the vorticity equation have been computedat the 200 hPa level. Partial derivatives in time and pressure havebeen computed using centred differences. The residual balancefrom this computation is smaller than the main terms of interestand does not show a large-scale pattern. For reference, the residualwill be plotted alongside the other terms.
In Figure 8 composites of the separate vorticity budget termsare shown for the day of the convective event. The budget isdominated by the horizontal advection terms and the vortexstretching terms. Horizontal advection (term II) of the wavepattern by both transient and background winds is the drivingforce for forward movement. The signal of horizontal advectionis in quadrature with the wave pattern. Total horizontal advectionof the cyclonic anomaly is partly balanced by the vortex stretchingterm (term IV) which has its maximum ahead of the cyclone whereconvection is triggered. This is the location of rising motion,enhanced convection and upper-level divergence forced by thewave (Figure 7(a)). The divergent outflow of air in the uppertroposphere is a source of anticyclonic vorticity. The vorticitytendency is in quadrature with the vorticity pattern (quartercycle ahead of the vorticity anomaly), resulting in continuedpropagation of the wave pattern.
The same composite analysis has been done for the enhancedSACZ mode (EOF 2, 397 selected events). The interaction betweentransient Rossby waves and convection is similar. The SACZin its climatological position can be seen as the sum of allindividual southwestward shifted and enhanced SACZ events. Theatmospheric basic state gives rise to the equatorward refraction
c© 2014 Royal Meteorological Society Q. J. R. Meteorol. Soc. 141: 1997–2010 (2015)

A Dynamical Framework for the Origin of the Diagonal SPCZ and SACZ 2005
(a) (b)
(c) (d)
(e) (f)
(g)
Figure 8. Composites of all terms in the full vorticity budget (Eq. (2)) for the SACZ at 200 hPa (contours, interval 1 ×10⁻⁵ s−1 day−1, negative contours dashed,zero contour omitted): (a) term I, (b) term II, (c) term III, (d) term IV, (e) term V, (f) term VI and (g) the residual. Vorticity anomalies (colour shading, s−1) as inFigure 4(b) are superimposed.
of Rossby waves that eventually leads to diagonal bands of deepconvection and precipitation.
6. A framework for diagonal SPCZ development
A similar analysis, as undertaken for the SACZ, is presented herefor the SPCZ. In Figure 9 lagged composites of the propagatingwave and convection anomalies are shown. A wave train can betracked to originate in the Indian Ocean. The vorticity anomaliesare refracted equatorwards toward the upper-tropospheric meanwesterlies over the equatorial Pacific (Figure 1(c)). As wasfound in the SACZ, originally quasi-circular vorticity centresget elongated in the northwest–southeast direction. On the dayof the convective event, the vorticity centres lie parallel to themean SPCZ convection axis. Ahead of the cyclonic anomaly,poleward ascending wind triggers deep convection in the tropicalconditionally unstable atmosphere. The anomalous precipitationfrom this deep convection is a maximum at +1.9 mm day−1.Northeast of the mean convection axis, a combination ofanticyclonic vorticity and equatorward descending flow resultsin a diagonal band of reduced convection. Two days after theevent, the OLR anomalies have mostly vanished. The wave trainhas not propagated further equatorward, and downstream of theSPCZ region the vorticity anomalies have disappeared. This isin contrast to the SACZ region where the convective anomaliestravelled with the wave train and passed over the mean convectionaxis.
In the unfiltered composite of the SPCZ (Figure 4(a)) thereis enhanced convection over the Maritime Continent. Thissignal has disappeared (Figure 9(c)) in the composites using20 day high-pass filtered data because it is forced at longer
time-scales than the synoptic time-scales at which the diagonalSPCZ convection is forced.
As was done for the SACZ, the role of horizontal advection inthe wave propagation is investigated by means of a simple model.A circular patch centred around 50◦E, 45◦S is advected by theNovember–April mean 200 hPa wind (Figure 10(a)). As observedin the composites (Figure 9(b)), the originally circular patchdeforms and becomes elongated in the northwest–southeastdirection. However, the observed equatorward propagation is notfound.
This equatorward refraction is found when non-divergentbarotropic Rossby wave dynamics are added to the model(Figure 10(b)). Rossby rays starting at 50◦E, across seven differentlatitudes (30–60◦S) with initial wavenumbers k0 = 1.2 × 10⁻⁶
m−1 and l0 = 4.4 × 10⁻⁷ m−1 take about 4 days to propagateto the SPCZ region and acquire the diagonal orientation foundin the composite analysis. The ray tracing is stopped there, asthis is where the Rossby wave in the composites loses coherence.The mechanisms involved in setting up the diagonal vorticitycentres at the base of the diagonal convection are similar for theSACZ and the SPCZ. Vorticity centres become elongated witha northwest–southeast tilt due to the zonal wind shear at theequatorward flank of the jet stream. Equatorward propagation isprimarily due to refraction.
The vertical section (Figure 11(a)) through the wave shows asimilar structure to the SACZ wave. The wave train of cyclones andanticyclones is strongest at about 200 hPa, with the main cyclonicanomaly reaching to the surface. Ahead of the cyclone there arestrong rising motions which are accompanied by convergenceat the surface and divergence aloft. The anticyclone upstreamof the cyclone gives downward motion, therefore convection is
c© 2014 Royal Meteorological Society Q. J. R. Meteorol. Soc. 141: 1997–2010 (2015)

2006 K. van der Wiel et al.
(a)
(b)
(c)
(d)
Figure 9. As Figure 4(a), but now lagged composites of 20 day high-pass filtered data for time lags (a) event −4 days, (b) event −2 days, (c) event and (d) event+2 days.
(a)
(b)
Figure 10. As Figure 6 but now for SPCZ.
inhibited and upper-level convergence is found ahead of thisanticyclone.
The propagation of vorticity and OLR anomalies are shownin a Hovmoller diagram (Figure 11(b)). West of the meanconvection axis and before the convective event there is cleareastward propagation of the vorticity anomalies at approximately500 km day−1 ≈ 5.8 m s−1. The grey dashed diagonal lines showthe approximate group velocity which is derived from the raypaths in Figure 10(b). Again, this energy envelope confines thewave packet. Near the mean convection axis, short-lived OLRanomalies appear, with enhanced convection ahead of the cyclonicvorticity centre and reduced convection ahead of the anticyclonicvorticity. These convective anomalies do not propagate alongthe wave path and the vorticity anomalies do not propagatedownstream of the mean SPCZ convection axis. Instead, theRossby wave loses coherence and decays at the convective event.
It seems the SPCZ area forms a barrier for the Rossby waves; thisis fundamentally different from the wave propagation we foundin the SACZ area. The feedback between wave propagation anddiabatic heating from triggered deep convection must thereforebe different. Quantitative evidence for the relative strength of thenegative feedback is provided by the computation of the vorticity
c© 2014 Royal Meteorological Society Q. J. R. Meteorol. Soc. 141: 1997–2010 (2015)

A Dynamical Framework for the Origin of the Diagonal SPCZ and SACZ 2007
(a)
Pre
ssur
e (h
Pa)
Lag
(day
)
(b)
Figure 11. As Figure 7, but now for the curved propagation path of the SPCZ (Figure 9). Notice different vector scaling, colour scale and contour interval fordivergence (1 × 10⁻⁶ s−1).
(a)
(c)
(e)
(b)
(d)
(f)
(g)
Figure 12. As Figure 8 but now for the SPCZ. Note different contour interval (0.5 ×10⁻⁵ s−1 day−1).
budget (Eq. (2)). In Figure 12 all separate terms and the residualare plotted for the day of the convective event. In the SACZ region,horizontal advection of relative vorticity was dominant and forcedcontinued propagation of the wave. Also in the SPCZ regionthe horizontal advection term (term II) shows northeastwardpropagation of the wave pattern; ahead of the cyclone negativevorticity tendency is found. However, vortex stretching (term IV)largely cancels this propagation. The anticyclonic tendency ahead
of the cyclone relates to upper-troposheric divergence foundahead of the cyclonic anomaly (Figure 11(a)). The sum of the twoeffects, the vorticity tendency, is close to zero so the cyclone doesnot move. This is the key SACZ/SPCZ difference. Meanwhile,the upstream anticyclonic anomaly does move forward intothe stationary cyclonic anomaly. The negative feedback betweenRossby wave and transient convection stops and dissipates theRossby wave.
c© 2014 Royal Meteorological Society Q. J. R. Meteorol. Soc. 141: 1997–2010 (2015)

2008 K. van der Wiel et al.
As in the SACZ region, the diagonal convection band ofthe SPCZ is forced by equatorward propagating Rossby wavesoriginating in the southern jet. In contrast to the SACZ, thelatent heat released in the convection is strong enough tostop the wave propagation. The vorticity centres in the SPCZwave train are much weaker than those of the wave train inthe SACZ region. As a result, the forced poleward wind andupward motion are also weaker in the SPCZ. However, the SPCZprecipitation that is induced is, in contrast, greater than in theSACZ. The additional latent heat from condensation is thereforerelatively more important and the additional upper-troposphericdivergence and anticyclonic vorticity tendency it generates isstrong enough to dissipate the wave in situ. This is consistent withthe non-significant cross-correlations that were found betweenthe PC time series of EOF 1 and 2 for the SPCZ.
7. Discussion
Observation-based data products have been used to investigatepatterns of variability in the SPCZ and SACZ regions; the focus has
been on variability at synoptic time-scales. Two spatial patterns ofvariability have been found in both the SPCZ and SACZ regions.The main mode is a ‘southwestward shifted’ convection pattern,the second mode is an ‘enhanced’ convection pattern. The EOFpatterns and associated PC time series have been used for com-posite analysis to find the temporal development of these modes.
The chain of events leading to a diagonal rainfall band inthe SPCZ region is shown in schematic form in Figure 13.A wave train originating from the southern subtropical jetrefracts northeastward towards the east Pacific equatorial westerlyduct (1). The originally quasi-circular vorticity anomalies getan elongated diagonal structure due to shear on the northernedge of the jet. Ray-tracing techniques have shown dry non-divergent barotropic Rossby dynamics provide the equatorwardpropagation, as has been suggested by Hoskins and Ambrizzi(1993). Ahead of a cyclonic vorticity anomaly, poleward windascends and triggers convection (2). This convection anomalyhas a northwest–southeast orientation similar to the vorticityanomalies, parallel to the mean convection axis. The mechanismis similar to that which causes transient convection in the ITCZ
Figure 13. Schematic of mechanism for the development of a diagonal SPCZ. A Rossby wave train from the southern tropical jet is refracted towards the equatorialPacific westerly duct (1). Originally quasi-circular vorticity centres deform to have a northwest–southeast elongation. Ahead of a cyclonic vorticity anomaly, polewardwind is associated with destabilisation and ascending motions that trigger deep convection in a diagonal band (2). Latent heat from condensation gives additionalascent and upper-tropospheric divergence (3). This leads to an anticyclonic vorticity tendency through vortex stretching ahead of the cyclone, however continuedhorizontal propagation of the cyclone brings it over this area and spins the cyclone down (4). The cyclone is dissipated in situ and hence Rossby wave propagationstops in the SPCZ area (5).
Precipitation4 mm day–1
Figure 14. Schematic of mechanism for the development of a diagonal SACZ. A Rossby wave train from the central South Pacific is refracted towards the equatorialAtlantic westerly duct (1). Originally quasi-circular vorticity centres deform to have a northwest–southeast elongation. Ahead of a cyclonic vorticity anomaly,poleward wind is associated with destabilisation and ascending motions that trigger deep convection in a diagonal band (2). Though latent heat from condensationgives additional ascent and upper-tropospheric divergence, the associated anticyclonic vorticity tendency is not strong enough to dissipate the wave. The Rossby wavetherefore continues propagating equatorward after forcing convection (3).
c© 2014 Royal Meteorological Society Q. J. R. Meteorol. Soc. 141: 1997–2010 (2015)

A Dynamical Framework for the Origin of the Diagonal SPCZ and SACZ 2009
during austral summer (Kiladis and Weickmann, 1992a, 1992b).Condensation and subsequent latent heat release in the convectionforce additional ascent and upper-tropospheric divergence (3).Through vortex stretching, this results in an anticyclonic vorticitytendency which acts to weaken the initial cyclonic anomaly(4). Depending on the strength of the negative feedback, thewave can propagate onwards or dissipate. The computation ofa full vorticity budget allows for a quantitative analysis of therelative importance of different vorticity tendency terms in thepropagation of the transient wave. In the SPCZ this has shownthat the feedback is strong enough to dissipate the wave withina day and propagation stops in the SPCZ region (5). This is inagreement with the proposed hypothesis and scale analysis ofMatthews (2012).
Figure 14 shows the mechanism for the development of thediagonal SACZ. Over South America a comparable wave trainpropagates equatorwards towards the Atlantic westerly duct (1).The same mechanisms that provided the northeast–southwesttilt and equatorward propagation in the SPCZ act here. A cyclonetriggers diagonally oriented convection (2) and forces upper-leveldivergence, as was also the case in the SPCZ region. However, thevorticity budget calculations in this case show that the divergenceforced by the wave is not strong enough to dissipate the wavein situ. The wave and convection therefore propagate past themean convection axis (3). This is in agreement with the cross-correlations found between the PCs of the shifted and enhancedmodes that were found in the SACZ only.
The existence of both the SPCZ and SACZ is due to theatmospheric basic state. Following the conceptual framework ofMeehl et al. (2001), processes at longer time-scales and largerspatial scales, including ENSO and MJO, set the base state uponwhich the transient Rossby waves get refracted equatorward. Theaccumulated effect of individual waves and short-lived pulses ofconvection then feed back on to the mean state.
Acknowledgements
The CMAP, interpolated OLR and NCEP Reanalysis data wereprovided by the NOAA/OAR/ESRL PSD, Boulder, Colorado,USA, from their web site at http://www.cdc.noaa.gov/ (accessed 8January 2015). The research presented in this article was carriedout on the High Performance Computing Cluster supported bythe Research Computing Service at the University of East Anglia.The authors would like to thank Ben Lintner and an anonymousreviewer for comments which helped to improve the manuscript.
References
Ambrizzi T, Hoskins BJ, Hsu H-H. 1995. Rossby wave propagation andteleconnection patterns in the austral winter. J. Atmos. Sci. 52: 3661–3672.
Arkin PA, Meisner BN. 1987. The relationship between large-scale convectiverainfall and cold cloud over the western hemisphere during 1982–1984.Mon. Weather Rev. 115: 51–74.
Cai W, Lengaigne M, Borlace S, Collins M, Cowan T, McPhaden MJ,Timmermann A, Power S, Brown J, Menkes C, Ngari A, Vincent EM,Widlansky MJ. 2012. More extreme swings of the South Pacific ConvergenceZone due to greenhouse warming. Nature 488: 365–370.
Cook KH. 2000. The South Indian Convergence Zone and interannual rainfallvariability over Southern Africa. J. Clim. 13: 3789–3804.
Duchon CE. 1979. Lanczos filtering in one and two dimensions. J. Appl.Meteorol. 18: 1016–1022.
Folland CK, Renwick JA, Salinger MJ, Mullan AB. 2002. Relative influencesof the Interdecadal Pacific Oscillation and ENSO on the SouthPacific Convergence Zone. Geophys. Res. Lett. 29: 21-1–21-4. doi:10.1029/2001GL014201.
Griffiths GM, Salinger MH, Leleu I. 2003. Trends in extreme daily rainfallacross the South Pacific and relationship to the South Pacific ConvergenceZone. Int. J. Climatol. 23: 847–869.
Grody NC. 1991. Classification of snow cover and precipitation using thespecial sensor microwave imager. J. Geophys. Res. 96: 7423–7435, doi:10.1029/91JD00045.
Haffke C, Magnusdottir G. 2013. The South Pacific Convergence Zonein three decades of satellite images. J. Geophys. Res. 118: 1–11, doi:10.1002/jgrd.50838.
Holton JR. 2004. An Introduction to Dynamical Meteorology (4th edn). ElsevierAcademic Press: Burlington, MA.
Hoskins BJ, Ambrizzi T. 1993. Rossby wave propagation on a realisticlongitudinally varying flow. J. Atmos. Sci. 50: 797–812.
Hubert LF. 1961. A subtropical convergence line of the South Pacific: A casestudy using meteorological satellite data. J. Geophys. Res. 66: 1661–1671,doi: 10.1029/JZ066i003p00797.
Janowiak JE, Arkin PA. 1991. Rainfall variation in the tropics during1986–1989, as estimated from observations of cloud-top temperature.J. Geophys. Res. 96: 3359–3373, doi: 10.1029/90JD01856.
Kalnay E, Kanamitsu M, Kistler R, Collins W, Deaven D, Gandin L, Iredell M,Saha S, White G, Woollen J, Zhu Y, Leetmaa A, Reynolds R, Chelliah M,Ebisuzaki W, Higgins W, Janowiak J, Ropelewski KC, Mo C, Wang J, JenneR, Joseph D. 1996. The NCEP/NCAR 40-year reanalysis project. Bull. Am.Meteorol. Soc. 77: 437–473.
Kanamitsu M, Ebisuzaki W, Yang S-K, Hnilo JJ, Fiorino M, Potter GL.2002. NCEP DOE AMIP-II reanalysis (R-2). Bull. Am. Meteorol. Soc. 83:1631–1643.
Karoly DJ. 1983. Rossby wave propagation in a barotropic atmosphere. Dyn.Atmos. Oceans 7: 111–125.
Kiladis GN. 1998. Observations of Rossby waves linked to convection over theeastern tropical Pacific. J. Atmos. Sci. 55: 321–339.
Kiladis GN, Weickmann KM. 1992a. Circulation anomalies associated withtropical convection during northern winter. Mon. Weather Rev. 120:1900–1923.
Kiladis GN, Weickmann KM. 1992b. Extratropical forcing of tropicalPacific convection during northern winter. Mon. Weather Rev. 120:1924–1938.
Kiladis GN, von Storch H, van Loon H. 1989. Origin of the South PacificConvergence Zone. J. Clim. 2: 1185–1195.
Kodama YM. 1992. Large-scale common features of subtropical precipitationzones (the Baiu Frontal Zone, the SPCZ, and the SACZ) Part I:Characteristics of subtropical frontal zones. J. Meteorol. Soc. Jpn. 70:813–836.
Kodama YM. 1993. Large-scale common features of subtropical convergencezones (the Baiu Frontal Zone, the SPCZ, and the SACZ) Part II: Conditionsof the circulations for generating the STCZs. J. Meteorol. Soc. Jpn. 71:581–610.
Kumar VV, Deo RC, Ramachandran V. 2006. Total rain accumulation andrain-rate analysis for small tropical Pacific islands: A case study of Suva, Fiji.Atmos. Sci. Lett. 7: 53–58.
Lau K-M, Chan PH. 1983. Short-term climate variability and atmosphericteleconnections from satellite-observed outgoing longwave radiation. I:Simultaneous relationships. J. Atmos. Sci. 40: 2735–2750.
Liebmann B, Smith CA. 1996. Description of a complete (interpolated)outgoing longwave radiation dataset. Bull. Am. Meteorol. Soc. 77:1275–1277.
Liebmann B, Kiladis GN, Marengo JA, Ambrizzi T, Glick JD. 1999.Submonthly convective variability over South America and the SouthAtlantic convergence zone. J. Clim. 12: 1877–1891.
Lintner BR, Neelin JD. 2008. Eastern margin variability of the SouthPacific Convergence Zone. Geophys. Res. Lett. 35: L16701, doi:10.1029/2008GL034298.
Madden RA, Julian PR. 1971. Detection of a 40–50 day oscillation in the zonalwind in the tropical Pacific. J. Atmos. Sci. 28: 702–708.
Matthews AJ. 2012. A multiscale framework for the origin and variability of theSouth Pacific Convergence Zone. Q. J. R. Meteorol. Soc. 138: 1165–1178.
Matthews AJ, Hoskins BJ, Slingo JM, Blackburn M. 1996. Development ofconvection along the SPCZ within a Madden-Julian Oscillation. Q. J. R.Meteorol. Soc. 122: 669–688.
Meehl GA, Lukas R, Kiladis GN, Weickmann KM, Matthews AJ, Wheeler M.2001. A conceptual framework for time- and space-scale interactions in theclimate system. Clim. Dyn. 17: 753–775.
Murphy BF, Powerand SB, McGree S. 2014. The varied impacts of El Nino-Southern Oscillation on Pacific island climates. J. Clim. 27: 4015–4036.
Nieto Ferreira R, Chao WC. 2013. Aqua-planet simulations of the formationof the South Atlantic convergence zone. Int. J. Climatol. 33: 615–628.
Nieto Ferreira R, Rickenbach TM, Wright EA. 2011. The role of cold fronts inthe onset of the monsoon season in the South Atlantic convergence zone.Q. J. R. Meteorol. Soc. 137: 908–922.
North GR, Bell TL, Cahalan RF. 1982. Sampling errors in the estimation ofempirical orthogonal functions. Mon. Weather Rev. 110: 699–706.
Ortega P, Guignes T. 2007. Lightning activity analyses with respect to the SPCZlocation. Geophys. Res. Lett. 34: L11807, doi: 10.1029/2007GL029730.
Robertson AW, Mechoso CR. 2000. Interannual and interdecadal variability ofthe South Atlantic Convergence Zone. Mon. Weather Rev. 128: 2947–2957.
Rudolf B, Hauschild H, Rueth W, Schneider U. 1994. Terrestrial precipitationanalysis: Operational method and required density of point measurements.NATO ASI Ser. 126: 173–186.
Salby ML. 2012. Physics of the Atmosphere and Climate (1st edn). CambridgeUniversity Press: New York, NY.
Salinger MJ, Renwick JA, Mullan AB. 2001. Interdecadal Pacific Oscillationand South Pacific climate. Int. J. Climatol. 21: 1705–1721.
Spencer RW. 1993. Global oceanic precipitation from the MSU during1979–1991 and comparisons to other climatologies. J. Clim. 6: 1301–1326.
c© 2014 Royal Meteorological Society Q. J. R. Meteorol. Soc. 141: 1997–2010 (2015)

2010 K. van der Wiel et al.
Streten NA. 1973. Some characteristics of satellite-observed bands of persistentcloudiness over the Southern Hemisphere. Mon. Weather Rev. 101:486–495.
Takahashi K, Battisti DS. 2007. Processes controlling the mean tropical Pacificprecipitation pattern. Part II: The SPCZ and the southeast Pacific dry zone.J. Clim. 20: 5696–5706.
Todd MC, Washington R, James T. 2003. Characteristics of summertime dailyrainfall variability over South America and the South Atlantic convergencezone. Meteorol. Atmos. Phys. 83: 89–108.
Trenberth KE. 1976. Spatial and temporal variations of the SouthernOscillation. Q. J. R. Meteorol. Soc. 102: 639–653.
Vincent DG. 1994. The South Pacific Convergence Zone (SPCZ): A review.Mon. Weather Rev. 122: 1949–1970.
Vincent EM, Lengaigne M, Menkes CE, Jourdain NC, Marchesiello P,Madec G. 2011. Interannual variability of the South Pacific ConvergenceZone and implications for tropical cyclone genesis. Clim. Dyn. 36:1881–1896.
Webster PJ, Holton JR. 1982. Cross-equatorial response to middle-latitudeforcing in a zonally varying basic state. J. Atmos. Sci. 39: 722–733.
Widlansky MJ, Webster PJ, Hoyos CD. 2011. On the location and orientationof the South Pacific Convergence Zone. Clim. Dyn. 36: 561–578.
Wilheit TT, Chang ATC, Chiu LS. 1991. Retrieval of the monthly rainfall indicesfrom microwave radiometric measurements using probability distributionfunctions. J. Atmos. Oceanic Technol. 8: 118–136.
Wilks DS. 2006. Statistical Methods in the Atmospheric Sciences (2nd edn).Elsevier Academic Press: Burlington, MA.
Xie P, Arkin PA. 1997. Global precipitation: A 17-year monthly analysis basedon gauge observations, satellite estimates, and numerical model outputs.Bull. Am. Meteorol. Soc. 78: 2539–2558.
Xie P, Arkin PA. 1998. Global montly precipitation extimates from satellite-observed outgoing longwave radiation. J. Clim. 11: 137–164.
Yang G-Y, Hoskins BJ. 1996. Propagation of Rossby waves of non-zerofrequency. J. Atmos. Sci. 53: 2365–2378.
Zhang C. 2005. Madden–Julian Oscillation. Rev. Geophys. 43: RG2003.
c© 2014 Royal Meteorological Society Q. J. R. Meteorol. Soc. 141: 1997–2010 (2015)