a detection and surveillance of viral hemorrhagic ... · a abi 7500 abi, life technologies 1.4...
TRANSCRIPT
DISEASES OF AQUATIC ORGANISMSDis Aquat Org
Vol. 111: 1–13, 2014doi: 10.3354/dao02753
Published August 21
INTRODUCTION
Viral hemorrhagic septicemia virus (VHSV) is thecausative agent of a highly contagious disease of bothsaltwater and freshwater fish in the northern hemi-
sphere. VHSV is a novirhabdovirus (Rhabdoviridae)(Tordo et al. 2005) that is listed as a notifiable patho-gen by the World Organization for Animal Health(OIE). The severity of infection and its outcome variesby fish species, age, immune status, and prevailing
© Inter-Research 2014 · www.int-res.com*Corresponding author: [email protected]
Detection and surveillance of viral hemorrhagicsepticemia virus using real-time RT-PCR.
I. Initial comparison of four protocols
Janet V. Warg1,*, Travis Clement2, Emily R. Cornwell3, Angela Cruz1, Rodman G. Getchell3, Cem Giray4, Andrew E. Goodwin5, Geoffrey H. Groocock3,
Mohamed Faisal6, Robert Kim6, Gwenn E. Merry5, Nicholas B. D. Phelps7, Monica M. Reising8, Isaac Standish6, Yan Zhang9, Kathy Toohey-Kurth10
1Diagnostic Virology Laboratory, National Veterinary Services Laboratories, VS, APHIS, USDA, Ames, Iowa 50010, USA2Veterinary and Biomedical Sciences Department, Animal Disease Research and Diagnostic Laboratory,
South Dakota State University, Brookings, South Dakota 57007, USA3Aquatic Animal Health Program, Department of Microbiology and Immunology, Cornell University, Ithaca,
New York 14853, USA4Kennebec River Biosciences, Richmond, Maine 04357, USA
5Aquaculture/Fisheries Center, University of Arkansas Pine Bluff, Pine Bluff, Arkansas 71601, USA6Aquatic Animal Health Laboratory, College of Veterinary Medicine, Michigan State University, East Lansing,
Michigan 48824, USA7Veterinary Diagnostic Laboratory, University of Minnesota, St. Paul, Minnesota 55108, USA
8Center for Veterinary Biologics, VS, APHIS, USDA, Ames, Iowa 50010, USA9Animal Disease Diagnostic Laboratory, Ohio Department of Agriculture, Reynoldsburg, Ohio 43068, USA
10Wisconsin Veterinary Diagnostic Laboratory, University of Wisconsin, Madison, Wisconsin 53706, USA
ABSTRACT: Eight laboratories worked collectively to evaluate 4 real-time RT-PCR (rRT-PCR) pro-tocols targeting viral hemorrhagic septicemia virus (VHSV) being considered for deployment to aUSA laboratory testing network. The protocols utilized previously published primers and probesets developed for detection and surveillance of VHSV. All participating laboratories received andfollowed a standard operating protocol for extraction and for each of the rRT-PCR assays. Perform-ance measures specifically evaluated included limit of detection (defined as the smallest amountof analyte in which 95% of the samples are classified as positive), analytical specificity, assay effi-ciency across genotype representatives, within- and between-plate variation within a laboratory,and variation between laboratories using the same platform, between platforms, and betweensoftware versions. This evaluation clearly demonstrated that the TaqMan®-based assay devel-oped by Jonstrup et al. (2013; J Fish Dis 36:9−23) produced the most consistent analytical perform-ance characteristics for detecting all genotypes of VHSV across the 8 participating laboratories.
KEY WORDS: VHSV · Surveillance · Real-time RT-PCR · Analytical sensitivity · Analytical specificity · Validation
Resale or republication not permitted without written consent of the publisher
FREEREE ACCESSCCESS
Dis Aquat Org 111: 1–13, 2014
environmental conditions. Dependent on the speciesof fish, infection may result in substantial mortality(Smail & Snow 2011, Kim & Faisal 2010a,b,c, Groococket al. 2012). VHSV can become endemic in fish popu-lations, with some individual fish serving as carriers ofthe virus and periodically shedding the virus, whichcauses repeat episodes of disease in naïve fish popu-lations (Hershberger et al. 2010, Kim & Faisal 2012).Since its emergence in the Laurentian Great Lakes ofNorth America, the novel sublineage of VHSV geno-type IV has caused several large-scale die-offs of wildfish and spread into the 5 Great Lakes, a number of in-land lakes, and several streams (Elsayed et al. 2006,Gagné et al. 2007, Groocock et al. 2007, Lumsden etal. 2007, Cornwell et al. 2011, 2012). VHSV is now en-demic in the Great Lakes and represents a serious riskto farmed fish populations within the Great Lakes wa-tershed as well as a risk for dissemination of the virusto other watersheds within or outside the USA bymovement of fish (reviewed by Faisal et al. 2012).
The current gold standard for detection of VHSV ineither clinical or non-clinical fish is virus isolation incell culture followed by virus identification (AFS-FHS2010, OIE 2012). Virus isolation in cell culture is a longand labor-intensive process. Multiple real-time RT-PCR (rRT-PCR) assays with rapid turnaround timehave been developed and suggested for use in VHSVsurveillance efforts or for routine diagnosis of viral he-morrhagic septicemia (VHS) (Chico et al. 2006, Liu etal. 2008, Matejusova et al. 2008, 2010, Cutrín et al.2009, Hope et al. 2010, Garver et al. 2011, Jonstrup etal. 2013, Pierce et al. 2013a,b). However, in order toconsider utilization of any VHSV rRT-PCR assay insurveillance or diagnostic activities where testing isconducted in multiple laboratories and where the re-sults from multiple laboratories may be used to sup-port declarations of freedom from the pathogen, thetesting protocol must be standardized, robust, andperformance estimates well characterized.
The definition of what constitutes a standardizedtesting protocol varies. For rRT-PCR assays, the OIEAquatic Diagnostic Manual frequently lists primers,probe, and cycling conditions but lacks many of thedetails that can influence a test’s outcome. Qualitycontrols (such as extraction and amplification controlsand acceptable cycle threshold [Ct] value ranges forpositive extraction and amplification controls) and in-terpretation criteria need to be defined in the stan-dardized testing protocol. To this end, the USDA-APHIS coordinated efforts of 8 laboratories to comparethe analytical performance of 4 rRT-PCR protocolsthat utilized 3 previously published primers andprobe sets (Hope et al. 2010, Garver et al. 2011, Phelps
et al. 2012, Jonstrup et al. 2013) following OIE valida-tion guidelines. In addition, the purpose of this com-parison is exclusively for detection (an unequivocalpositive or negative test result) of VHSV for diagnosisor surveillance, although the assays could be used forrelative quantitation purposes. The participating lab-oratories received and followed a standard operatingprotocol for extraction and for each of the rRT-PCR assays. This paper reports the criteria used for thecomparison of assay performance across participatinglaboratories as well as the results. Performance meas-ures specifically investigated included limit of detec-tion (LOD), defined as the smallest amount of analytein which 95% of the samples are classified as positive,analytical specificity, estimates of assay efficiencyacross genotype representatives, within- and be-tween-plate variation within a laboratory, variationbetween laboratories using the same platform, be-tween platforms, and between software versions. Inaddition, both the LOD and the efficiency estimatescan be used as indicators of laboratory/ techniciansensitivity differences related to sample handling (se-rial dilutions of virus stocks) within a testing labora-tory. Performance measures were used collectively toselect assays for further evaluation and to make rec-ommendations on the suitability of each of these as-says for surveillance and diagnostic purposes.
MATERIALS AND METHODS
Samples and standards
Virus strains representing the 4 different VHSVgenotypes were used in this study (Table 1); theseincluded reference viruses and field isolates. Tissueculture infectious dose 50% (TCID50) per ml titerswere calculated for each VHSV stock by the Spear-man-Kärber method as modified by Finney (1978) ina 96-well plate format using 10-fold serial dilutions.Fish tissue and fish pathogens (see Table 3) wereused to evaluate analytical specificity (exclusivity).Positive amplification controls (PAC) included 2 dif-ferent sets (3 concentrations in each set) of VHSV-relevant RNA standards. A VHSV-infected roundgoby RNA standard set (Hope et al. 2010) was usedduring Phase I testing, and a VHSV MI03 isolateRNA standard set was used during Phase II testing.Each laboratory used its own VHSV reference virusas a positive extraction control. Negative extractioncontrols were diluents (cell culture medium) utilizedat each participating laboratory. Negative amplifica-tion control was RNA elution buffer or water.
2
Warg et al.: rRT-PCR protocols for VHSV. I. Initial comparison
RNA extraction
The MagMAX™-96 Viral RNA Isolation Kit(Ambion® kit 1836, Life Technologies) was used toextract nucleic acids using either an automated ormanual system (Shah et al. 2009). Automated sys-tems included MagMAX™ Express (Applied Bio -systems (ABI), Life Technologies), or Kingfisher(Ther mo Fisher Scientific), or BioSprint 96 (Qiagen)magnetic particle processors; and manual systemsused an Ambion magnetic plate stand following themanufacturer’s instructions. Protocol AM1836 DW50 v2 Aqua (ABI, Life Technologies) was followed forthe automated extraction.
rRT-PCR
Three previously published VHSV-specific primerand probe sets (identified as the Garver, Hope, andJonstrup assays in this study) were selected based on
published performance characteristics, scientificvalidity data including performance in species andpopulation to be tested, and international acceptance(Hope et al. 2010, Garver et al. 2011, Jonstrup et al.2013). The Hope and the Jonstrup assays are single-tube assays where both reverse transcription (RT)and PCR occur in a single tube using primers specificfor a fragment of the nucleoprotein (N) gene ofVHSV. The Garver assay is a 2-step assay that re -quires RT of RNA to cDNA using random primers in1 tube, followed by real-time PCR in a second tube. Afourth assay (identified as the Phelps assay in thisstudy) utilized the Garver primers and probe in a single tube format (Phelps et al. 2012).
Testing phases
The purpose of Phase I was to establish perform-ance characteristics on a single platform and soft-ware package to be used as the ‘reference standard
platform.’ Criteria for selection of lab -oratories for this phase were thoseconducting VHSV surveillance, move -ment, or confirmation testing on fishcollected from the Great Lakes water-shed and had the reference plat-form and software in the laboratory(Table 2). Three labora tories (A, B,and C) tested 9 VHSV isolates, repre-senting the 4 genotypes, with the 4different rRT-PCR methods on theABI 7500 — software version 1.4 plat-form (ABI, Life Tech no logies). From asingle stock for each isolate, each lab-oratory created 3 separate 10-foldserial dilutions spanning concentra-tions 10−1 through 10−8. Total RNA
3
Virus isolate Geno- Location Host Yeartype
DK5151 Ia Rindsholm, Denmark Rainbow trout 19921p53 II Baltic Sea Herring 1996F13.02.97 III Farmed; Ireland Turbot 1997Makah IVa Hatchery; USA Coho salmon 1988ME03 IVa Atlantic Ocean Herring 20032000-149 IVc Ruisseau George-Collette, Mummichog 2000
CanadaMI03 IVb Lake St. Clair, USA Muskellunge 20032004-175 IVc French River, Canada Brown trout 2004FPL2006-005 IVb St. Lawrence River, USA Round goby 2006
Table 1. Viral hemorrhagic septicemia virus (VHSV) reference isolates used for establishing limit of detection and amplification efficiency
Lab Platform Manufacturer Software Function rRT-PCRversion experience
A ABI 7500 ABI, Life Technologies 1.4 Diagnostic HighB ABI 7500 ABI, Life Technologies 1.4 Diagnostic Recently trainedC ABI 7500 ABI, Life Technologies 1.4 Research and diagnostic SomeD ABI 7500 ABI, Life Technologies 1.4 Diagnostic HighE Mastercycle® EP Realplex Eppendorf 1.5 Diagnostic HighF Mastercycle® EP Realplex Eppendorf 2.2 Research and diagnostic Recently trainedG BioRad iCycler iQ™ BioRad 3.1 Research and diagnostic Recently trainedH ABI 7500 ABI, Life Technologies 2.0 Diagnostic Recently trained
Table 2. Laboratory information. PCR experience levels were categorized as High: extensive experience with high-throughputrRT-PCR testing for multiple pathogens; Some: recent experience with high-throughput VHSV rRT-PCR testing; Recently
trained: experience with high sample testing numbers but recently trained to perform rRT-PCR
Year wascorrectedafterpublication
Dis Aquat Org 111: 1–13, 2014
was extracted from 50 µl of each replicate 10-foldserial dilution. Individual RNA samples were ana-lyzed once by each assay, and Ct values were re -corded for use in determining test performance char-acteristics. Controls for every run included negativeextraction controls, negative amplification controls,positive extraction controls, and positive amplifica-tion controls. Estimates for LOD were considered inconjunction with the estimates for efficiency whencomparing assays.
The purpose of Phase II was to establish perform-ance characteristics in laboratories (hereafter ‘Labs’)that utilized alternative platforms and software. Cri-teria for selection of labs for this phase were thoseconducting VHSV surveillance or movement testingon fish collected from outside the Great Lakeswatershed and/or had a different platform and soft-ware in the lab. Five labs (D, E, F, G, and H) tested4 VHSV genotype IV isolates using 2 different rRT-PCR methods (Jonstrup and Phelps methods) as out-lined in Phase I. Platforms and software used for thisphase are listed in Table 2. Phase II data allowed fora comparison of platforms or an individual lab’s per-formance with the reference standard platform.Comparison of Labs A, B, C, and D was a directcomparison of labs or individuals performing theassay in a lab as the platform is the same in each ofthese labs and a single individual performed thetest in each lab (lab and technical operator are con-founded). The ABI 7500 (software version 1.4) plat-form used by Labs A, B, and C in Phase I testingwas considered the ‘reference standard platform’;Lab D also used the reference standard platformduring Phase II testing. Phase II results from Labs D,E, F, G, and H (other platforms or individuals) werecompared to Phase I results from Labs A, B, and C.Lab F had 2 individuals (F1 and F2) perform the testing.
Determination of assay performance characteristics
Data interpretation
The Ct value of a rRT-PCR reaction is defined bythe threshold line set within the exponential phase ofthe logarithmic scale amplification plot, and thebaseline reflects the background or noise in the reac-tions. For the reference standard platform (ABI 7500,software version 1.4), the auto Ct algorithm, whichcalculates baseline and threshold parameters basedon the assumption that data sets will exhibit charac-
teristic amplification curves, was utilized. After eachana lysis, the baseline and threshold parameters werereviewed. When the baseline was set too low (higherbackground on a run), a second analysis was per-formed using auto threshold and manual baselinesettings (3 to 15 cycles). The Auto Ct algorithm wasused for the BioRad iCycler iQ™ software version3.1. For the Mastercycler® EP Realplex software ver-sion 1.5 the best-fit algorithm was used to set thebaseline and threshold. Threshold setting for theMastercycler® EP Realplex software version 2.2 wasproblematic, as neither the best fit nor noisebandalgorithm (software defined) produced repeatableresults. Thresholds were manually established forthe Mastercycle® EP Realplex software version 2.2based on a set percentage of the plateau of the lowpositive amplification control (ABI recommendationto optimize consistency across platforms and for correct data interpretation for low copy number samples).
Analytical sensitivity
The LOD was determined as the concentration(TCID50 per ml titer) corresponding to the last serialdilution in which all 3 replicates tested positive.A regression analysis was conducted (Ct versus−log10 dilution) on the data from each laboratoryfor each isolate by rRT-PCR method using only thedata within the LOD. The slope of the regression linewas used to estimate the amplification efficiency(AE) and was reported as a percentage: AE = 100 ×(101/slope − 1). Comparison of each laboratory’s per-formance characteristics (LOD and AE) by isolateand method were performed.
Repeatability and reproducibility
Linear mixed effects models were fit to Ct valuesobtained for the VHSV MI03 RNA standard set (pro-vided to laboratories) produced by each assay foreach laboratory. The models included a fixed dilutioneffect, a random plate effect, a random dilution byplate effect, and a random error. The square root ofthe variance of the random error was reported as thewithin-plate variability. The square root of the sum ofthe variances of the random plate and random dilu-tion by plate effects was reported as the between-plate variability. The total variability was reported asthe square root of the sum of all variance components(Vardeman & Jobe 1999).
4
Warg et al.: rRT-PCR protocols for VHSV. I. Initial comparison
Analytical specificity
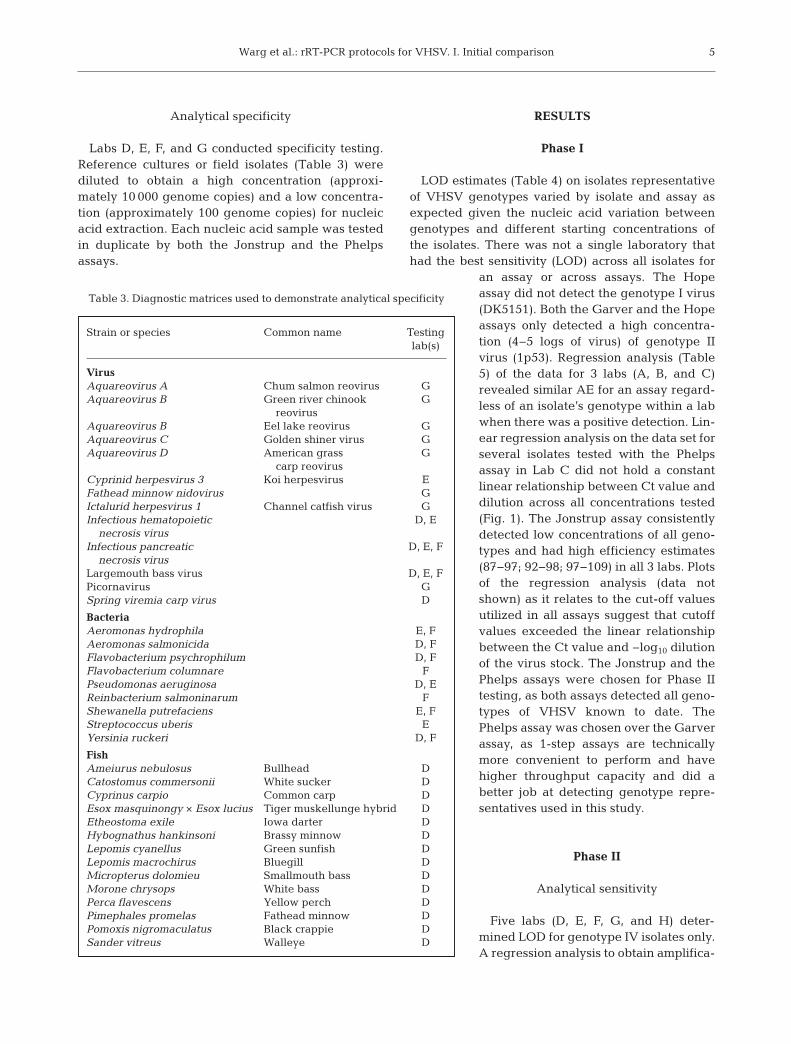
Labs D, E, F, and G conducted specificity testing.Reference cultures or field isolates (Table 3) werediluted to obtain a high concentration (approxi-mately 10 000 genome copies) and a low concentra-tion (approximately 100 genome copies) for nucleicacid extraction. Each nucleic acid sample was testedin duplicate by both the Jonstrup and the Phelpsassays.
RESULTS
Phase I
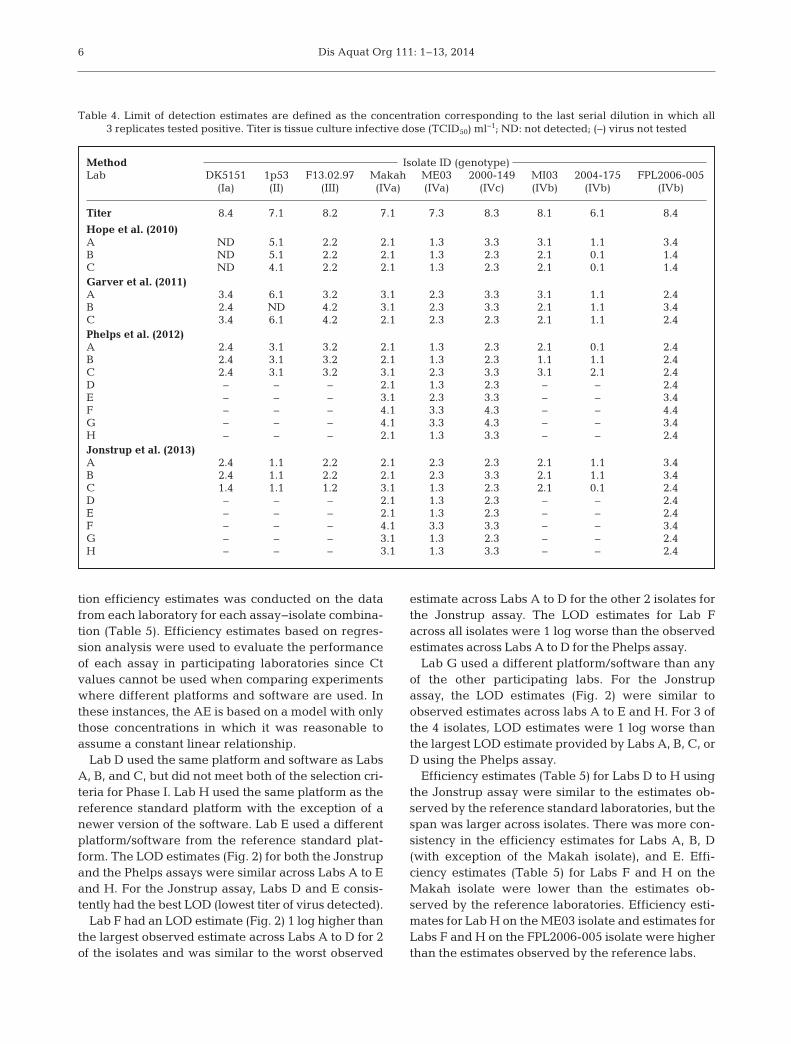
LOD estimates (Table 4) on isolates representativeof VHSV genotypes varied by isolate and assay asexpected given the nucleic acid variation betweengenotypes and different starting concentrations ofthe isolates. There was not a single laboratory thathad the best sensitivity (LOD) across all isolates for
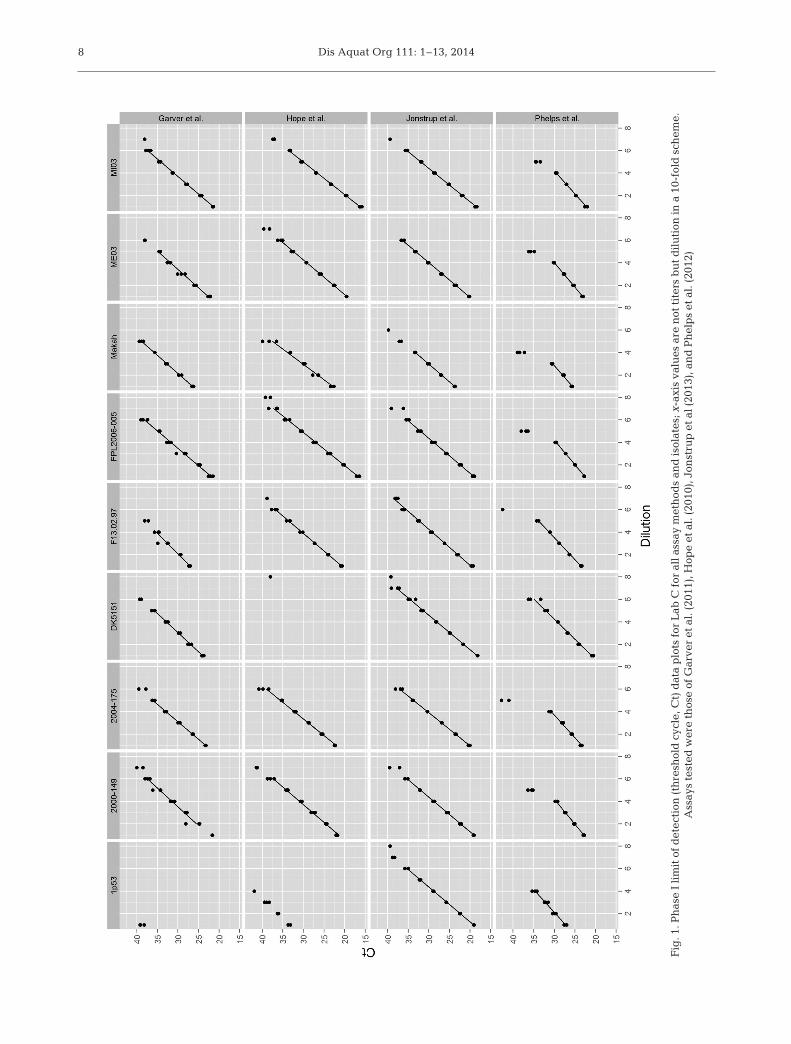
an assay or across assays. The Hopeassay did not detect the genotype I virus(DK5151). Both the Garver and the Hopeassays only detected a high concentra-tion (4−5 logs of virus) of genotype IIvirus (1p53). Regression analysis (Table5) of the data for 3 labs (A, B, and C)revealed similar AE for an assay regard-less of an isolate’s genotype within a labwhen there was a positive detection. Lin-ear re gression analysis on the data set forseveral isolates tested with the Phelpsassay in Lab C did not hold a constantlinear relationship between Ct value anddilution across all concentrations tested(Fig. 1). The Jonstrup assay consistentlydetected low concentrations of all geno-types and had high efficiency estimates(87−97; 92−98; 97−109) in all 3 labs. Plotsof the regression analysis (data notshown) as it relates to the cut-off valuesutilized in all assays suggest that cutoffvalues exceeded the linear relationshipbe tween the Ct value and −log10 dilutionof the virus stock. The Jonstrup and thePhelps assays were chosen for Phase IItesting, as both assays detected all geno-types of VHSV known to date. ThePhelps assay was chosen over the Garver assay, as 1-step assays are technicallymore convenient to perform and havehigher throughput capacity and did abetter job at detecting genotype repre-sentatives used in this study.
Phase II
Analytical sensitivity
Five labs (D, E, F, G, and H) deter-mined LOD for genotype IV isolates only.A regression analysis to obtain amplifica-
5
Strain or species Common name Testinglab(s)
VirusAquareovirus A Chum salmon reovirus GAquareovirus B Green river chinook G
reovirusAquareovirus B Eel lake reovirus GAquareovirus C Golden shiner virus GAquareovirus D American grass G
carp reovirusCyprinid herpesvirus 3 Koi herpesvirus EFathead minnow nidovirus GIctalurid herpesvirus 1 Channel catfish virus GInfectious hematopoietic D, E
necrosis virusInfectious pancreatic D, E, F
necrosis virusLargemouth bass virus D, E, FPicornavirus GSpring viremia carp virus D
BacteriaAeromonas hydrophila E, FAeromonas salmonicida D, FFlavobacterium psychrophilum D, FFlavobacterium columnare FPseudomonas aeruginosa D, EReinbacterium salmoninarum FShewanella putrefaciens E, FStreptococcus uberis EYersinia ruckeri D, F
FishAmeiurus nebulosus Bullhead DCatostomus commersonii White sucker DCyprinus carpio Common carp DEsox masquinongy × Esox lucius Tiger muskellunge hybrid DEtheostoma exile Iowa darter DHybognathus hankinsoni Brassy minnow DLepomis cyanellus Green sunfish DLepomis macrochirus Bluegill DMicropterus dolomieu Smallmouth bass DMorone chrysops White bass DPerca flavescens Yellow perch DPimephales promelas Fathead minnow DPomoxis nigromaculatus Black crappie DSander vitreus Walleye D
Table 3. Diagnostic matrices used to demonstrate analytical specificity
Dis Aquat Org 111: 1–13, 2014
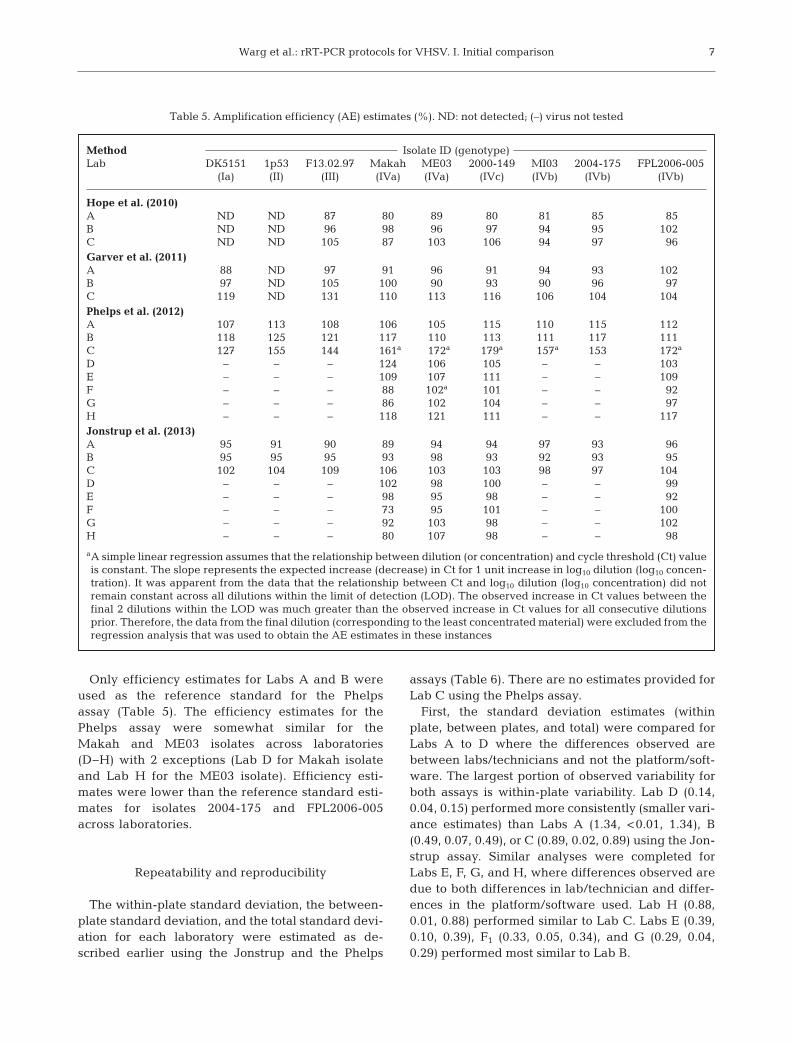
tion efficiency estimates was conducted on the datafrom each laboratory for each assay−isolate combina-tion (Table 5). Efficiency estimates based on regres-sion analysis were used to evaluate the performanceof each assay in participating laboratories since Ctvalues cannot be used when comparing experimentswhere different platforms and software are used. Inthese instances, the AE is based on a model with onlythose concentrations in which it was reasonable toassume a constant linear relationship.
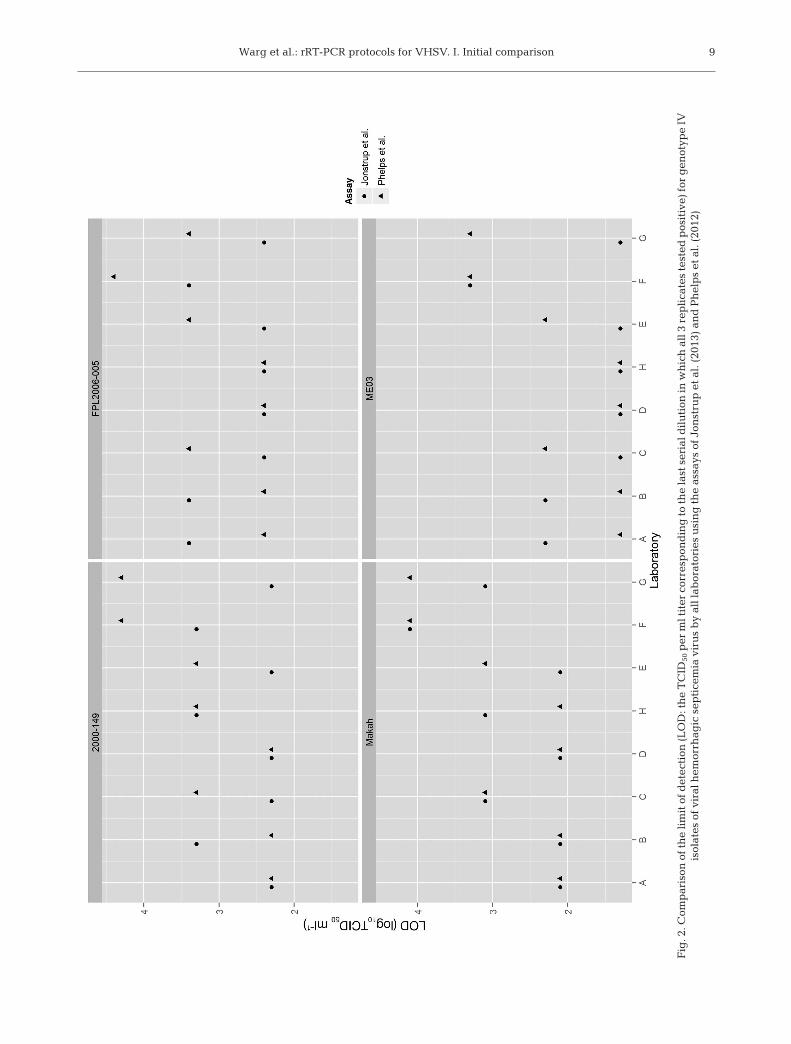
Lab D used the same platform and software as LabsA, B, and C, but did not meet both of the selection cri-teria for Phase I. Lab H used the same platform as thereference standard platform with the exception of anewer version of the software. Lab E used a differentplatform/software from the reference standard plat-form. The LOD estimates (Fig. 2) for both the Jonstrupand the Phelps assays were similar across Labs A to Eand H. For the Jonstrup assay, Labs D and E consis-tently had the best LOD (lowest titer of virus detected).
Lab F had an LOD estimate (Fig. 2) 1 log higher thanthe largest observed estimate across Labs A to D for 2of the isolates and was similar to the worst observed
estimate across Labs A to D for the other 2 isolates forthe Jonstrup assay. The LOD estimates for Lab Facross all isolates were 1 log worse than the observedestimates across Labs A to D for the Phelps assay.
Lab G used a different platform/software than anyof the other participating labs. For the Jonstrupassay, the LOD estimates (Fig. 2) were similar toobserved estimates across labs A to E and H. For 3 ofthe 4 isolates, LOD estimates were 1 log worse thanthe largest LOD estimate provided by Labs A, B, C, orD using the Phelps assay.
Efficiency estimates (Table 5) for Labs D to H usingthe Jonstrup assay were similar to the estimates ob-served by the reference standard laboratories, but thespan was larger across isolates. There was more con-sistency in the efficiency estimates for Labs A, B, D(with exception of the Makah isolate), and E. Effi-ciency estimates (Table 5) for Labs F and H on theMakah isolate were lower than the estimates ob -served by the reference laboratories. Efficiency esti-mates for Lab H on the ME03 isolate and estimates forLabs F and H on the FPL2006-005 isolate were higherthan the estimates observed by the reference labs.
6
Method Isolate ID (genotype)Lab DK5151 1p53 F13.02.97 Makah ME03 2000-149 MI03 2004-175 FPL2006-005
(Ia) (II) (III) (IVa) (IVa) (IVc) (IVb) (IVb) (IVb)
Titer 8.4 7.1 8.2 7.1 7.3 8.3 8.1 6.1 8.4
Hope et al. (2010)A ND 5.1 2.2 2.1 1.3 3.3 3.1 1.1 3.4B ND 5.1 2.2 2.1 1.3 2.3 2.1 0.1 1.4C ND 4.1 2.2 2.1 1.3 2.3 2.1 0.1 1.4Garver et al. (2011)A 3.4 6.1 3.2 3.1 2.3 3.3 3.1 1.1 2.4B 2.4 ND 4.2 3.1 2.3 3.3 2.1 1.1 3.4C 3.4 6.1 4.2 2.1 2.3 2.3 2.1 1.1 2.4Phelps et al. (2012)A 2.4 3.1 3.2 2.1 1.3 2.3 2.1 0.1 2.4B 2.4 3.1 3.2 2.1 1.3 2.3 1.1 1.1 2.4C 2.4 3.1 3.2 3.1 2.3 3.3 3.1 2.1 2.4D – – – 2.1 1.3 2.3 – – 2.4E – – – 3.1 2.3 3.3 – – 3.4F – – – 4.1 3.3 4.3 – – 4.4G – – – 4.1 3.3 4.3 – – 3.4H – – – 2.1 1.3 3.3 – – 2.4Jonstrup et al. (2013)A 2.4 1.1 2.2 2.1 2.3 2.3 2.1 1.1 3.4B 2.4 1.1 2.2 2.1 2.3 3.3 2.1 1.1 3.4C 1.4 1.1 1.2 3.1 1.3 2.3 2.1 0.1 2.4D – – – 2.1 1.3 2.3 – – 2.4E – – – 2.1 1.3 2.3 – – 2.4F – – – 4.1 3.3 3.3 – – 3.4G – – – 3.1 1.3 2.3 – – 2.4H – – – 3.1 1.3 3.3 – – 2.4
Table 4. Limit of detection estimates are defined as the concentration corresponding to the last serial dilution in which all 3 replicates tested positive. Titer is tissue culture infective dose (TCID50) ml−1; ND: not detected; (–) virus not tested
Warg et al.: rRT-PCR protocols for VHSV. I. Initial comparison
Only efficiency estimates for Labs A and B wereused as the reference standard for the Phelpsassay (Table 5). The efficiency estimates for thePhelps assay were somewhat similar for theMakah and ME03 isolates across laboratories(D−H) with 2 ex ceptions (Lab D for Makah isolateand Lab H for the ME03 isolate). Efficiency esti-mates were lower than the reference standard esti-mates for isolates 2004-175 and FPL2006-005across laboratories.
Repeatability and reproducibility
The within-plate standard deviation, the between-plate standard deviation, and the total standard devi-ation for each laboratory were estimated as de -scribed earlier using the Jonstrup and the Phelps
assays (Table 6). There are no estimates provided forLab C using the Phelps assay.
First, the standard deviation estimates (withinplate, between plates, and total) were compared forLabs A to D where the differences observed arebetween labs/technicians and not the platform/soft-ware. The largest portion of observed variability forboth assays is within-plate variability. Lab D (0.14,0.04, 0.15) performed more consistently (smaller vari-ance estimates) than Labs A (1.34, <0.01, 1.34), B(0.49, 0.07, 0.49), or C (0.89, 0.02, 0.89) using the Jon-strup assay. Similar analyses were completed forLabs E, F, G, and H, where differences observed aredue to both differences in lab/technician and differ-ences in the platform/software used. Lab H (0.88,0.01, 0.88) performed similar to Lab C. Labs E (0.39,0.10, 0.39), F1 (0.33, 0.05, 0.34), and G (0.29, 0.04,0.29) performed most similar to Lab B.
7
Method Isolate ID (genotype)Lab DK5151 1p53 F13.02.97 Makah ME03 2000-149 MI03 2004-175 FPL2006-005
(Ia) (II) (III) (IVa) (IVa) (IVc) (IVb) (IVb) (IVb)
Hope et al. (2010)A ND ND 87 80 89 80 81 85 85B ND ND 96 98 96 97 94 95 102C ND ND 105 87 103 106 94 97 96Garver et al. (2011)A 88 ND 97 91 96 91 94 93 102B 97 ND 105 100 90 93 90 96 97C 119 ND 131 110 113 116 106 104 104Phelps et al. (2012)A 107 113 108 106 105 115 110 115 112B 118 125 121 117 110 113 111 117 111C 127 155 144 161a 172a 179a 157a 153 172a
D – – – 124 106 105 – – 103E – – – 109 107 111 – – 109F – – – 88 102a 101 – – 92G – – – 86 102 104 – – 97H – – – 118 121 111 – – 117Jonstrup et al. (2013)A 95 91 90 89 94 94 97 93 96B 95 95 95 93 98 93 92 93 95C 102 104 109 106 103 103 98 97 104D – – – 102 98 100 – – 99E – – – 98 95 98 – – 92F – – – 73 95 101 – – 100G – – – 92 103 98 – – 102H – – – 80 107 98 – – 98
aA simple linear regression assumes that the relationship between dilution (or concentration) and cycle threshold (Ct) valueis constant. The slope represents the expected increase (decrease) in Ct for 1 unit increase in log10 dilution (log10 concen-tration). It was apparent from the data that the relationship between Ct and log10 dilution (log10 concentration) did notremain constant across all dilutions within the limit of detection (LOD). The observed increase in Ct values between thefinal 2 dilutions within the LOD was much greater than the observed increase in Ct values for all consecutive dilutionsprior. Therefore, the data from the final dilution (corresponding to the least concentrated material) were excluded from theregression analysis that was used to obtain the AE estimates in these instances
Table 5. Amplification efficiency (AE) estimates (%). ND: not detected; (–) virus not tested
Dis Aquat Org 111: 1–13, 20148
Fig
. 1. P
has
e I
lim
it o
f d
etec
tion
(th
resh
old
cyc
le, C
t) d
ata
plo
ts f
or L
ab C
for
all
ass
ay m
eth
ods
and
isol
ates
; x-a
xis
valu
es a
re n
ot t
iter
s b
ut
dil
uti
on in
a 1
0-fo
ld s
chem
e.
Ass
ays
test
ed w
ere
thos
e of
Gar
ver
et a
l. (
2011
), H
ope
et a
l. (
2010
), J
onst
rup
et
al (
2013
), a
nd
Ph
elp
s et
al.
(20
12)
Warg et al.: rRT-PCR protocols for VHSV. I. Initial comparison 9
Fig
. 2. C
omp
aris
on o
f th
e li
mit
of d
etec
tion
(LO
D: t
he
TC
ID50
per
ml t
iter
cor
resp
ond
ing
to th
e la
st s
eria
l dil
uti
on in
wh
ich
all
3 r
epli
cate
s te
sted
pos
itiv
e) fo
r g
enot
ype
IV
isol
ates
of
vira
l hem
orrh
agic
sep
tice
mia
vir
us
by
all l
abor
ator
ies
usi
ng
th
e as
says
of
Jon
stru
p e
t al
. (20
13)
and
Ph
elp
s et
al.
(20
12)
Dis Aquat Org 111: 1–13, 2014
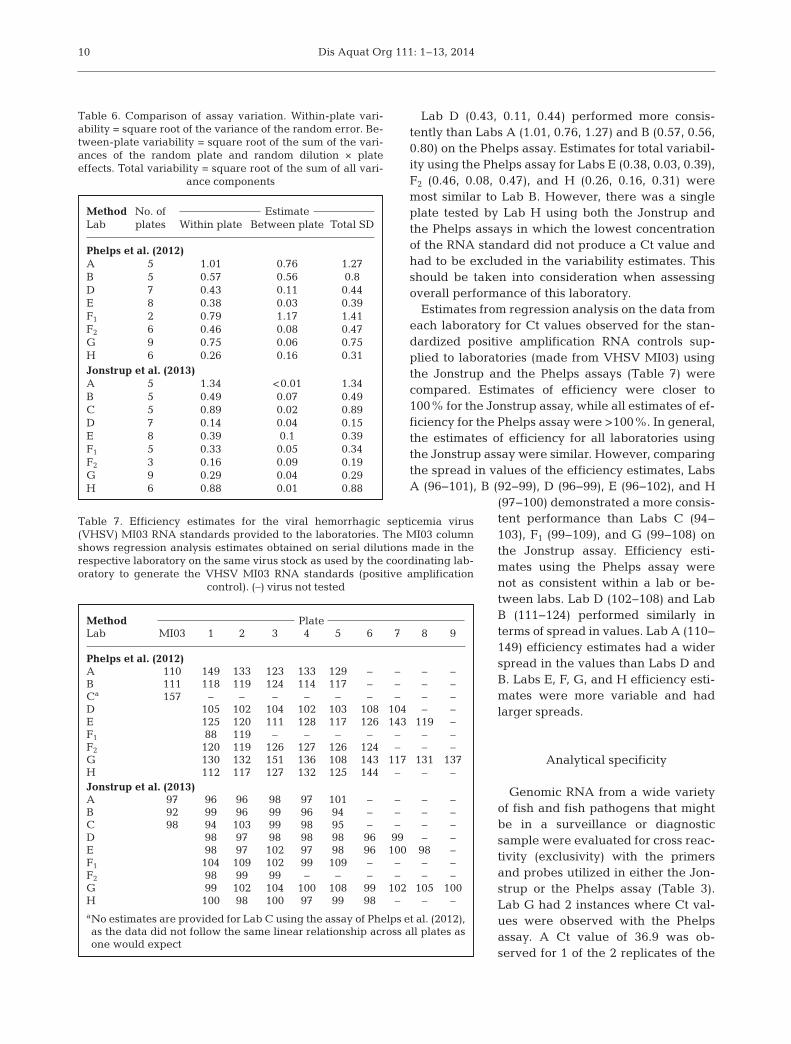
Lab D (0.43, 0.11, 0.44) performed more consis-tently than Labs A (1.01, 0.76, 1.27) and B (0.57, 0.56,0.80) on the Phelps assay. Estimates for total variabil-ity using the Phelps assay for Labs E (0.38, 0.03, 0.39),F2 (0.46, 0.08, 0.47), and H (0.26, 0.16, 0.31) weremost similar to Lab B. However, there was a singleplate tested by Lab H using both the Jonstrup andthe Phelps assays in which the lowest concentrationof the RNA standard did not produce a Ct value andhad to be excluded in the variability estimates. Thisshould be taken into consideration when assessingoverall performance of this laboratory.
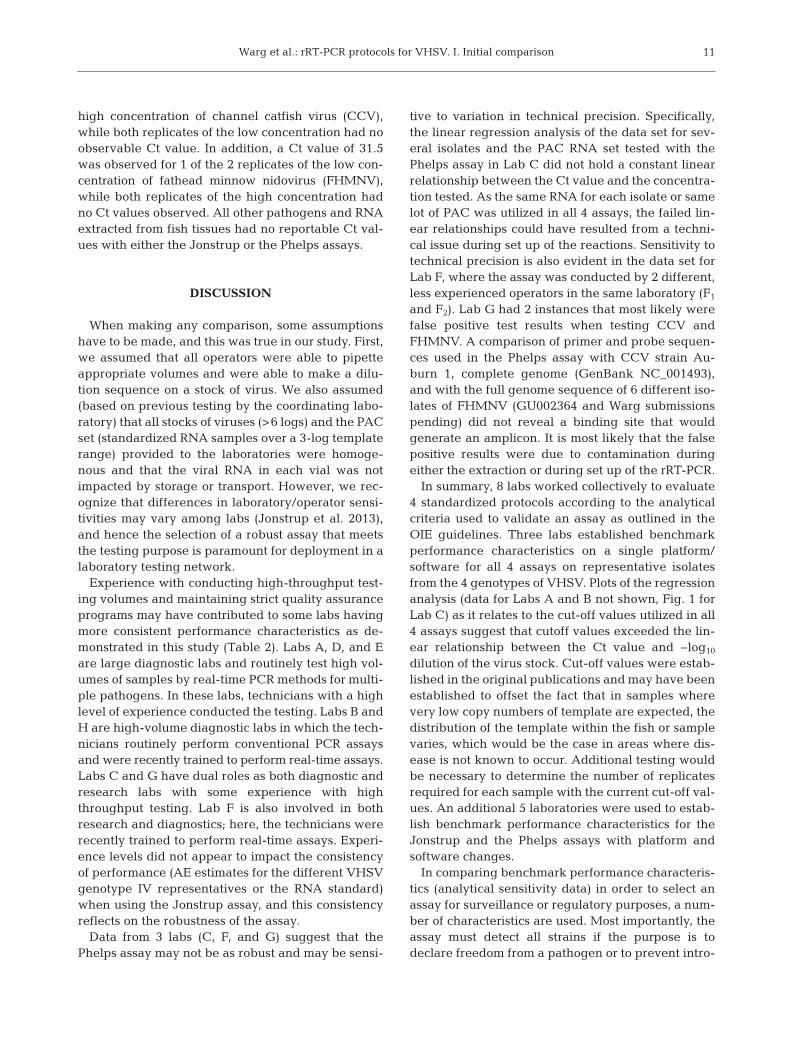
Estimates from regression analysis on the data fromeach laboratory for Ct values observed for the stan-dardized positive amplification RNA controls sup -plied to laboratories (made from VHSV MI03) usingthe Jonstrup and the Phelps assays (Table 7) werecompared. Estimates of efficiency were closer to100% for the Jonstrup assay, while all estimates of ef-ficiency for the Phelps assay were >100%. In general,the estimates of efficiency for all laboratories usingthe Jonstrup assay were similar. However, comparingthe spread in values of the efficiency estimates, LabsA (96−101), B (92−99), D (96−99), E (96−102), and H
(97−100) demonstrated a more consis-tent performance than Labs C (94−103), F1 (99−109), and G (99−108) onthe Jonstrup assay. Efficiency esti-mates using the Phelps assay werenot as consistent within a lab or be-tween labs. Lab D (102−108) and LabB (111−124) performed similarly interms of spread in values. Lab A (110−149) efficiency estimates had a widerspread in the values than Labs D andB. Labs E, F, G, and H efficiency esti-mates were more variable and hadlarger spreads.
Analytical specificity
Genomic RNA from a wide varietyof fish and fish pathogens that mightbe in a surveillance or diagnosticsample were evaluated for cross reac-tivity (exclusivity) with the primersand probes utilized in either the Jon-strup or the Phelps assay (Table 3).Lab G had 2 instances where Ct val-ues were observed with the Phelpsassay. A Ct value of 36.9 was ob -served for 1 of the 2 replicates of the
10
Method No. of EstimateLab plates Within plate Between plate Total SD
Phelps et al. (2012) A 5 1.01 0.76 1.27B 5 0.57 0.56 0.8D 7 0.43 0.11 0.44E 8 0.38 0.03 0.39F1 2 0.79 1.17 1.41F2 6 0.46 0.08 0.47G 9 0.75 0.06 0.75H 6 0.26 0.16 0.31Jonstrup et al. (2013) A 5 1.34 <0.01 1.34B 5 0.49 0.07 0.49C 5 0.89 0.02 0.89D 7 0.14 0.04 0.15E 8 0.39 0.1 0.39F1 5 0.33 0.05 0.34F2 3 0.16 0.09 0.19G 9 0.29 0.04 0.29H 6 0.88 0.01 0.88
Table 6. Comparison of assay variation. Within-plate vari-ability = square root of the variance of the random error. Be-tween-plate variability = square root of the sum of the vari-ances of the random plate and random dilution × plateeffects. Total variability = square root of the sum of all vari-
ance components
Method PlateLab MI03 1 2 3 4 5 6 7 8 9
Phelps et al. (2012)A 110 149 133 123 133 129 – – – –B 111 118 119 124 114 117 – – – –Ca 157 – – – – – – – – –D 105 102 104 102 103 108 104 – –E 125 120 111 128 117 126 143 119 –F1 88 119 – – – – – – –F2 120 119 126 127 126 124 – – –G 130 132 151 136 108 143 117 131 137H 112 117 127 132 125 144 – – –Jonstrup et al. (2013)A 97 96 96 98 97 101 – – – –B 92 99 96 99 96 94 – – – –C 98 94 103 99 98 95 – – – –D 98 97 98 98 98 96 99 – –E 98 97 102 97 98 96 100 98 –F1 104 109 102 99 109 – – – –F2 98 99 99 – – – – – –G 99 102 104 100 108 99 102 105 100H 100 98 100 97 99 98 – – –aNo estimates are provided for Lab C using the assay of Phelps et al. (2012),as the data did not follow the same linear relationship across all plates asone would expect
Table 7. Efficiency estimates for the viral hemorrhagic septicemia virus(VHSV) MI03 RNA standards provided to the laboratories. The MI03 columnshows regression analysis estimates obtained on serial dilutions made in therespective laboratory on the same virus stock as used by the coordinating lab-oratory to generate the VHSV MI03 RNA standards (positive amplification
control). (–) virus not tested
Warg et al.: rRT-PCR protocols for VHSV. I. Initial comparison
high concentration of channel catfish virus (CCV),while both replicates of the low concentration had noobservable Ct value. In addition, a Ct value of 31.5was observed for 1 of the 2 replicates of the low con-centration of fathead minnow nidovirus (FHMNV),while both replicates of the high concentration hadno Ct values observed. All other pathogens and RNAextracted from fish tissues had no reportable Ct val-ues with either the Jonstrup or the Phelps assays.
DISCUSSION
When making any comparison, some assumptionshave to be made, and this was true in our study. First,we assumed that all operators were able to pipetteappropriate volumes and were able to make a dilu-tion sequence on a stock of virus. We also assumed(based on previous testing by the coordinating labo-ratory) that all stocks of viruses (>6 logs) and the PACset (standardized RNA samples over a 3-log templaterange) provided to the laboratories were homoge-nous and that the viral RNA in each vial was notimpacted by storage or transport. However, we rec-ognize that differences in laboratory/operator sensi-tivities may vary among labs (Jonstrup et al. 2013),and hence the selection of a robust assay that meetsthe testing purpose is paramount for deployment in alaboratory testing network.
Experience with conducting high-throughput test-ing volumes and maintaining strict quality assuranceprograms may have contributed to some labs havingmore consistent performance characteristics as de -monstrated in this study (Table 2). Labs A, D, and Eare large diagnostic labs and routinely test high vol-umes of samples by real-time PCR methods for multi-ple pathogens. In these labs, technicians with a highlevel of experience conducted the testing. Labs B andH are high-volume diagnostic labs in which the tech-nicians routinely perform conventional PCR assaysand were recently trained to perform real-time assays.Labs C and G have dual roles as both diagnostic andresearch labs with some experience with highthroughput testing. Lab F is also involved in bothresearch and diagnostics; here, the technicians wererecently trained to perform real-time assays. Experi-ence levels did not appear to impact the consistencyof performance (AE estimates for the different VHSVgenotype IV representatives or the RNA standard)when using the Jonstrup assay, and this consistencyreflects on the robustness of the assay.
Data from 3 labs (C, F, and G) suggest that thePhelps assay may not be as robust and may be sensi-
tive to variation in technical precision. Specifically,the linear regression analysis of the data set for sev-eral isolates and the PAC RNA set tested with thePhelps assay in Lab C did not hold a constant linearrelationship between the Ct value and the concentra-tion tested. As the same RNA for each isolate or samelot of PAC was utilized in all 4 assays, the failed lin-ear relationships could have resulted from a techni-cal issue during set up of the re actions. Sensitivity totechnical precision is also evident in the data set forLab F, where the assay was conducted by 2 different,less ex perienced operators in the same laboratory (F1
and F2). Lab G had 2 instances that most likely werefalse positive test results when testing CCV andFHMNV. A comparison of primer and probe se quen -ces used in the Phelps assay with CCV strain Au -burn 1, complete genome (GenBank NC_001493),and with the full ge nome sequence of 6 different iso-lates of FHMNV (GU002364 and Warg submissionspending) did not reveal a binding site that wouldgenerate an amplicon. It is most likely that the falsepositive results were due to contamination duringeither the extraction or during set up of the rRT-PCR.
In summary, 8 labs worked collectively to evaluate4 standardized protocols according to the analyticalcriteria used to validate an assay as outlined in theOIE guidelines. Three labs established benchmarkperfor mance characteristics on a single platform/software for all 4 assays on representative isolatesfrom the 4 genotypes of VHSV. Plots of the regressionanalysis (data for Labs A and B not shown, Fig. 1 forLab C) as it relates to the cut-off values utilized in all4 assays suggest that cutoff values exceeded the lin-ear relationship between the Ct value and −log10
dilution of the virus stock. Cut-off values were estab-lished in the original publications and may have beenestablished to offset the fact that in samples wherevery low copy numbers of template are expected, thedistribution of the template within the fish or samplevaries, which would be the case in areas where dis-ease is not known to occur. Additional testing wouldbe necessary to determine the number of replicatesrequired for each sample with the current cut-off val-ues. An additional 5 laboratories were used to estab-lish benchmark performance characteristics for theJonstrup and the Phelps assays with platform andsoftware changes.
In comparing benchmark performance characteris-tics (analytical sensitivity data) in order to select anassay for surveillance or regulatory purposes, a num-ber of characteristics are used. Most importantly, theassay must detect all strains if the purpose is todeclare freedom from a pathogen or to prevent intro-
11
Dis Aquat Org 111: 1–13, 2014
duction of a pathogen. Second, serial dilutions of ref-erence isolates and inclusion of an RNA standard setprovide limit of detection, dyna mic range of theassay, and amplification efficiency estimates, all ofwhich help predict the performance of the assay ondiagnostic samples within a testing laboratory. Giventhe precious and limited amount of well character-ized diagnostic samples available, it is ideal to deter-mine these characteristics on isolates first.
Analytical performance measures were used col-lectively to formulate recommendations on the suit-ability of each of these assays for surveillance anddiagnostic purposes pending further evaluation ofeach assay’s diagnostic performance for its intendedpurpose. Clearly the Hope assay is not suitable forsurveillance or diagnostic purposes when attemptingto detect all genotypes, as it is not likely that thisassay will detect VHSV genotypes I and II and wasnot considered further. However, this assay hasclearly demonstrated to be a useful tool for surveil-lance of VHSV IVb in the Great Lakes (Bain et al.2010, Cornwell et al. 2011, 2012). Phase I data estab-lished that while the Garver assay had efficiencyestimates closer to 100% than the Phelps assay, thePhelps assay performed better in detecting all geno-type representatives. The 2-step approach utilized inthe Garver assay is generally more suited for diag-nostic purposes on a limited number of samples orwhen sample size is an issue. One-step assays doprovide an advantage when surveying large num-bers of fish, as they are technically easier to perform,have fewer manipulations, and turnaround time isreduced. The Jonstrup and the Phelps assays areboth 1-step assays and would be better suited forlarge-scale targeted surveillance efforts when test-ing is conducted in labs with high quality manage-ment and work practice systems and were chosen forfurther study (Warg et al. 2014, this volume).
The data in this study clearly demonstrate that theJonstrup assay is the most robust of all 4 assays com-pared. This assay has a broader range of detectionthan the Phelps assay, and analytical performancecharacteristics across all platforms, software, andlaboratories would predict the ability to detect weakpositives better, and hence be more sensitive by thismeasure.
Acknowledgements. We thank Kyle Garver of Fisheries &Oceans Canada, Pacific Biological Station, and Søren Jon-strup of the Section for Fish Diseases, National VeterinaryInstitute (Denmark), for sharing their testing protocols priorto publication; Elizabeth Brown and Julie Nelson of the Ani-mal Disease Research and Diagnostic Laboratory, SouthDakota State University; Gavin Glenney of the Lamar Fish
Health Center, US Fish and Wildlife Service; Mary Lea Kil-lian of the Diagnostic Virology Laboratory, National Veteri-nary Services Laboratories; and Gael Kurath of the USGSWestern Fisheries Research Center for helpful discussions.This work was funded by the USDA. Any use of trade, firm,or product names is for descriptive purposes only and doesnot imply endorsement by the US Government.
LITERATURE CITED
AFS-FHS (American Fisheries Society-Fish Health Section)(2010) Fish Health Section Blue Book: suggested proce-dures for the detection and identification of certain fin-fish and shellfish pathogens, 2010 edn. American Fish-eries Society-Fish Health Section, Bethesda, MD
Bain MB, Cornwell ER, Hope KM, Eckerlin GE and others(2010) Distribution of an invasive aquatic pathogen (viralhemorrhagic septicemia virus) in the Great Lakes and itsrelationship to shipping. PLoS ONE 5: e10156
Chico V, Gomez N, Estepa A, Perez L (2006) Rapid detectionand quantitation of viral hemorrhagic septicemia virus inexperimentally challenged rainbow trout by real-timeRT-PCR. J Virol Methods 132: 154−159
Cornwell ER, Eckerlin GE, Getchell RG, Groocock GH andothers (2011) Detection of viral hemorrhagic septicemiavirus by quantitative reverse transcription polymerasechain reaction from two fish species at two sites in LakeSuperior. J Aquat Anim Health 23: 207−217
Cornwell ER, Eckerlin GE, Thompson TM, Batts WN andothers (2012) Predictive factors and viral genetic diver-sity for viral hemorrhagic septicemia virus infection inLake Ontario and the St. Lawrence River. J Gt Lakes Res38: 278−288
Cutrín JM, Olveira JG, Bandín I, Dopazo CP (2009) Valida-tion of real time RT-PCR applied to cell culture for diag-nosis of any known genotype of viral haemorrhagic sep-ticaemia virus. J Virol Methods 162: 155−162
Elsayed E, Faisal M, Thomas M, Whelan G, Batts W, WintonJ (2006) Isolation of viral haemorrhagic septicaemia virusfrom muskellunge, Esox masquinongy (Mitchill), in LakeSt Clair, Michigan, USA reveals a new sublineage of theNorth American genotype. J Fish Dis 29: 611−619
Faisal M, Shavalier M, Kim RK, Millard EV and others (2012)Spread of the emerging viral hemorrhagic septicemiavirus strain, genotype IVb, in Michigan, USA. Viruses 4: 734−760
Finney DJ (1978) Statistical methods in biological assays,3rd edn. Griffin, London
Gagné N, Mackinnon AM, Boston L, Souter B, Cook-Ver-sloot M, Griffiths S, Olivier G (2007) Isolation of viralhaemorrhagic septicaemia virus from mummichog,stickleback, striped bass and brown trout in eastern Can-ada. J Fish Dis 30: 213−223
Garver KA, Hawley LM, McClure CA, Schroeder T and others (2011) Development and validation of a reversetranscription quantitative PCR for universal detection ofviral hemorrhagic septicemia virus. Dis Aquat Org 95: 97−112
Groocock GH, Getchell RG, Wooster GA, Britt KL and others(2007) Detection of viral hemorrhagic septicemia inround gobies in New York State (USA) waters of LakeOntario and the St. Lawrence River. Dis Aquat Org 76: 187−192
Groocock GH, Frattini SA, Cornwell ER, Coffee LL, Wooster
12
Warg et al.: rRT-PCR protocols for VHSV. I. Initial comparison 13
GA, Getchell RG, Bowser PR (2012) Experimental infec-tion of four aquacultured species with viral hemorrhagicsepticemia virus Type IVb. J World Aquacult Soc 43: 459−476
Hershberger PK, Gregg JL, Grady CA, Taylor L, Winton JR(2010) Chronic and persistent viral hemorrhagic sep-ticemia virus infections in Pacific herring. Dis Aquat Org93: 43−49
Hope KM, Casey RN, Groocock GH, Getchell RG, BowserPR, Casey JW (2010) Comparison of quantitative RT-PCRwith cell culture to detect viral hemorrhagic septicemiavirus (VHSV) IVb infections in the Great Lakes. J AquatAnim Health 22: 50−61
Jonstrup SP, Kahns S, Skall HF, Boutrup TS, Olesen NJ(2013) Development and validation of a novel Taqman-based real-time RT-PCR assay suitable for demonstratingfreedom from viral haemorrhagic septicaemia virus.J Fish Dis 36: 9−23
Kim R, Faisal M (2010a) Comparative susceptibility of repre-sentative Great Lakes fish species to the North Americanviral hemorrhagic septicemia virus Sublineage IVb. DisAquat Org 91: 23−34
Kim RK, Faisal M (2010b) The Laurentian Great Lakes strain(MI03) of the viral haemorrhagic septicaemia virus ishighly pathogenic for juvenile muskellunge, Esox mas -quinongy (Mitchill). J Fish Dis 33: 513−527
Kim R, Faisal M (2010c) Experimental studies confirm thewide host range of the Great Lakes viral haemorrhagicsepticaemia virus genotype IVb. J Fish Dis 33: 83−88
Kim RK, Faisal M (2012) Shedding of viral hemorrhagic septicemia virus (Genotype IVb) by experimentally in -fected muskellunge (Esox masquinongy). J Microbiol 50: 278−284
Liu Z, Teng Y, Liu H, Jiang Y and others (2008) Simultane-ous detection of three fish rhabdoviruses using multiplexreal-time quantitative RT-PCR assay. J Virol Methods149: 103−109
Lumsden JS, Morrison B, Yason C, Russell S and others(2007) Mortality event in freshwater drum Aplodinotusgrunniens from Lake Ontario, Canada, associated withviral haemorrhagic septicemia virus, Type IV. Dis AquatOrg 76: 99−111
Matejusova I, McKay P, McBeath AJA, Collet B, Snow M(2008) Development of a sensitive and controlled real-time RT-PCR assay for viral haemorrhagic septicaemia
virus (VHSV) in marine salmonid aquaculture. Dis AquatOrg 80: 137−144
Matejusova I, McKay P, Bland F, Snow M (2010) Applicationof a sensitive, specific and controlled real-time PCRassay to surveillance indicates a low prevalence of viralhaemorrhagic septicaemia virus (VHSV) in wild herring,Clupea harengus L., in Scottish waters. J Fish Dis 33: 841−847
OIE (World Organization for Animal Health) (2012) Manualof diagnostic tests for aquatic animals. OIE, Paris
Phelps NB, Patnayak DP, Jiang Y, Goyal SM (2012) The useof a one-step real-time reverse transcription polymerasechain reaction (rRT-PCR) for the surveillance of viralhemorrhagic septicemia virus (VHSV) in Minnesota.J Aquat Anim Health 24: 238−243
Pierce LR, Willey JC, Crawford EL, Palsule VV and others(2013a) A new StaRT-PCR approach to detect and quan-tify fish viral hemorrhagic septicemia virus (VHSv): enhanced quality control with internal standards. J VirolMethods 189: 129−142
Pierce LR, Willey JC, Palsule VV, Yeo J, Shepherd BS,Crawford EL, Stepien CA (2013b) Accurate detectionand quantification of the fish viral hemorrhagic sep-ticemia virus (VHSv) with a two-color fluorometric real-time PCR assay. PLoS ONE 8: e71851
Shah R, Luo E, Fung CL (2009) A high-throughput workflowfor the extraction of aquaculture pathogen DNA/RNAfrom aquatic tissues. American Association of VeterinaryLaboratory Diagnosticians, 52nd Annual Conference,San Diego, CA, p 146
Smail DA, Snow M (2011) Viral haemorrhagic septicaemia.In: Woo PTK, Bruno DW (eds) Fish diseases and dis orders,Book 3. CAB International, Wallingford, p 110–142
Tordo N, Benmansour A, Calisher C, Dietzgen RG and others (2005) Family Rhabdoviridae. In: Fauquet CM (ed)Virus taxonomy. Eighth Report of the International Com-mittee on Taxonomy of Viruses. Elsevier AcademicPress, San Diego, CA, p 623–644
Vardeman SB, Jobe JM (1999) Statistical quality assurancemethods for engineers. John Wiley & Sons, New York,NY
Warg JV, Clement T, Cornwell ER, Cruz A and others (2014)Detection and surveillance of viral hemorrhagic sep-ticemia virus using real-time RT-PCR. II. Diagnostic eval-uation of two protocols. Dis Aquat Org 111: 000–000
Editorial responsibility: Mark Crane, Geelong, Victoria, Australia
Submitted: July 22, 2013; Accepted: April 16, 2014Proofs received from author(s): July 31, 2014