a decade of austerity in wales - the nuffield trust · a decade of austerity in wales? research...
TRANSCRIPT

A decade of austerity in Wales?
Research reportAdam Roberts and Anita Charlesworth
June 2014
The funding pressures facing the NHS in Wales to 2025/26

About this reportHealth and social care services across the United Kingdom are facing a huge financial challenge over the next decade – the question is whether they can respond by delivering more efficient and effective care and, if so, how best to make this happen. A Nuffield Trust work programme is examining the scale of the longer-term financial challenge and how it can be met.
This report, A Decade of Austerity in Wales?, replicates previous Nuffield Trust modelling to calculate the shortfall facing the NHS in England, to study the period up to 2025/26. It explores the reasons for rising pressures on the NHS in Wales, finding that the ageing population, rising hospital admissions for people with chronic disease, and increases in the cost of providing health care, mean that pressures on the Welsh NHS are set to grow.
This is an independent report, which has been commissioned by the Welsh Government.
AcknowledgementsWe are grateful for the advice and assistance of Andy McKeon, Gwyn Bevan, Carl Emmerson and members of the advisory group for their guidance while producing this report. We would like to thank members of the Welsh Government for the efficiency with which the data were made available, and their willingness to respond to queries. Finally, we would like to thank Wales Public Services 2025 for facilitating the origination of this project.
Find out more online at: www.nuffieldtrust.org.uk/publications/decade-austerity-wales

Contents
List of figures and tables 2
Executive summary 4
Key findings 5
1. Introduction 7
2. Methods 10
Step 1: Analysing current activity 11
Step 2: Projections 14
Step 3: Costs 14
Step 4: NHS spending 15
3. The financial challenge to 2025/26 16
Acute services 17
Prescribing 21
General Medical Services 22
4. The financial challenge to 2015/16 24
The potential funding gap in 2015/16 24
Closing the NHS funding gap in 2015/16 25
5. The financial challenge between 2016/17 and 2025/26 31
Potential savings between 2015/16 and 2025/26 32
6. Discussion 34
Regional variations across Wales 34
Input cost savings 37
Efficiency improvement in the Welsh NHS 40
References 43

2
List of figures and tables
FiguresFigure 1.1: Total spending on the NHS in Wales between 1992/93 and 2012/13, in 2013/14 prices 8
Figure 2.1: The steps used to project funding pressures 10
Figure 2.2: Breakdown of spending on NHS services in Wales in 2011/12 11
Figure 2.3: Proportion of outpatient appointments for Welsh residents that occurred in England in 2010/11, by health board 12
Figure 3.1: Projection of NHS spending pressures to 2025/26, in 2013/14 prices 16
Figure 3.2: Average annual hospital cost in 2011/12, by age and sex, excluding maternity 17
Figure 3.3: Projected 2025 population of Wales, by age and sex, compared with the 2012 population 18
Figure 3.4: Total cost of inpatient admissions in Wales related to chronic conditions in 2011/12, in 2013/14 prices 19
Figure 3.5: Proportion of the Welsh population aged 50 and over receiving inpatient care for diabetes and no other chronic condition between 2001/02 and 2012/13, by age and sex 20
Figure 3.6: Impact of projected total spend on acute services due to population, chronic conditions and staff pay, in 2013/14 prices 21
Figure 3.7: Trend in prescribing items per head of population in Wales for the ten British National Formulary chapters with the highest rates in 2012, 2002 to 2012 22
Figure 3.8: Annual number of consultations with a GP or practice nurse in Wales for people aged 16 and over, by sex, between 2004/05 and 2011/12, with projected number up to 2025/26 23
Figure 4.1: The projected funding gap in 2015/16 in real terms 25
Figure 4.2: Long-term trend in NHS pay compared with current pay settlement, in 2013/14 prices 26
Figure 4.3: Average cost of prescription items in Wales between 2002 and 2012, in 2013/14 prices 29
Figure 4.4: The cumulative effect of projected savings on the funding gap in 2015/16, in 2013/14 prices 30

3 A decade of austerity in Wales? The funding pressures facing the NHS in Wales to 2025/26
Figure 5.1: The funding gap in 2025/26 following savings made by 2015/16 32
Figure 5.2: Potential for additional savings beyond 2015/16 33
Figure 6.1: Projected increase in NHS spending need, by health board from the base year of 2010/11 to 2025/26 35
Figure 6.2: Projected increase in total population between 2010/11 and 2025/26, by local health board 36
Figure 6.3: Projected increase in population aged 65+ between 2010/11 and 2025/26, by local health board 37
Figure 6.4: Net ingredient cost per item prescribed in the UK between 2003/04 and 2011/12 39
Figure 6.5: Sources of potential NHS productivity gains and savings in the English NHS to 2021/22 41
TablesTable 4.1: NHS Wales current spending between 2010/11 and 2012/13, and forecast to 2015/16 24
Table 4.2: Change in observed average real-terms annual earnings for Welsh NHS staff (earnings per full-time equivalent for clinical and non-clinical staff), June 2010 to June 2013 26
Table 4.3: Observed changes in activity rates since 2010/11 28
Table 6.1: OBR forecast for UK whole economy average earnings growth, 2015 to 2018 38

4 A decade of austerity in Wales? The funding pressures facing the NHS in Wales to 2025/26
Since the introduction of the NHS in the UK in 1948, funding has risen by an average of 4% a year in real terms. Funding for the NHS in Wales increased in real terms in each year between 1992/93 and 2010/11 by an average of 4.7% a year. But, in response to the economic downturn and fiscal consolidation, this trend has now ceased. Instead, funding for the NHS in Wales fell by an average of 2.5% a year in real terms between 2010/11 and 2012/13. Following an increase in 2013/14, funding is likely to continue to fall until 2015/16, when the total budget for the Welsh NHS is projected to be 3.6% lower in real terms than it was in 2010/11.
While funding for the Welsh NHS is being reduced in real terms, the demand pressures on services continue to rise. These pressures come from a growing and ageing population, and rising unit costs largely due to wage pressures.
The NHS in Wales, which has become accustomed to increases in real-terms funding to meet demand pressures, must now meet the rising pressures of the population with a reduced budget. To ensure that the decisions made around providing a high-quality service with a reduced budget are well informed, it is vital to understand the extent to which the demand for NHS services is likely to rise.
For this report we explored the recent trends in acute, maternity, community prescribing and general practice consultations in the period before the austerity measures began in 2010/11. Using these, we created a combined projection for the spending pressures facing the Welsh NHS up to 2025/26.
The funding that will be made available to the Welsh Government up to 2015/16 is laid out in the 2010 spending review and the 2013 spending round. The funding available for Welsh NHS was then determined by the Welsh Government in their budget setting process. We therefore explored the projected funding gap over this period. We then looked at the types of efficiencies that have occurred in the two years since 2010/11 for which we have data, and estimated the impact on this gap of continuing this rate of efficiency improvement up to 2015/16.
The funding that will be available during the period 2016/17 to 2025/26 is currently unknown. We therefore explored three scenarios for the potential level of funding that might be available beyond 2015/16. These scenarios are:
• a continuation of real-terms cuts represented by holding the funding flat in cash terms
• a steady state represented by holding funding flat in real terms
• a real-terms increase by assuming that funding for the Welsh NHS maintains its share of UK gross domestic product.
In each case we explored the additional level of efficiency growth that would be required beyond 2015/16 to meet the projections for NHS services.
The results of these scenarios will help in understanding the extent of the financial challenge facing the NHS in Wales in light of the continued austerity, demand pressures and political decisions made in the next decade.
Executive summary

5 A decade of austerity in Wales? The funding pressures facing the NHS in Wales to 2025/26
Key findings We estimate that there will be a funding gap of £2.5 billion for the NHS in Wales by 2025/26, in 2013/14 prices, assuming that the current rate of efficiency savings is maintained until 2015/16, and that funding is held flat in real terms between 2015/16 and 2025/26. This would require further efficiency savings worth 3.7% a year in real terms after 2015/16.
If the funding available for the NHS in Wales beyond 2015/16 rises at the same rate as that which is projected for UK national income, the funding gap in 2025/26 would be reduced to £1.1 billion. However, if the funding available is held flat in cash terms, that gap could be as large as £3.6 billion in real terms.
Acute servicesThere are three main drivers of spending pressures on acute services:
• Population: The population of Wales is predicted to grow by 5% between 2012 and 2025. However, the age profile will become much older, with the number of people aged 65 and over growing by 26% over this period; compared with a growth of 1% for people aged under 65.
• Chronic conditions: Between 2001/02 and 2010/11, the number of people admitted to hospital with a chronic condition in Wales rose from 105,000 people to 142,000 people.
• Staff pay: Pay for hospital and community health service staff in the UK (including doctors, nurses, support staff and managers) rose by an average of around 2% a year in real terms over the 35 years to 2009/10.
Assuming these trends in population, hospital admissions and pay continue, and non-pay costs rise in line with inflation, spending pressures on acute services would rise by an average of 3.4% a year in real terms between 2010/11 and 2025/26.
Non-acute servicesThe rate of prescription items dispensed in the community in Wales rose by an average of 4.0% a year between 2002 and 2010. If recent drug type specific trends in items dispensed per population continue, spending on community prescribing would rise by an average of 3.2% a year in real terms to 2025/26, assuming that the unit costs remain at the 2011/12 level.
Between 2004 and 2010, the total number of general practitioner (GP) consultations for people aged 16 and over rose from 12.8 million to 14.0 million. The number of practice nurse consultations rose from 6.6 million to 7.5 million. However, the upward trend in the number of appointments per person a year was fairly flat for most age groups, showing that most of this increase was due to population growth and ageing.
Assuming the trends in consultations per person a year continue alongside the assumptions of population growth, by 2025/26 there would be 16.5 million appointments with a GP and 11.7 million with a practice nurse for people aged 16 and over.
Spending pressures and potential savings between 2010/11 and 2015/16Funding for the NHS in Wales fell in real terms in both 2011/12 and 2012/13. Following an increase in 2013/14, funding is budgeted to continue to fall in real terms until 2015/16. As a result, the budget for NHS services in Wales will be 3.6% lower in 2015/16 than in 2010/11, in real terms.

6 A decade of austerity in Wales? The funding pressures facing the NHS in Wales to 2025/26
The falling value of the budget for the NHS in Wales means that the projection for spending pressures would lead to a potential funding gap in 2015/16 of £1.2 billion in 2013/14 prices, requiring efficiency savings of 3.9% a year in real terms.
Average annual earning for NHS staff in Wales fell by 0.1% and 0.6% in real terms in 2011 and 2013, respectively, but rose by 0.6% in 2012. This means that annual earnings for staff in the Welsh NHS were 0.1% lower in real terms in 2013 than they were in 2010.
Between 2010/11 and 2012/13, the NHS in Wales saw a reduction in the number of emergency inpatient spells per population (1.3% a year) and the related length of stay (4.5% a year). There was also a decrease in the average length of stay for elective admissions (0.6% a year), but an increase in the number of elective admissions per person (1.1% a year). The number of outpatient appointments per population fell by an average of 2.2% a year.
There was a rising trend in the age- and sex-specific probability of receiving inpatient care related to a chronic condition for people aged 50 and over in Wales between 2001/02 and 2010/11. However, in 2011/12 and 2012/13, there was a fall in this trend such that the rate seems to have stabilised.
Between 2002 and 2012, the average unit cost of a prescription fell by an average of 5.4% a year in real terms. This trend will not continue indefinitely as the big wave of patent expiries for high-volume drugs such as statins comes to an end. However, we have explored the possibility of the unit costs continuing to fall at half the recent trend between 2010/11 and 2015/16.
Continuation of these trends in NHS salaries, inpatient spells and prescriptions would reduce the funding gap in 2015/16 to £221 million, in 2013/14 prices.
The remaining funding gap in 2025/26We have explored three potential scenarios for the level of NHS funding that might be available in the period from 2016/17 to 2025/26, to show the remaining potential funding gap in each case.
In scenario one we assume that funding for the Welsh NHS is held flat in cash terms from 2015/16. This would equate to a cut in funding in real terms of 1.9% a year, as costs continue to rise with inflation. In this case, there would be an estimated funding gap in 2025/26 of £3.6 billion at 2013/14 prices, requiring real-terms efficiency savings worth 5.8% a year, in addition to the savings made up to 2015/16.
In scenario two we assume that funding is held flat in real terms. In this case the projected funding gap in 2025/26 would be an estimated £2.5 billion, requiring additional real-terms efficiency savings of 3.7% a year.
In scenario three we assume that spending on the NHS in Wales maintains its share of the UK national income beyond 2015/16, based on the Office for Budget Responsibility forecast of 2.2% a year in real terms. The funding gap in 2025/26 would be an estimated £1.1 billion in 2013/14 prices, requiring additional efficiency savings of 1.5% a year in real terms.
This funding gap could be reduced by £0.9 billion through a combination of releasing additional cash savings from acute sector efficiencies, and continuation of the management of inpatient admissions with chronic conditions. But additional savings would be required beyond this in each of the three funding scenarios.

7 A decade of austerity in Wales? The funding pressures facing the NHS in Wales to 2025/26
Funding for the NHS in the UK has risen by an average of 4% a year in real terms since its introduction in 1948 (Crawford and Emmerson, 2012). As a result, the share of UK national income accounted for by the NHS has more than doubled from 3.5% in 1949/50 to 7.9% in 2007/08.1 This is not unusual; it is internationally recognised that as a country becomes richer, it tends to spend an increasing proportion of its gross domestic product (GDP) on health (Carrin and others, 2009). In 2011, total spending on health care in the UK, including public and private spending, as a proportion of GDP, was 9.4%; this is very close to the Organisation for Economic Co-operation and Development (OECD) average of 9.3% (OECD, 2013).
The level of NHS funding in the UK is the product of a series of decisions taken by the UK government and the devolved administrations. Control of the NHS was devolved to the respective governments of Wales and Scotland in July 1999, and of Northern Ireland in December of the same year. Before this, the Welsh NHS was under the remit of the Secretary of State for Wales.
Changes in the funding available for devolved public services in Wales, Scotland and Northern Ireland are determined by the Barnett formula. The Barnett formula is based on the change in planned spending for English public services, the comparability percentage (the proportion of public service spending that falls within the devolved budget) and the change in population in each country (HM Treasury, 2010a). Wales received £13.3 billion in 2010/11 for the public services within its control (HM Treasury, 2010b); worth approximately £4,360 per head.
Although changes in the level of funding for public services in Wales are linked to the specific changes in public spending in England, it is the responsibility of the Welsh Assembly to determine how to distribute the money among services in Wales.
Funding for the NHS in Wales increased in real terms in each year between 1992/93 to 2010/11 by an average of 4.7% a year (Figure 1.1). The average annual increase accelerated after 2001, growing by an average of 5.3% a year in real terms between 2001/02 and 2010/11. This meant that the average spend per head grew from £1,389 to £2,110 in 2013/14 prices.
In response to the economic downturn and fiscal consolidation, this trend has now ceased. Instead, funding for the NHS in Wales fell by an average of 2.5% a year in real terms between 2010/11 and 2012/13, causing the average spend per head to fall to £1,988 in 2013/14 prices. Most of this reduction is due to a fall in spending on capital during this time; the value of resource spending specifically on NHS services fell by 1.1% in real terms.
In October 2013, the Welsh Finance Minister Jane Hutt AM announced an additional £150 million for the Local Health Boards in Wales in 2013/14 to “avoid a scandal such as the one in Stafford Hospital” (BBC, 2013). This resulted in a real-terms increase of 0.8%
1. Introduction
1. A 2007/08 figure is used to avoid a one-off impact of the global financial crisis.

8 A decade of austerity in Wales? The funding pressures facing the NHS in Wales to 2025/26
compared with 2011/12. This will be followed by real-terms decreases in 2014/15 and 2015/16.
In England and Scotland, funding for the NHS was ring-fenced, meaning that the Welsh NHS faces a bigger relative reduction in funding. However, this has meant that funding for other areas of public spending in Wales has fallen less rapidly, specifically funding for local government, which fell by 4.5% in real terms between 2010/11 and 2013/14; compared with 7.6% in Scotland and 9.5% in England (Institute for Fiscal Studies, 2013).
While funding is falling for the Welsh NHS, the demand pressures for NHS services continue to rise. These pressures largely arise from a growing and ageing population. But there has also been a rising trend in the proportion of people living with long-term chronic conditions, which places an additional burden on the NHS, above that due to the changing population alone.
Alongside the rising pressures due to additional population demands, over the history of the NHS the unit costs of delivering services have also risen in real terms, not least due to wage pressures, with staff pay accounting for over half of all NHS spending.
The NHS in Wales, which has become accustomed to increases in real-terms funding to meet demand pressures, must now meet the population pressures with a reduced budget in real terms.
£2.0
£3.0
£4.0
£5.0
Spen
ding
(£ b
illio
n)
£6.0
£7.0
Note: Based on authors’ calculations using Public Expenditure Statistical Analyses (PESA) reports dating back to 1998, accounting for changes in methodology.
1992
/93
1993
/94
1994
/95
1995
/96
1996
/97
1997
/98
1998
/99
1999
/00
2000
/01
2001
/02
2002
/03
2003
/04
2004
/05
2005
/06
2006
/07
2007
/08
2008
/09
2009
/10
2010
/11
2011
/12
2012
/13
Year
Figure 1.1: Total spending on the NHS in Wales between 1992/93 and 2012/13, in 2013/14 prices

9 A decade of austerity in Wales? The funding pressures facing the NHS in Wales to 2025/26
To ensure that the decisions made around providing high-quality services with a reduced budget in real terms are well informed, it is vital to understand the extent to which the demand for NHS services is likely to rise. Projections of these pressures can then be compared with scenarios for the level of funding that might be available, producing an estimate for the funding gap that must be closed through efficiency measures in order to continue to provide a high-quality service.
In December 2012, the Nuffield Trust published A Decade of Austerity?, which used available data to model the drivers of demand for NHS services in England (Roberts and others, 2012). Using these models, we produced a projection for the rising demand up to 2021/22. We projected that demand pressures would rise by 3.9% a year in real terms, compared with broadly flat real-terms funding based on recent trends.
We have used a similar methodology to produce projections for the demand for NHS services in Wales. By comparing these projections to various scenarios for the available funding, we can demonstrate the potential size of the efficiency challenge, both in the period up to 2015/16, and over the longer term to 2025/26.
We have explored the patterns driving demand for NHS services in Wales in 2010/11, before the current period of austerity. Using these we have created NHS demand projections based on Office for National Statistics (ONS) projections for populations and mortality. We have also produced projections for the rates of hospitalisation for people in Wales with chronic conditions, based on data from 2001/02 to 2010/11.
The funding that will be made available to the Welsh Government up to 2015/16 was laid out in the 2010 spending review and the 2013 spending round. The funding available for the Welsh NHS was then determined by the Welsh Government in their budget-setting process. We have therefore explored the projected funding gap over this period. We have then explored the types of acute sector efficiencies that have occurred in the two years since 2010/11 for which we have data, and estimated the impact on this gap of continuing this rate of efficiency improvement up to 2015/16.
The funding that will be available during the period 2015/16 to 2025/26 is currently unknown. It will depend on a number of factors, most importantly: the economic situation for the UK by 2015/16, and the tax and spending decisions of governments in the spending reviews and budgets that will follow both the next UK general election on 7 May 2015 (parliament.uk, 2013) and the National Assembly for Wales election in 2016.
We have therefore explored three scenarios for the potential level of funding that might be available beyond 2015/16. These scenarios are:
• a continuation of real-terms cuts represented by holding the funding flat in cash terms
• a steady state represented by holding funding flat in real terms
• a real-terms increase by assuming that funding for the Welsh NHS maintains its share of UK GDP.
In each case we have explored the additional level of efficiency growth that would be required beyond 2015/16 to meet the projections for NHS services.
The results of these scenarios will help in understanding the extent of the financial challenge that would face the NHS in Wales due to the continued austerity, demand pressures and political decisions made in the next decade.

10 A decade of austerity in Wales? The funding pressures facing the NHS in Wales to 2025/26
The NHS in Wales provides a wide range of different services for the population, and all face differing patterns of demand.
We built different models for a number of different service types for which data were readily available. The level and complexity of the model depended on the data available for the service type.
The approach can be split into four steps, as shown in Figure 2.1:
• Step 1: Identify which factors are associated with current health service demand using available data, and estimate the contribution of the different factors to current patterns. We specifically used activity data from 2010/11, to allow us to explore the patterns prior to the current period of austerity.
• Step 2: Project future service activity based on projections of the key factors identified in Step 1, namely population growth (by age, sex and health board), fertility, mortality and prevalence of selected chronic conditions.
• Step 3: Apply average/unit costs, based on 2011/12 prices, and adjust them to reflect the long-term trend in health service pay rates. For inpatient care, the projected number of expected admissions is multiplied by the average length of stay, to which the average cost per day is applied.
• Step 4: Combine each service-specific projection into an estimate of the total Welsh spending pressures on health care, with adjustments made to account for services for which data are not available.
2. Methods
Figure 2.1: The steps used to project funding pressures
Step 1
Acute careInpatient
Projections by age, gender, region, fertility,
mortality, chronic
conditions and time
Average length of
stayAverage
cost
National spending on health care Unit cost
Outpatient
A&E
Maternity
GP consultations
Prescribing
Step 2 Step 3 Step 4

11 A decade of austerity in Wales? The funding pressures facing the NHS in Wales to 2025/26
Step 1: Analysing current activity In 2011/12, the NHS in Wales spent £5.3 billion in cash terms1 on providing health services to the population; worth £1,742 per head in cash terms2 (Welsh Government, 2013). Figure 2.2 shows the breakdown of how this money was distributed across the different service types. The majority of money (61%) was spent on secondary services, which include acute and community services.
We examined each service type separately to reflect the diversity of activity, using data that were readily available. We were not able to model all service types, specifically community services were not modelled due to lack of activity data.
1. £5.5 billion in 2013/14 prices.2. £1,795 per head in 2013/14 prices.
Figure 2.2: Breakdown of spending on NHS services in Wales in 2011/12
Notes: ‘Other’ includes goods and services, continuing care, NHS-funded nursing care and NHS services provided by voluntary organisations, local authorities and private providers. Values do not add up to exactly 100% due to rounding.
Prescriptions dispensed in the community: 9.9%
General Medical Services: 8.7%
Other primary care: 7.4%
Primary care
Secondary care
OtherAcute and A&E (excl. maternity): 43.6%
Maternity: 1.8%
Community services: 12.9%
Other secondary care: 2.8%
Other: 13.0%
Acute and accident and emergency (A&E) activity was split into four types, each of which was modelled separately:
• emergency inpatient care
• non-emergency inpatient care
• outpatient care
• A&E.

12 A decade of austerity in Wales? The funding pressures facing the NHS in Wales to 2025/26
Every patient care interaction with the acute sector is recorded in one of the following datasets:• The Patient Episode Database for Wales (PEDW) records all inpatient and day case
activity undertaken in Wales, and for Welsh residents treated in England (NHS Wales Informatics Service, 2014a).
• The Outpatient Attendance Dataset (OAD) records all outpatient appointments that occur in Wales.
• The Emergency Department Data Set (EDDS) records all attendances at a major A&E department in Wales (NHS Wales Informatics Service, 2014b).
Each dataset includes a unique pseudonymised patient identifier, which is consistent across all datasets and years. This has allowed us to track patients across each dataset through time, while protecting anonymity.
While the PEDW records all data for Welsh residents receiving inpatient care in Wales or England, the OAD and EDDS only record activity that occurs in Wales. If a Welsh resident attends an outpatient clinic or an A&E department in England, this would be funded from the Welsh NHS budget. We have therefore included records for Welsh residents from the English outpatient and A&E datasets recorded in the Hospital Episode Statistics (HES). There was substantial variation in the level of activity for Welsh residents that occurred in England in 2010/11, by health board, as shown for outpatient appointments in Figure 2.3.
Less than half of 1% of outpatient appointments occurred in England for residents of Cwm Taf University Health Board, whereas 54% occurred in England for residents of Powys Teaching Health Board.
Figure 2.3: Proportion of outpatient appointments for Welsh residents that occurred in England in 2010/11, by health board
Note: 7A1 = Betsi Cadwaladr University, 7A2 = Hywel Dda University, 7A3 = Abertawe Bro Morgannwg University, 7A4 = Cardiff and Vale University, 7A5 = Cwm Taf University, 7A6 = Aneurin Bevan University, 7A7 = Powys Teaching.
5–50%
Proportion
>50%
<5%
7A1: 20%
7A6: 2%
7A7: 54%
7A2: 1%
7A3: 1%
7A4: 1%
7A5: 0%

13 A decade of austerity in Wales? The funding pressures facing the NHS in Wales to 2025/26
Similarly, patients treated in a hospital in Wales who are not Welsh residents will not be funded from the Welsh NHS budget. We have therefore only included patients for whom the lower super output area (LSOA) of the home address is in Wales.
For each service type we produced person-level regression models to estimate the annual average activity rates depending on a number of key drivers of demand:
• age • sex• geographical region1 • whether it was their last year of life• whether they had received inpatient hospital care with a chronic condition.
The models used to estimate use of acute services were based on data from 2010/11. This allowed us to explore the potential pattern of service use without the current tight financial constraints.
The size of the population who had not received hospital care in 2010/11 was calculated using population estimates based on the 2011 Census by age, sex and health board (StatsWales, 2011).
Alongside population growth, recent rising trends in the proportion of the population living with chronic conditions are likely to have an impact on the demand for NHS services. We identified people with a chronic condition receiving inpatient care using diagnosis codes. The specific conditions that we included were based on the Department of Health chronic disease management compendium of information (Department of Health, 2004), with additions based on expert guidance. These were: • arthritis• cancer• chronic obstructive pulmonary disease (COPD) or asthma• coronary heart disease (CHD) or heart failure• dementia• diabetes• epilepsy• mental ill-health• renal disease• stroke.
More detail on how we identified people with chronic conditions is provided in the accompanying technical report (Roberts, 2014).
Prescribing data are collected nationally by the Primary Care Services of NHS Wales Shared Services Partnership. They cover all prescriptions dispensed by community pharmacies, appliance contractors and dispensing doctors in Wales. We explored the trend in the number of items prescribed per population between 2002 and 2012 for each type, as defined by the relevant British National Formulary (BNF) chapter (Royal Pharmaceutical Society, 2014), using least squares regressions2 to create projections.
1. Defined by the health board of the person’s residence.2. A standard approach to finding an approximate system trend, where the overall solution minimises the sum of the squares of the errors made in the results of each single equation.

14 A decade of austerity in Wales? The funding pressures facing the NHS in Wales to 2025/26
The average annual number of consultations with a GP and a practice nurse per population, split by age and sex, from 2003 to 2011, were estimated from the Welsh Health Survey (UK Data Service, 2011). Using these, we modelled the trends by age and sex for the under-16s, 16- to 74-year-olds (in ten-year age bands) and the over-75s.
For maternity we used the projection of the estimated number of births from the ONS. These estimates were consistently within 3% of the number of births recorded in the PEDW between 2001 and 2012.
Step 2: ProjectionsA fundamental driver for health spending in any country is the size and age profile of its population. Any projection of future spending will be largely influenced by what is expected to happen to the population over the time period. We used the principal projections for population and mortality by age, sex and health board (StatsWales, 2011).
Another big driver of demand for NHS services comes from the rising trend in people living with chronic conditions. As the number of people living with multiple conditions rises, the impact they have on health services increases. Using diagnosis codes recorded in the inpatient records in the PEDW, we identified where people have been admitted with certain chronic conditions. Using data from between 2001/02 and 2010/11, we calculated the proportion of the population who had received at least one inpatient admission with each condition, each year, split by age and sex for those aged 50 and over. We explored the specific trend for the conditions that have the greatest prevalence and impact on total costs: CHD or heart failure, COPD or asthma, and diabetes. We explored the trend for each of these conditions on their own, and for each combination of co-morbidities. For other conditions, we looked at the trend in any single other condition, or any other combination of co-morbidities.
For each combination of conditions, we calculated the mortality rate for the same period. We then assumed that these trends continue beyond 2010/11 to 2025/26, and applied them to the projected population.
For GP and practice nurse appointments, we explored the age- and sex-specific trends in average annual numbers per population between 2004 and 2011. We applied these to the future population projections.
For prescription items, we used the trend in items per person a year between 2002 and 2010, split by BNF chapter. Due to the data available, we were unable to adjust for age and sex. Assumptions for maternity where taken from the ONS projections.
Step 3: CostsTo translate the projected utilisation into a projection for total spending, we applied unit costs to the activity.
Acute activity was costed according to the 2011/12 Welsh national reference costs (Welsh Government, 2013). For inpatient data we applied the specific cost to each episode determined by the Healthcare Resource Group (HRG). The episodes were then grouped into spells to get the estimated spell costs, and then divided by the length of stay to get an average cost per day. This allowed us to explore the impact on total spending of a change in the average length of stay.
The reference costs for outpatient attendances provided an average for all attendances by specialty. However, we know from our costing work in England that a first attendance

15 A decade of austerity in Wales? The funding pressures facing the NHS in Wales to 2025/26
requires more resources than a follow-up, and so costs about twice as much. We therefore applied the ratio for each specialty estimated from the English Payment by Results (PbR) tariff price (see the accompanying technical report – Roberts, 2014 – for more information). A&E costs were based an average cost per attendance.
Outpatient and A&E data that were taken from the English HES data were costed according to the PbR tariff.
Maternity spells were costed in the same way as the inpatient data. We identified all inpatient activity for antenatal treatment and birth, and calculated the average annual cost for someone giving birth at £2,135, which we applied to the principal ONS fertility projections. This estimated average cost was similar to the value estimated in England of £2,156.
The cost for consultations at a GP practice were taken from the 2011 Personal Social Services Research Unit (PSSRU) English unit costs (Curtis, 2010) at £36 for a consultation with a GP, and £13 for a consultation with a practice nurse. However, this overestimated the total spend on GP practices in Wales, so we re-adjusted the values to £24 and £9 respectively, to maintain the English ratio.
We applied the average cost for an item in each BNF chapter in 2011/12 to the activity projection. The average costs for most chapters have been falling steadily in recent years, however we elected to assume that this trend came to an end in our base case.
To explore future funding pressures, we looked at the impact of rising real wage costs on the unit cost of health care. Data from the Department of Health provider economics impact assessment model show that the workforce accounts for 64% of hospital costs (Department of Health and NHS Confederation, 2010). For the 36% of hospital costs that are non-pay, we assume that unit costs will increase in line with inflation. Similarly, unit costs for items prescribed were assumed to increase in line with inflation.
All monetary values in the report are given in 2013/14 prices, using the March 2014 GDP deflator (HM Treasury, 2014). This means that we explored the real-terms impact of the projected funding pressures, after accounting for inflation.
Step 4: NHS spendingThe final step was to combine the projections for each of the service types (acute care and A&E; maternity; prescribing; and GP consultations) to create an estimate of total NHS spending on services in Wales.
We first applied an adjustment for the results of each service type. We were not able to account for the total cost for some service types due to a lack of data, such as critical care for inpatients. We accounted for this by applying an aggregation factor so that the value estimated in 2011/12 matched the amount spent on the service type in the same year.
We then made a final adjustment to account for the service types that we did not model (other primary care, community services and other secondary care), assuming that these sectors grow in line with those modelled. The resulting final figure therefore relates to aggregate NHS spending on activity in 2010/11 (£6.0 billion1) from PESA in 2013/14 prices (HM Treasury, 2013).
1. This figure is higher than the £5.5 billion from the Welsh reference costing return as PESA includes funding for education and training, research and development, and public health (Welsh Government, 2014).

16 A decade of austerity in Wales? The funding pressures facing the NHS in Wales to 2025/26
Spending pressures on NHS services in Wales will grow by 3.2% a year in real terms between 2010/11 and 2025/26, assuming recently observed patterns of service use and costs continue for the forecasted demographic trends. Spending pressures would therefore be £3.6 billion higher in 2025/26 than in 2010/11 (Figure 3.1). This is equivalent to an extra 59% of the total spend on NHS services in Wales in 2010/11. This spending requirement is due to the combined effect of rising pressures across the different service types, which we explore in more detail on the following pages.
3. The financial challenge to 2025/26
Figure 3.1: Projection of NHS spending pressures to 2025/26, in 2013/14 prices
£5.0
£7.0
£9.0
£10.0
2025
/26
2024
/25
2023
/24
2022
/23
2021
/22
2020
/21
2019
/20
2018
/19
2017
/18
2016
/17
2015
/16
2014
/15
2013
/14
2012
/13
2011
/12
2010
/11
Tota
l cos
t (£
billi
on)
Year
£6.0
£8.0
£3.6 billion3.2%
a year

17 A decade of austerity in Wales? The funding pressures facing the NHS in Wales to 2025/26
Acute servicesThe acute sector is the largest area of spending on NHS services, accounting for over £4 in every £10 spent on services in Wales. In our modelling we explored the impact of three drivers for spending pressures on acute services: population, chronic conditions and staff pay.
A growth in the size of a population will clearly lead to an increase in the demand for health services. Additionally, a person’s likelihood of need for hospital services, and therefore the associated spend required, rises as a person ages (Figure 3.2). So a population with an older age profile will have higher costs than a population of the same size with a younger age profile. The population of Wales is predicted to grow by 5% between 2012 and 2025 (StatsWales, 2011). However, the age profile will become much older, with the number of people aged 65 and over growing by 26% over this period, compared with a growth of 1% for people aged under 65 (Figure 3.3). These projections are lower than those for the UK population as a whole, which is projected to grow by 8%; 4% for people aged under 65, and 30% for those aged 65 and over.
Figure 3.2: Average annual hospital cost in 2011/12, by age and sex, excluding maternity
Aver
age
cost
(£)
Age
Source: Authors’ calculations applying reference costs to PEDW data.
FemaleMale
£0
£4,000
£3,000
£2,000
£1,000
0 1-4 5-910
-1415
-1920
-2425
-2930
-3435
-3940
-4445
-4950
-5455
-5960
-6465
-6970
-7475
-7980
-84 85+

18 A decade of austerity in Wales? The funding pressures facing the NHS in Wales to 2025/26
Figure 3.3: Projected 2025 population of Wales, by age and sex, compared with the 2012 population
0-4
Age
gro
up85+
20-2425-2930-3435-3940-4445-4950-5455-5960-6465-6970-7475-7980-84
26%
gro
wth
15-1910-14
5-9
Source: ONS
Population (thousands)
120 1208080 40 400
1% g
row
th
Male 2025 Male 2012 Female 2025 Female 2012
Population growth alone would result in an estimated £457 million in additional spending pressures for acute services by 2025/26 in real terms, an average annual increase of 1.2% a year, based on the patterns observed in 2010/11 (Figure 3.6, page 21).
Figure 3.4 shows the expenditure in 2011/12 for admissions related to the chronic conditions that we explore in this report. Admissions for people with one or more of these chronic conditions accounted for 54% of total inpatient spending in 2011/12. This is higher for those aged 50 and over (66%) and for those aged 75 and over (76%). Expenditure was substantially higher for admissions for people with CHD or heart failure, COPD or asthma, and diabetes, than for the other conditions.

19 A decade of austerity in Wales? The funding pressures facing the NHS in Wales to 2025/26
The number of people admitted to hospital with a chronic condition in Wales rose from 105,000 people in 2001/02, to 142,000 people in 2010/11. One cause of this is the ageing population; the likelihood of developing a chronic condition rises with age, therefore a population with more older people will have a higher number of people living with at least one chronic condition. This is accounted for in the population-only projection in Figure 3.6 (page 21).
A second reason is that, in addition to this, we have seen an increase in the likelihood of a person with a chronic condition receiving inpatient care within age bands. So, in one extreme example, a male aged 75 or over was twice as likely to have a hospital admission with diabetes in 2010/11 than in 2001/02 (Figure 3.5). It is worth highlighting that this is partly due to increased life-expectancy1 and improved survival rates for people with chronic conditions. There have also been advances in treatments available for certain conditions, which result in additional hospital visits. Continuation of this trend would lead to an additional spend on acute care of £484 million by 2025/26, in 2013/14 prices, on top of that due to population alone. This results in a combined average increase of 2.2% a year (Figure 3.6, page 21).
1. The longer a person lives, the higher their likelihood of developing one or more chronic condition.
Figure 3.4: Total cost of inpatient admissions in Wales related to chronic conditions in 2011/12, in 2013/14 prices
0
Tota
l cos
t (£
mill
ion)
350
300
250
200
150
100
50
Note: is chart provides costs for conditions independently, and so some costs will be attributable to multiple conditions.
*Coronary heart disease or heart failure.**Chronic obstructive pulmonary disease.
Chronic condition
CHD or HF*
COPD** or
asthma
Diabetes Dementia Stroke Cancer Renal Mentalhealth
Arthritis Epilepsy

20 A decade of austerity in Wales? The funding pressures facing the NHS in Wales to 2025/26
Pay for hospital and community health service staff in the UK (including doctors, nurses, support staff and managers) rose by an average of around 2% a year in real terms over the 35 years to 2009/10 (authors’ calculations, based on Department of Health, 2011). Assuming that this trend continues, average annual earnings would rise from £29,305 in 2010/11, to £38,097 in 2025/26, in 2013/14 prices.
Data from the Department of Health provider economics impact assessment model show that the workforce accounts for 64% of hospital costs (Department of Health and NHS Confederation, 2010). Assuming the long-term trend in real-terms pay continues, and that non-pay costs rise in line with inflation, spending pressures on acute services would rise by an additional £608 million due to the population and chronic conditions effects, in 2013/14 prices. The combined effect of these three trends would be that acute spending pressures would rise by an average of 3.4% a year in real terms between 2010/11 and 2025/26 (Figure 3.6).
Figure 3.5: Proportion of the Welsh population aged 50 and over receiving inpatient care for diabetes and no other chronic condition between 2001/02 and 2012/13, by age and sex
Perc
enta
ge
Year
2012
/13
2011
/12
2010
/11
2009
/10
2008
/09
2007
/08
2006
/07
2005
/06
2004
/05
2003
/04
2002
/03
2001
/020%
2%
4%
6%
8%
2012
/13
2011
/12
2010
/11
2009
/10
2008
/09
2007
/08
2006
/07
2005
/06
2004
/05
2003
/04
2002
/03
2001
/02
Female Male
Age:55–5950–54
65–6960–64 70–74
75–7980–8485+

21 A decade of austerity in Wales? The funding pressures facing the NHS in Wales to 2025/26
Figure 3.6: Impact of projected total spend on acute services due to population, chronic conditions and staff pay, in 2013/14 prices
£2.0
£2.5
£3.0
£3.5
£4.0
2025
/26
2024
/25
2023
/24
2022
/23
2021
/22
2020
/21
2019
/20
2018
/19
2017
/18
2016
/17
2015
/16
2014
/15
2013
/14
2012
/13
2011
/12
2010
/11
Tota
l cos
t (£
billi
on)
Year
£1.5 billion3.4% a year
£0.5 billion1.2% a year
£0.9 billion2.2% a year
2010/11 spendingAdditional effect of 2% real-terms pay increaseAdditional effect of trend in chronic conditionsPopulation only
PrescribingThe rate of prescription items dispensed in the community in Wales rose by an average of 4.0% a year between 2002 and 2010; from 16.7 to 22.9 items per head of population. The rate increased for all but one drug type, as defined by the BNF chapters (Figure 3.7). The only type for which the rate fell was for dressings, which accounted for 2% of the total cost in 2010/11.
The conditions that accounted for the most items were for cardiovascular system (7.2 items a year per head of population, accounting for 18% of total spend on prescribing in 2010/11) and central nervous system (4.3 items a year per head of population, accounting for 22% of total spend on prescribing in 2010/11). Both of these also showed the greatest rate of growth in items per head of population between 2002 and 2010.
If these trends continue, spending on community prescribing would be 60% higher in real terms in 2025/26 than in 2010/11, assuming that the unit costs remained at the 2011/12 level. This is an average real-terms increase of 3.2% a year.

22 A decade of austerity in Wales? The funding pressures facing the NHS in Wales to 2025/26
Figure 3.7: Trend in prescribing items per head of population in Wales for the ten British National Formulary chapters with the highest rates in 2012, 2002 to 2012
0
2
4
6
8
Item
s per
hea
d of
pop
ulat
ion
Year
2002
2003
2004
2005
2006
2007
2008
2009
2010
2011
2012
Gastrointestinal system Endocrine systemCentral nervous systemCardiovascular system
InfectionsMusculoskeletal and joint diseases Nutrition and blood
Obstetrics, gynaecological and urinary tract disorders
Respiratory system
Skin
3.3 General Medical ServicesThe average annual number of consultations with a GP in Wales rises with age, and is higher for females than for males. In 2010, people aged 16 to 24 had an average of 3.9 consultations with a GP a year per head of population (2.3 for males, 5.5 for females). The average rose to 8.4 for people aged 75 and over (8.1 for males, 8.6 for females). The pattern was similar for consultations with a practice nurse: people aged 16 to 24 had an average of 1.4 consultations a year per head of population (0.7 for males, 2.2 for females), compared with 6.6 for people aged 75 and over (7.5 for males, 6.1 for females).
Between 2004 and 2010, the total number of consultations at a GP practice for people aged 16 and over rose from 12.8 million with a GP to 14.0 million (a total increase of 8.8% and an average annual increase of 1.4% a year), and 6.6 million with a practice nurse to 7.5 million (a total increase of 12.9% and an average annual increase of 2.0% a year). However, the upward trend in the number of appointments per person a year was fairly flat for most age groups, showing that most of this increase was due to population growth and ageing.

23 A decade of austerity in Wales? The funding pressures facing the NHS in Wales to 2025/26
Data on the number of GP consultations a year for people aged under 16 are only available from 2007, falling from 4.4 a year per head of population in 2007 (4.1 for males, 4.6 for females), to 4.3 in 2011 (4.1 for males, 4.4 for females). Data on the number of consultations with a practice nurse were not available for people aged under 16.
Assuming the trends in consultations per person a year continue alongside the assumptions of population growth, by 2025/26 there would be 16.5 million appointments with a GP (6.7 million for males, 9.8 million for females), and 11.7 million with a practice nurse (5.9 million for both males and females)1 for people aged 16 and over (Figure 3.8).
Figure 3.8: Annual number of consultations with a GP or practice nurse in Wales for people aged 16 and over, by sex, between 2004/05 and 2011/12, with projected number up to 2025/26
2
4
6
8
Num
ber o
f atte
ndan
ces a
yea
r (m
illio
n)
10
2004
/05
2005
/06
2006
/07
2007
/08
2008
/09
2009
/10
2010
/11
2011
/12
2012
/13
2013
/14
2014
/15
2015
/16
2016
/17
2017
/18
2018
/19
2019
/20
2020
/21
2021
/22
2022
/23
2023
/24
2025
/26
2024
/25
Year
Projected GP attendances – femaleProjected GP attendances – maleProjected nurse attendances – femaleProjected nurse attendances – male
Actual GP attendances – femaleActual GP attendances – maleActual nurse attendances – femaleActual nurse attendances – male
1. Sum of values do not match due to rounding.

24 A decade of austerity in Wales? The funding pressures facing the NHS in Wales to 2025/26
Figure 4.1 shows the projection of total health spending pressures in 2015/16 compared with the 2010/11 level of spend, assuming no additional efficiency or cost savings during this period. However, funding for the NHS in Wales fell in real terms in both 2011/12 and 2012/13. Following an increase in 2013/14, it is budgeted to continue to fall in real terms until 2015/16. There are currently a number of initiatives in place to try to increase efficiency and to realise savings in order to maintain levels of service provision and quality, despite the reduced real-terms budget. To reflect this we have looked closely at the period between 2010/11 and 2015/16, exploring what has happened in the most recent years, and to what extent the current savings may close the financial gap in the period in which the available funding is known.
The potential funding gap in 2015/16If pressures continue to rise in line with the patterns observed up to 2010/11, funding would need to rise by 16.8% to £7.0 billion in 2015/16, in 2013/14 prices, assuming that no efficiency savings are made. This is an average real-terms increase of 3.1% a year.
However, in 2011/12, the budget for NHS services in Wales fell by 1.4% in real terms, and a further 0.7% in 2012/13. There was a real-terms increase in 2013/14 of 0.8%, but this will be followed by further real-terms decreases of 1.7% in 2014/15, and 0.6% in 2015/16 (Table 4.1). This means the budget will be 3.6% lower in real terms in 2015/16 than it was in 2010/11.
4. The financial challenge to 2015/16
The falling value of the budget in real terms means that the projection for NHS spending pressures would lead to a potential funding gap in 2015/16 of £1.2 billion in 2013/14 prices. The rising pressures and decreasing budget mean that closing this estimated gap would require savings worth an average of 3.9% a year in real terms (Figure 4.1).
Table 4.1: NHS Wales current spending between 2010/11 and 2012/13, and forecast to 2015/16
Year NHS budget in 2013/14 prices Real-terms percentage change
2010/11 £6.03 billion –
2011/12 £5.94 billion -1.4%
2012/13 £5.90 billion -0.7%
2013/14 £5.95 billion 0.8%
2014/15 £5.85 billion -1.7%
2015/16 £5.81 billion -0.6%

25 A decade of austerity in Wales? The funding pressures facing the NHS in Wales to 2025/26
Figure 4.1: The projected funding gap in 2015/16 in real terms
£5.7
£6.3
£6.9
£7.2
2015
/16
2014
/15
2013
/14
2012
/13
2011
/12
2010
/11
Tota
l cos
t (£
billi
on)
Year
£6.0
£6.6 £1.2 billion3.9%
a year
Base caseFunding budget
Our projections show that the funding pressures for the Welsh NHS will grow at a slower rate than those projected for the English NHS.1 But while the funding for the Welsh NHS has fallen, the funding for the English NHS has been protected in real terms, so the size of the efficiency challenge facing both countries is similar in the short term.
Closing the NHS funding gap in 2015/16The impact of pay restraintThe assumption that staff pay continues in line with the long-term average of 2% in real terms beyond 2010/11 is a major contributor to the projected funding gap. However, this trend has been put on hold with the introduction of the government public sector pay policy. The pay policy froze pay awards for all public sector workers, including NHS staff, earning basic salaries of more than £21,000 a year for 2011/12 and 2012/13; staff earning less than £21,000 were awarded £250 a year cash uplifts in April 2011 and 2012 (NHS Employers, 2012). For each of the two years following this pay freeze (2013/14 and 2014/15), public sector pay awards were to be capped at an average of 1% a year in cash terms (HM Treasury, 2011). As a result, the average annual earnings for NHS staff in Wales fell in real terms in 2011 and 2013, but rose by 0.6% in 2012 (Table 4.2). This means that annual earnings for staff in the Welsh NHS were 0.1% lower in real terms in 2013 than they were in 2010. Over the same period, the average earnings for staff in the English NHS rose by 0.1% in real terms.
1. 3.2% a year in Wales, compared with 3.9% in England, in real terms.

26 A decade of austerity in Wales? The funding pressures facing the NHS in Wales to 2025/26
We replaced the initial assumption of 2% increases with these observed pay changes, and assumed that the most recent decrease of 0.6% continues up to 2015/16. This means that annual earnings would fall from £29,305 in 2010/11, to £28,937 in 2015/16, in 2013/14 prices, instead of rising to £32,236 in our base case (Figure 4.2).1
Staff costs account for around three fifths of total hospital costs (Department of Health and NHS Confederation, 2010); we therefore assume that only 60% of the unit costs are
Table 4.2: Change in observed average real-terms annual earnings for Welsh NHS staff (earnings per full-time equivalent for clinical and non-clinical staff), June 2010 to June 2013
Date Total 12-month earnings in cash terms
GDP deflator*
Total 12-month earnings in 2013/14 prices
Percentage real-terms change
June 2010 £27,829 96.7 £29,305 –
June 2011 £28,429 98.9 £29,274 -0.1%
June 2012 £28,937 100.0 £29,458 0.6%
June 2013 £29,288 101.8 £29,288 -0.6%
Figure 4.2: Long-term trend in NHS pay compared with current pay settlement, in 2013/14 prices
£29,000
£28,000
£33,000
£30,000
£31,000
Aver
age
annu
al e
arni
ngs,
in 2
013/
14 p
rices
£32,000
2010
2011
2012 20
1320
1420
15
Year
Observed average annual real-terms earningsLong-run average annual real-terms earnings
2010 average annual earningsProjected average annual real-terms earnings
£3,298£368
1. We have not included the impact of pension payments in this, but the employer contributions are now only increasing from 14% to 14.3%, instead of the proposed increase to 18% (NHS Employers, 2014).
* A measure of general inflation in the domestic economy, usually expressed in terms of an index figure.

27 A decade of austerity in Wales? The funding pressures facing the NHS in Wales to 2025/26
reduced by the value of the wage reduction. We assume that the other areas grow in line with inflation.
Applying these assumptions reduces the projected funding gap in 2015/16 by £383 million in 2013/14 prices; and so is worth nearly a third of the total estimated funding gap. The remaining gap would be an estimated £842 million in 2013/14 prices (Figure 4.4, page 30).
Acute sector efficiencyThe base assumption includes no continued growth in health service efficiency. Evidence for the UK suggests that health service productivity increased on average by 0.5% a year between 1997 and 2010 (Massey and Caul, 2014). Work by the Health Foundation suggests there is scope for additional ongoing productivity gains. Accounting for nearly half of total spending on services, with the highest unit costs for activity, the acute sector arguably has scope to contribute further to savings through additional productivity improvements (Churchill and Dixon, 2014). A recent report published by the Nuffield Trust and the Health Foundation showed that the mean length of stay for inpatient spells in 2008/09 was higher in Wales than for any of the other countries of the UK1 (Bevan and others, 2014). Assuming that this is still the case, this would suggest that there is further scope for acute sector efficiency savings in the Welsh NHS.
In our base case projection we explored the potential demand and cost pressures assuming that the patterns of service use observed in 2010/11 continue, without the impact of the current period of austerity. However, we have data from 2011/12 and 2012/13, which allowed us to determine how the NHS in Wales has responded to the current period of austerity. Table 4.3 shows that in the first two years of reduced budgets, the NHS in Wales saw a reduction in the length of stay for emergency inpatient spells, which fell by an average of 4.5% a year, from 10.4 days to 9.5 days.
At the same time, the average number of elective admissions per person increased by an average of 1.1% a year. This was driven by an increase in the number of day cases, which rose by an average of 2.6% a year. As a result, over half of the elective inpatient episodes in 2012/13 were performed as day cases: 50.9% in 2012/13, compared with 49.5% in 2011/12, and 49.4% in 2010/11.
We have used these as an estimate of the level of acute sector efficiency that can reasonably be assumed over the period 2010/11 to 2015/16, to explore the extent to which this would reduce the potential funding gap.
Estimating the savings associated with these efficiency estimates is not straightforward. Unit costs for activity in the NHS, as for other industries, are made up of variable, fixed and semi-fixed costs, estimated to be worth approximately 13%, 23% and 64% respectively (Department of Health and NHS Confederation, 2010).
The variable costs, such as consumables that are directly related to the unit of activity, can be saved in full following any reduction in activity over the time period to 2015/16. The fixed costs, associated with the use of buildings and so on, will be very difficult to release over this time period, as they would require cessation of all activity associated with the source of the cost. The semi-fixed costs consist largely of staff costs. While these cannot be released in direct proportion to the activity reductions, they can be released in a more
1. 6.3 days in Wales, compared with 4.3 in England, 5.7 in Scotland and 5.5 in Northern Ireland.

28 A decade of austerity in Wales? The funding pressures facing the NHS in Wales to 2025/26
Table 4.3: Observed changes in activity rates since 2010/11
Outpatient appointments per person a year
Non-elective admissions per person a year
Elective admissions per person a year
Average bed days per non-elective spell
Average bed days per elective spell
2010/11 1.024 0.117 0.158 10.39 3.22
2011/12 1.047 0.118 0.163 9.65 3.25
2012/13 0.979 0.114 0.161 9.48 3.18
Average annual change 2010/11 to 2012/13
-2.2% -1.3% 1.1% -4.5% -0.6%
gradual manner over the longer term. We have assumed that one third of the semi-fixed costs related to the activity reductions can be released by the end of this period.
If these observed trends in efficiency continue, the funding gap in 2015/16 would be reduced by a further £212 million,1 which is worth an average of 0.6% a year, leaving an estimated gap of £629 million in real terms (Figure 4.4, page 30).
Better management of chronic conditionsBetween 2001/02 and 2010/11, there was a rising trend in the age- and sex-specific probability of receiving inpatient care related to a chronic condition for people aged 50 and over in Wales. This means that, alongside the impact of more people living with chronic conditions due to the ageing population, there is also a higher probability of each of these people receiving inpatient care with a condition. In our projection of demand pressures, we assumed that these trends will continue to 2025/26. The impact of this on health care spending pressures would be almost as large as for population growth alone.
However, in 2011/12 and 2012/13, we saw a fall in this trend such that the rate seemed to stabilise. By assuming that the rate of admissions related to chronic conditions remains at the level observed in 2010/11, the gap in 2015/16 would be closed by a further £205 million in real terms, leaving an estimated gap of £425 million (Figure 4.4, page 30).
Price of prescription drugsIn our base case projection, we hold the cost of prescribed drugs at the 2011/12 price. Between 2002 and 2012, the average unit cost of a prescription fell by an average of 5.4% a year in real terms (Figure 4.3). Much of the fall in cost can be explained by patents expiring, so the NHS is able to dispense cheaper generic alternatives. This trend will not continue indefinitely as the big wave of patent expiries for high-volume drugs such as statins comes to an end. Because of this, we haven’t assumed that the unit costs continue to fall at the recently observed rate. However, if between 2010/11 and 2015/16 the unit costs continue to fall at half the recent trend, the funding gap would be reduced by a further £204 million, leaving an estimated gap of £221 million in 2015/16, in 2013/14 prices (Figure 4.4, page 30).
1. The model assumes that savings made in any of the services included in the model are matched by areas not included, therefore these savings for the whole NHS are slightly higher than the specific savings for the sector.

29 A decade of austerity in Wales? The funding pressures facing the NHS in Wales to 2025/26
Unlike the other potential savings that we have explored, these are based on an observed long-term trend prior to 2010/11. Therefore, it is likely that these savings would have been made anyway, rather than being a direct response to the current period of austerity.
These assumptions for potential savings bring the spending projections to within 4% of the likely funding available in 2015/16, but do not fully close the funding gap. We have decided to continue the modelling from this point, rather than apply any additional savings that become more obscure.
Figure 4.3: Average cost of prescription items in Wales between 2002 and 2012, in 2013/14 prices
£6
£9
£12
£15Av
erag
e co
st (£
)
Year
2002
2003
2004
2005
2006
2007
2008
2009
2010
2011
2012

30 A decade of austerity in Wales? The funding pressures facing the NHS in Wales to 2025/26
£5.75
£6.0
£6.25
£6.5
Tota
l cos
t (£
billi
on)
£6.75
£7.0
2010
/11
2011
/12
2012
/13
2013
/14
2014
/15
2015
/16
Year
£0.4 billion1.4% a year
£0.8 billion2.7% a year
£1.2 billion3.9% a year
£0.6 billion2.1% a year
£0.2 billion0.7% a year
Real payFunding budget
Acute productivityBase case
Hold rate of chronic condition admissions
Prescribing unit costs fall at a half trend until 2015/16
Figure 4.4: The cumulative effect of projected savings on the funding gap in 2015/16, in 2013/14 prices

31 A decade of austerity in Wales? The funding pressures facing the NHS in Wales to 2025/26
In the previous chapter we looked at plausible scenarios for how the level of projected spending pressures could be reduced towards the level of funding that is likely to be available in 2015/16. For the remainder of this report, we assume that these savings have been made, and estimate the size of the additional funding challenge beyond 2015/16, to 2025/26.
Funding for the Welsh NHS has been planned for the period up to 2015/16. However, the level of funding available beyond then is less clear. Decisions about future funding will depend on the UK fiscal outlook, policy decisions in the UK and the Welsh budget-setting process following the UK General Election in May 2015 (parliament.uk, 2013) and the Welsh Assembly elections in 2016.
We have therefore explored three potential scenarios of the level of NHS funding that might be available in the period from 2016/17 to 2025/26, to show the remaining potential funding gap in each case (Figure 5.1).
First we assume that funding for the Welsh NHS is held flat in cash terms from 2015/16. This would equate to a cut in funding in real terms of 1.9% a year, as costs continue to rise with inflation. In this case there would be an estimated funding gap in 2025/26 of £3.6 billion in 2013/14 prices, requiring real-terms efficiency savings worth 5.8% a year, in addition to the savings made up to 2015/16. In this projection, the real-terms funding would fall at a greater rate than the current funding plans.
In our second scenario, we assume that funding is held flat in real terms. This would be an increase in cash terms, but if the NHS in Wales delivered the same level and quality of services, to a larger population, with the same relative level of funding, the projected funding gap in 2025/26 would be an estimated £2.5 billion, requiring additional real-terms efficiency savings of 3.7% a year.
Our final scenario assumes that spending on the NHS in Wales maintains its share of the UK national income beyond 2015/16, reflecting international evidence that the income elasticity of health spending is broadly between 0.8 and 1.0.1 The Office for Budget Responsibility (OBR) has forecast that, in the UK, economic output will potentially grow by 2.2% a year in real terms from 2016 (OBR, 2014). We therefore assume this is true for Welsh NHS funding after 2015/16. In this scenario, the funding gap in 2025/26 would be an estimated £1.1 billion in 2013/14 prices, requiring additional efficiency savings of 1.5% a year in real terms. We have used this as our best-case scenario, although the level of increase is lower than that observed in any year between the first year of the devolved parliament and 2010/11.
5. The financial challenge between 2016/17 and 2025/26
1. That is, as countries become richer, they will spend more of their income on the provision of health care.

32 A decade of austerity in Wales? The funding pressures facing the NHS in Wales to 2025/26
Figure 5.1: The funding gap in 2025/26 following savings made by 2015/16
£4.0
£5.0
£6.0
Tota
l cos
t (£
billi
on)
£7.0
£9.0
£8.0
2010
/11
2011
/12
2012
/13
2013
/14
2014
/15
2015
/16
2016
/17
2017
/18
2018
/19
2019
/20
2020
/21
2021
/22
2022
/23
2023
/24
2024
/25
2025
/26
Year
£1.1 billion1.5% a year2015/16 to 2025/26
£2.5 billion3.7% a year2015/16 to 2025/26
£3.6 billion5.8% a year2015/16 to 2025/26
Funding held flat in real termsProjected spending
Funding maintains share of GDPFunding held flat in cash terms
Potential savings between 2015/16 and 2025/26Between 2010/11 and 2015/16, we have assumed that only a third of the semi-fixed costs associated with acute sector efficiency savings would be realised. Over the longer period between 2015/16 and 2025/26, it is reasonable to assume that the savings from these semi-fixed costs can be fully released. This would reduce the spending pressures in 2025/26 by £368 million in 2013/14 prices.
We have also assumed that the trend in the likelihood of someone with a chronic condition receiving inpatient care remains at the level observed in 2010/11, between 2010/11 and 2015/16. After this we have assumed that the trend continues to rise again at the rate observed between 2001/02 and 2010/11. However, if this likelihood could be held at the 2010/11 level beyond 2015/16 up to 2025/26, the spending pressures in 2025/26 would be reduced by a further £541 million in 2013/14 prices.
The combined impact of both of these would reduce the spending pressures in 2025/26 by £909 million in 2013/14 prices (Figure 5.2). This would still leave a slight funding gap against the best-case scenario of £0.2 billion, requiring additional savings of 0.3% a year. If funding is held flat between 2015/16 and 2025/26, then following these additional savings the funding gap would be £1.6 billion, requiring efficiency savings of 2.5% a year. Against the worst-case scenario, where funding is held flat in cash terms, the remaining funding gap would be £2.7 billion, requiring efficiency savings of 4.5% a year.

33 A decade of austerity in Wales? The funding pressures facing the NHS in Wales to 2025/26
Figure 5.2: Potential for additional savings beyond 2015/16
£5.0
£4.0
£6.0
Tota
l cos
t (£
billi
on)
£7.0
£9.0
£8.0
2010
/11
2011
/12
2012
/13
2013
/14
2014
/15
2015
/16
2016
/17
2017
/18
2018
/19
2019
/20
2020
/21
2021
/22
2022
/23
2023
/24
2024
/25
2025
/26
Year
£0.9 billion£0.5
billion
£0.4billion
Release savings and hold rateof chronic conditions
Projected spendingFunding held flat in cash termsRelease savings
Funding maintains share of GDPFunding held flat in real terms

34 A decade of austerity in Wales? The funding pressures facing the NHS in Wales to 2025/26
Through the last decade, the NHS in Wales, as in the rest of the UK, became accustomed to receiving significant real-terms increases in funding, which kept pace with the rising pressures from a growing and ageing population, increasing expectations and higher costs of care. This is no longer the situation, following the global economic crisis. The NHS in Wales is now required to meet a growing demand for services with less money, while sustaining high-quality care. Understanding the size of the potential gap in funding facing the NHS in Wales will be vital in planning how to maintain a sustainable NHS.
In our initial scenario, exploring how funding pressures would rise following the patterns observed in 2010/11, we estimated that the additional pressures would rise by 3.2% a year in real terms. This is below the estimate of 3.9% a year in real terms we estimated for health spending pressures in England over the decade up to 2021/22, suggesting that the cost pressures in Wales may not be as great.
The key difference relates to population. The rate of population growth is a big factor with regard to the future demands on a health service. The population of Wales is forecast to grow by 5% between 2012 and 2025, with the population aged 65 and over forecast to grow by 26%, while the population aged under 65 is forecast to grow by just 1%. In England, the overall population is forecast to grow much faster at 10% over the same period, with the population aged 65 and over, and the populations aged under 65, growing by 28% and 7%, respectively. The higher rate of population growth goes a long way to explain the difference in projections. However, the relatively similar rate of growth for those aged 65 and over explains why the pressures are not so much higher for England, given the double rate of overall population growth.
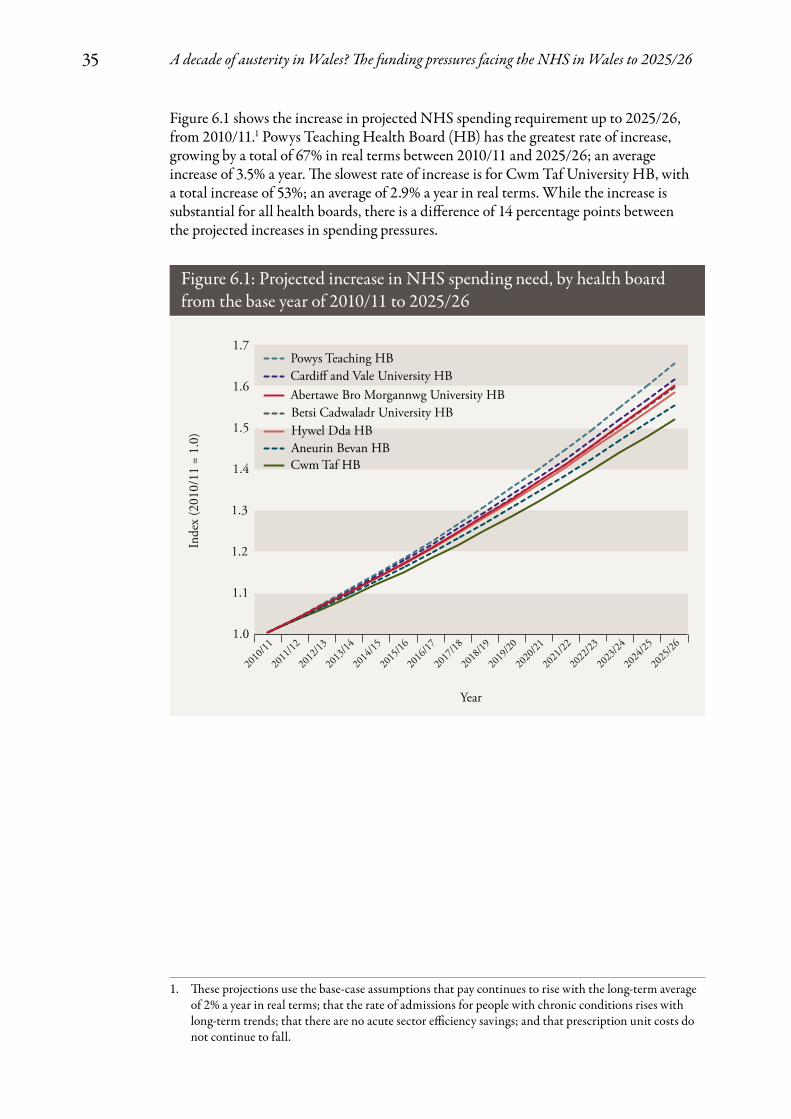
Regional variations across WalesDemand pressures on the NHS will not necessarily be distributed evenly across the seven health boards in Wales. Each will face different challenges depending on the relative size, distribution and projected increases in population.
While we included health board as a factor in our models for acute services, we were not able to account for it in our projections for admissions related to chronic conditions (due to low numbers), consultations at GP practices or trends in prescribing costs (due to limitations in data availability). But to provide an estimate of the relative growth in NHS spending requirements, we have applied our Wales models to health board-specific population projections.
6. Discussion
35 A decade of austerity in Wales? The funding pressures facing the NHS in Wales to 2025/26
1. These projections use the base-case assumptions that pay continues to rise with the long-term average of 2% a year in real terms; that the rate of admissions for people with chronic conditions rises with long-term trends; that there are no acute sector efficiency savings; and that prescription unit costs do not continue to fall.
Figure 6.1: Projected increase in NHS spending need, by health board from the base year of 2010/11 to 2025/26
1.0
1.3
1.2
1.1
Inde
x (2
010/
11 =
1.0
) 1.5
1.6
1.4
1.7
Year
2010
/11
2011
/12
2012
/13
2013
/14
2014
/15
2015
/16
2016
/17
2017
/18
2018
/19
2019
/20
2020
/21
2021
/22
2022
/23
2023
/24
2024
/25
2025
/26
Abertawe Bro Morgannwg University HB
Aneurin Bevan HB
Betsi Cadwaladr University HB
Cardiff and Vale University HB
Cwm Taf HB
Hywel Dda HB
Powys Teaching HB
Figure 6.1 shows the increase in projected NHS spending requirement up to 2025/26, from 2010/11.1 Powys Teaching Health Board (HB) has the greatest rate of increase, growing by a total of 67% in real terms between 2010/11 and 2025/26; an average increase of 3.5% a year. The slowest rate of increase is for Cwm Taf University HB, with a total increase of 53%; an average of 2.9% a year in real terms. While the increase is substantial for all health boards, there is a difference of 14 percentage points between the projected increases in spending pressures.

36 A decade of austerity in Wales? The funding pressures facing the NHS in Wales to 2025/26
Population growth clearly has an impact on the rate at which the demand for NHS services will grow. Cwm Taf University HB, which has the lowest rate of projected increase for NHS spending pressures, also has the lowest projected increase in population, growing by 2.2% between 2010/11 and 2025/26 (Figure 6.2); an increase of just 0.1% a year.
Cardiff and Vale University HB is projected to have the biggest growth in population of 15.5% (1.0% a year), and also has the second highest projection for health spending pressures (63% total increase; an average of 3.3% a year in real terms).
But, while Powys Teaching HB has the highest rate of projected increase in NHS spend, it has the second lowest increase in total population, with a total increase of 2.7%; an average of 0.2% a year. This is because average annual spending per head rises with a person’s age (as shown earlier in Figure 3.2, page 17), so we can expect a growth in the population aged 65 and over to have a bigger impact on NHS spend than a growth in the population aged under 65. For people aged 65 and over (Figure 6.3), Powys Teaching HB has the highest rate of population growth, increasing by 40% in total; an average of 2.3% a year. This shows that an ageing population has a much bigger impact on projection for health spending pressures than total population growth.
Figure 6.2: Projected increase in total population between 2010/11 and 2025/26, by local health board
Note: 7A1 = Betsi Cadwaladr University, 7A2 = Hywel Dda University, 7A3 = Abertawe Bro Morgannwg University, 7A4 = Cardiff and Vale University, 7A5 = Cwm Taf University, 7A6 = Aneurin Bevan University, 7A7 = Powys Teaching.
3–5%
Percentage increase
5–10%
>10%
<3%
7A1: 5.2%
7A6: 3.9%
7A7: 2.7%
7A2: 5.7%
7A3: 6.4%
7A4: 15.5%
7A5: 2.2%

37 A decade of austerity in Wales? The funding pressures facing the NHS in Wales to 2025/26
Figure 6.3: Projected increase in population aged 65+ between 2010/11 and 2025/26, by local health board
Note: 7A1 = Betsi Cadwaladr University, 7A2 = Hywel Dda University, 7A3 = Abertawe Bro Morgannwg University, 7A4 = Cardiff and Vale University, 7A5 = Cwm Taf University, 7A6 = Aneurin Bevan University, 7A7 = Powys Teaching.
30–35%
Percentage increase
35–40%
40% or over
28–30%
7A1: 31%
7A6: 31%
7A7: 40%
7A2: 32%
7A3: 29%
7A4: 37%
7A5: 28%
Input cost savingsOur analysis of demand and cost pressures for the first four years of austerity in the NHS in Wales up to 2015/16 suggests that the service will need to make savings of around £1.2 billion in 2013/14 prices. We estimated that almost two thirds of these savings will come from one-off reductions in the real-terms cost of two key inputs to health care: the pay of the workforce and the prices paid for prescription medications. It is worth noting that the change in workforce pay is a direct effect of the financial crisis and associated recession (through the depression of private sector wages). But the reduction in unit costs for prescriptions is not, so these savings would have occurred anyway.
The government has set out its approach to public sector pay up to 2015/16. As part of this, NHS employees in Wales will see further falls in their real-terms earnings. Beyond 2015/16, it will be very difficult to continue to hold down real-terms pay, with average annual earnings projected to be 1.3% lower in real terms than in 2010/11. NHS pay is set in a very different way from pay in most of the private sector, as it is determined by national, independent pay review bodies that take into account a range of factors,

38 A decade of austerity in Wales? The funding pressures facing the NHS in Wales to 2025/26
including the government’s view of affordability. Despite these very different pay-setting mechanisms, trends in NHS pay are linked to long-term wage trends for comparably skilled workers in the wider economy. Since 2008, real earnings across the economy (public and private sectors) have been falling. The OBR has forecasted real earnings growth up to 2018 (OBR, 2014). These forecasts suggest that whole economy earnings will not start to outpace whole economy inflation (the GDP deflator) until 2015. Table 6.1 shows the OBR estimates for UK-wide whole economy earnings from 2015 to 2018.
Further reductions in pay beyond 2015/16 would be difficult for the government to implement without impacting on recruitment and retention (Institute for Fiscal Studies, 2013). In our analysis we have therefore assumed that the average earnings of NHS staff in Wales will start to increase in 2016/17, rising by 2.2% a year in real terms. This will lead Welsh NHS staff pay to follow a very similar path to earnings growth across the whole economy. We have made no allowance for additional ‘catch-up awards’ for NHS staff to restore the real-terms value of the earnings. There is clearly a risk of such awards, but research suggests that by 2015/16, public sector earnings, while lower in real terms, will not have fallen behind their private sector counterparts, reducing the need for catch-up awards to deal with recruitment and retention problems (Cribb, 2013).
With regard to prescriptions, the reduction in cost per prescription that has occurred in Wales is not unique to Wales; it has occurred in each of the four countries of the UK (Figure 6.4). However, the reduction has been greatest in Wales (a 5.8% a year real-terms reduction in the cost per item, compared with 5.2% in England and 3.4% in Scotland).
The reduction in cost per item is largely the result of a significant number of high-volume products, such as statins, reaching the end of their patent protection, so that generic products are a growing share of dispensed medicines. Research undertaken by the Office of Health Economics suggests that across the UK the cost of primary care prescribing will continue to fall in real terms up to 2015, after which it will be broadly flat to 2018 (O’Neill and others, 2014). Our modelling work shows unit costs of drugs dispensed in the community continuing to fall to 2015, although at a slower rate to that observed up to 2010. The true extent to which drug spending can fall at such a rapid rate for another five
Table 6.1: OBR forecast for UK whole economy average earnings growth, 2015 to 2018
Year 2015 2016 2017 2018
Nominal increase in whole economy average earnings
3.2% 3.6% 3.7% 3.8%
GDP deflator* 1.6% 1.8% 1.9% 2%
Real increase in whole economy average earnings
1.6% 1.8% 1.8% 1.8%
* A measure of general inflation in the domestic economy, usually expressed in terms of an index figure.

39 A decade of austerity in Wales? The funding pressures facing the NHS in Wales to 2025/26
years is uncertain and presents a risk to the health budget up to 2015. We have assumed that after 2015 the unit cost will stabilise and grow in line with whole economy inflation.
We observed a fall in the number of outpatient appointments and non-elective inpatient admissions per person a year between 2010/11 and 2012/13, alongside a reduction in the average length of stay for all inpatient spells. At the same time, there was an increase in the number of elective inpatient admissions, largely driven by an increase in day case admissions. We estimated the potential for further savings from improved acute sector efficiency by assuming that these trends continue up to 2015/16. We assumed that it is not feasible to realise the full unit cost of this reduced activity as a saving to providers, given the evidence on the nature of hospitals’ costs – many of which are fixed (Department of Health and NHS Confederation, 2010). Instead we factored in a saving equivalent to the variable cost component and one third of the semi-fixed element of cost by 2015/16. We later explored the impact of releasing the remaining two thirds of semi-fixed costs by 2025/26. In essence, these semi-fixed costs are the cost of staff required to deliver the activity. Following the publication of the public inquiry report into Mid Staffordshire NHS Foundation Trust (Francis, 2013), there has been a focus on the numbers of frontline
Figure 6.4: Net ingredient cost per item prescribed in the UK between 2003/04 and 2011/12
£16
£14
£12
£10
£8
£6
£4
£2
£0
2003
/04
2004
/05
2005
/06
2006
/07
2007
/08
2008
/09
2009
/10
2010
/11
2011
/12
Year
England Scotland Northern IrelandWales
Cos
t per
item
Note: Data for Northern Ireland for 2011/12 were not available at the time of writing.
40 A decade of austerity in Wales? The funding pressures facing the NHS in Wales to 2025/26
staff employed in NHS hospitals (Thorlby and others, 2014). The result of this may be that the NHS in Wales will look to increase staff numbers, and so potential savings from reduced activity may be even more difficult to realise in practice.
Efficiency improvement in the Welsh NHSThe scale of the funding challenge implied by our demand pressures will depend not only on decisions about the level of NHS funding in Wales, but also crucially on the rate of efficiency improvement of the NHS in Wales over the coming years.
Across Welsh acute hospitals, the last two years have seen:
• an increase in the rate of day case operations
• a fall in the average length of stay for inpatient spells
• a reduction in the ratio of first to follow-up outpatient appointments
• lower rates of emergency admissions.
In the English NHS these were all metrics used in the ‘Better Care, Better Value’ (NHS Institute for Innovation and Improvement, 2012) series as indicators of improved hospital efficiency. Our estimates for the size of the potential cost savings in Wales by 2015/16 are based on these observed changes between 2010/11 and 2012/13. We have shown that if these trends can be maintained up to 2015/16, they will contribute towards, but not fully close, the projected funding gap.
Beyond 2015/16, we have seen that even in our most optimistic funding scenario, whereby Welsh NHS funding grows in line with forecast GDP growth, further efficiency savings of 1.5% a year in real terms would be required on top of those made between 2010/11 and 2015/16. This is below the trend rate of potential productivity growth across the whole economy, which is estimated at 2% a year (OBR, 2014). In our worst-case funding scenario, the rate of efficiency growth requirement to bridge the funding gap would be 5.8% a year, which is several times greater than the whole economy trend rate of productivity improvement.
The scope for high rates of productivity improvement is generally considered more limited in the health sector than the economy as a whole due to the labour intensive nature of health care (Baumol, 2012). Notwithstanding this, NHS productivity has been improving over recent years. The ONS estimates that across the UK, NHS productivity rose by 0.5% a year between 1997 and 2010 (Pope, 2013). More recent estimates for the English NHS show a higher rate of productivity growth at an average of 1% a year since 2005, but most notably productivity between 2010 and 2012 increased by just over 2% a year (Bojke and others, 2014). It remains to be seen whether this level of productivity can be sustained over a longer time period.
There may be other potential areas for productivity improvement. A study by the Health Foundation for Monitor (the NHS financial regulator for England) suggests that across existing services in England there is scope for further productivity savings (Churchill and Dixon, 2014). But although saving opportunities were identified, they could not bridge the gap between pressures increasing at around 4% a year and a flat real-terms funding settlement in the longer term. Figure 6.5 shows the sources and scale of productivity improvements and financial savings in England under a flat real-terms funding scenario, which results in a funding gap of £30 billion up to 2021/22.

41 A decade of austerity in Wales? The funding pressures facing the NHS in Wales to 2025/26
Figure 6.5: Sources of potential NHS productivity gains and savings in the English NHS to 2021/22
* �e point estimate is the ‘best-guess’ single-value estimate.
30
25
20
15
10
5
0
30
6.5
12.1
2.44
1.7 1.9
57.5
£ bi
llion
NHS funding gap
Improvingproductivity
within existingservices
Delivering theright care in the
right settings
Developing new ways of
delivering care
Pay Estatesales
Total potential productivity gains: £10.6–£18 billion
Total potential one-o� savings:
£12.5 billion
Lower boundUpper boundPoint estimate*
Source: Monitor, 2013
For this report we have not explored a scenario whereby the trend in the number of consultations at GP practices changes substantially from the pre-2010/11 trend, due to a lack of evidence on which to base an assumption. There are fewer whole-time equivalent GPs per 1,000 population in Wales than in England and Scotland (Bevan and others, 2014). This provides one example where there may be scope to reduce the overall cost burden on the Welsh NHS through additional investment in primary sector services, to reduce activity from the relatively more expensive acute sector.
The strategy for productivity improvement in Wales was set out by the Minister for Health and Social Services through the implementation of ‘a prudent health care approach’ (Drakeford, 2014, p. 9). In addition to principles for avoiding waste, this would require ‘minimum appropriate intervention’, whereby ‘treatment should begin with the basic proven tests and interventions, calibrating intensity of testing and treatment consistent with the seriousness of the illness and the patient’s own goals’ (2014, p. 10). The Bevan Commission (Mansel and others, 2013) advised that the best outcomes can be achieved for Welsh patients by ensuring that:
• health care fits the needs and circumstances of the citizen
• waste and harm are actively avoided
• care that brings little or no benefit is abandoned
• limited financial resources that can be drawn on are fully exploited.

42 A decade of austerity in Wales? The funding pressures facing the NHS in Wales to 2025/26
The ‘1000 lives’ White Paper (MacArthur and others, 2012), published in 2012, provides a series of local initiatives that are being used to save money while providing a higher quality of service through measures such as enhanced recovery after surgery, and early supported discharge following stroke. Although the quoted value of savings is small in relation to the total funding gap (around £1 million a year was saved by one health board through re-organising the delivery of continuing health care), they demonstrate that in Wales – as in England – there is scope for further productivity improvement within the current system.
Our results suggest that, if input costs can be reduced in real terms as planned, and current rates of productivity improvement continue, the NHS in Wales should be able to reduce spending to within 4% of the planned budget by 2015/16, but there would still be a funding gap of £220 million in 2013/14 prices. If funding were to continue to be held below inflation after 2015/16, unprecedented and unidentified productivity gains would be required at a rate greater than those we have estimated will be achieved between 2010/11 and 2015/16. These would need to be sustained for a period not seen either in the history of the NHS or in other countries.
If Welsh NHS funding grew in line with GDP for the decade after 2015/16, further sustained productivity growth of around 1.5% would be required. This is above the UK trend, but in line with evidence from studies of recent short-term trends in the English NHS, although we do not know how long the English NHS will be able to maintain this.

Baumol WJ (2012) The Cost Disease: Why computers get cheaper and health care doesn’t. Yale University Press.
BBC (2013) ‘Extra £570m NHS funding in Welsh draft budget’. www.bbc.co.uk/news/uk-wales-politics-24446450 .
Bevan G, Karanikolos M, Exley J, Nolte E, Connolly S and Mays N (2014) The Four Health Systems of the United Kingdom: How do they compare? Nuffield Trust.
Bojke C, Castelli A, Grasic K and Street A (2014) Productivity of the English National Health Service from 2004/5: Updated to 2011/12. Centre for Health Economics, University of York.
Carrin G, Buse K, Heggenhougen K and Q uah SR (2009) Health Systems Policy, Finance, and Organization. Elsevier.
Churchill E and Dixon J (2014) Closing the NHS Funding Gap: Can it be done through greater efficiency? The Health Foundation.
Crawford R and Emmerson C (2012) NHS and Social Care Funding: The outlook to 2021/22. Nuffield Trust and Institute for Fiscal Studies.
Cribb J (2013) Public Sector Pay and Employment: Post-spending round briefing. Institute for Fiscal Studies.
Curtis L (2010) Unit Costs of Health and Social Care. Personal Social Services Research Unit.
Department of Health (2004) Chronic Disease Management: A compendium of information. Department of Health Publications.
Department of Health (2011) ‘HCHS Pay and Prices Series 2010–11’. www.info.doh.gov.uk/doh/ finman.nsf/af3d43e36a4c8f8500256722005 b77f8/276315c0677bf5478025796b00418a4d? OpenDocument .
Department of Health and NHS Confederation (2010) Provider Economics Impact Assessment Model. Department of Health.
Drakeford M (2014) ‘Welsh NHS Confederation speech’, January. www.ctrtraining.co.uk/ documents/HealthMinisterSpeechtoNHS ConfederationJan2014.pdf .
Francis R (2013) Report of the Mid Staffordshire NHS Foundation Trust Public Inquiry. www.midstaffspublicinquiry.com/report .
HM Treasury (2010a) Funding the Scottish Parliament , National Assembly for Wales and Northern Ireland Assembly. The Stationery Office.
HM Treasury (2010b) Spending Review 2010. Cm 7942. The Stationery Office.
HM Treasury (2011) Autumn Statement 2011. Cm 8231. The Stationery Office.
HM Treasury (2013) HMT Public Expenditure Statistical Analyses 2013. Cm 8663. The Stationery Office. https://www.gov.uk/government/uploads/ system/uploads/attachment_data/file/223600/ public_expenditure_statistical_analyses_2013.pdf .
HM Treasury (2014) GDP Deflators at Market Prices, and Money GDP: March 2014 (q uarterly national accounts). https://www.gov.uk/government/publications/gdp-deflators-at-market-prices-and-money-gdp-march-2014-quarterly-national-accounts .
Institute for Fiscal Studies (2013) ‘Hard choices ahead for government cutting public sector employment and pay’. www.ifs.org.uk/publications/7009 .
MacArthur H, Phillips C and Simpson H (2012) Improving Q uality Reduces Costs: Q uality as the business strategy. 1000 Lives Plus.
Mansel A, Phillips C and Howson H (2013) Simply Prudent Healthcare: Achieving better care and value for money in Wales – discussion paper. Bevan Commission.
Massey F and Caul S (2014) Public Service Productivity Estimates: Total public services 2010, addendum. Office for National Statistics.
Monitor (2013) Closing the NHS Funding Gap: How to get better value health care for patients.
National Assembly for Wales (2009) The Barnett Formula: Funding the devolved administrations. National Assembly for Wales.
NHS Employers (2012) The NHS Employers Organisation Submission to the NHS Pay Review Body: 2013/14. NHS Employers.
4343 A decade of austerity in Wales? The funding pressures facing the NHS in Wales to 2025/26
References

NHS Employers (2014) NHS Pension Scheme Governance Group Response. NHS Employers.
NHS Institute for Innovation and Improvement (2012) Better Care, Better Value Indicators. Department of Health.
NHS Wales Informatics Service (2014a) ‘PEDW Data Online’. www.infoandstats.wales.nhs.uk/page.cfm?orgid=869&pid=40977 .
NHS Wales Informatics Service (2014b) ‘Accident and Emergency’. www.infoandstats.wales.nhs.uk/page.cfm?orgid=869&pid=62956 .
O’Neill P, Mestre-Ferrandiz J, Puig-Peiro R and Sussex J (2014) Projecting Expenditure on Medicines in the NHS. Second Edition. Office of Health Economics.
Office for Budget Responsibility (2014) Economic and Fiscal Outlook. Cm 8820. The Stationery Office.
Organisation for Economic Co-operation and Development (2013) Health at a Glance 2013: OECD indicators. OECD.
parliament.uk (2013) ‘General election timetable 2015’. www.parliament.uk/about/how/elections-and-voting/general/general-election-timetable-2015/ .
Pope N (2013) Public Service Productivity Estimates: Total public services, 2010. Office for National Statistics.
Roberts A (2014: forthcoming) A Decade of Austerity in Wales? The funding pressures facing the NHS in Wales to 2025/26: Technical appendix. Nuffield Trust.
Roberts A, Marshall L and Charlesworth A (2012) A Decade of Austerity: The funding pressures facing the NHS from 2010/11 to 2021/22. Nuffield Trust.
Royal Pharmaceutical Society (2014) British National Formulary 67. Pharmaceutical Press.
StatsWales (2011) ‘Population projections by local authority and year’. https://statswales.wales.gov.uk/Catalogue/Population-and-Migration/Population/Projections/Local-Authority/2011-Based/PopulationProjections-by-Local Authority-Year .
Thorlby R, Smith J, Williams S and Dayan M (2014) The Francis Report: One year on: The response of acute trusts in England. Nuffield Trust.
UK Data Service (2011) ‘Welsh Health Survey’. http://discover.ukdataservice.ac.uk/series/?sn= 2000057 .
Welsh Government (2013) WCR1 – Welsh Costing Return 2011/12.
Welsh Government (2014) Personal communication to the authors, 27 March.
A decade of austerity in Wales? The funding pressures facing the NHS in Wales to 2025/2644

45 A decade of austerity in Wales? The funding pressures facing the NHS in Wales to 2025/26
Adam RobertsAdam Roberts is a Senior Research Analyst at the Nuffield Trust. He joined the Trust in November 2010 from Humana Europe, where he led a team analysing costed acute data to identify potential issues for NHS commissioners. During his time at Humana he developed a strong understanding in commissioning of secondary care services, NHS acute data, national Payment by Results (PbR) tariffs and PbR rules for acute contracting and invoice validation.
Prior to joining Humana, Adam was responsible for the production of risk estimates of NHS organisations for the Care Q uality Commission (and the former Healthcare Commission) to support the programme of targeted inspections. These estimates were generated by applying cutting-edge methods to all relevant and available data sources, both quantitative and qualitative, to identify areas of possible concern for the commission to follow up.
Anita CharlesworthAnita Charlesworth is Chief Economist at the Health Foundation. She leads a team responsible for the Foundation’s work in economics.
Anita joined the Health Foundation from the Nuffield Trust where she led on analysis of financing and market reforms in health care. Prior to this she had been Chief Analyst and Chief Scientific Advisor at the Department for Culture, Media & Sport. Previously, Anita was Director of Public Spending at the Treasury, where she led the team working with the late Sir Derek Wanless on his reform of NHS funding. Anita has a Master’s degree in Health Economics from York University and has worked as an Economic Advisor in the Department of Health, and for SmithKline Beecham pharmaceuticals in the UK and USA. She is also a non-executive director at Whittington Health NHS Trust.
About the authors

46 A decade of austerity in Wales? The funding pressures facing the NHS in Wales to 2025/26
Nuffield Trust is an authoritative and independent source of evidence-based research and policy analysis for improving health care in the UK
For more information about the Nuffield Trust, including details of our latest research and analysis, please visit www.nuffieldtrust.org.uk
Download further copies of this research report from www.nuffieldtrust.org.uk/publications
Subscribe to our newsletter: www.nuffieldtrust.org.uk/newsletter
Follow us on Twitter: Twitter.com/NuffieldTrust
59 New Cavendish Street London W1G 7LPTelephone: 020 7631 8450 Facsimile: 020 7631 8451 Email: [email protected]
www.nuffieldtrust.org.uk
Published by the Nuffield Trust.© Nuffield Trust 2014. Not to be reproduced without permission.
ISBN: 978-1-905030-80-4