a cube-drop experiment - everyday math · 632 unit 7 fractions and their uses; chance and...
TRANSCRIPT

www.everydaymathonline.com
632 Unit 7 Fractions and Their Uses; Chance and Probability
Advance PreparationFor the cube-drop experiment, gather shoe box or copier-paper box bottoms or tops to contain the bouncing cubes during the experiment.
Teacher’s Reference Manual, Grades 4–6 pp. 157, 158, 160 –167
A Cube-Drop ExperimentObjective To guide students in comparing predicted and actual
results from an experiment with equally likely outcomes.
Key Concepts and Skills• Rename fractions as percents.
[Number and Numeration Goal 5]
• Use basic probability terms to describe the
likelihood of events. [Data and Chance Goal 3]
• Conduct a cube-drop experiment.
[Data and Chance Goal 4]
• Use fractions and percents to predict
the outcomes of an experiment.
[Data and Chance Goal 4]
• Compare predicted outcomes and actual
results. [Data and Chance Goal 4]
Key ActivitiesStudents color a 10-by-10 grid. They
determine the chance that a centimeter
cube, dropped onto the grid, will land
on a particular color. They perform the
experiment and compare the actual results
with their predictions.
Ongoing Assessment: Informing Instruction See page 635.
Ongoing Assessment: Recognizing Student Achievement Use a Math Log or Exit Slip (Math Masters, page 388 or 389). [Data and Chance Goal 4]
MaterialsMath Journal 2, pp. 213 – 215
Study Link 7 �11
Math Masters, p. 238; p. 388 or 389 (optional)
colored pencils, markers, or crayons
(yellow, red, green, blue) � per partnership:
1 cm cube � slate � shoe box or
copier-paper box (optional)
Reviewing Place Value in Whole NumbersMath Journal 2, p. 216
Students solve place-value problems.
Decomposing FractionsMath Masters, p. 397
Geometry Template (optional) �
pattern blocks (optional)
Students decompose fractions into
sums of fractions.
Math Boxes 7�12Math Journal 2, p. 217
Students practice and maintain skills
through Math Box problems.
Study Link 7�12Math Masters, p. 239
Students practice and maintain skills
through Study Link activities.
READINESS
Renaming Fractions as PercentsMath Masters, p. 240
base-10 blocks (1 flat, 10 longs, cubes)
Students use base-10 blocks to model
fractions and their percent equivalents.
ENRICHMENTComparing Actual and Expected Results of 1,000 Cube DropsMath Masters, pp. 241, 242, and 388 or 389
Students combine the results of 1,000 actual
cube drops and compare them with the
expected results.
EXTRA PRACTICE
5-Minute Math5-Minute Math™, pp. 42– 47
Students solve probability problems.
ELL SUPPORT
Building a Math Word BankDifferentiation Handbook, p. 140
Students add the terms predicted and actual
to their Math Word Banks.
Teaching the Lesson Ongoing Learning & Practice Differentiation Options
��������
eToolkitePresentations Interactive Teacher’s
Lesson Guide
Algorithms Practice
EM FactsWorkshop Game™
AssessmentManagement
Family Letters
CurriculumFocal Points
Common Core State Standards
632_EMCS_T_TLG2_G4_U07_L12_576906.indd 632632_EMCS_T_TLG2_G4_U07_L12_576906.indd 632 3/3/11 2:51 PM3/3/11 2:51 PM

1. If this spinner is spun 24 times, how many times do you expect it to land on each color?
a. Fill in the table.
Color Expected Number in 24 Spins
red 8blue 8
yellow 4green 4Total 24
b. Explain how you determined the expected number of times the spinner would land on each color.
Sample answer: Red and blue each cover �26� or �
13�
of the circle. �13� of 24 spins is 8 spins. Green and
yellow each cover �16� of the circle. �
16� of 24 spins is
4 spins.
2. If a six-sided die is rolled 12 times, how many times would you expect to roll
a. an odd number?
b. a number less than 4?
c. a 6?
d. a square number?
e. a triangular number?
f. a prime number? 66
42
66
Expected Spinner ResultsLESSON
7�12
Date Time
82–86
yellow
red
blue green
blue
red
Try This
Math Journal 2, p. 213
Student Page
Lesson 7�12 633
1 Teaching the Lesson
� Math Message Follow-Up WHOLE-CLASSDISCUSSION
(Math Journal 2, p. 213)
Discuss the answers to Problems 1 and 2, and have students explain their reasoning. Ask whether students would be surprised if their predictions were not fulfilled exactly. Discuss why the actual results for 24 spins and 12 rolls might not match the predicted outcomes. The predictions are based on what is likely to happen; the actual outcomes will probably differ from the predictions.
Explain that this lesson involves an experiment in which students will compare their predicted outcomes with actual results.
� Predicting the Result of INDEPENDENTACTIVITY
an Experiment(Math Journal 2, p. 214; Math Masters, p. 238)
Direct students to color the grid on Math Masters, page 238 according to the directions given.
Students can color the squares using any pattern they choose as long as they end up with the specified number of squares of each color. (Students will actually color only 50 of the squares.)
Have students read about the cube-drop experiment on journal page 214. Ask:
● If a cube is dropped onto the 10-by-10 grid, on which color is it most likely to land? White, because there are more white squares than squares of any other color
● On which color is it least likely to land? yellow
Have students complete the page on their own.
PROBLEMBBBBBBBBBBOOOOOOOOOOOBBBBBBBBBBBBBBBBBBBBBBBBBBBB MMMMMEEMMMBLEBLLEBLBLELLLBLEBLEBLEBLEBLEBLEBLEBLEEEMMMMMMMMMMMMMMOOOOOOOOOOOBBBBBBBLBLBLBLBLBLLLLLLLPROPROPROPROPROPROPROPROPROPROPROPRPPRPPPPPPPPPPPPPPPPPPPPPPPPPPPPPPPPPPPPPPPPPPROROROOROROOROOPPPPPPP MMMMMMMMMMMMMMMMMMMMMEEEEEEEEEEEEEEEELELELEEEEEEEEELLLLLLLLLLLLLLLLLLLLLRRRRRRRRRRRRRRRRRPROBLEMSOLVING
BBBBBBBBBBBBBBBBBBB EELEMMMMMMMMOOOOOOOOOOBBBBLBLBLBLBBLBBOOOROROROROROROROROROROO LELELELEEEEEELEMMMMMMMMMMMMLEMLLLLLLLLLLLLLLLLLLLLRRRRRRRRRRRGGGGLLLLLLLLLLLLLVINVINVINVINVINVINNNNVINVINNVINVINVINVINV GGGGGGGGGGGOOOLOOLOLOOLOO VINVINVINVLLLLLLLLLLVINVINVINVINVINVINVINVINVINVINVINVINVINVINNGGGGGGGGGGOOOLOLOLOLOLOLOOLO VVVVLLLLLLLLLLVVVVVVVVVVVOOSOSOOSOSOSOSOSOSOSOOSOSOSOSOOOSOOOSOSOSOSOSOSOSOOOSOOSOSOSOSOSOSSSSSSSSSSSSSSSSSSSSSSSSSSSSSSSSSSSSSSSS VVVVVVVVVVVVVVVVVVVVVVLLLLLVVVVVVVVVLLLVVVVVVVLLLLLLLVVVVLLLLLLLLLLLLLLLLLLLLLLLLLLLLLLLLLLLLLLLLLSSSSSSSSSSSSSSSSSSSS GGGGGGGGGGGGGGGGGGOOOOOOOOOOOOOOOOOOOO GGGGGGGGGGGGGGGGGGGGGGGGGGGGGGGGGGGGGGGGGGGGNNNNNNNNNNNNNNNNNNNNNNNNNNNNIIIIIIIIIIIIIIIIIIIIISOLVING
Getting Started
Math MessageComplete journal page 213.
Study Link 7�11 Follow-UpHave students share their spinner designs and descriptions in small groups.
Mental Math and Reflexes Write fractions with denominators of 10 or 100 on the board, and have students write the equivalent decimals on their slates. Then write decimals on the board and tell students to write the equivalent fractions and mixed numbers. Do not insist that they write fractions in simplest form. Suggestions:
2
_ 10
0.2
50 _
100 0.50
0.24 24
_ 100
0.60 60
_ 100
8
_ 100
0.08
72
_ 1,000
0.072
0.03 3
_ 100
0.029 29
_ 1,000
7 6
_ 1,000
7.006
32 1
_ 100
32.01
1.9 1 9
_ 10
6.5 6 5
_ 10
EM3cuG4TLG2_633-637_U07L12.indd 633EM3cuG4TLG2_633-637_U07L12.indd 633 1/20/11 9:13 AM1/20/11 9:13 AM

634 Unit 7 Fractions and Their Uses; Chance and Probability
Predicted Results of 100 Cube Drops Number of Predicted Results
Color Squares Fraction Percent
yellow 1 1 _
100 1 %
red 4 4
___ 100 4 %
green 10 10
___ 100 10 %
blue 35 35
__ 100
35 %
white 50 50
___ 100 50 %
Total 100 1 100%
A Cube-Drop ExperimentLESSON
7�12
Date Time
Getting Ready
1. Follow the directions for coloring the grid on Math Masters, page 238. You may
color the squares in any way. The colors can even form a pattern or a picture.
2. For this experiment, you are going to place your grid on the floor and hold a
centimeter cube about 2 feet above the grid. Without aiming, you will let it drop
onto the grid. You will then record the color of the square on which the cube
finally lands.
� If the cube does not land on the grid, the drop does not count.
� If the cube lands on more than one color, record the color that is covered
by most of the cube. If you cannot tell, the toss does not count.
Making a Prediction
3. On which color is the cube most likely to land? white
4. On which color is it least likely to land? yellow
5. Suppose you were to drop the cube 100 times. How many times would you
expect it to land on each color? Record your predictions below.
80–86
185-218_EMCS_S_MJ2_G4_U07_576426.indd 214 1/27/11 10:51 AM
Math Journal 2, p. 214
Student Page
Adjusting the Activity Have students describe how dropping a cube onto a colored grid and
spinning a spinner are similar. Look for answers such as the following:
� For both the grid and the spinner, the
chance of landing on a specific color is
the fraction of times you expect to land
on that color. For example, if 4 out of
every 100 squares on a grid or sections
on a spinner are colored red, then the
chance of landing on red is 4
_ 100 , or
4 out of 100, or 4%.
AUDITORY � KINESTHETIC � TACTILE � VISUAL
NOTE Have students kneel when dropping the cube, or place something under
the grid to cushion the cube drop and reduce the bounce.
My Results for 50 Cube Drops
Color Number of Drops Percent
yellow 1 2%
red 2 4%
green 3 6%
blue 16 32%
white 28 56%
Total 50 100%
Ongoing Assessment: Informing Instruction
Watch for students who note that converting fractions to percents in this activity is
similar to calculating percent scores on the multiplication facts tests.
Bring the class together to share predicted outcomes. Encourage statements such as the following:
� “Only 1 square out of 100 is yellow, so I should hit yellow about once out of every 100 drops. The chance of the cube landing on yellow is 1 out of 100.”
� “White is easy. Half of the squares are white, so I would hit white half of the time. If I dropped the cube 100 times, it would hit white 50 times. If I dropped the cube 50 times, it would hit white 25 times.”
� “For green, it is 10 out of 100. So I expect 10 greens if I toss 100 times. If I toss 500 times, I should get 5 times as many—that’s 50 greens.”
� Performing a Cube-Drop PARTNER ACTIVITY
Experiment(Math Journal 2, p. 215; Math Masters, p. 238)
Review the directions on journal page 215. Have partners take turns performing the experiment:
1. One partner drops a cube 50 times onto his or her 10-by-10 grid. The other partner records the results in the first partner’s journal.
2. Partners switch roles.
3. Students count the number of drops for each color and complete the “My Results for 50 Cube Drops” table on journal page 215. (See sample table below.)
633-637_EMCS_T_TLG1_U07_L12_576906.indd 634633-637_EMCS_T_TLG1_U07_L12_576906.indd 634 1/27/11 3:43 PM1/27/11 3:43 PM

Doing the Experiment
You and your partner will each drop a centimeter cube onto your own colored grid.
6. One partner drops the cube. The other partner records the color in the grid below
by writing a letter in one of the squares. Drop the cube a total of 50 times.
Write
y for yellow,
r for red,
g for green,
b for blue, and
w for white.
7. Then trade roles. Do another 50 drops, and record the results in the other
partner’s journal.
8. Count the number for each color.
Write it in the “Number of
Drops” column.
Check that the total is 50.
9. When you have finished, fill in the percent column in the table.
Example: If your cube landed on blue 15 times out of 50 drops, this is the same as
30 times out of 100 drops, or 30% of the time.
A Cube-Drop Experiment continuedLESSON
7�12
Date Time
My Results for 50 Cube Drops Number of Color Drops Percent
yellow 1 2% red 2 4% green 3 6% blue 16 32% white 28 56% Total 50 100%
w w w b w r g b b b
y w b w w b r w b w
w g w w b w b b w
w b w w w b w b b w
w w b g w w w w w w
b
Sample answers:
Sample answer:
185-218_EMCS_S_MJ2_G4_U07_576426.indd 215 1/27/11 10:51 AM
Math Journal 2, p. 215
Student Page
216
Place Value in Whole NumbersLESSON
7�12
Date Time
4
3. Write the greatest number you can make
with the following digits:
3 5 0 7 9 2
975,320
4. What is the value of the digit 8 in the
numerals below?
a. 807,941 800,000
b. 583 80
c. 8,714 8,000
d. 86,490 80,000
1. Write these numbers in order from least
to greatest.
964 9,460 96,400 400,960 94,600
964
2. A number has
5 in the hundreds place,
7 in the ten-thousands place,
0 in the ones place,
9 in the thousands place, and
8 in the tens place.
Write the number.
7
9
, 5
8
0
5. Write each number using digits.
a. four hundred eighty-seven thousand,
sixty-three
487,063
b. fifteen thousand, two hundred
ninety-seven
15,297
6. I am a 5-digit number.
� The digit in the thousands place is the
result of dividing 64 by 8.
� The digit in the ones place is the result
of dividing 63 by 9.
� The digit in the ten-thousands place is
the result of dividing 54 by 6.
� The digit in the tens place is the result
of dividing 40 by 5.
� The digit in the hundreds place is the
result of dividing 33 by 11.
What number am I?
9
8
, 3
8
7
9,46094,60096,400
400,960
185-218_EMCS_S_MJ2_G4_U07_576426.indd 216 1/27/11 10:51 AM
Math Journal 2, p. 216
Student Page
Lesson 7�12 635
� Comparing Actual and WHOLE-CLASS ACTIVITY
Expected Results(Math Journal 2, pp. 214 and 215)
Bring students together to compare their actual results with their predictions. Individual students’ results probably show a wide range. For example, some students may have hit a white square as many as 35 out of 50 tosses (70% of the time), while others may have done so only 15 times (30% of the time). Students should notice that although some individual results may be very close to the expected results, others may be far off.
Ongoing Assessment: Math Log or
Exit Slip
Recognizing Student Achievement
Use a Math Log or an Exit Slip (Math Masters, page 388 or 389) to assess
students’ ability to predict the outcomes of an experiment and test the predictions
using manipulatives. Have students write about how the predicted outcomes for
the cube-drop experiment compare with the actual results. Students are making
adequate progress if their responses include the following:
� Some predictions are closer than others to the actual results.
� Predictions are expected results, not exactly what will happen.
Some students may be able to use the results to predict future events.
For example, what might happen if the cube were dropped 500 times?
[Data and Chance Goal 4]
2 Ongoing Learning & Practice
� Reviewing Place Value in INDEPENDENTACTIVITY
Whole Numbers(Math Journal 2, p. 216)
Students solve problems that involve ordering numbers, identifying place value, determining the values of digits, and reading and writing whole numbers.
� Decomposing Fractions PARTNER ACTIVITY
(Math Masters, p. 397)
Have students complete name-collection boxes (Math Masters, p. 397) for fractions and mixed numbers by decomposing the numbers into sums of fractions with the same denominator. Encourage students to use pattern blocks or draw pictures of pattern blocks using their Geometry Template to justify their work. Suggestions:
� 3 _ 8 � 5 _ 9 � 2 1 _ 8 � 3 2 _ 3
633-637_EMCS_T_TLG1_U07_L12_576906.indd 635633-637_EMCS_T_TLG1_U07_L12_576906.indd 635 1/27/11 3:43 PM1/27/11 3:43 PM

636 Unit 7 Fractions and Their Uses; Chance and Probability
STUDY LINK
7�12 What Are the Chances?
81
Name Date Time
1. You are going to toss 2 pennies 20 times. How many times do you expectthe 2 pennies will come up as
a. 2 heads? times b. 2 tails? times
c. 1 head and 1 tail? times
2. Now toss 2 pennies together 20 times. Record the results in the table.
Answers vary.
3. What fraction of the tosses came up as
a. 2 heads? b. 2 tails? c. 1 head and 1 tail?
4. Suppose you were to flip the coins 1,000 times.What fraction do you expect would come up as
a. 2 heads? b. 2 tails?
c. 1 head and 1 tail?
5. Explain how you got your answers for Problem 4. Sample answer:
A Penny Toss
Results Number of Times
2 heads
2 tails
1 head and 1 tail
Answers vary.
Answers vary.
Sample answers:�12,05000�, or �
14� �1
2,05000�, or �
14�
�15,00000�, or �
12�
I think it will be the same fraction for 1,000times as it is for 20 times.
Practice
6. 7 � 48 � 7. 874 � 9 �
8. � 45 � 86 9. � 34 � 1424,8283,8707,866336
Math Masters, p. 239
Study Link Master
Math Boxes LESSON
7�12
Date Time
5. Multiply. Use a paper-and-pencil algorithm.
� 46 � 2069,4766. Compare.
a. 1 day is times as long as 6 hours.
b. 6 years is times as long as 2 months.
c. 3 gallons is times as much as 4 cups.
d. 8 cm is times as long as 5 mm.
e. 1 meter is times as long as 10 cm.
1016
12
364
1. Name the shaded area as a fraction and a decimal.
a. fraction:
b. decimal:
0.63
�16030�
3. Write 6 fractions equivalent to �16�. 4. Divide. Use a paper-and-pencil algorithm.
�71659
� � 51 R4, or 51�145�
49–51 22 23179
18 19 315
2. Write �, �, or � to make each numbersentence true.
a. �38� �
78�
b. �152� �
56�
c. �14� �1
15�
d. �15,00000� �1
86�
e. �67� �
1290�
�
�
�
�
�
53 5427 61
�122� �1
38�
Sample answers
�244� �3
50�
�366� �
160000�
Math Journal 2, p. 217
Student Page
� Math Boxes 7�12 INDEPENDENTACTIVITY
(Math Journal 2, p. 217)
Mixed Practice Math Boxes in this lesson are paired with Math Boxes in Lesson 7-10. The skill in Problem 6 previews Unit 8 content.
Writing/Reasoning Have students write a response to the following: Explain the strategy you used to decide which fraction was greater in Problem 2e. Sample answer:
19 _ 20 is 1 _ 20 away from 1. 6 _ 7 is 1 _ 7 away from 1. 1 _ 20 is less than 1 _ 7 , so 19 _ 20 is closer to 1 than 6 _ 7 is.
� Study Link 7�12 INDEPENDENTACTIVITY
(Math Masters, p. 239)
Home Connection Students predict the outcome of a coin-toss experiment, check their predictions by performing the experiment, and express the results as fractions.
3 Differentiation Options
READINESS INDEPENDENTACTIVITY
� Renaming Fractions as Percents 5–15 Min
(Math Masters, p. 240)
To explore renaming fractions as percents, have students represent fractions with base-10 blocks and rename them as percents. Ask students to discuss how they solved Problems 5 and 6.
ENRICHMENT SMALL-GROUP ACTIVITY
� Comparing Actual and Expected 15–30 Min
Results of 1,000 Cube Drops(Math Masters, pp. 241, 242, and p. 388 or 389)
To further explore the effect of sample size on actual results, have students combine the class results of the cube-drop experiment to generate actual data on how
many times a cube landed on each color for 1,000 cube drops.
EM3cuG4TLG2_633-637_U07L12.indd 636EM3cuG4TLG2_633-637_U07L12.indd 636 1/20/11 9:13 AM1/20/11 9:13 AM
LESSON
7�12
Name Date Time
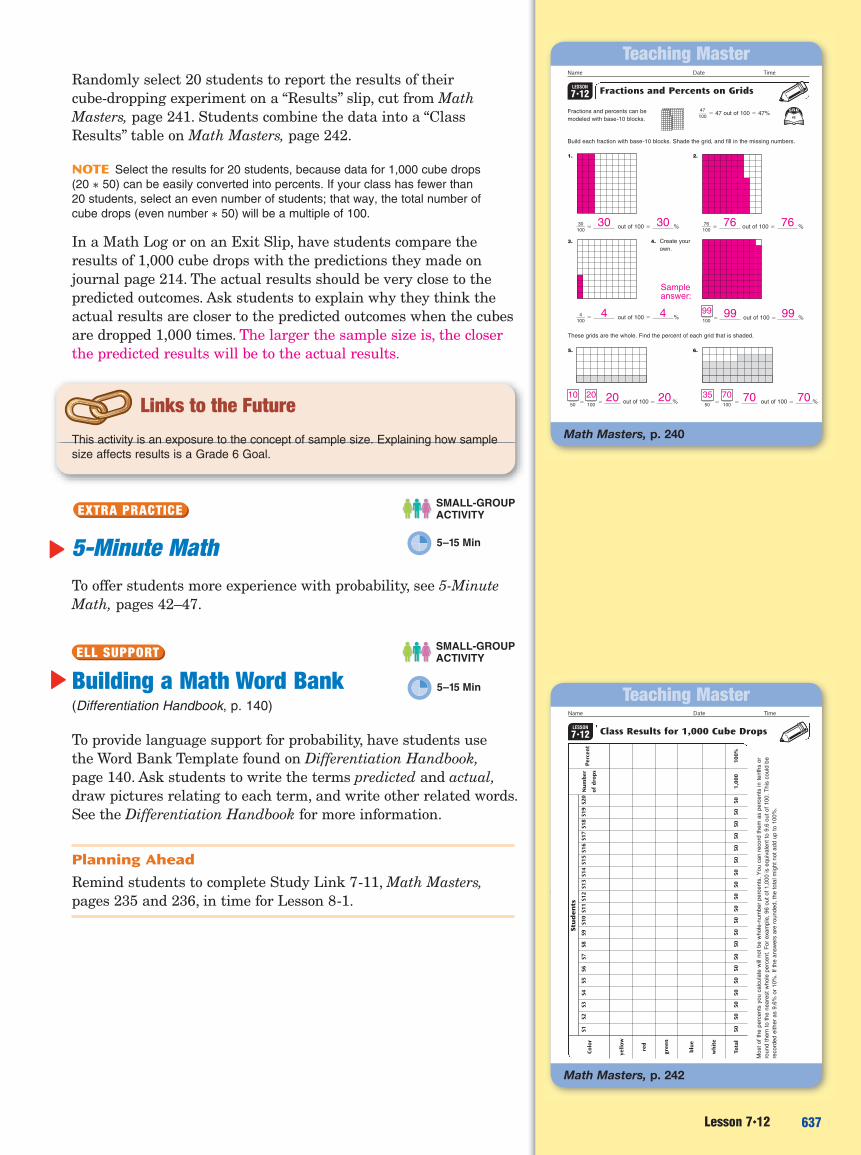
Fractions and Percents on Grids
Fractions and percents can be �14070
� � 47 out of 100 � 47%modeled with base-10 blocks.
Build each fraction with base-10 blocks. Shade the grid, and fill in the missing numbers.
These grids are the whole. Find the percent of each grid that is shaded.
5. 6.
1.
�13000� � out of 100 � %
3.
�1400� � out of 100 � %
2.
�17060� � out of 100 � %
� out of 100 � %999999�100
7676
44
3030
62
99
� � out of 100 � % � � out of 100 � %7070�100�502020�100�50
10 20 35 70
Sample answer:
4. Create your own.
Math Masters, p. 240
Teaching Master
LESSON
7�12
Name Date Time
Class Results for 1,000 Cube Drops
Stu
den
ts
Colo
rS1
S2S3
S4S5
S6S7
S8S9
S10
S11
S12
S13
S14
S15
S16
S17
S18
S19
S20
Nu
mb
er
ofd
rop
s
yell
ow
red
gree
n
blu
e
wh
ite
Tota
l50
5050
5050
5050
5050
5050
5050
5050
5050
5050
501,
000
100%
Per
cen
t
Mos
t of t
he p
erce
nts
you
calc
ulat
e w
ill no
t be
who
le-n
umbe
r per
cent
s. Y
ou c
an re
cord
them
as
perc
ents
in te
nths
or
roun
d th
em to
the
near
est w
hole
per
cent
. For
exa
mpl
e, 9
6 ou
t of 1
,000
is e
quiv
alen
t to
9.6
out o
f 100
. Thi
s co
uld
bere
cord
ed e
ither
as
9.6%
or 1
0%. I
f the
ans
wer
s ar
e ro
unde
d, th
e to
tal m
ight
not
add
up
to 1
00%
.
Math Masters, p. 242
Teaching Master
Lesson 7�12 637
Links to the Future
Randomly select 20 students to report the results of their cube-dropping experiment on a “Results” slip, cut from Math Masters, page 241. Students combine the data into a “Class Results” table on Math Masters, page 242.
NOTE Select the results for 20 students, because data for 1,000 cube drops
(20 ∗ 50) can be easily converted into percents. If your class has fewer than
20 students, select an even number of students; that way, the total number of
cube drops (even number ∗ 50) will be a multiple of 100.
In a Math Log or on an Exit Slip, have students compare the results of 1,000 cube drops with the predictions they made on journal page 214. The actual results should be very close to the predicted outcomes. Ask students to explain why they think the actual results are closer to the predicted outcomes when the cubes are dropped 1,000 times. The larger the sample size is, the closer the predicted results will be to the actual results.
This activity is an exposure to the concept of sample size. Explaining how sample
size affects results is a Grade 6 Goal.
EXTRA PRACTICE
SMALL-GROUP ACTIVITY
▶ 5-Minute Math 5–15 Min
To offer students more experience with probability, see 5-Minute Math, pages 42–47.
ELL SUPPORT SMALL-GROUP ACTIVITY
� Building a Math Word Bank 5–15 Min
(Differentiation Handbook, p. 140)
To provide language support for probability, have students use the Word Bank Template found on Differentiation Handbook, page 140. Ask students to write the terms predicted and actual, draw pictures relating to each term, and write other related words. See the Differentiation Handbook for more information.
Planning Ahead
Remind students to complete Study Link 7-11, Math Masters, pages 235 and 236, in time for Lesson 8-1.
EM3cuG4TLG2_633-637_U07L12.indd 637EM3cuG4TLG2_633-637_U07L12.indd 637 1/20/11 9:13 AM1/20/11 9:13 AM