millikan oil drop experiment - course websites · 2 5 2 2 3 0 1 (see write-up) 2/17 ... millikan...
TRANSCRIPT


Agenda
1. Measuring of the charge of electron.
2. Robert Millikan and his oil drop
experiment
3. Theory of the experiment
4. Laboratory setup
5. Data analysis
2/17/2014 2

Measuring of the charge of the electron
1. Oil drop experiment. Robert A. Millikan.. (1909). e=1.5924(17)×10−19 C
2. Shot noise experiment. First proposed by Walter H. Schottky
3. In terms of the Avogadro constant and Faraday constant 𝒆 =
𝑭
𝑵𝑨; F- Faraday constant, NA - Avagadro constant. Best
uncertainty ~1.6 ppm.
4. From Josephson (𝑲𝑱 =𝟐𝒆
𝒉) and von Klitzing 𝑹𝑲 =
𝒉
𝒆𝟐constants
5. Recommended by NIST value 1.602 176 565(35) 10-19 C
2/17/2014 3

Robert Millikan. Oil drop experiment
The Nobel Prize in Physics 1923.Robert A. Millikan "for his work on the
elementary charge of electricity and on
the photoelectric effect".
ROBERT ANDREWS
MILLIKAN
1868-1953
22nd of March, 1868, Morrison, Ill
University of Chicago2/17/2014 4

Robert Millikan. Oil drop experiment
ROBERT ANDREWS
MILLIKAN
1868-1953
Diagram and picture of apparatus
2/17/2014 5

Oil drop experiment.
Measurement of the magnitude of the electron charge!
Demonstrate that the electron charge is quantized!Motivation:
Measure the charge of an electron to ±3%
Picture of the PASCO setup
2/17/2014 6

Oil drop experiment.
V+
-500VdVg
telescope
atomizer
Oil drops ∅~1m
𝝆𝒂𝒊𝒓
Forces on the oil drop:
1) Gravity + buoyant force (air displaced by oil drop)2) Drag force of the oil drop in the air
2/17/2014 7

Oil drop experiment.
V+
-500VdVg
telescope
atomizer
Oil drops ∅~1m
𝝆𝒂𝒊𝒓
Forces on the oil drop:
1) Gravity + buoyant force (air displaced by oil drop)2) Drag force of the oil drop in the air3) Electric force on oil drops which carry charge Q
2/17/2014 8

Apparatus. Schematic Layout
135-170o
telescope
atomizer
oileyepiece
scale
spaceroil drop
oil mist
Q,m
P1
P2
500±1V
P1
Light source
2/17/2014 9

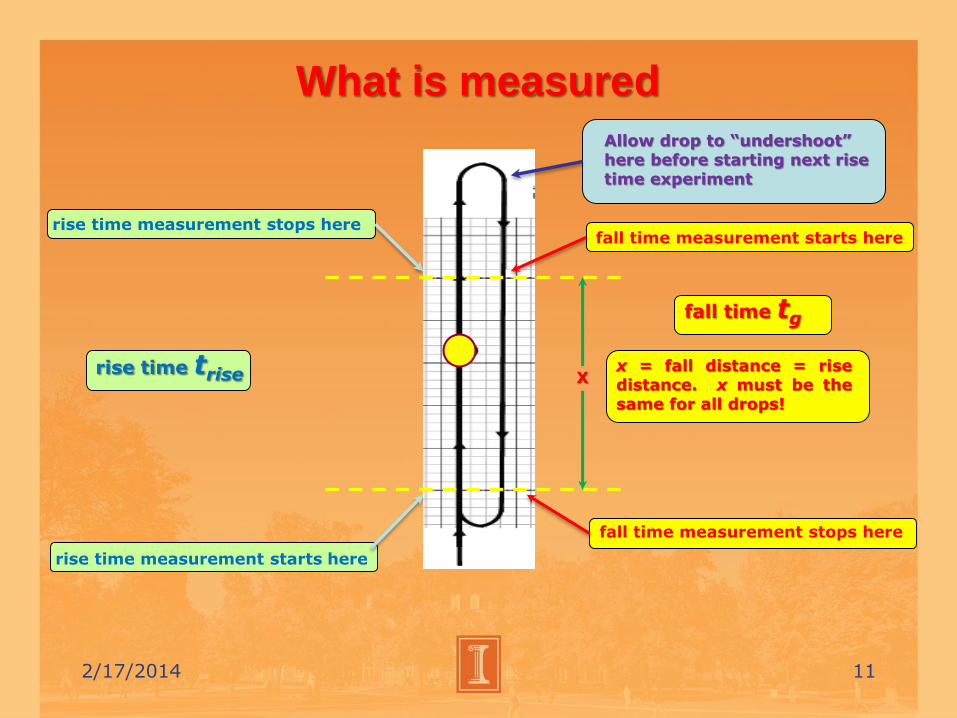
What is measured
x = fall distance = risedistance. x must be thesame for all drops!
x
fall time measurement stops here
fall time measurement starts here
fall time tg
rise time trise
rise time measurement stops here
rise time measurement starts here
Allow drop to “undershoot” here before starting next rise time experiment
2/17/2014 11

Balance of Forces: Newton’s Law
a : radius of dropρ : density ρ = ρoil – ρair
v : velocity of oil dropQ : charge of oil dropE : electric field E=V/dV : Voltage across platesη : viscosity of airg : gravitational const.
ˆ (
(3)
(2)
6
1)
dr
g
g dr
a
ag
E
g
E
F a
F mgz
F Q
dvF m F F F
v
t
E
d
𝑬
ˆgF mgz6 dragF av
EF QE
Forces on the oil drop:
(1) Gravity + buoyant force (air displaced by oil drop)
(2) Drag force of the oil drop in the air
(3) Electric force on oil drops which carry charge Q
0g drag E
F F F
0dv
dtParticle reached terminal velocity
2/17/2014 12

Modification to Stokes Law
Ebenezer Cunningham(1881-1977)
George Gabriel Stokes(1819-1903)
6drag
F av
For small particle radius (a<15m) Stokeslaw need to be corrected. This correctionwas derived by E. Cunningham.
6drag
c
aF v
f
56
1 , A 1.246, B 0.42, C 0.78
6 18 101 1 1 1 , for 10 m ,
[mmHg]
aC
c
-cc c
f A B ea a
r .f A . a r
a a p
Here a – particle
radius; λ – mean
free path of the gasmolecules
8 760 [m] 6 53 10
[mmHg]
-.p
negligible term
2/17/2014 13

We measure: tg and trise
x = fall distance = risedistance. x must be thesame for all drops!
x
fall time measurement stops here
fall time measurement starts here
fall time tg
rise time trise
rise time measurement stops here
rise time measurement starts here
Allow drop to “undershoot” here before starting next rise time experiment
2/17/2014 14
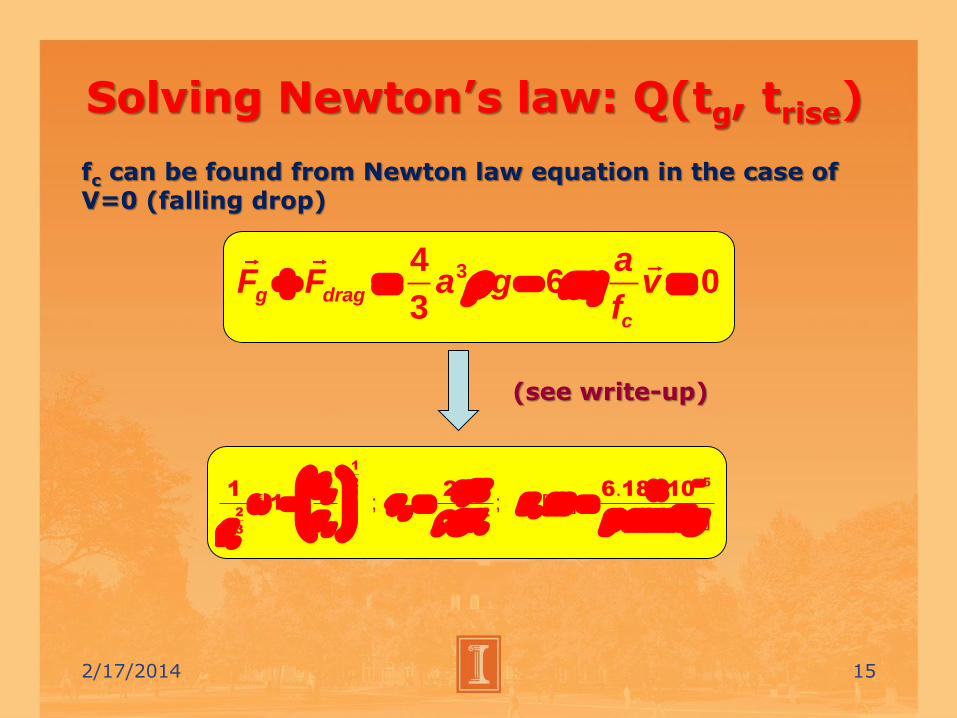
Solving Newton’s law: Q(tg, trise)
fc can be found from Newton law equation in the case of V=0 (falling drop)
346 0
3 g drag
c
aF F a g v
f
g
g c
g c
c
t xr m
gr p mmHg
f
. ; ; [ ]
[ ]
1
52
2 2
3
1 2 6 18 10
1
(see write-up)
2/17/2014 15

Solving Newton’s law: Q(tg, trise)
3 3
32
1 9 2 1 1 1
g g risec
d xQ n e
V g t t tf
Q : charge of oil dropn : number of unpaired
electrons in drope : elementary charged : plate separation
V : Voltage across plates
ρ : density ρ = ρoil – ρair
η : viscosity of airg : gravitational constantx : drift distance for oil drop tg : fall timetrise : rise time
2/17/2014 16

Route of charge calculation Q(tg, trise).
. ; ; [ ]
[ ]
g
g c
g c
c
t xr m
gr p mmHgf
1
52
3 2
2
1 2 6 18 10
1
3 3
3 2
1 9 2 1 1 1
c g riseg
d xQ F S T
f V g t tt
1
2
3 2
11
g
c g
tF
f
3 39 2d x
SV g
1 1 1
g riseg
Tt tt
2/17/2014 17

Route of charge calculation. Origin projects. Data collecting.
Projects Section L1.opj … Section L4.opg
Locations: \\engr-file-03\PHYINST\APL Courses\PHYCS401\Common\Origin templates\Oil drop experiment
\\engr-file-03\PHYINST\APL Courses\PHYCS401\Students\1.Millikan Oil Drop experiment
2/17/2014 18

Route of charge calculation. Origin projects. Data analysis.
Project: Millikan1.opj
Locations: \\Phyaplportal\PHYCS401\Common\Origin templates\Oil drop experiment
\\Phyaplportal\PHYCS401\Students\1. Millikan Oil Drop experiment
Please make a copy (not move!) of Millikan1.opj in your personal folder and start to work with your personal copy of the project
2/17/2014 19
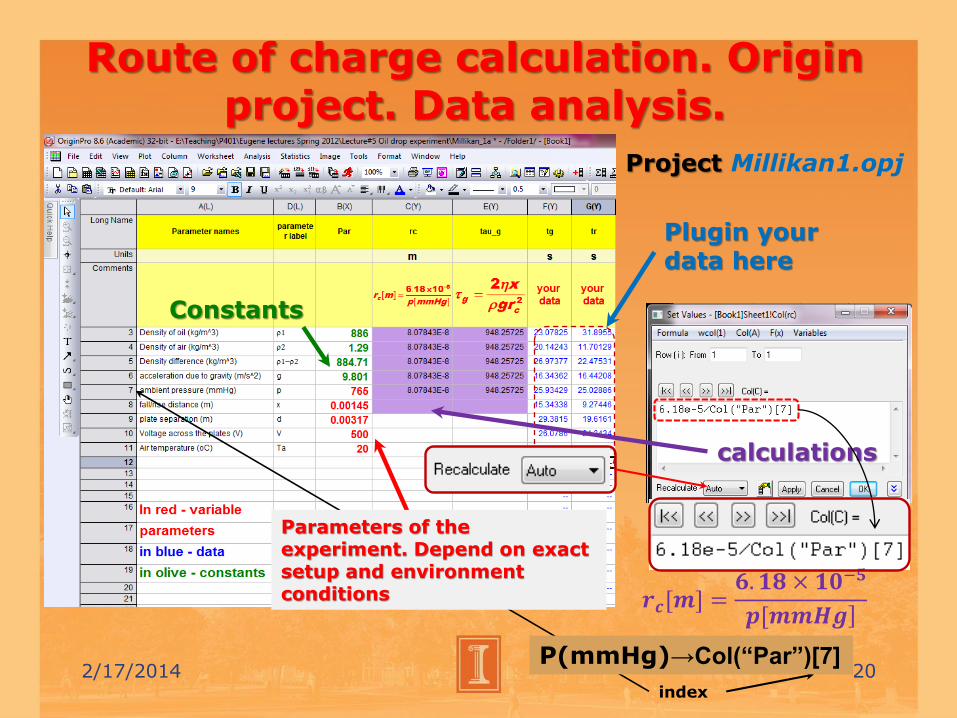
Route of charge calculation. Origin project. Data analysis.
Plugin your data here
Project Millikan1.opj
Constants
calculations
𝒓𝒄[𝒎] =𝟔. 𝟏𝟖 × 𝟏𝟎−𝟓
]𝒑[𝒎𝒎𝑯𝒈
index
Parameters of the experiment. Depend on exact setup and environment conditions
P(mmHg)→Col(“Par”)[7]2/17/2014 20

Route of charge calculation. Origin project. Data analysis.
Project Millikan1.opj
3 3
3 2
1 9 2 1 1 1
c g riseg
d xQ F S T
f V g t tt
Follow correct order of calculations: rc →g →(F,S,T) →Q →n
2/17/2014 21
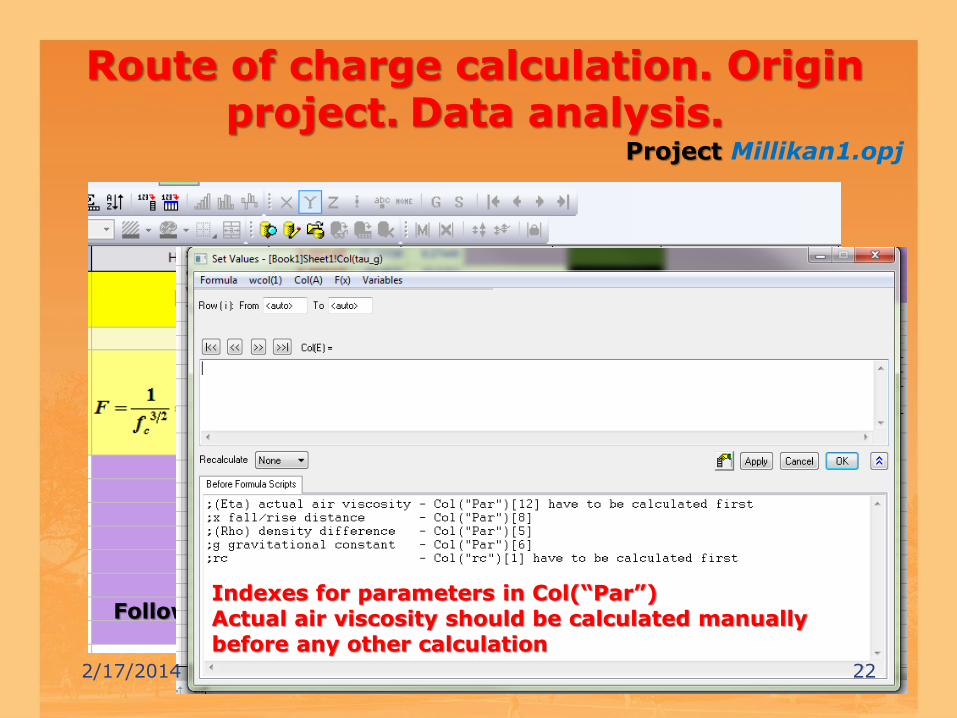
Route of charge calculation. Origin project. Data analysis.
Project Millikan1.opj
Follow correct order of calculations: rc →g →(F,S,T) →Q →nIndexes for parameters in Col(“Par”)Actual air viscosity should be calculated manually before any other calculation
2/17/2014 22

Charge calculation. Origin project.
0 1 2 3 4 5 6 7 8 9 10 110
1
2
3
4
5
6
7
n
n=
Q/e
Drop number
2/17/2014 23
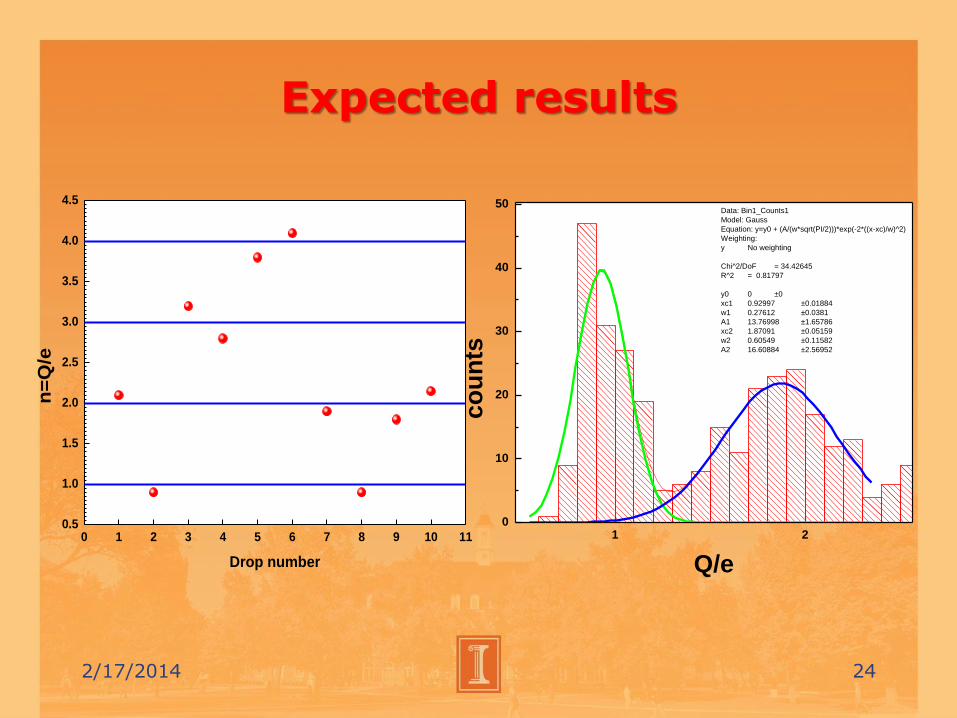
Expected results
0 1 2 3 4 5 6 7 8 9 10 110.5
1.0
1.5
2.0
2.5
3.0
3.5
4.0
4.5
n=
Q/e
Drop number
1 20
10
20
30
40
50Data: Bin1_Counts1
Model: Gauss
Equation: y=y0 + (A/(w*sqrt(PI/2)))*exp(-2*((x-xc)/w)^2)
Weighting:
y No weighting
Chi^2/DoF = 34.42645
R^2 = 0.81797
y0 0 ±0
xc1 0.92997 ±0.01884
w1 0.27612 ±0.0381
A1 13.76998 ±1.65786
xc2 1.87091 ±0.05159
w2 0.60549 ±0.11582
A2 16.60884 ±2.56952
co
un
ts
Q/e
2/17/2014 24
0 5 10 15 20 25 30 35 40 45 50 55 600
5
10
15
20
25
30
35
40
45
50
55
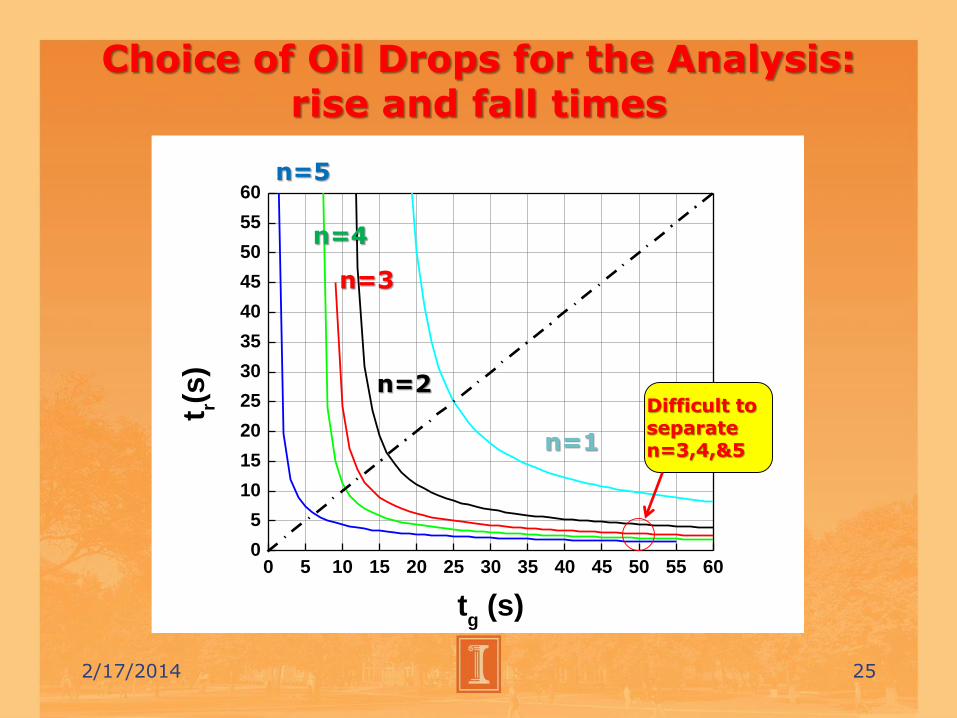
60t r(
s)
tg (s)
Difficult to separate n=3,4,&5
Choice of Oil Drops for the Analysis: rise and fall times
n=1
n=2
n=3
n=4
n=5
2/17/2014 25

Modern experiments at
•Drop generation rate 1 Hz • Fluid - Dow Corning silicon
oil •Number of drops - 17 million •Mass - 70.1 milligrams •Duration - 8 months
2/17/2014 26


Modern experiments at
“No electric charges were measured in the range of an
integer charge 1/3 e or 2/3 e.” (SLAC–PUB–7357
August 1996)
2/17/2014 28

Appendix #1
Traditional reminder:L1_Lab3_student name.pdf Report-exp2.pdf
Please upload the files in proper folder!
This week folders: Pulses in transmission lines_L1
Pulses in transmission lines_L3
Pulses in transmission lines_L4
Pulses in transmission lines_L5
This week you have the last chance to submit “Transients in RLC” report
2/17/2014 29

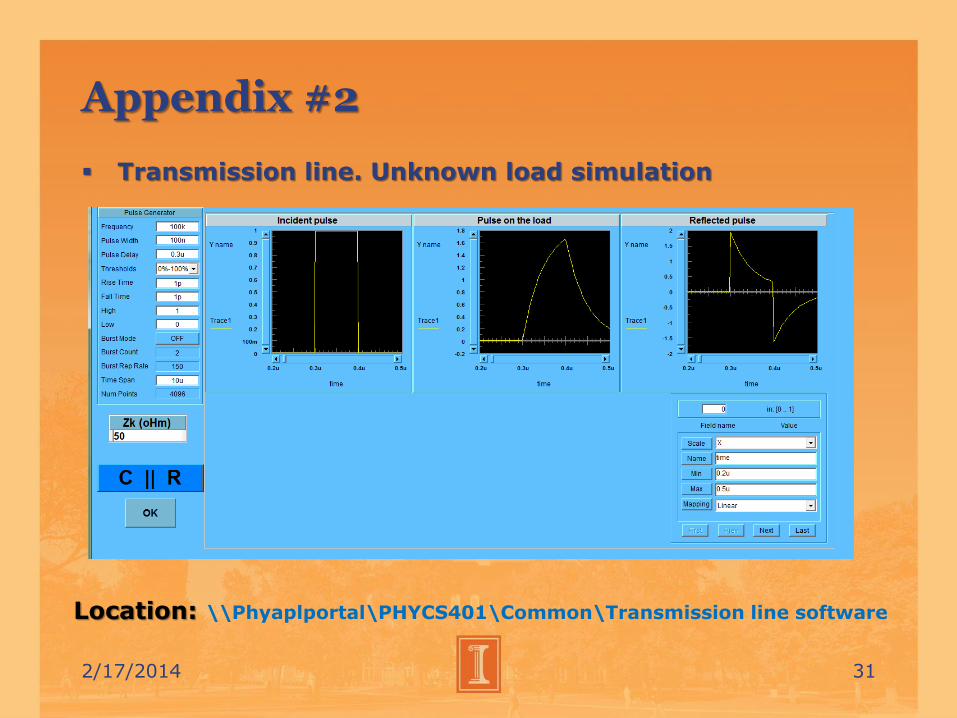
Appendix #2
Transmission line. Unknown load simulation
Location: \\Phyaplportal\PHYCS401\Common\Transmission line software
X-axes scalingFunction generator parameters
Line characteristic impedance
Expected load
Load parameters
2/17/2014 30
Appendix #2
Transmission line. Unknown load simulation
Location: \\Phyaplportal\PHYCS401\Common\Transmission line software
2/17/2014 31


Appendix #3 Graphs
2/17/2014 33
Figure 15: Odd harmonic amplitudes plotted against 1/n