a control mechanism on outbound logistics
TRANSCRIPT

A Control Mechanism on Outbound LogisticsJUNE 28, 2019
Vivian Verhaert
DEPARTMENT OF INDUSTRIAL ENGINEERING AND INNOVATION SCIENCES
Agenda
Introduction
2
Problem context
Problem analysis
Solution direction
Solution design
Conclusion

Océ-Technologies B.V. Founded in 1877 Digital imaging and industrial printing Factories in Venlo, Poing (Germany) and Penang (Malaysia) Acquired by Canon in 2010
3
Introduction ConclusionProblem analysis Solution directionProblem context Solution design

Products Printing systems Large format Cut sheet (VarioPrint i-series) Continuous feed printing
Service parts Ink and toners Media
4
Introduction ConclusionProblem analysis Solution directionProblem context Solution design

Supply chain
5
Introduction ConclusionProblem analysis Solution directionProblem context Solution design
Drop shippingSupplier
Corporate Supply CentreSupplier
Supplier
Dealer
NSO
RSHQ
RSHQ
RSHQ
NSO
End-
custo
mer
Direct drop shipping
Direct shipping
SCOPE
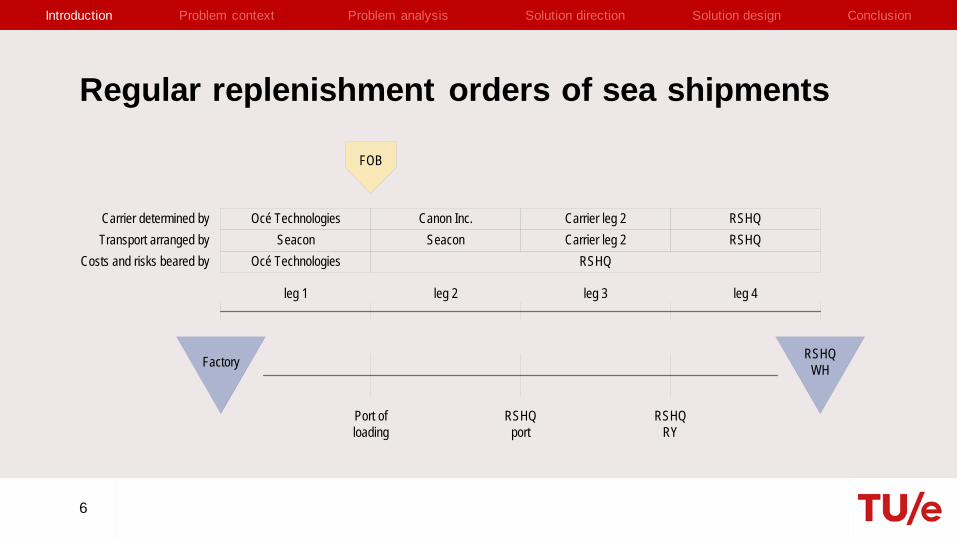
Regular replenishment orders of sea shipments
6
Introduction ConclusionProblem analysis Solution directionProblem context Solution design
leg 1
Factory RSHQWH
leg 2 leg 3
RSHQport
FOB
Océ Technologies RSHQ
leg 4
RSHQRY
Seacon Seacon Carrier leg 2 RSHQOcé Technologies Canon Inc. Carrier leg 2 RSHQ
Costs and risks beared byTransport arranged byCarrier determined by
Port of loading
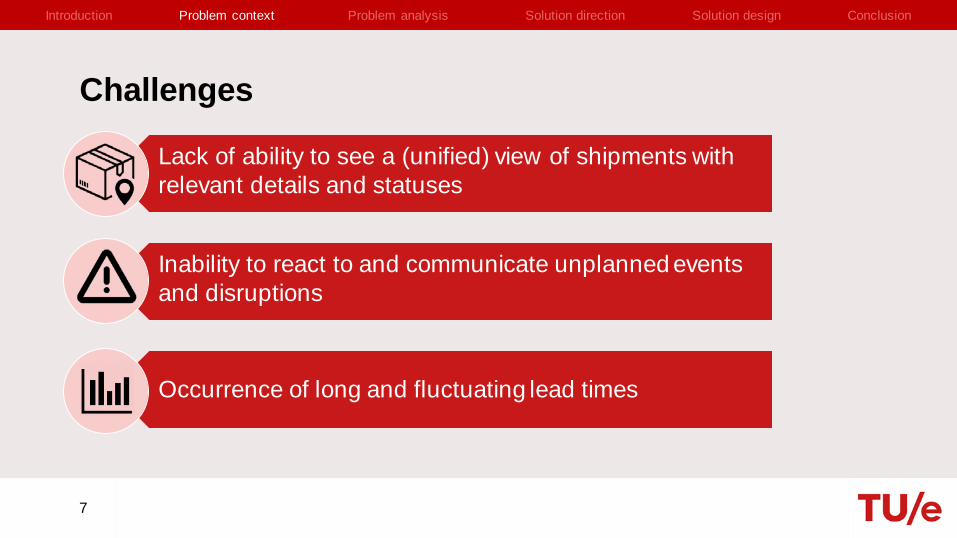
Challenges
Lack of ability to see a (unified) view of shipments with relevant details and statuses
7
Introduction ConclusionProblem analysis Solution directionProblem context Solution design
Occurrence of long and fluctuating lead times
Inability to react to and communicate unplanned events and disruptions

Lead times of sea shipments from Venlo to CUSA
8
Introduction ConclusionProblem analysis Solution directionProblem context Solution design
µ = 27.9 days σ = 3.4 daysµ = 23.8 days σ = 5.8 days
0
1
2
3
4
5
16 18 20 22 24 26 28 30 32 34 36 38 40 42 44 46
frequ
ency
number of days
Rotterdam → Chicago Q3 2018
0
1
2
3
4
5
6
19 20 21 22 23 24 25 26 27 28 29 30 31 32 33 34 35 36
frequ
ency
number of days
Rotterdam → Columbus Q3 2018
µ = 19.0 days σ = 3.4 days
02468
1012141618
12 13 14 15 16 17 18 19 20 21 22 23 24 25 26 27 28
frequ
ency
number of days
Rotterdam → ChicagoQ1 2005

Roadmap towards proactive monitoring of shipments
9
Introduction ConclusionProblem analysis Solution directionProblem context Solution design
1. Visibility toall relevant details of a shipment
2. Measuringshipping
performance3. Monitoring
shipments4. Predicting
shipmentsdelays
5. Preventingshipments
delays
SCOPE

Research questionsHow can a visibility solution contribute to achieve control over the outbound logistics process in order to improve customer service and reduce costs?
1) What is the current situation within the context of outbound logistics?2) What causes of long and fluctuated lead times do exist and why do they occur?3) What kinds of tools for supply chain visibility are applicable to control the
outbound logistics process?4) What is the quality of real-time data for sea shipments?5) How to design a tool that uses real-time data to monitor the outbound goods flow?6) How can monitoring outbound transportation process using supply chain visibility
tools contribute to improving the performance of the outbound logistics activities?
10
Introduction ConclusionProblem analysis Solution directionProblem context Solution design

Methodology
11
Introduction ConclusionProblem analysis Solution directionProblem context Solution design
Literature research Analysis of historical data On-time performance Transit time (per leg) Travel time Transfer time Waiting time

Data sources
12
Introduction ConclusionProblem analysis Solution directionProblem context Solution design
Leg 1 Leg 2 Leg 3 Leg 4
ATD Truck
ATDPort
Stock in date
ATAPort D/C
ATDRail
ATARail
lead times USA reportSAP
ETD ETA Port Port

Total lead times
13
Introduction ConclusionProblem analysis Solution directionProblem context Solution design
µ = 31.5 days σ = 5.9 days
0
1
2
3
4
5
25 27 29 31 33 35 37 39 41 43 45 47 49 51 53 55
frequ
ency
number of days
route: Venlo → Chicago
0
1
2
3
4
5
6
29 30 31 32 33 34 35 36 37 38 39 40 41 42 43
frequ
ency
number of days
route: Venlo → Columbus
µ = 35.4 days σ = 3.9 days

Waiting time at port of lading: leg 1
14
Introduction ConclusionProblem analysis Solution directionProblem context Solution design
µ = 7.7 days σ = 1.3 days µ = 7.5 days σ = 1.6 days
0123456789
4 5 6 7 8 9 10 11
frequ
ency
number of days
route: Venlo → Chicago
0
2
4
6
8
10
12
4 5 6 7 8 9 10 11
frequ
ency
number of days
route: Venlo → Columbus

Waiting time at port of discharge: leg 3
15
Introduction ConclusionProblem analysis Solution directionProblem context Solution design
µ = 4.2 days σ = 1.0 days µ = 8.5 days σ = 2.7 days
0
2
4
6
8
10
12
14
16
1 2 3 4 5 6 7 8
frequ
ency
number of days
route: Venlo → Chicago
0
1
2
3
4
5
6
7
1 2 3 4 5 6 7 8 9 10 11 12 13 14 15
frequ
ency
number of days
route: Venlo → Columbus

Waiting time at container yard: leg 4
16
Introduction ConclusionProblem analysis Solution directionProblem context Solution design
µ = 5.9 days σ = 4.9 days µ = 3.6 days σ = 1.9 days
0123456789
1 3 5 7 9 11 13 15 17 19 21 23 25 27
frequ
ency
number of days
route: Venlo → Chicago
0
1
2
3
4
5
6
7
1 2 3 4 5 6 7 8
frequ
ency
number of days
route: Venlo → Columbus

Total lead times
17
Introduction ConclusionProblem analysis Solution directionProblem context Solution design
Waiting time
49.7%
Discharge time
0.2%
Travel time
49.1%
0 5 10 15 20 25 30 35 40 45 50

Causes of long and fluctuating lead times
18
Introduction ConclusionProblem analysis Solution directionProblem context Solution design
Growth of containership sizes number of departures decrease loading and unloading times increase handling problems at ports
Long waiting times Leg 1: carriers require being in the harbor 5 days before departure Leg 3: lack of communication
port congestions Leg 4: drayage only scheduled after arriving of container
low truck driver availability

Definition of Supply Chain Visibility
19
Introduction ConclusionProblem analysis Solution directionProblem context Solution design
Supply chain visibility is defined as collecting and analyzing real timeinformation related to shipments, including logistics activities and the status ofevents and milestones that occur during transportation of goods, to enableshipment tracking and control over this process by supply chain disruptionmanagement and continuous improvementof the supply chain.

Supply chain visibility applications
20
Introduction ConclusionProblem analysis Solution directionProblem context Solution design
Control tower
Internal business analytics tool
Own dashboardOwn dashboard

Methodology Check available data sources Requirements analysis Design prototype
21
Introduction ConclusionProblem analysis Solution directionProblem context Solution design
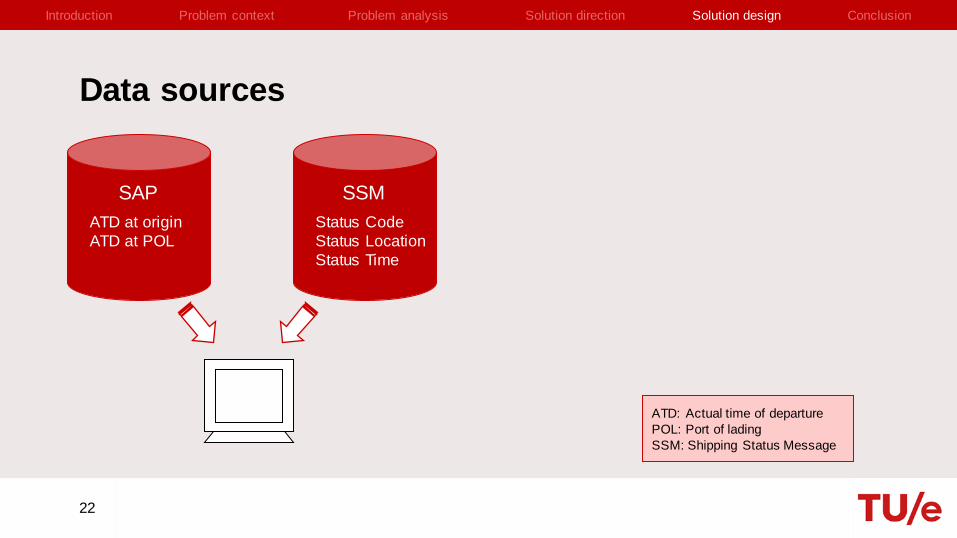
Data sources
22
Introduction ConclusionProblem analysis Solution directionProblem context Solution design
SSMStatus CodeStatus LocationStatus Time
SAPATD at originATD at POL
ATD: Actual time of departurePOL: Port of ladingSSM: Shipping Status Message

Data qualitySAPAccuracy Errors in container number (3%) Errors in bill of lading number (12%)
Consistency 36% of ATD at POL equal to SSM portal
23
Introduction ConclusionProblem analysis Solution directionProblem context Solution design
SSM portalCompleteness 92.2% of all SAP containers are covered Data available up to 90 days ago
Consistency Multiple status codes used for same logistics
events
Timeliness Updated twice a day85% (215)
12% (31)
3% (6) input error ratio
correct
incorrect BOL
incorrect container #

Goals of application
Increase order visibility
24
Introduction ConclusionProblem analysis Solution directionProblem context Solution design
Recognize inefficiencies of lead times
Minimize impact of unplanned events

Content of application
25
Introduction ConclusionProblem analysis Solution directionProblem context Solution design
Track & trace Alert system KPI dashboard Transit times (per leg) On-time performance Transportation costs Complete and damage-free delivery
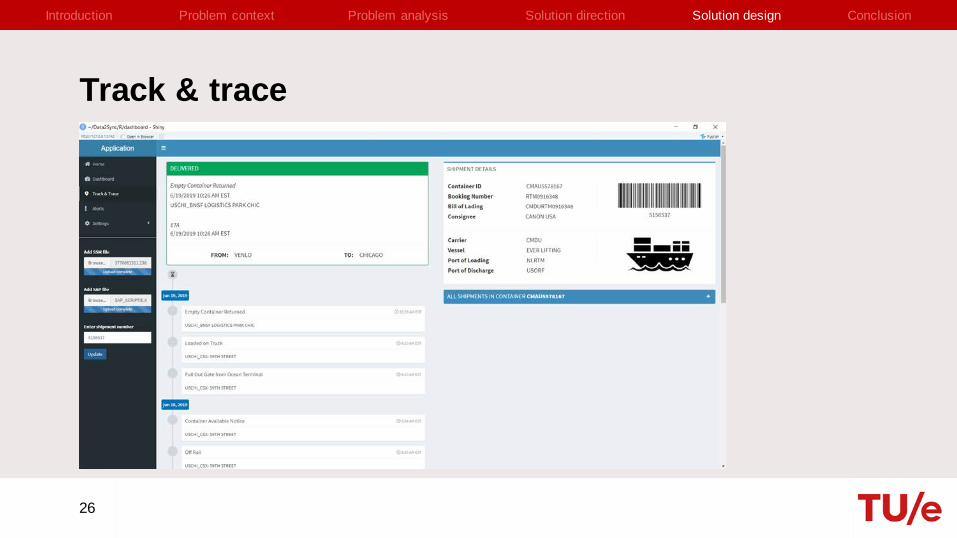
Track & trace
26
Introduction ConclusionProblem analysis Solution directionProblem context Solution design
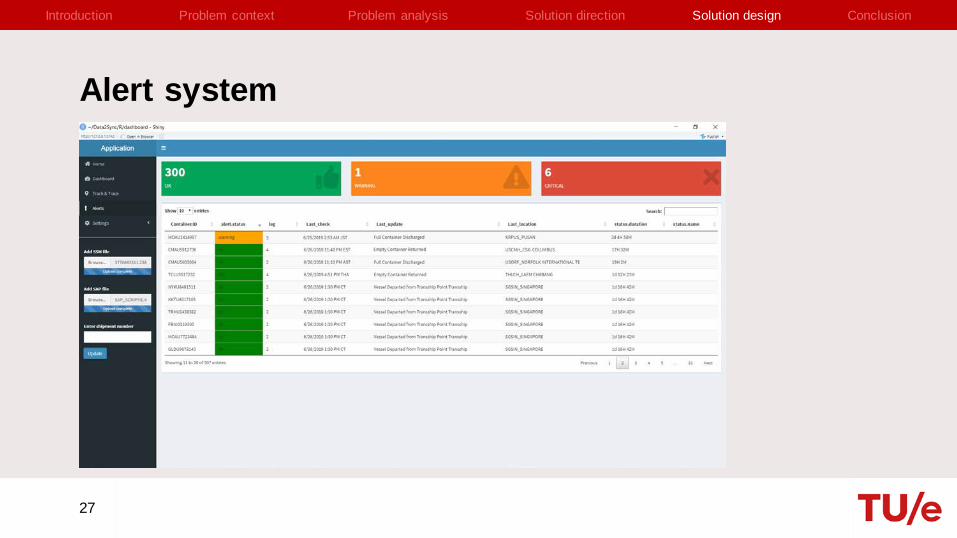
Alert system
27
Introduction ConclusionProblem analysis Solution directionProblem context Solution design

Reduction of waiting times
28
Introduction ConclusionProblem analysis Solution directionProblem context Solution design
0
1
2
3
4
5
6
7
8
20 21 22 23 24 25 26 27 28 29 30 31 32 33 34 35 36 37 38 39 40
frequ
ency
number of days
LEAD TIMESroute: Venlo → Columbus
Q3 2018
in itial situation
ideal situation

Potential cost reductions
29
Introduction ConclusionProblem analysis Solution directionProblem context Solution design
Reduction of cash flow in-transit Any reduction of lead time with 1 day → 1 million
Reduction of demurrage costs For shipments to Chicago and Columbus → €4390 per quarter
Other cost savings: Lower inventory costs Decrease of downtime costs Less costs of lateness
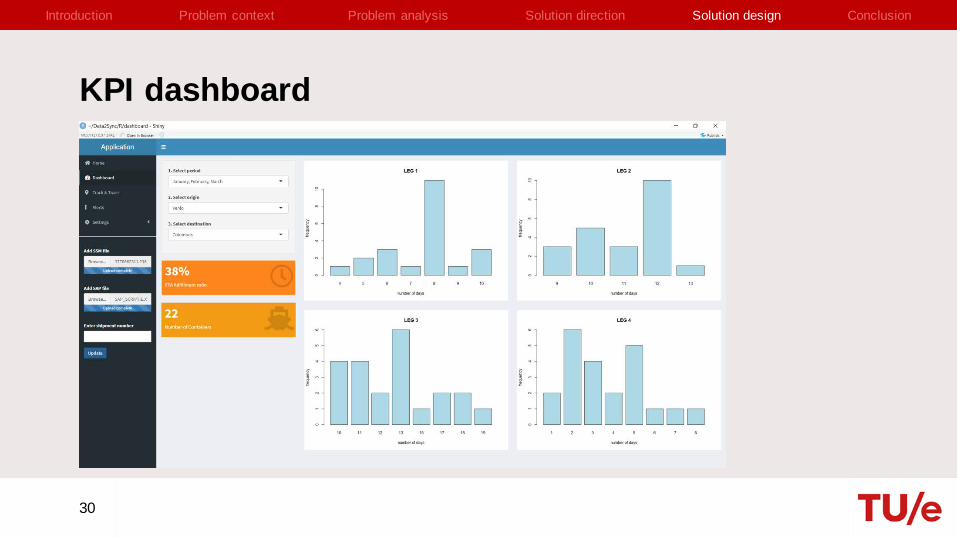
KPI dashboard
30
Introduction ConclusionProblem analysis Solution directionProblem context Solution design
Added values
31
Introduction ConclusionProblem analysis Solution directionProblem context Solution design
Track & trace Better customer service Reputation of firm
Alert system Higher responsiveness to disruptions leading to cost savings
KPI dashboard Identify bottlenecks Carrier evaluaton Port evaluation

Research questionsHow can a visibility solution contribute to achieve control over the outbound logistics process in order to improve customer service and reduce costs?
1) What is the current situation within the context of outbound logistics?2) What causes of long and fluctuated lead times do exist and why do they occur?3) What kinds of tools for supply chain visibility are applicable to control the
outbound logistics process?4) What is the quality of real-time data for sea shipments?5) How to design a tool that uses real-time data to monitor the outbound goods flow?6) How can monitoring outbound transportation process using supply chain visibility
tools contribute to improving the performance of the outbound logistics activities?
32
Introduction ConclusionProblem analysis Solution directionProblem context Solution design
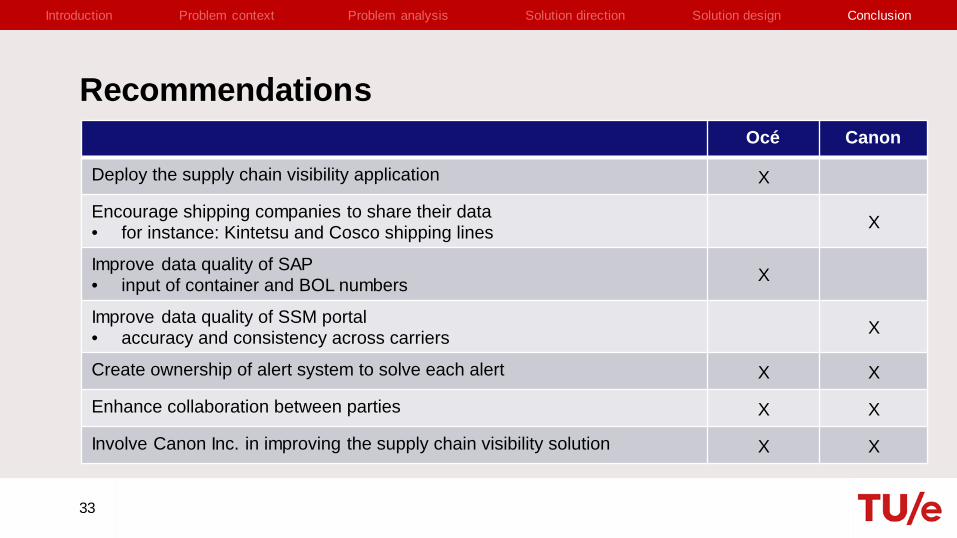
Recommendations
33
Océ Canon
Deploy the supply chain visibility application X
Encourage shipping companies to share their data• for instance: Kintetsu and Cosco shipping lines X
Improve data quality of SAP• input of container and BOL numbers X
Improve data quality of SSM portal• accuracy and consistency across carriers X
Create ownership of alert system to solve each alert X X
Enhance collaboration between parties X X
Involve Canon Inc. in improving the supply chain visibility solution X X
Introduction ConclusionProblem analysis Solution directionProblem context Solution design

THANK YOU
34