a computerized database for bullet comparison by consecutive
TRANSCRIPT

The author(s) shown below used Federal funds provided by the U.S. Department of Justice and prepared the following final report: Document Title: A Computerized Database for Bullet
Comparison by Consecutive Matching Author(s): Ashley Chu, David Read, David Howitt Document No.: 247771 Date Received: July 2014 Award Number: 2009-DN-BX-K257 This report has not been published by the U.S. Department of Justice. To provide better customer service, NCJRS has made this Federally-funded grant report available electronically.
Opinions or points of view expressed are those of the author(s) and do not necessarily reflect
the official position or policies of the U.S. Department of Justice.

1
A COMPUTERIZED DATABASE FOR BULLET COMPARISON BY CONSECUTIVE MATCHING
Ashley Chu1, David Read2 and David Howitt3
1Eugene Police Department, Forensic Evidence Unit
300 Country Club Road, Eugene, Oregon 97401
2Boulder, Colorado 80305
3Department of Chemical Engineering and Science of Materials
University of California, Davis, California 95616
This document is a research report submitted to the U.S. Department of Justice. This report has not been published by the Department. Opinions or points of view expressed are those of the author(s)
and do not necessarily reflect the official position or policies of the U.S. Department of Justice.

2
ABSTRACT
A method for cataloguing and comparing the land impressions of bullets using readily available
commercial instrumentation and software is described. The analysis involved a comparison of
the locations of the prominent features of the land impression topography in much the same way
that firearms examiners in California use consecutive matching striae except they were
determined from the reconstruction of the surfaces by confocal microscopy. The database that
was used to test the method contained 1686 land impressions fired from Beretta M9/92 pistols
and was supplemented with additional random-simulated data to a total of 90,000 bullets. 232
of the 281 scanned bullets were duplicate firings, that is there were pairs of bullets fired from
116 guns and without excluding any bullets because of the quality of the impression marks over
60% of the duplicate firings were identified before a false positive match occurred.
This document is a research report submitted to the U.S. Department of Justice. This report has not been published by the Department. Opinions or points of view expressed are those of the author(s)
and do not necessarily reflect the official position or policies of the U.S. Department of Justice.

3
INTRODUCTION
The problem that prevents firearms examiners from retrospectively comparing bullets they have
previously examined is the ambiguity associated with the recording of the data. This can be
appreciated by contrasting aligned images in a bridge microscope to photographic recordings of
the same bullets taken on separate occasion. The latter can change dramatically with the
orientation of the bullet relative to the light source and the objective lens and it is impossible to
achieve a consistency greater than plus or minus 2 degrees of orientation in the blind placement
of bullets on a specimen stage [1]. Thus the results of these comparisons are invariably
disappointing, to the extent that in most cases the images of similar striae patterns are
unrecognizable. In theory the orientation problem should be eliminated by confocal microscopy
because it can be used to create a three dimensional reconstruction of the surface topography that
would be invariant to the placement of the bullet, however there is also a second more divisive
problem and that has to do with the validity of the correspondence that is used to subjectively
identify matching bullets. It is beyond the scope of this paper to fully address the controversies
and arguments that surround this issue [2-10], however, in the development of a computerized
search algorithm it is worth considering the probabilities associated with random matching. A
mathematical assessment of the correspondences that occur between random land impressions
indicates that the proportion of individual matching striae is ambiguous because it depends upon
the number of striae that are present on each of the different lands, whereas the number of
matching regions that extend beyond three or four adjacent features is far smaller and insensitive
to the population differences [11]. This distinction was practically demonstrated by Biasotti
over sixty years ago [2] and so it would seem to be important for any search algorithm to assess
the linear extent of the correspondence rather than just the overall degree of similarity, which is
This document is a research report submitted to the U.S. Department of Justice. This report has not been published by the Department. Opinions or points of view expressed are those of the author(s)
and do not necessarily reflect the official position or policies of the U.S. Department of Justice.

4
what most of the databases would seem to employ [12-13]. Thus the construction of a database
from three dimensionally reconstructed images, rather than two-dimensional projections, should
provide a solution to the data acquisition problem and the searching of this database for
consecutively matching features should provide us with a far more robust method for bullet
identification.
The solution is not however without shortcomings because the quality of the three dimensional
reconstructions for curved surfaces by reflected light are far less accurate and reproducible than
those that are typically reported for confocal microscopy. This is because they are reported
either for empirically corrected flat surfaces or for fluorescence, which is when the specimen is
illuminated with monochromatic light and the image is detected using light that is emitted at
longer wavelengths. This is also a practical problem associated with the necessity of a high
numerical aperture for the objective lens, requiring a minimum magnification of about 20 times
which is a 4-fold increase in the magnification typically associated with bullet identification.
Furthermore the three dimensional reconstructions necessitate that multiple confocal images are
taken at several different heights (so called z-slice intervals) and so there has to be a compromise
between the noise levels that can be tolerated and the time it takes to acquire the data. The
problem is exacerbated for bullets because much of the acquisition time of the z-slice imaging is
wasted in free space, far away from the curved surface of interest and so in addition to having to
reconstruct 4 images to capture the cylindrical land impression, each one requires many more z-
slices than would normally be necessary to evaluate a topography less than a micron in depth.
Thus the data acquisition times have to be compromised to make the technique viable, meaning
that one has to rely heavily on the filtering and processing of the data, necessitating the
development of a sophisticated peak finding routine. There is finally the additional limitation
This document is a research report submitted to the U.S. Department of Justice. This report has not been published by the Department. Opinions or points of view expressed are those of the author(s)
and do not necessarily reflect the official position or policies of the U.S. Department of Justice.

5
that the available commercial software cannot actually compare the reconstructions in three
dimensions and so curvature corrections are still necessary to improve the correspondence over
the full width of the land impression.
CONFOCAL MICROSCOPY
The topographies of two thousand land impressions from separate firings from 9 mm Beretta
M9/92 series pistols were scanned and processed using confocal microscopy to create a database
that could be searched for local regions of high correspondence of consecutive features. The
confocal microscopes we used could distinguish the small variations in depth that are associated
with the land impressions with a 20 times objective using a 0.2 micron z-slice interval and so 4
individual reconstructions at 75 different heights were required to traverse each land impression,
each taking approximately 5 minutes to record. Using a 50x objective and a 0.2 micron z-slice
interval we were able to produce an accurate representation of the surface of the NIST standard
bullet [14] and could even distinguish the fine 0.01 micron scale structure associated with the
etching however the collection times took several hours. Nevertheless although the visual
appearance of the data using a 20x objective was obviously inferior to that with 50x, as shown in
figure 1 we were able to reduce both to the same set of prominent features by Fourier filtering
with a low pass filter and Gaussian smoothing.
This document is a research report submitted to the U.S. Department of Justice. This report has not been published by the Department. Opinions or points of view expressed are those of the author(s)
and do not necessarily reflect the official position or policies of the U.S. Department of Justice.

6
Figure 1. The measured variation in height for the central portion of Land 1 of the NIST
standard bullet
Although the surface topographies can be processed in a variety of ways our aim here was to
mimic the comparison techniques of a firearms examiner and so it was important to reduce the
scale of the information to the level that a firearms examiner could distinguish by eliminating the
high resolution detail that could not typically be seen. The acquisition and processing
This document is a research report submitted to the U.S. Department of Justice. This report has not been published by the Department. Opinions or points of view expressed are those of the author(s)
and do not necessarily reflect the official position or policies of the U.S. Department of Justice.

7
procedures were refined by comparing scans of the NIST standard bullet to the theoretical
profiles and routines were developed to maintain an accuracy of about a micron in the lateral
separation of the major peaks. We had originally anticipated being able to directly compare the
prominent features of the processed surface profiles to the striae seen in optical images, but we
found no obvious correspondence as shown in the comparison of a color image of land 1 of the
NIST standard bullet contrasted to a grey scale representation of the confocal height profile after
form removal (figure 2).
Figure 2. Similarities and differences between a land impression visualized as an image and as
a set of height values (white highest).
The distinction between the analysis of consecutive matching striae (CMS) and the analysis we
are performing here, which we refer to as consecutive matching extrema (CME), is essentially
the difference between the contrast seen in an optical bridge microscope (CMS) and the
prominent features of the surface topography from the confocal reconstructions (CME). The
CMS are subjectively distinguished by an examiner and depend upon the illumination conditions
whilst it is the imaging and processing procedures that determine the CME. These processing
This document is a research report submitted to the U.S. Department of Justice. This report has not been published by the Department. Opinions or points of view expressed are those of the author(s)
and do not necessarily reflect the official position or policies of the U.S. Department of Justice.

8
procedures include the method of form removal, the type of filtering and the criteria to be met for
inclusion in the CME signature. All of these processing steps can be specified objectively, so
that the CME are the basis of a reproducible measure of the linear extent of the regions of
correspondence between lands, and it is in this way that they form bullet signatures useful for
land-land and bullet-bullet comparisons.
The processing of the reconstructed surface topographies begins with the extraction of the
relevant portion of the land impression by removing the regions around the leading and trailing
edges and correcting for the misorientation along the axis of the bullet using a least squares
method. Subsequent Fourier discrimination with a 10-micron dimensional cutoff and Gaussian
smoothing enabled us to produce locally reproducible sets of lateral spacings on the NIST
standard bullet surface over a range of z-slice intervals between 0.2 and 2.0 microns. These
particular sets of extrema are not visually distinguishable in the individual scanned images at the
larger separations and are not typically reproducible without form removal, which is a critical
step in the identification process. This is because the circular profile of the bullet dominates the
raw profile and masks the details that vary among bullets fired from different barrels. We have
tested several different approaches to form removal. The simplest, which is supported by widely
available image processing software, is to smooth the raw data and then subtract the smoothed
data set from the original data without geometrical analysis. The result retains the local features
but not the overall form because this method projects the actual three-dimensional geometry of
the land impression into a two-dimensional map that does not accurately represent the locations
of the features. These errors can reach up to 10 microns, and become significant when the land
impressions being compared were imaged at orientations that differ by more than half a degree,
which is unavoidable in practice because the point where a groove ends and a land impression
This document is a research report submitted to the U.S. Department of Justice. This report has not been published by the Department. Opinions or points of view expressed are those of the author(s)
and do not necessarily reflect the official position or policies of the U.S. Department of Justice.

9
begins cannot be pinpointed reproducibly. Our first attempt at form removal based on
geometrical analysis performed a straightforward rotation and used the dimension of the chords
between the extrema to sequentially evaluate their positions. We later replaced the chord by
least-squares fitting the curvature of the surface to a cylinder and using the circumferential
distance as the position coordinate and the difference between the raw profile and the fitted
cylinder as the height. In this way we were able to eliminate most of the distortions as shown in
the following graphs which are all separate scans of the NIST standard bullet taken first at the
top dead center orientation and then at ½ degree intervals rotating from -5 to 5 degrees using the
Zeiss CSM 700. The confocal data were processed through 3 different methods in Mathematica
and is shown in the following figures where the X-axis represents the degree to which the NIST
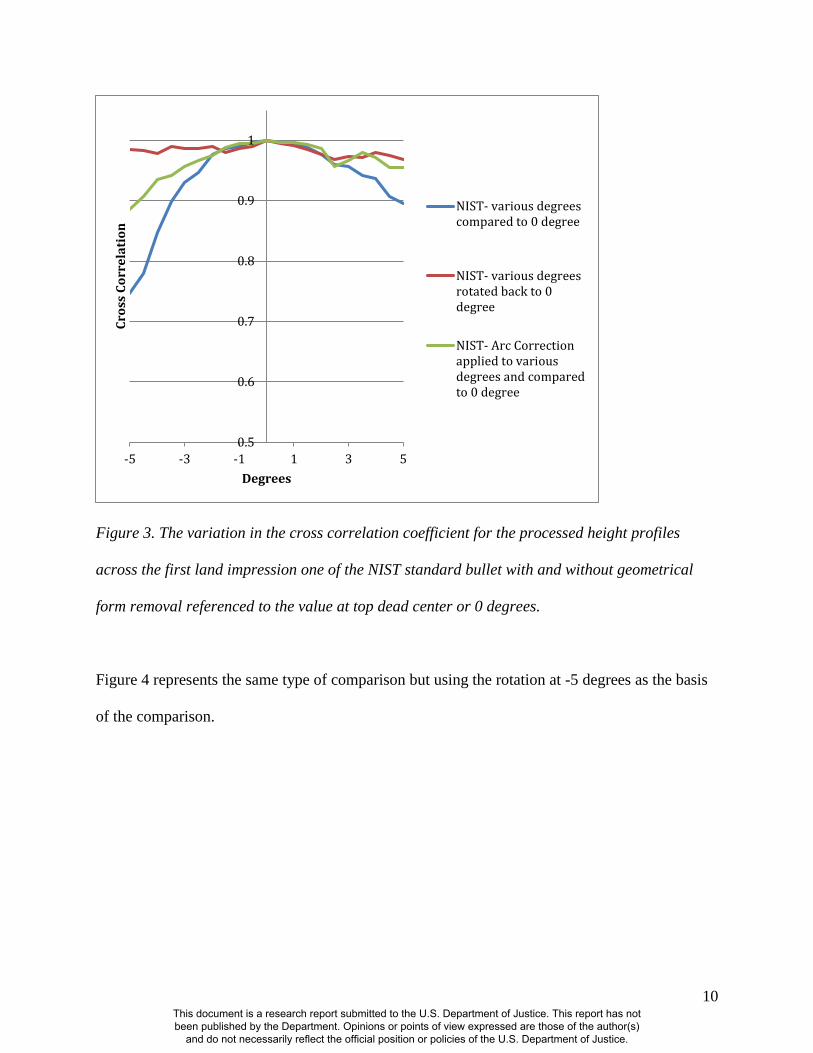
bullet was rotated and the Y-axis represents the Cross Correlation. The blue line in the figures is
the result from the Mathematica routine with just a Gaussian form removal and a Fourier
transform applied to all the various rotations and comparing the data to that at 0 degrees.
The red line is the Mathematica routine with the Rotation Correction, Gaussian form removal
and Fourier transform, in other words depending upon the orientation at which the sample was
captured, we rotated it back to 0 degrees and compared it to the 0 degree profile. The green line
represents the Mathematica routine with the more complicated Arc Correction, Gaussian form
removal and the Fourier transform. The Arc correction was applied to all the scanned data
captured at the different orientations and the data were compared to 0 degrees.
The data in figure 3 show a comparison of the cross correlation results for the various data sets
taken at deliberate misorientations of the standard bullet and the cross correlation results
following the two associated corrections.
This document is a research report submitted to the U.S. Department of Justice. This report has not been published by the Department. Opinions or points of view expressed are those of the author(s)
and do not necessarily reflect the official position or policies of the U.S. Department of Justice.
10
Figure 3. The variation in the cross correlation coefficient for the processed height profiles
across the first land impression one of the NIST standard bullet with and without geometrical
form removal referenced to the value at top dead center or 0 degrees.
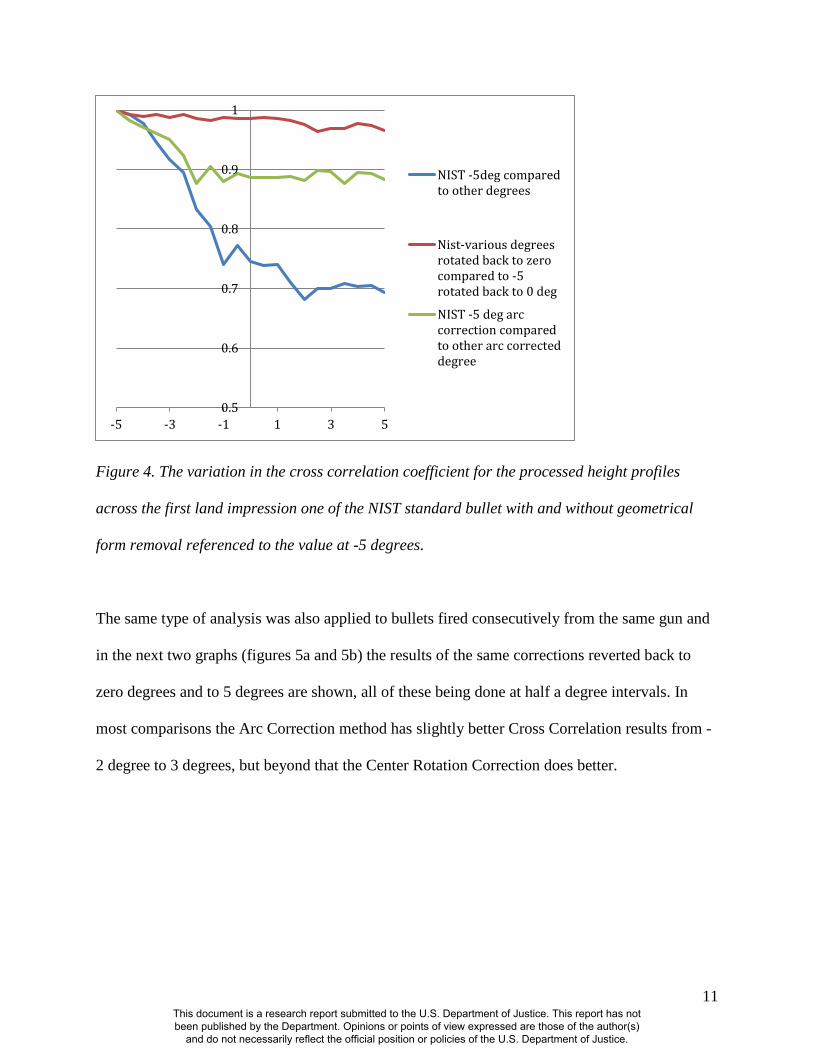
Figure 4 represents the same type of comparison but using the rotation at -5 degrees as the basis
of the comparison.
0.5
0.6
0.7
0.8
0.9
1
-5 -3 -1 1 3 5
Cro
ss C
orr
ela
tio
n
Degrees
NIST- various degreescompared to 0 degree
NIST- various degreesrotated back to 0degree
NIST- Arc Correctionapplied to variousdegrees and comparedto 0 degree
This document is a research report submitted to the U.S. Department of Justice. This report has not been published by the Department. Opinions or points of view expressed are those of the author(s)
and do not necessarily reflect the official position or policies of the U.S. Department of Justice.
11
Figure 4. The variation in the cross correlation coefficient for the processed height profiles
across the first land impression one of the NIST standard bullet with and without geometrical
form removal referenced to the value at -5 degrees.
The same type of analysis was also applied to bullets fired consecutively from the same gun and
in the next two graphs (figures 5a and 5b) the results of the same corrections reverted back to
zero degrees and to 5 degrees are shown, all of these being done at half a degree intervals. In
most comparisons the Arc Correction method has slightly better Cross Correlation results from -
2 degree to 3 degrees, but beyond that the Center Rotation Correction does better.
0.5
0.6
0.7
0.8
0.9
1
-5 -3 -1 1 3 5
NIST -5deg comparedto other degrees
Nist-various degreesrotated back to zerocompared to -5rotated back to 0 deg
NIST -5 deg arccorrection comparedto other arc correcteddegree
This document is a research report submitted to the U.S. Department of Justice. This report has not been published by the Department. Opinions or points of view expressed are those of the author(s)
and do not necessarily reflect the official position or policies of the U.S. Department of Justice.

12
Figure 5a. The variation in the cross correlation coefficient for the processed height profiles
across the land impressions of bullets fired from the same gun with and without geometrical
form removal referenced to the value at 0 degrees.
0.7
0.75
0.8
0.85
0.9
-5 -3 -1 1 3 5
Bullet B rotated tovarious degrees andcompared to bullet Aat 0 degree
Bullet B at variousdegrees rotated backto 0 degrees andcompared to bullet Aat 0 degree
Arc Correctionapplied to bullet B atvarious degrees andcompared to bullet Aat 0 degree
0.5
0.6
0.7
0.8
0.9
-5 -3 -1 1 3 5
bullet B rotatedcompared to A -5 deg
Bullet B at variousdegrees rotated back tozero compared to bulletA at -5 degree rotatedback to zero
Bullet B at variousdegrees arc correctioncompared to blt A -5degarc correction
This document is a research report submitted to the U.S. Department of Justice. This report has not been published by the Department. Opinions or points of view expressed are those of the author(s)
and do not necessarily reflect the official position or policies of the U.S. Department of Justice.
13
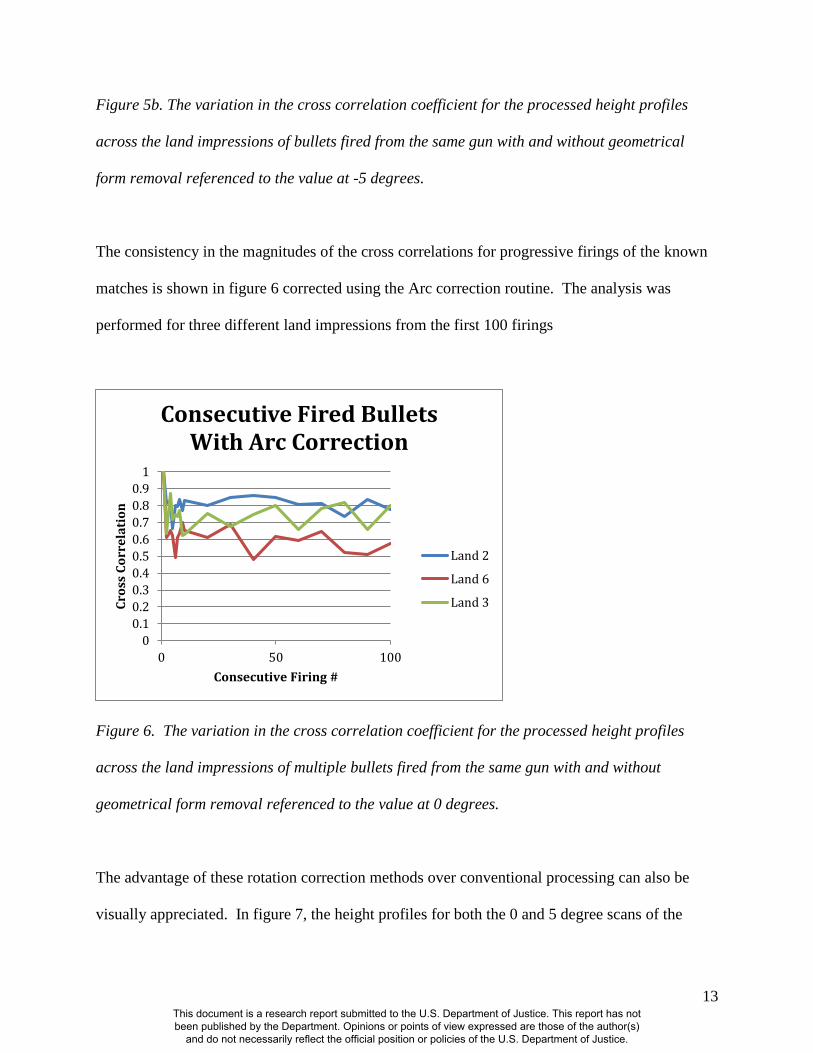
Figure 5b. The variation in the cross correlation coefficient for the processed height profiles
across the land impressions of bullets fired from the same gun with and without geometrical
form removal referenced to the value at -5 degrees.
The consistency in the magnitudes of the cross correlations for progressive firings of the known
matches is shown in figure 6 corrected using the Arc correction routine. The analysis was
performed for three different land impressions from the first 100 firings
Figure 6. The variation in the cross correlation coefficient for the processed height profiles
across the land impressions of multiple bullets fired from the same gun with and without
geometrical form removal referenced to the value at 0 degrees.
The advantage of these rotation correction methods over conventional processing can also be
visually appreciated. In figure 7, the height profiles for both the 0 and 5 degree scans of the
0
0.1
0.2
0.3
0.4
0.5
0.6
0.7
0.8
0.9
1
0 50 100
Cro
ss C
orr
ela
tio
n
Consecutive Firing #
Consecutive Fired Bullets With Arc Correction
Land 2
Land 6
Land 3
This document is a research report submitted to the U.S. Department of Justice. This report has not been published by the Department. Opinions or points of view expressed are those of the author(s)
and do not necessarily reflect the official position or policies of the U.S. Department of Justice.

14
NIST bullet were saved as *.csv data and imported into Excel where the x-axis data was adjusted
to get the best fit of the resulting profiles.
Figure 7. The height profiles across land 1 of the NIST bullet for the reconstructions recorded at
0 and 5 degrees of orientation without geometrical form removal.
In figure 8, we have used the surface modeling program in JAVA current to correct the lateral
shifts, filtered them in this program and created profiles which are again made into *.csv files
and imported into Excel.
This document is a research report submitted to the U.S. Department of Justice. This report has not been published by the Department. Opinions or points of view expressed are those of the author(s)
and do not necessarily reflect the official position or policies of the U.S. Department of Justice.

15
Figure 8. . The height profiles across land 1 of the NIST bullet for the reconstructions recorded
at 0 and 5 degrees of orientation with geometrical form removal.
The processing routines and the peak search routines were all developed in Mathematica, which
is a commercially available software program that can create and implement mathematical
expressions and functions for processing data. Although this type of processing can be
performed on the MountainsMap™ commercial software, that often comes with this type of
instrumentation, one cannot perform an orientation correction using this software unless one
extracts the images as *.csv files, which are generally far too unwieldy to align and compare to
each other in Excel. It is also noteworthy that MountainsMap™ is designed to only export single
line profiles, which is a considerable handicap. In Mathematica the topographies can be readily
exported in various different formats and subsequently compared directly and this software is
considerably cheaper than the MountainsMap™ and the subroutines for doing the image
comparisons are of course freely available from the authors.
This document is a research report submitted to the U.S. Department of Justice. This report has not been published by the Department. Opinions or points of view expressed are those of the author(s)
and do not necessarily reflect the official position or policies of the U.S. Department of Justice.

16
THE ALGORITHM FOR IDENTIFYING DISCERNABLE PEAKS
The approach to the identification of the extrema in the topography was specifically developed to
enable us to account for the anticipated changes in peak heights associated with successive
firings from the same weapon. The identification and characterization of local maxima and
minima in digital data sets with noisy data is a technologically important topic that continues to
receive attention in the technical literature [15,16]. Our approach to the problem is similar in
philosophy to image processing and is different from either of the two main approaches found in
the literature, which are: a) the traditional approach based on analytic geometry; and b) some
more recent methods that transform the original data set into a processed version where the
amplitudes of the sought-after extrema are amplified to the extent that they can be identified by a
threshold operation.
The algorithm is designed to extract the information from data sets consisting of a sequence of
individual numbers, the magnitudes of which represent signal plus noise. Each number is
associated with an abscissa value and the data is binned to a particular resolution, typically
around 3 microns. The signal value at each extremum, the neighborhood that it is in and the
associated abscissa are the encoded information where the abscissa represents the certainty with
which a peak is present and the amplitude and width of the extremum represent the overall
strength of the peak.
Analytic geometry offers the classical approach to finding extrema on smooth curves; namely,
the first derivative is zero at each extrema and numerical differentiation allows application of this
technique to signals represented in digital form. However in practical situations noise adds
multiple spurious extrema to the signal, creating the problem of identifying and characterizing
the significant extrema. The use of criteria based on extremum amplitude, width, and form can
This document is a research report submitted to the U.S. Department of Justice. This report has not been published by the Department. Opinions or points of view expressed are those of the author(s)
and do not necessarily reflect the official position or policies of the U.S. Department of Justice.

17
help with the extraction of useful information; in practical cases these criteria can consume much
more analytical focus than finding the zeroes of the derivative in identifying the significant
extrema.
Examples of the transformation approach include use of analytic formulas [15] or the wavelet
transformation, however, the problem of identifying the significant extrema remains after the
transformation. A threshold criterion on the “spikiness” function is arbitrary, and the wavelet
approach requires many further operations and choices in the identification of the significant
components in the transform and in using the inverse transform to recover the significant
extrema.
The problem of extracting the striae positions from confocal microscope height profiles of the
land impressions had two main problems. The first is the excessive amount of noise in the form
of sharp spikes on the profile, and the second is the lack of a base line; the approach we have
taken to identification is compatible with both and can be concisely described as ‘sweep and
chase’. The algorithm finds the peaks separately using two steps, the first one being a stand-
alone ‘sweep’ approach, which is followed by a chasing routine. In the Sweep step an imaginary
line is drawn across the width of the profile plot outside the range of the profile values, and is
gradually swept downward to find the peaks. The line can first be drawn either below or above
all the points of the profile and is then swept through the profile stepwise. As it crosses the
profile points they are classified into potential peaks or are merged with existing ones. When the
‘sweep’ operation is used without the ‘chase’ step, the merging is done in a similar manner to the
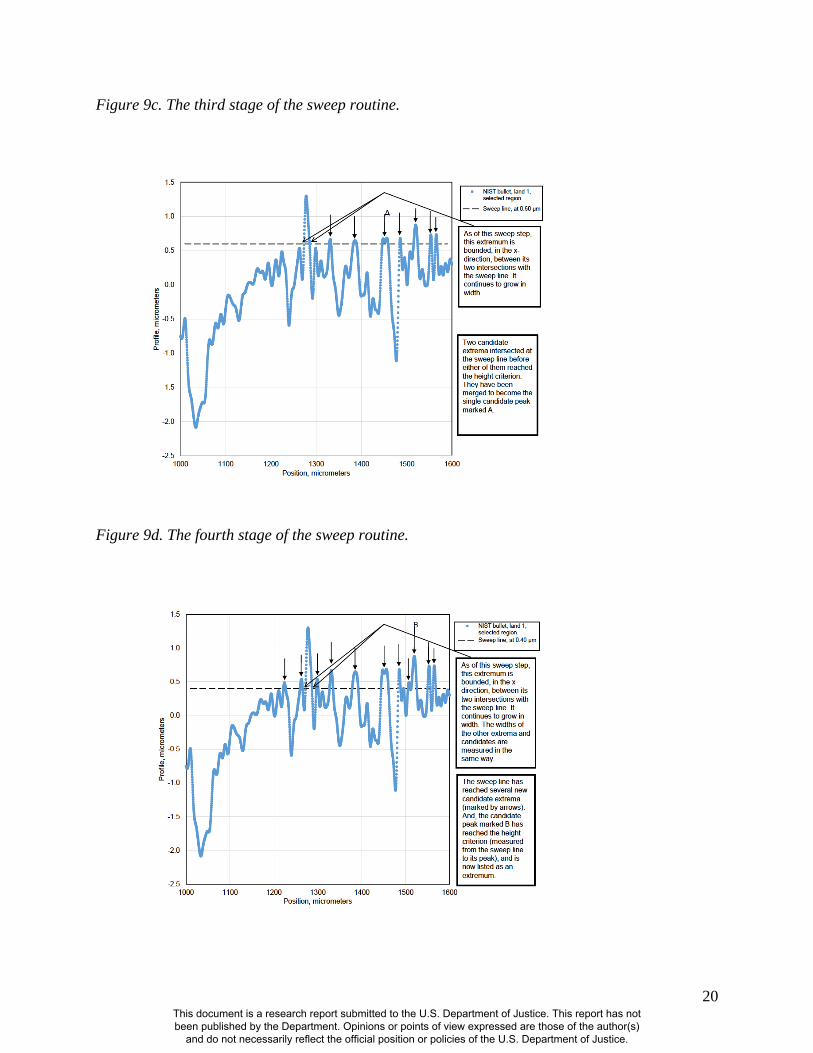
"grow" or “dilate” operation in image processing. To qualify as a listed extremum, a prominence
in the profile must be completely above or below the sweep line, have a specified maximum
height relative to the instantaneous sweep line meeting the specified height criterion and a lateral
This document is a research report submitted to the U.S. Department of Justice. This report has not been published by the Department. Opinions or points of view expressed are those of the author(s)
and do not necessarily reflect the official position or policies of the U.S. Department of Justice.

18
extent at the instantaneous sweep line meeting the specified width criterion.
The locations and amplitudes of the extrema that meet the criteria are recorded and those profile
points crossed by the sweep line that are neither included in recorded extrema nor merged with
existing ones, remain active as potential components of extrema to be found on later sweep steps.
The sweep operation is continued, either up or down, until the full profile has been covered and
combining the lists of peaks forms the list of all extrema.
A detailed example of the sweep routine is shown in figures 9a-h:
Figure 9a. The first stage of the sweep routine.
This document is a research report submitted to the U.S. Department of Justice. This report has not been published by the Department. Opinions or points of view expressed are those of the author(s)
and do not necessarily reflect the official position or policies of the U.S. Department of Justice.

19
Figure 9b. The second stage of the sweep routine.
This document is a research report submitted to the U.S. Department of Justice. This report has not been published by the Department. Opinions or points of view expressed are those of the author(s)
and do not necessarily reflect the official position or policies of the U.S. Department of Justice.
20
Figure 9c. The third stage of the sweep routine.
Figure 9d. The fourth stage of the sweep routine.
This document is a research report submitted to the U.S. Department of Justice. This report has not been published by the Department. Opinions or points of view expressed are those of the author(s)
and do not necessarily reflect the official position or policies of the U.S. Department of Justice.

21
Figure 9e. The fifth stage of the sweep routine.
Figure 9f. The sixth stage of the sweep routine.
This document is a research report submitted to the U.S. Department of Justice. This report has not been published by the Department. Opinions or points of view expressed are those of the author(s)
and do not necessarily reflect the official position or policies of the U.S. Department of Justice.

22
Figure 9g. The seventh stage of the sweep routine.
Figure 9h. The final stage of the sweep routine.
The ‘sweep’ approach does however have indeterminacy because it can miss candidate extrema
that are close to the minimum height or width and are adjacent to other structures in the data.
This can happen if the sweep line is stepped past the acceptable region of a candidate extremum
and falls at a level where neighboring structures merge with it. In this case, the algorithm treats
the candidate extremum as part of the neighboring structures, and does not find it. Although this
behavior could be accepted as a useful feature, in that it discriminates against small extrema
adjacent to larger structures, we chose to refine the approach by adding another step—the
‘chase’.
With the addition of the ‘chase’ step, the extrema found by the sweep step become candidate
extrema. A less stringent preliminary height criterion as well as other less stringent criteria can
This document is a research report submitted to the U.S. Department of Justice. This report has not been published by the Department. Opinions or points of view expressed are those of the author(s)
and do not necessarily reflect the official position or policies of the U.S. Department of Justice.

23
be used in the sweep step, because the candidate extrema will be processed further. At each
sweep step, each candidate extremum is ‘chased,’ which means, it is traced point-by-point along
the profile, regardless of where the sweep line falls. The candidate extremum is traced point-by-
point both to the left and to the right (toward negative and positive x- or abscissa values). This
tracing is carried out until a logical stopping point is found. Such stopping points include
previously found neighboring extrema, maxima or minima in the profile, or possibly, for the first
candidate extremum, the ends of the profile. At each trace step, the left or right bound of the
prominence is stepped outward. This stepping is controlled to maintain the two base points at
approximately the same ordinate, or y-values.
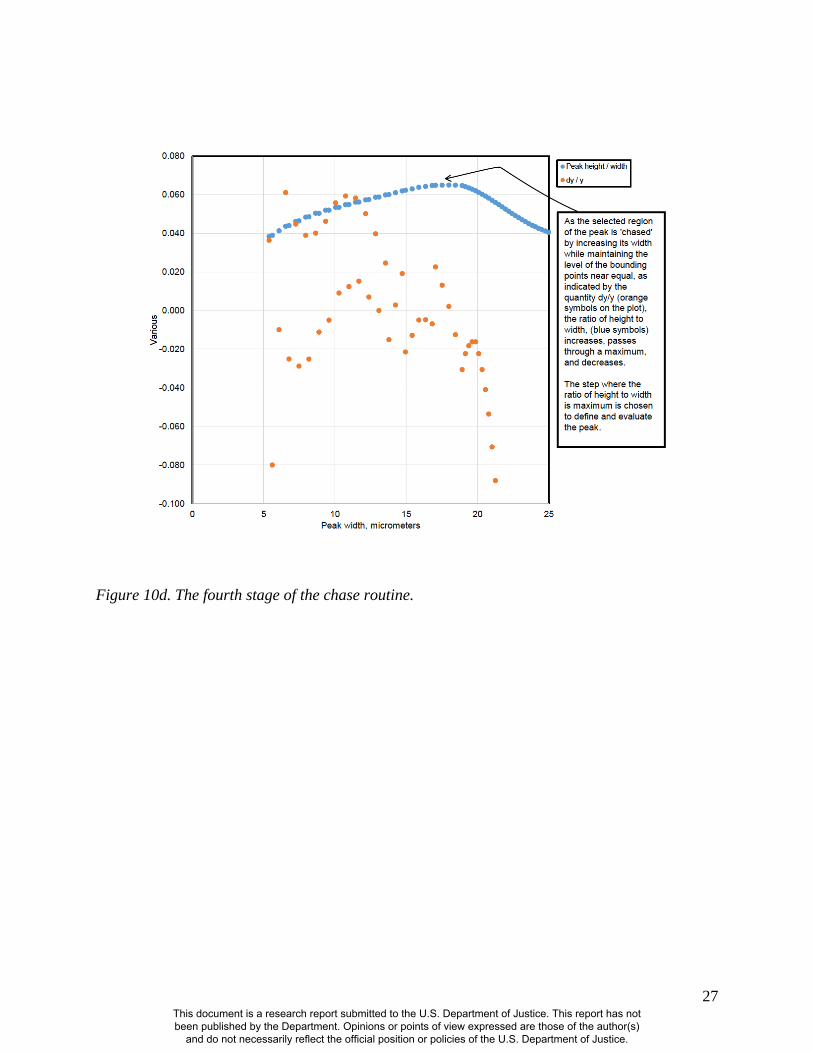
The updated base value of the candidate extremum is taken as the average ordinate value of the
two bounding trace points and the updated height is taken as the difference between the
maximum value of the profile and the base. The width is taken as the x-difference between the
two trace points. With this information, an updated value of the ratio of the extremum height to
its width can be calculated. The chase routine as presently implemented seeks to find and store
the trace points associated with the maximum sharpness of the candidate extremum, which is
taken as the maximum ratio of extremum height to width. When the chase process has reached
the outer bounds, the candidate extremum of maximum sharpness is evaluated against the final
criteria. In the present implementation, this evaluation includes a parabolic fit of all the profile
points in the candidate extremum. This enables some additional criteria to be applied to the
candidate extremum, which here include elementary sanity checks such as whether the apex of
the fitted parabola is within the left and right hand bounds of the candidate extremum and
whether the parabolic fit has produced a maximum, when peaks are sought. Our final extremum
height criterion is typically twice as large as the preliminary value that was used in the sweep
This document is a research report submitted to the U.S. Department of Justice. This report has not been published by the Department. Opinions or points of view expressed are those of the author(s)
and do not necessarily reflect the official position or policies of the U.S. Department of Justice.

24
phase. Along with the width criterion, we also apply a bound on the sharpness of the extremum,
in the form of an upper limit on the ratio of the width to the height.
A detailed example of the chase routine is shown in figures 10a-f:
Figure 10a. The first stage of the chase routine
This document is a research report submitted to the U.S. Department of Justice. This report has not been published by the Department. Opinions or points of view expressed are those of the author(s)
and do not necessarily reflect the official position or policies of the U.S. Department of Justice.

25
Figure 10b. The second stage of the chase routine
This document is a research report submitted to the U.S. Department of Justice. This report has not been published by the Department. Opinions or points of view expressed are those of the author(s)
and do not necessarily reflect the official position or policies of the U.S. Department of Justice.

26
Figure 10c. The third stage of the chase routine.
This document is a research report submitted to the U.S. Department of Justice. This report has not been published by the Department. Opinions or points of view expressed are those of the author(s)
and do not necessarily reflect the official position or policies of the U.S. Department of Justice.
27
Figure 10d. The fourth stage of the chase routine.
This document is a research report submitted to the U.S. Department of Justice. This report has not been published by the Department. Opinions or points of view expressed are those of the author(s)
and do not necessarily reflect the official position or policies of the U.S. Department of Justice.

28
Figure 10e. The fifth stage of the chase routine.
This document is a research report submitted to the U.S. Department of Justice. This report has not been published by the Department. Opinions or points of view expressed are those of the author(s)
and do not necessarily reflect the official position or policies of the U.S. Department of Justice.

29
Figure 10f. The final stage of the chase routine.
In addition to the excessive noise and lack of a baseline, the analysis of surface profiles of bullets
for forensic purposes poses another problem, which is that there is of course no a priori
knowledge of which extrema are genuine and which are spurious.
A further characterization of the present approach for identifying extrema may be obtained by
considering the dependence of the number of extrema found on the criteria applied. Figure 11
shows this dependence on the height and width criteria when the sweep step is controlled at half
the height criterion.
This document is a research report submitted to the U.S. Department of Justice. This report has not been published by the Department. Opinions or points of view expressed are those of the author(s)
and do not necessarily reflect the official position or policies of the U.S. Department of Justice.

30
Figure 11. The number of extrema found for various values of the peak width and height.
The sweep-and-chase approach takes advantage of the computing power available to most
investigators today. The practicality in terms of computer power is clear because it is no more
computation-intensive than typical image processing operations, such as edge finding,
thresholding, and Fourier transformation, that are widely used and commonly considered to be
practical. It has been applied in Mathematica™, Excel™ (as an extended macro), and in a stand-
alone Java program. An example application is shown in figures 12a and 12b for the NIST
standard bullet with the indicated extrema found by the algorithm for a minimum height
requirement of 0.2 microns (a) and breadth requirement of 6 microns (b).
0
50
100
150
200
250
300
0.01 0.1 1
Nu
mb
er
of e
xtr
em
a
Minimum peak height criterion, µm
2
4
6
8
12
20
Minimum peak width criterion, in µm
Dependence of extrema count in the NIST SRM 1 profile on the search criteria
This document is a research report submitted to the U.S. Department of Justice. This report has not been published by the Department. Opinions or points of view expressed are those of the author(s)
and do not necessarily reflect the official position or policies of the U.S. Department of Justice.

31
Figure 12a. Profile of NIST SRM 2460, with extrema detected by the sweep algorithm marked.
Figure 12b. Expanded section of profile of NIST SRM 2460, with extrema detected by the sweep
algorithm marked.
-2
-1.5
-1
-0.5
0
0.5
1
1.5
2
0 200 400 600 800 1000 1200 1400
Heig
ht, µ
m
Position, µm
NIST SRM 1 filtered profilePeaksValleys
Extrema found by "Sweep", minimum height 0.2 µm, minimum width 6 µm, sweep step 0.1 µm
-2
-1.5
-1
-0.5
0
0.5
1
1.5
400 500 600 700 800 900
He
igh
t, µ
m
Position, µm
NIST SRM 1 filtered profile
Peaks
Valleys
Extrema found by "Sweep", minimum height 0.2 µm, minimum width 6 µm, sweep step 0.1 µm
This document is a research report submitted to the U.S. Department of Justice. This report has not been published by the Department. Opinions or points of view expressed are those of the author(s)
and do not necessarily reflect the official position or policies of the U.S. Department of Justice.

32
THE SEARCH ROUTINE
The basis of the search algorithm is the comparison of the maxima or peaks of the profiles,
which are then catalogued whenever they contribute to a matching consecutive sequence of
minimum length on another bullet. The width of the spacing increments depends upon the
accuracy with which the locations can be determined which is about 2 microns which is slightly
better than a firearms examiner can likely distinguish from a gray scale image in a comparison
microscope at 40x which is somewhere between 5 and 20 microns. Thus for a Beretta pistol,
where the land and groove impressions are 1.9 millimeters wide there are 950 possible positions
into which the prominent features can be assigned. Thus the bullet can be described as a series
of N numbers, corresponding to the number of possible positions and the method is summarized
in figure 13 in terms of matching the surface profiles of two bullets derived from such confocal
microscopy data. The line profiles across the surfaces as well as the 2 micron wide extrema
locations are depicted in blue for one bullet and red for the other.
Figure 13. A schematic representation of the profile matching
Comparison of two bullet profiles
0
500
1000
1500
2000
2500
3000
3500
4000
4500
640 650 660 670 680 690 700 710 720 730 740
Distance in microns
He
igh
t in
mic
ron
s
Series1
Series2
This document is a research report submitted to the U.S. Department of Justice. This report has not been published by the Department. Opinions or points of view expressed are those of the author(s)
and do not necessarily reflect the official position or policies of the U.S. Department of Justice.

33
Once determined the locations of the extrema are then entered into an Excel™ program that
provides a determination of all the potential consecutive matches as well as a ranking system
based upon those that are most unlikely to occur at random. As mentioned the correspondences
between these peaks or prominent features of the reconstructed topography are not the same as
the actual striae locations in the optical images although we have constructed the search routine
so that the number of extrema and the number of striae are approximately the same. Nevertheless
the occurrence of consecutively matching extrema is more common than consecutively matching
striae because only the locations are being distinguished, compared to the various contrast levels
that also distinguish striae in an optical image.
The Excel portion of the program can accept lateral extrema locations from either a portion or
the entirety of the land impression as long as they are referenced to the location of the leading
edge. The program compensates for small errors in the peak locations because of the chosen
resolution, typically 2 microns and the possibility that the profiles may be displaced between the
bullets, based upon the distance of the peak from the leading edge, which is typically 30 microns.
The output of the Excel file is a list of the matches for the entire bullet with the least likely at the
top of the list. The database we created included data from all the 281 bullets that were available
to us and was expanded in size by introducing random number generated sequences, with the
same population distribution of feature as the actual data, to 90,000 bullets.
Thus the first step to these algorithms is to convert the extrema locations to an integer value
between 1 and 950 in the case of a Beretta at 2 microns resolution. The macro in the Excel file
searches for all of the different sequences down to some chosen value of n and although not as
fast as a professionally structured search routine has proven to be quite adequate. A copy of the
database program in Excel containing all the scanned land impressions is included in Appendix 2
This document is a research report submitted to the U.S. Department of Justice. This report has not been published by the Department. Opinions or points of view expressed are those of the author(s)
and do not necessarily reflect the official position or policies of the U.S. Department of Justice.

34
and can be run on most windows laptops. As new programs and data files become available they
are posted to https://www.dropbox.com/sh/b11uhfanb52z6gj/o-rHdYwf-n
which also contains the programs that were distributed at the 2013 AFTE workshop.
This database algorithms can be used to either compare one bullet to all the bullets in the
database or all the bullets in the data base to each other, the latter obviously taking considerably
longer. All the algorithms are written as macros in the same Excel file, which can hold up to
240,000 bullets. The search algorithms basically compare the entire integer strings from the
land impressions to determine the presence of consecutively matching extrema. The accuracy of
the search is determined by two parameters: the tolerance, which is the error in the determination
of the lateral position of the extrema, which is typically 2 microns and the shift, which is the
error in the determination of the leading edge, which is typically 30 microns. To compare the
signatures of all the bullets in the database all the land-land comparisons are determined first and
the individual sequences that are found are then assigned a probability value, based upon the
likelihood of them having occurred by random chance and these probabilities are then multiplied
together to provide a probability for the particular bullet-bullet comparison. The land impression
data for the bullets are collected in a standard sequence (with the base of the bullet facing away
from the operator the bullets are rotated anticlockwise to the next land) although the land-land
offset between the subject and reference bullets is not known a priori, as is the case in the
manual comparison of bullets. Finally the probabilities for the entire bullet-bullet match are
calculated for all the six possible offsets by simply multiplying the six land-land match
probabilities together. The program then produces a list of the most likely matches based upon
the lowest values of the probabilities for the sequences that occur on the bullet. Once the search
of the entire database has been completed additional searches can be performed for single or
This document is a research report submitted to the U.S. Department of Justice. This report has not been published by the Department. Opinions or points of view expressed are those of the author(s)
and do not necessarily reflect the official position or policies of the U.S. Department of Justice.

35
batch additions using the same methodology.
The control page of the spreadsheet is shown in figure 14 where the results are displayed for an
example where bullet 6 in the database was compared to all other bullets with the result that it
matched bullet 171 which was the 2nd bullet fired from the particular gun.
Figure 14. The first tab or page of the excel search algorithm
The first button “Add one or more bullets: compare each to all” on the top left of the control
page (figure 15) is for uploading land impressions into the database, where they appear under the
Exts_1, Exts_2 Ext_3 tabs.
Figure 15. The buttons that initiate the macros on the first tab of the excel search algorithm
This document is a research report submitted to the U.S. Department of Justice. This report has not been published by the Department. Opinions or points of view expressed are those of the author(s)
and do not necessarily reflect the official position or policies of the U.S. Department of Justice.

36
The button to the right of that initiates the comparison of each bullet in the database to all others.
The third button from the left allows the user to compare a specific bullet to all the bullets in the
database, by inserting the number assigned to the bullet and the fourth button allows the user to
compare one bullet to any other bullet in the database and see all the sequences present. The
lower colored region to the left displays the number of land impressions in the database and next
to that is the number of bullets.
Land impression signatures can be uploaded either by using the “Add one or more bullets:
compare each to all” control which opens another window (figure 16) where the files can be
loaded and the calculation then proceeds automatically.
Figure 16. The file window superimposed on the first tab of the excel search algorithm
The files can alternatively be pasted directly into the Ext pages but then the number of bullets
and land impressions must be corrected manually or a negative number can be entered into the
“Bullets in DB” section and when one of these two buttons is depressed it will automatically
recreate the bullet list (figure 17).
This document is a research report submitted to the U.S. Department of Justice. This report has not been published by the Department. Opinions or points of view expressed are those of the author(s)
and do not necessarily reflect the official position or policies of the U.S. Department of Justice.

37
Figure 17. The data input section on the first tab of the excel search algorithm
The controls on the right are for the adjustment of the shift and tolerance values, as well as the
minimum length of the sequences that contribute to the probabilities. It is also possible to display
the file names of the listed matches with the ‘interpret matches’ button after a calculation, which
can also be interrupted and cancelled with the stop button (figure 18).
Figure 18. The locations for adjusting the resolution and profile displacement on the first tab of
the excel search algorithm
In addition to the control page there are additional pages that contain the actual database (Exts_1,
Exts_2 and Exts_3) and other data (figure 19).
Figure 19. The tabs or pages of the excel search algorithm
In order to determine the bullet number, the user can refer to the Bullet tab shown in figure 20
where the first column (A) is the bullet number, column B is the name of the bullet, the Y in
This document is a research report submitted to the U.S. Department of Justice. This report has not been published by the Department. Opinions or points of view expressed are those of the author(s)
and do not necessarily reflect the official position or policies of the U.S. Department of Justice.

38
column C indicates that all the land impressions are included and the columns from F-K the land
impression numbers that are referred to in the database.
Figure 20. The bullet tab or page of the excel search algorithm
The Database is stored in the Exts_1 page (figure 21) using two rows, the first of which contains
a heading that describes the land number and bullet identification information and the second the
individual locations of the extrema on the land impression. The additional tabs Exts_2 and
Exts_3 are also for land impression data since each tab holds 80,000 bullets (480,000 land
impressions). The Probabilities tab is the page that contains the precalculated probabilities of the
individual sequences used in the calculations and the PrevResults is for copying and pasting
previous runs for comparison purposes.
This document is a research report submitted to the U.S. Department of Justice. This report has not been published by the Department. Opinions or points of view expressed are those of the author(s)
and do not necessarily reflect the official position or policies of the U.S. Department of Justice.

39
Figure 21. The integer strings and bullet identification information that is used in the database
Referring back to the Control page, the results will look similar to the image below after a
calculation (figure 22). The first four columns refer to the number and label of the reference
bullet and the potentially matching bullet and the Land offset refers to the phase of the match.
Figure 22. The result of a calculation as it appears on the first page of the spreadsheet
For example if land 1 of bullet 1 matches to land 1 of bullet 2 the land offset is 0 but if land 1 of
bullet 1 matches to land 2 of bullet two the phase is one and so on up to 5. Complete means that
the two bullets being compared both had data for all six land impressions. Finally, the
This document is a research report submitted to the U.S. Department of Justice. This report has not been published by the Department. Opinions or points of view expressed are those of the author(s)
and do not necessarily reflect the official position or policies of the U.S. Department of Justice.

40
probability is displayed which is the product of all the probabilities that the individual sequences
should appear by random chance.
RESULTS OF THE DATABASE SEARCH ROUTINES
At the conclusion of the present study we were able to create a database that contained 281 fired
bullets 232 of which were duplicate firings; that is there were 116 pairs of bullets fired from the
same guns. These were all the bullets available to us and included our own firings as well as
bullets provided to us by Derrick McClarin at the Alabama forensic science laboratory Mike
Giusto at the California criminalistics Institute and Chris Coleman at the Contra Costa Crime
Laboratory which was the origin of the majority of the bullets. No particular effort was made to
determine the quality of the individual impressions on these bullets although those from
Alabama were particularly well marked. An additional 100 theoretical bullets were added to the
database providing a total of 2,286 individual land impressions.
The program was then run at a tolerance of 2 and a shift of 30, that is the error in the precision of
the peak location was allowed to be as large as plus or minus 2 microns and the precise location
of an matching sequence could be displaced by plus or minus 30 microns from the chosen
location of the leading edge. The program was first run to identify those bullets in the database
that matched each other involving over two and a half million comparisons and resulted in 68 of
the 116 bullets being distinguished before the first false positive, that is a known non-match
appearing in the list.
When the duplicate bullets that were not identified were individually extracted from the database
and the program then run to search for the singular counterpart 80 of the 116 bullets, about 70%
appeared at the top of the list and an additional 11 bullets were located somewhere within the
This document is a research report submitted to the U.S. Department of Justice. This report has not been published by the Department. Opinions or points of view expressed are those of the author(s)
and do not necessarily reflect the official position or policies of the U.S. Department of Justice.
41
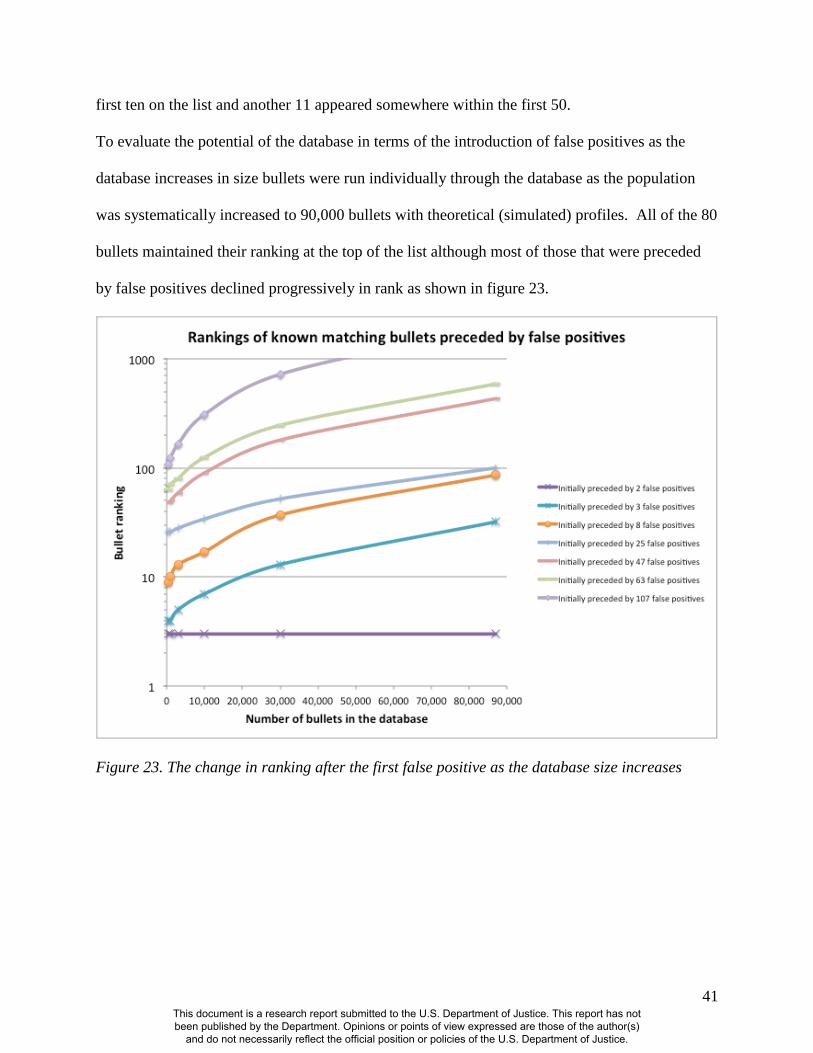
first ten on the list and another 11 appeared somewhere within the first 50.
To evaluate the potential of the database in terms of the introduction of false positives as the
database increases in size bullets were run individually through the database as the population
was systematically increased to 90,000 bullets with theoretical (simulated) profiles. All of the 80
bullets maintained their ranking at the top of the list although most of those that were preceded
by false positives declined progressively in rank as shown in figure 23.
Figure 23. The change in ranking after the first false positive as the database size increases
This document is a research report submitted to the U.S. Department of Justice. This report has not been published by the Department. Opinions or points of view expressed are those of the author(s)
and do not necessarily reflect the official position or policies of the U.S. Department of Justice.

42
REFINEMENTS TO THE NUMERICAL PROBABILITIES
The subjective interpretation of the significance of a tool mark comparison is at best a simplistic
approach to a complicated problem and in some instances it can be totally misleading. Although
common sense would seem to dictate that the more correspondence there is the greater the
likelihood that the tool marks are derived from the same object, it was unequivocally
demonstrated by Biasotti in the 1950’s [2] that this premise could not be validated for bullets. A
calculation of the probabilities for this type of one-dimensional analysis reveals that the problem
arises because of the large variation in the number of impression marks from sample to sample
on the land impressions and so a straightforward analysis based of the level of correspondence
will not be successful. Nevertheless everything seems to indicate that cross correlation
techniques and therefore straightforward comparisons are the basis for most of the current
database search routines, which may indeed be the major contribution to their very limited
success.
The approach that is presented here, although generally described as an extension of the CMS
approach, also has a strong theoretical foundation and is in fact based upon the original
calculations we did for this method that we published in 2008 [11]. There are in fact some
corrections that need to made to that paper because we neglected the binomial expansion of the
final terms and thus provided expectations rather than the probabilities that are shown below
(figure 24).
This document is a research report submitted to the U.S. Department of Justice. This report has not been published by the Department. Opinions or points of view expressed are those of the author(s)
and do not necessarily reflect the official position or policies of the U.S. Department of Justice.

43
Figure 24. The variation in the probability of the number of consecutively matching striae on a
1.9 mm land impression containing 80 striae as it varies with the resolution.
Nevertheless an important aspect to this approach is that the results of the searches when a match
is found can be quantitatively assessed because we incorporate the probability of any particular
sequence occurring at random into the database which we have used as a basis for the ranking
system. The probabilities used in the program are calculated algebraically and since the
corrections for the consequences of the shift or displacement reduces them by only a minimal
amount one can use the database to quantify the significance of the match
FINDINGS THAT PERTAIN TO CONVENTIONAL OPTICAL DATABASES
Although confocal microscopy has the greater potential for precisely cataloguing the impression
evidence on a bullet compared to the conventional optical images of the bullet surface there are
steps that could be taken to overcome the problem that the bullets are likely not going to be
This document is a research report submitted to the U.S. Department of Justice. This report has not been published by the Department. Opinions or points of view expressed are those of the author(s)
and do not necessarily reflect the official position or policies of the U.S. Department of Justice.
44
optimally configured on the microscope stage. The problem as we have discovered is mostly one
of bullet orientation and this can be overcome to a large extent by maintaining a consistent
illumination condition and including multiple images of the individual bullets. The study of
image comparisons and the cross correlation values as a consequence of stepping the NIST
standard bullet though half a degree orientations were evaluated and a positioning error of two
degrees is likely to result in a high proportion of unrecognizable contrast profiles. The
consequence of this is that the databases could probably be improved by using sets of 5 optical
images taken at half-degree intervals from each bullet, although this may not be a guaranteed
solution because there is of course a five-fold increase in the size of the database. That the
problem with the current databases is one of false positives this strongly suggests that there are
also problems with the search routines, however, it would certainly be possible to use the same
ones we are suggesting for the confocal database. In terms of utilizing the data that has already
been gathered for the NIBIN database we were unable to find a way to extract them from the
system but if this is in fact possible it would certainly be fairly straightforward to implement
alternative search routines.
Determining whether or not improvements can be made is obviously beyond the scope of this
study; however since the processing and search routines are already in place and since this may
at some time want to be investigated we proceeded with the creation of an alternative database of
conventional optical microscope images, that included both the multiple image sets and
processing routines. We presented this at the 2013 AFTE meeting where it also served the
purpose of introducing the concept of this type of database in a format that Firearms examiners
could actually utilize for their own purposes.
Obviously these same routines could be used by anyone to experiment with an optical database
This document is a research report submitted to the U.S. Department of Justice. This report has not been published by the Department. Opinions or points of view expressed are those of the author(s)
and do not necessarily reflect the official position or policies of the U.S. Department of Justice.

45
and the process begins by processing of the images using ImageJ [17-19]. This is a free software
program that can be used to convert the images into an intensity profile across the land
impression that can subsequently be compared to other profiles that are derived from different
bullets. These profiles can then be read into the peak finding routine we developed in Microsoft
Excel that essentially catalogues the position of the individual striae from the leading edge of the
land impression, which can then be uploaded into to the Database
The step-by-step instructions for this procedure are shown as Appendix 3 and the programs are
available at https://www.dropbox.com/sh/b11uhfanb52z6gj/o-rHdYwf-n in electronic form.
CONCLUSIONS
The conclusions that can be drawn from this work indicate that the construction of a large-scale
national database for bullets should be feasible utilizing a three dimensional consecutive
matching approach. The results of this work indicate that the database in its current form has a
success rate of around 60% for a range of land impression quality and does not break down when
the number of land impressions from the same type of bullet exceeds 500,000. This database
does not directly support the validity of the techniques of comparison microscopy because of the
distinctions between striae and extrema however it can certainly be used to refute the assertion
that the disappointing results of past databases reflect upon it.
The implications of this study pertain to several of the issues facing the field of firearms
examination. Most importantly it provides the methodology for actually constructing a workable
bullet database. It also provides a method for quantifying the significance of a bullet match,
although it involves aspects of the topography that may not be recognizable by the examiner.
There are also consequences that are relevant to the way in which current search algorithms
This document is a research report submitted to the U.S. Department of Justice. This report has not been published by the Department. Opinions or points of view expressed are those of the author(s)
and do not necessarily reflect the official position or policies of the U.S. Department of Justice.

46
could be improved for data base applications as well as clarifying the techniques of confocal
microscopy that have been suggested to pertain to this particular discipline [20-22]. Simply
substituting confocal microscopes for the optical microscopes is unlikely to provide any
improvement with regard to current bullet databases because they probably require fundamental
changes to the search algorithms.
Further research in this area that would be of direct benefit would be the development of
computer software for scanning curved surfaces that could dramatically reduce the data
acquisition times as well as routines to truly compare the reconstructed three-dimensional
topography which is not available for any of the commercial systems that have been examined.
At the present time, since conventional optical microscopy is actually more suited to the
detection of the small surface irregularities associated with this type of impression evidence, it
may also be worth further investigation of the focus variation microscopes as an alternative even
though we have had only limited success with this instrumentation.
Given the success of this database routine it is certainly worth considering how it may be
applied. The data acquisition procedure is straightforward enough that any laboratory could
consider implementing the method and given the cost of these types of LED confocal
microscopes it is probably the staffing rather than equipment acquisition that would be the
greatest expense. We are currently capable of scanning approximately 10 bullets a day and so a
real database of 10,000 bullets would take about a year with 3 confocal instruments.
REFERENCES
1. Richards V. MS Thesis University of California Davis (2013)
2. Biasotti, A. A. A Statistical Study of the Individual Characteristics of Fired Bullets,”
Journal of Forensic Sciences, Vol. 4, no.1, pp. 34-50.(1959)
This document is a research report submitted to the U.S. Department of Justice. This report has not been published by the Department. Opinions or points of view expressed are those of the author(s)
and do not necessarily reflect the official position or policies of the U.S. Department of Justice.

47
3. Biasotti, A. A., and J. Murdock. Criteria for identification in firearms and toolmark
identification. AFTE Journal, 16 (4): 16-24. (1984)
4. AFTE Criteria for Identification Committee. Theory of identification, range striae
comparison reports and modified glossary definitions – AFTE criteria for identification
committee report. AFTE J 24 (2): 336-340. (1992)
5. Biasotti, A.A, and J.E. Murdock. Firearms and toolmark identification: Legal issues and
scientific status. In Modern Scientific Evidence: The Law and Science of Expert
Testimony, Eds. D.L. Faigman, D.H. Kay, M.J. Saks, and J. Sanders, 124 – 151. St Paul:
West Publishing Co. (1997)
6. Nichols, R. G. “Firearm and Tool mark Identification Criteria: A Review of the
Literature,” Journal of Forensic Sciences, 42(3):466-474. (1997)
7. Miller, J. and McLean M. Criteria for identification of tool marks. AFTE Journal,
30(1):15. (1998)
8. Nichols, R. G. “Firearm and Tool mark Identification Criteria: A Review of the Literature,
Part II,” Journal of Forensic Sciences, 48(2):318-327. (2003)
9. Nichols, R. Consecutive matching striations (CMS): Its definition, study and application
in the discipline of firearms and toolmark identification. AFTE J 35 (3): 298-306. (2003)
10. Tomasetti, K. Analysis of the essential aspects of striated toolmark examination and the
methods for identification. AFTE J 34 (3): 289-301. (2002)
11. Howitt, D. G., Tulleners, F., Cebra K. C., and Chen, S. J. A Calculation of the Statistical
Significance of Matched Bullets, Journal of Forensic Sciences, 53, 4: 868-875, (2008).
12. Chu, W., Song, J., Vorburger, T., Yen, J., Ballou, S. and Bachrach B., Pilot Study of
Automated Bullet Signature Identification Based on Topography Measurements and
Correlations. J. Forensic Sci. 55(2), 341-347 (2010).
13. Bachrach, B., Development of a 3D-based automated firearms evidence comparison
system, J Forensic Sci. 47(6), 1253-1264 (2002).
14. NIST Standard Bullet. http://www.nist.gov/pml/div683/grp02/sbc.cfm
15. Palshikar ïG. Simple Algorithms for Peak Detection in Time-Series, Proceedings of 1st
IIMA International Conference on Advanced Data Analysis, Business Analytics and
Intelligence, Ahmedabad, India, (2009).
16. O’Haver T. http://terpconnect.umd.edu/~toh/spectrum/SignalProcessingTools.html (2013)
This document is a research report submitted to the U.S. Department of Justice. This report has not been published by the Department. Opinions or points of view expressed are those of the author(s)
and do not necessarily reflect the official position or policies of the U.S. Department of Justice.

48
17. Rasband, W.S., ImageJ, U. S. National Institutes of Health, Bethesda, Maryland, USA,
http://imagej.nih.gov/ij/, (1997-2012).
18. Abramoff, M.D., Magalhaes, P.J., Ram, S.J. Image Processing with ImageJ. Biophotonics
International, 11, 7, pp. 36-42, (2004).
19. Schneider, C.A., Rasband, W.S., Eliceiri, K.W. "NIH Image to ImageJ: 25 years of image
analysis". Nature Methods 9, 671-675, (2012).
20. Bolton-King, R. S., Evans, J. P., Smith, C. L. Painter, J. D., Allsop, D. F. and Cranton W.
M. What are the prospects of 3D profiling systems applied to firearms and tool mark
identification”. AFTE Journal 42, 1 (2010).
21. Xie, F., Xiao, S., Blunt, L., Zeng, W. and Jiang, X., Automated bullet-identification
system based on surface topography techniques, Wear 266(5-6), 518–522 (2009)
22. Banno, A., Masuda, T. and Ikeuchi, K., Three dimensional visualization and comparison
of impressions on fired bullets, Forensic Sci. Int. 140(2), 233-240 (2004).
ACKNOWLEDGEMENTS
This work was supported by the National Institute of Justice under Award Number 2009-DN-
BX-K257.
This document is a research report submitted to the U.S. Department of Justice. This report has not been published by the Department. Opinions or points of view expressed are those of the author(s)
and do not necessarily reflect the official position or policies of the U.S. Department of Justice.