a computerized data-reduction technique - … · a computerized data-reduction technique for ......
TRANSCRIPT
2 E
A COMPUTERIZED DATA-REDUCTION TECHNIQUE FOR LANGMUIR PROBE ANALYSIS OF ELECTRON TEMPERATURE VARIATIONS I N THE EXHAUST OF A MAGNETOPLASMADYNAMIC ARC
by David R. Brooks and James M . Hoe/& Jr.
L.”tngZey Reseurcb Center ZangZey Stution, Humpton, Vu.
N A T I O N A L A E R O N A U T I C S A N D SPACE A D M I N I S T R A T I O N W A S H I N G T O N , D. C. N O V E M B E R 1967
i #k
https://ntrs.nasa.gov/search.jsp?R=19670030730 2018-07-09T11:09:36+00:00Z
TECH LIBRARY KAFB, NM
I lllllllllllllllllllllnllllllllllll llllllll 0230889
NASA TN D-4220
A COMPUTERIZED DATA-REDUCTION TECHNIQUE FOR
LANGMUIR PROBE ANALYSIS OF ELECTRON TEMPERATURE VARIATIONS
IN THE EXHAUST OF A MAGNETOPLASMADYNAMIC ARC
By David R. Brooks and J a m e s M. Hoell, Jr.
Langley Resea rch Center Langley Station, Hampton, Va.
N A T I O N A L AERONAUTICS AND SPACE ADMINISTRATION
For sale by the Clearinghouse for Federal Scientific and Technical Information Springfield, Virginia 22151 - CFSTI price $3.00
A COMPUTERIZED DATA-REDUCTION TECHNIQUE FOR
LANGMUIR PROBE ANALYSIS OF ELECTRON TEMPERATURE VARIATIONS
IN THE EXHAUST OF A MAGNETOPLASMADYNAMIC ARC
By David R. Brooks and James M. Hoell, Jr. Langley Research Center
SUMMARY
A computerized technique is described whereby Langmuir probes may be used effectively to obtain detailed local measurements of electron temperature in the plasma beam produced by a 5- to 10-kW magnetoplasmadynamic accelerator. To achieve the necessary spatial resolution, on the order of 1000 values of electron temperature must be obtained for each operating condition of the accelerator. A 60-Hz probe-driving voltage and an automatic data-reduction system are used to obtain and analyze Langmuir probe characteristics. Accurate position correlation is provided by a specially designed probe driver. for processing on the Langley IBM 7040-7094 DCS computer system.
Probe curves and position information a r e recorded on FM tape and digitized
Analytical problems encountered when interpreting Langmuir probe characteristics in high-power magnetized plasmas are discussed. A detailed description is given of methods for coping with large quantities of probe data which represent a wide spectrum of operating conditions. It is shown that, in the MPD arc, position surveys of electron tem- perature may be given as values averaged over scattered data with a standard deviation resulting from electron-temperature fluctuations in time.
INTRODUCTION
One of the basic problems encountered in magnetoplasmadynamic accelerator research is the detailed analysis of the structure of the plasma exhaust beam produced by such devices. The importance of this information cannot be overemphasized, for only through knowledge of local properties of the plasma beam can acceleration mechanisms be understood and optimized. As opposed to a previously published computer technique (ref. 1) suited for limited analysis of probe data obtained from relatively quiescent plas- mas, the independently derived techniques described here are particularly suited for com- plete analysis of large quantities of data obtained in extensive surveys of the highly struc- tured environment of the MPD arc.

The plasma produced by the MPD a r c poses formidable diagnostic problems. Mea- surements a r e complicated by the existence of a three-dimensional structure in ion flow velocity with an axial flow velocity on the order of 104 meters/second, and a radial and axial structure in electron temperature, potential distribution, and density. In addition, the structural complexity makes difficult the use of some measurement techniques which would otherwise be desirable because they do not involve actual placement of a probing device in contact with the plasma. (The disadvantage of such methods is that they a r e generally best suited only for average measurements in fairly homogeneous plasmas.) Finally, when forced to use probing devices to uncover internal structure, the investigator is faced with the dual problem of (a) constructing and maintaining diagnostic equipment which will perform reliably both mechanically and electrically in a vacuum environment under the high heat loads presented by the plasma beam and (b) interpreting results obtained in an environment that is electrically noisy and structurally complex and that requires the variation of many independent parameters for a complete picture of a r c behavior.
The plasma beam having a charge density of about 1011/cm3 to 1013/cm3) is in ( principle accessible to analysis through the use of Langmuir probes. The analytical problems peculiar to f ree molecular Langmuir probe theory as applied to probes used in MPD a rcs ar ise from the presence of a large ion flow velocity and an axially symmetric dc magnetic field with an intensity on the order of 0.01 Wb/m2 in the region of measure- ment. large body of work, both theoretical and experimental, to aid in their interpretation. (A comprehensive bibliography is found in ref. 2.)
Once probe characteristics have been obtained under such conditions, there is a
In the idealized case of a quiet unmagnetized plasma, the information available from Langmuir probes includes electron temperature, plasma potential, and, indirectly, density and charged-particle flow velocities. However, the only plasma parameter that can be obtained directly from a probe characteristic taken in an MPD a r c is the electron tem- perature. The other important parameters , including plasma potential, must be calculated in an indirect manner which in each case includes a theoretical dependence on electron temperature. Hence detailed knowledge of electron temperature is especially important to analysis of the MPD a r c and, because of the relative ease with which other parameters can be included once the theory is known, the basic purpose of the probe data acquisition and reduction system is to provide a detailed survey of electron temperature. It is the purpose of this technical note to describe such a system, designed for use in conjunction with a high-speed digital computer.
2
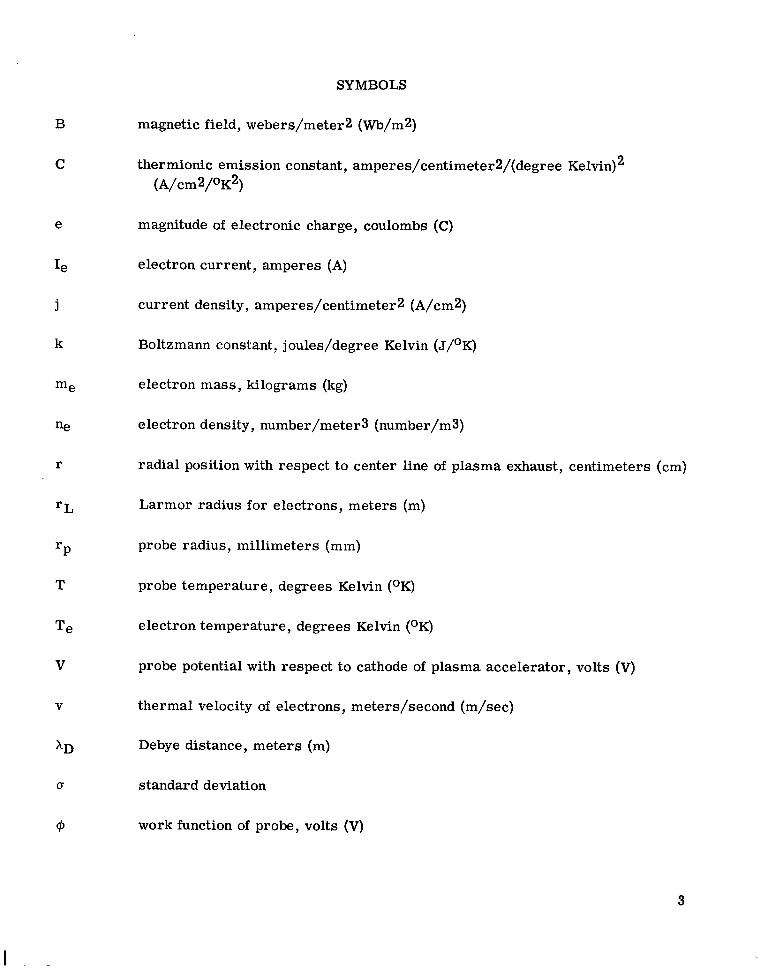
SYMBOLS
B
C
e
Ie
j
k
me
ne
r
'L
'P
T
Te
V
V
magnetic field, webers/meter2 (Wb/m2)
thermionic emission constant, amperes/centimeterz/(degree Kelvin) 2
(A/cm2/OK2)
magnitude of electronic charge, coulombs (C)
electron current, amperes (A)
current density, amperes/centimeterZ (A/cm2)
Boltzmann constant, joules/degree Kelvin (J/OK)
electron mass, kilograms (kg)
electron density, number/meter3 (number/m3)
radial position with respect to center line of plasma exhaust, centimeters (cm)
Larmor radius for electrons, meters (m)
probe radius, millimeters (mm)
probe temperature, degrees Kelvin (OK)
electron temperature, degrees Kelvin (OK)
probe potential with respect to cathode of plasma accelerator, volts (V)
thermal velocity of electrons, meters/second (m/sec)
Debye distance, meters (m)
standard deviation
work function of probe, volts (V)
3
I
APPARATUS
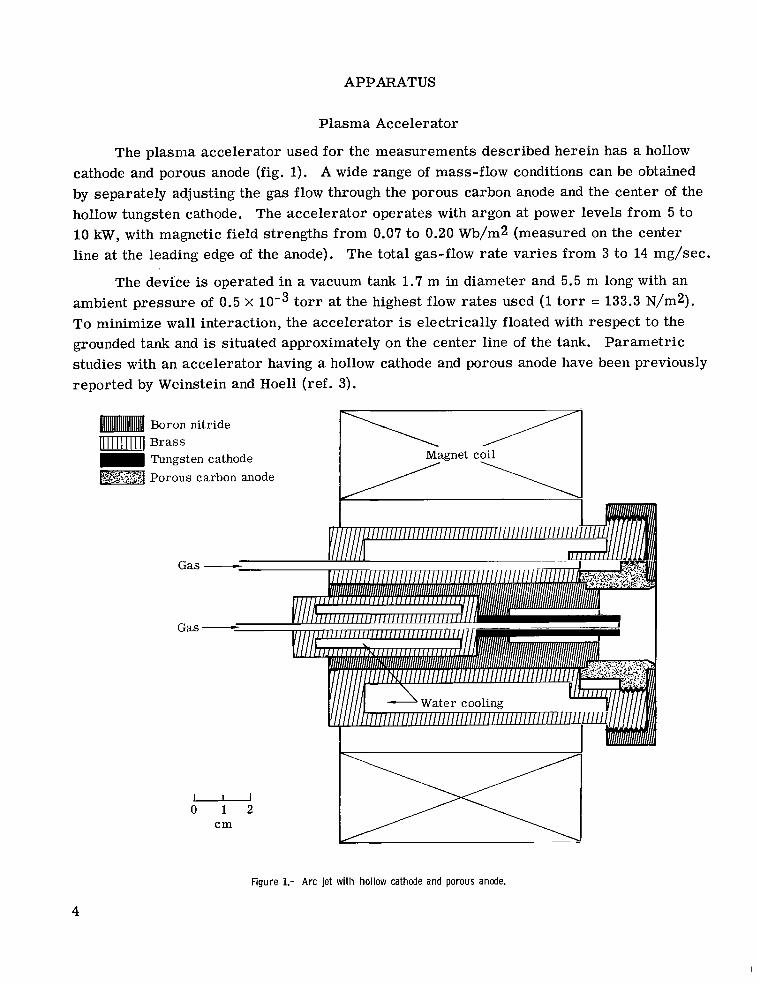
Plasma Accelerator
The plasma accelerator used for the measurements described herein has a hollow cathode and porous anode (fig. 1). A wide range of mass-flow conditions can be obtained by separately adjusting the gas flow through the porous carbon anode and the center of the hollow tungsten cathode. The accelerator operates with argon at power levels from 5 to 10 kW, with magnetic field strengths from 0.07 to 0.20 Wb/m2 (measured on the center line at the leading edge of the anode). The total gas-flow rate varies from 3 to 14 mg/sec.
The device is operated in a vacuum tank 1.7 m in diameter and 5.5 m long with an ambient pressure of 0.5 X
To minimize wall interaction, the accelerator is electrically floated with respect to the grounded tank and is situated approximately on the center line of the tank. Parametric studies with an accelerator having a hollow cathode and porous anode have been previously reported by Weinstein and Hoe11 (ref. 3).
t o r r at the highest flow rates used (1 tor r = 133.3 N/m2).
Boron nitride l m u Brass = Tungsten cathode
Porous carbon anode
Gas
Gas
W 0 1 2
cm
Figure 1.- Arc jet wi th hollow cathode and porous anode.
4
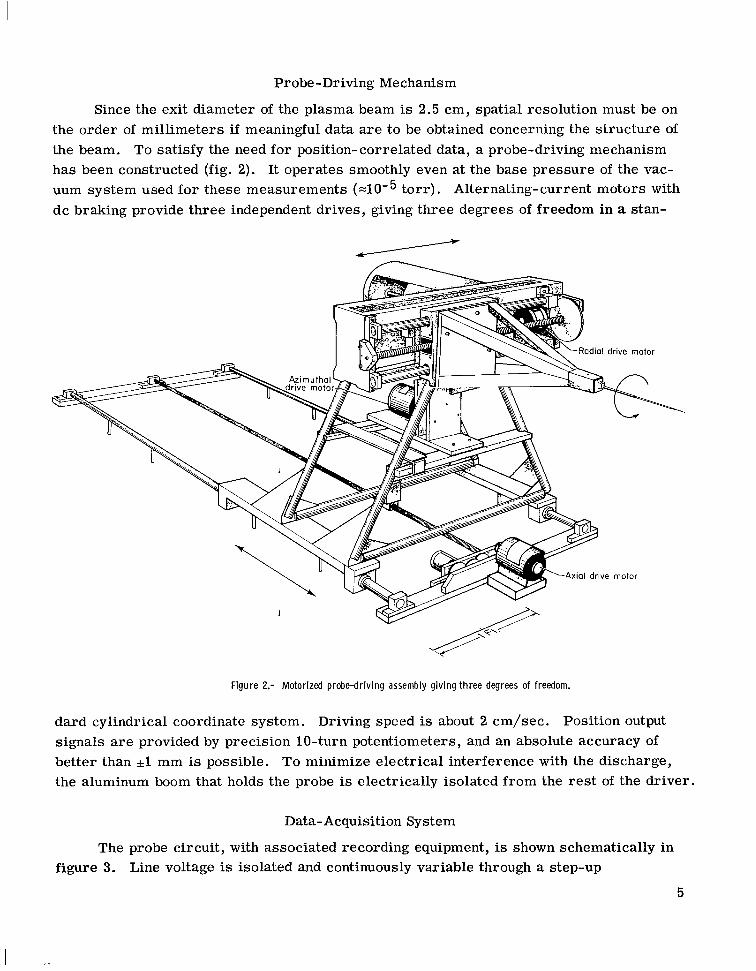
Probe -Driving Mechanism
Since the exit diameter of the plasma beam is 2.5 cm, spatial resolution must be on the order of millimeters if meaningful data a r e to be obtained concerning the structure of the beam. To satisfy the need for position-correlated data, a probe-driving mechanism has been constructed (fig. 2). It operates smoothly even at the base pressure of the vac- uum system used for these measurements torr) . Alternating-current motors with dc braking provide three independent drives, giving three degrees of freedom in a stan-
------
Axial drive motor
Figure 2.- Motorized probe-driving assembly giving three degrees of freedom.
dard cylindrical coordinate system. Driving speed is about 2 cm/sec. Position output signals a r e provided by precision 10-turn potentiometers, and an absolute accuracy of better than *l mm is possible. To minimize electrical interference with the discharge, the aluminum boom that holds the probe is electrically isolated from the res t of the driver.
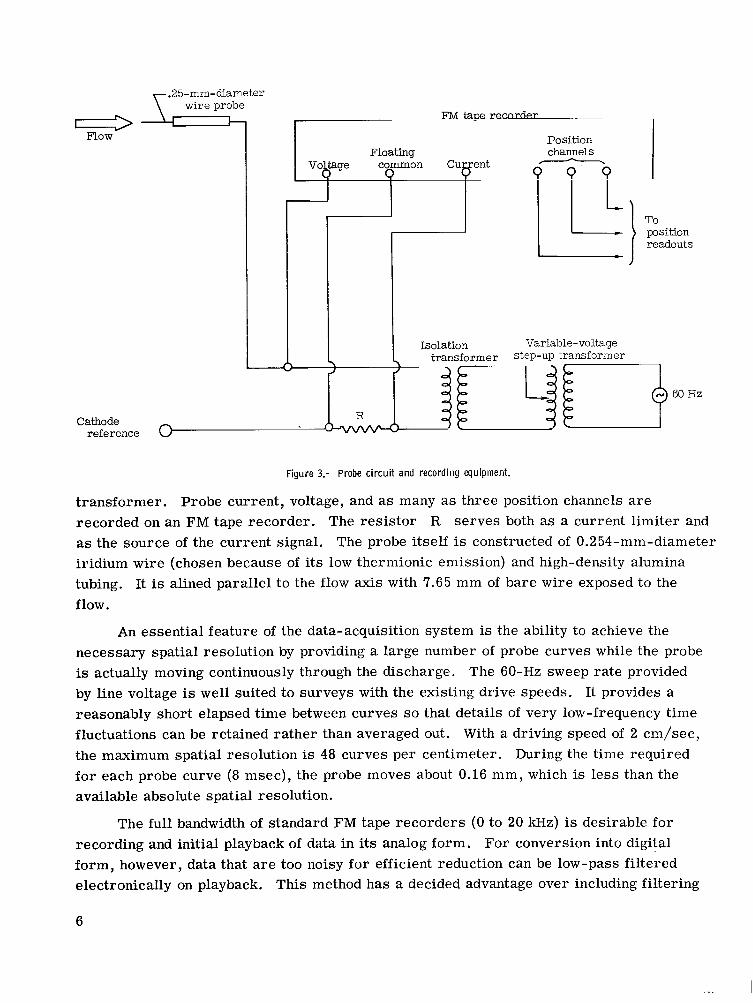
Data- Acquisition System
The probe circuit, with associated recording equipment, is shown schematically in figure 3. Line voltage is isolated and continuously variable through a step-up
5
I i.
.25-mm-diameter wire probe --
Flow
Cathode
FM tape r e c o r r 7 P r I
Floating Voltage common Cu
0
Position channels
To I position
readouts
transformer step-up transformer
reference
Figure 3.- Probe c i r cu i t and recording equipment.
transformer. recorded on an FM tape recorder. The resis tor R serves both as a current limiter and as the source of the current signal. The probe itself is constructed of 0.254-mm-diameter iridium wire (chosen because of its low thermionic emission) and high-density alumina tubing. It is alined parallel t o the flow axis with 7.65 mm of bare wire exposed to the flow.
Probe current, voltage, and as many as three position channels are
An essential feature of the data-acquisition system is the ability to achieve the necessary spatial resolution by providing a large number of probe curves while the probe is actually moving continuously through the discharge. by line voltage is well suited to surveys with the existing drive speeds. It provides a reasonably short elapsed t ime between curves so that details of very low-frequency time fluctuations can be retained rather than averaged out. With a driving speed of 2 cm/sec, the maximum spatial resolution is 48 curves per centimeter. During the time required fo r each probe curve (8 msec), the probe moves about 0.16 mm, which is less than the available absolute spatial resolution.
The 60-Hz sweep rate provided
The full bandwidth of standard FM tape recorders (0 to 20 kHz) is desirable for recording and initial playback of data in its analog form. For conversion into digital form, however, data that a r e too noisy for efficient reduction can be low-pass filtered electronically on playback. This method has a decided advantage over including filtering
6
in the probe circuit because the degree of filtering can be more readily adjusted to partic- ular situations during the data reduction process. For the present system, a 1760-Hz (real time) low-pass filter is used in all cases. This value is about 250 Hz higher than the minimum upper cutoff frequency that can be used without distorting the essential shape of the probe curves. (The filter must pass much more than the 60-Hz sweep fre- quency because the exponential nature of the probe current-voltage curve gives a rela- tively fast rise time to part of the current and voltage signals.)
LANGMUIR PROBE DATA REDUCTION
Analysis of Probe Curves in High-Power Magnetized Plasmas
The basic collisionless Langmuir probe theory is well known (ref. 2). For pur- poses of definition, the procedure for obtaining the electron temperature Te will be briefly summarized. From the probe current-voltage characteristic (I-V plot), electron current is computed by subtracting an extrapolation of the ion saturation current from the net probe current. Then, for Maxwellian electrons in the retarding field of the probe, the electron current density at the probe surface is given by
where j e is the random electron current density in the undisturbed plasma and Vpl is probe voltage with respect to the plasma. Taking the logarithm of both sides shows that for a Maxwellian distribution, the logarithm of the electron current is a linear function of probe voltage. The electron temperature can be found by differentiation:
90
That is, the slope of the curve of In Ie as a function of V is inversely proportional to Te. It is important to bear in mind that a temperature is defined in the usual sense only for the case where d(ln Ie)/dV is actually a straight line.
For Langmuir probe diagnostics in MPD arcs, only a limited portion of the theoreti- cal probe curve is available for analysis under experimental conditions of interest. There are two basic reasons for this limitation: (1) the presence of a dc magnetic field which distorts the electron saturation end of the probe curve and (2) thermal problems caused by the excessive electron current which can be drawn from a high-current device.
At present there is no general theory which relates plasma parameters to Langmuir probe curves taken in the presence of an imposed magnetic field. While a detailed dis- cussion of the problem is beyond the scope of this technical note, it is important t o
7
understand the possible effect of a magnetic field on Langmuir probe measurements. Whereas for geometrically symmetric Langmuir probes, electron collection in an unmag- netized plasma is isotropic and localized within roughly a few Debye distances from the probes (AD = 69J-L meters), a large external magnetic field results in highly aniso- tropic and nonlocalized collection when rL < rp, where rL is the electron Larmor radius, vme/eB. Because of the relative ease with which charged particles move along magnetic-field lines, all probes would become, roughly speaking, plane probes which see a particle flux streaming along a tube of radius rL and undetermined length 1 parallel to the flux lines.
Since 1 can be much greater than the Debye length, the probe can collect a large part of its current from some other location many Debye distances away and the local nature of the measurement would be destroyed. However, even with a magnetic field it is possible to define portions of the probe curve, depending on particle energies and field values, where the Larmor radius for the collected particles is still larger than both the Debye length and the probe diameter. values, within an order of magnitude, a r e AD = 0.01 mm, rp = 0.1 mm, and rL = 1 mm. Larmor radii of ions a r e at least 100 mm. Under such conditions, the probe theories for localized collection in unmagnetized plasmas (zero-field approximation) should apply. Clearly, if such regions exist, they will correspond to the regions where ions (large mass) o r high-energy electrons (large velocity) a r e collected. With respect to the voltage applied to the probe, these considerations mean that only the electron current corre- sponding to probe voltages near the floating potential can be used.
For the accelerator described herein, typical
When interpreting probe curves obtained in a plasma accelerator, it is necessary to consider the possibility that electron temperatures may be a function of the orientation of the probe with respect to the magnetic field and the ion flow velocity. However, it has been shown that the magnetic-field orientation is not critical in the cases where the zero- field approximation may be applied (ref. 4) and that Te measurements a re not affected by the presence of a plasma flow velocity as long as the electron thermal velocity is much greater than the plasma flow velocity (ref. 5).
Another important problem of interpretation a r i ses from the fact that Langmuir probe theories a r e generally predicated on Maxwellian electron distributions. One can question the accuracy of inferring a Maxwellian distribution from a high-energy tail that appears Maxwellian. This question cannot be answered directly without an independent determination of the complete distribution function. However , it is assumed that the entire distribution function is Maxwellian if the variation of In I, with V is linear over the range of electrons being collected (about 10 percent of the total number for the mea- surements used in this work).
8

The electron current that can be collected by a probe in an MPD a r c is always much larger than can be used practically. Unless the current level in the probe circuit is externally limited, enough electron current will be drawn to heat the probe to emission temperature and perhaps destroy it. In addition, the current may' be an appreciable frac- tion of the total a r c current, in which case the effectiveness of the probe as a diagnostic tool is destroyed. Fortunately, the lower electron-current level that is compatible with these considerations merely eliminates the portion of the probe curve that cannot be used in the presence of a magnetic field.
During normal operation the probe used for these measurements is hot enough to emit visible light but is still below the temperature at which electron emission becomes a serious problem. For example, at the highest a r c powers tested the probe reaches a temperature of 2100° K at a distance of 5.0 cm downstream from the anode face when left exposed to the flow for several seconds. The temperature reading, made with a micro- optical pyrometer, is only approximate since the emissivity of the iridium wire is not precisely known. However, the Dushman equation, j = CT2e-e@/kT, can be used to pro- vide an upper limit on emission for a particular temperature. For the iridium probe used, taking C = 100 A/cm2/OK2, @ = 5.31 V, and a probe area of 6 X 10⁻² cm2, an emission current of less than A is predicted at T = 2100° K. This value is negligi- ble with respect to the probe current levels encountered (-10 to 100 mA). If the probe is moved too close to the accelerator electrodes, typically closer than 2 anode diameters, substantial thermionic emission occurs even when probe exposure time is minimized. This effect provides the limit on the distance of closest approach to the electrodes.
Reduction of Taped Data
The use of tape recording and its associated computerized processing is admittedly an indirect and complex process, but it is necessitated by the following fact: to achieve the required spatial resolution both axially and radially, approximately 1000 probe curves must be analyzed for each running condition. In the case of the hollow-cathode accelera- tor, a running condition is specified by four independent quantities: cathode and anode gas flow, arc current, and magnetic field.
It is estimated that in the course of developing the computer techniques described in this technical note, at least 20 000 separate probe curves have been processed. With this quantity of data, it is obvious that (1) data reduction cannot be efficiently accomplished by hand, and (2) to achieve much increase in efficiency, the time required to set up a comput- erized data-reduction system and guide a large flow of information through several stages of processing must be compensated for by a resulting system that does not require numer- ous programing changes to handle the unavoidable changes in the detailed behavior of the data. In order to develop an efficient reduction system, several steps were decided upon at the initiation of the experimental program:
9
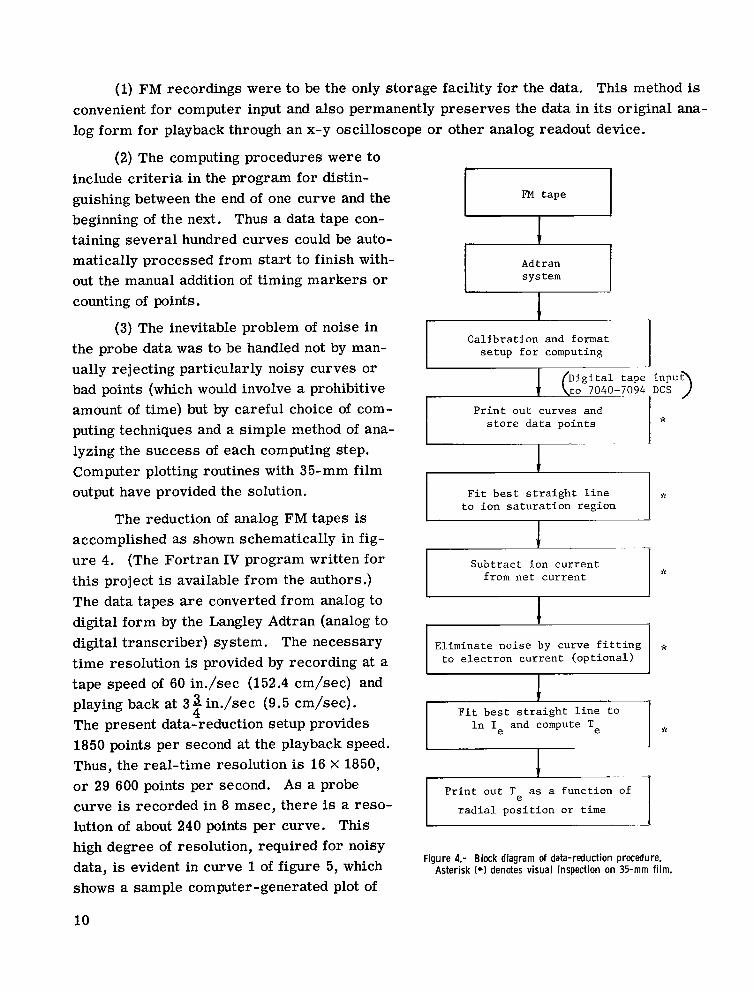
(1) FM recordings were to be the only storage facility for the data. This method is convenient fo r computer input and also permanently preserves the data in its original ana- log form for playback through an x-y oscilloscope or other analog readout device.
E l i m i n a t e n o i s e by curve f i t t i n g t o e l e c t r o n c u r r e n t ( o p t i o n a l )
(2) The computing procedures were to include cr i ter ia in the program for distin- guishing between the end of one curve and the beginning of the next. Thus a data tape con- taining several hundred curves could be auto- matically processed from start to finish with- out the manual addition of timing markers or counting of points.
(3) The inevitable problem of noise in the probe data w a s to be handled not by man- ually rejecting particularly noisy curves or bad points (which would involve a prohibitive amount of time) but by careful choice of com- puting techniques and a simple method of ana- lyzing the success of each computing step. Computer plotting routines with 35-mm film output have provided the solution.
The reduction of analog F M tapes is accomplished as shown schematically in fig- u r e 4. (The Fortran IV program written for this project is available from the authors.) The data tapes a r e converted from analog to digital form by the Langley Adtran (analog to digital transcriber) system. The necessary time resolution is provided by recording at a tape speed of 60 in./sec (152.4 cm/sec) and playing back at 3 3 in./sec (9.5 cm/sec). The present data-reduction setup provides 1850 points per second at the playback speed. Thus, the real-time resolution is 16 X 1850, or 29 600 points per second. As a probe curve is recorded in 8 msec, there is a reso- lution of about 240 points per curve. This high degree of resolution, required for noisy data, is evident in curve 1 of figure 5, which shows a sample computer-generated plot of
10
4
*
Adtran system
t C a l i b r a t i o n and format
s e t u p f o r computing
to 7040-7094- DCS
P r i n t o u t curves and s t o r e d a t a p o i n t s *
I
I I * F i t b e s t s t r a i g h t l i n e t o i o n s a t u r a t i o n r e g i o n
S u b t r a c t i o n c u r r e n t from n e t c u r r e n t
I I -
I
F i t b e s t s t r a i g h t l i n e t o I n I and compute Te I * I- I
Figure 4.- Block diagram of data-reduction procedure. Asterisk ("1 denotes visual inspection on 35-mm film.
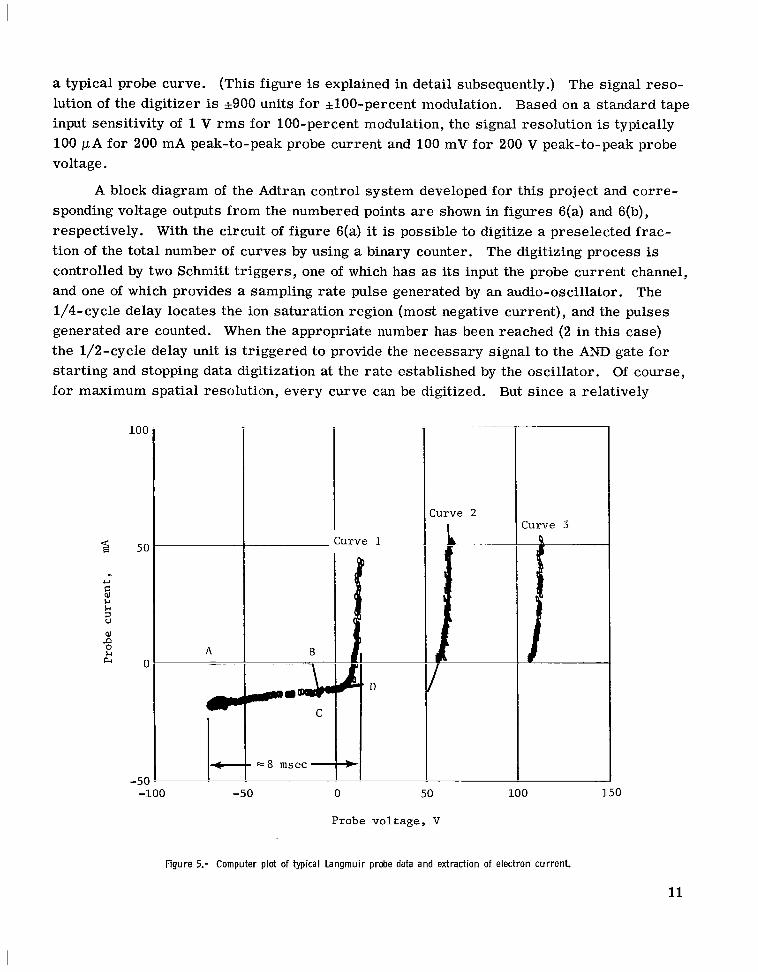
a typical probe curve. (This figure is explained in detail subsequently.) lution of the digitizer is *900 units for *lOO-percent modulation. Based on a standard tape input sensitivity of 1 V r m s for 100-percent modulation, the signal resolution is typically 100 pA for 200 mA peak-to-peak probe current and 100 mV for 200 V peak-to-peak probe voltage.
The signal reso-
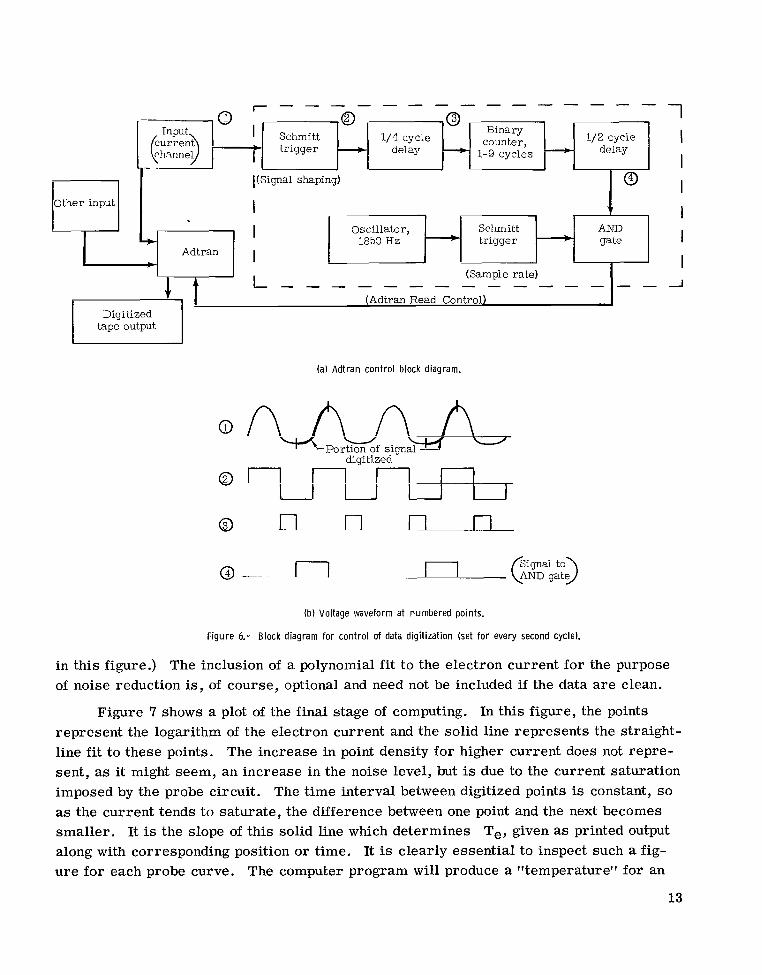
A block diagram of the Adtran control system developed for this project and corre- sponding voltage outputs from the numbered points a r e shown in figures 6(a) and 6(b), respectively. With the circuit of figure S(a) it is possible to digitize a preselected frac- tion of the total number of curves by using a binary counter. The digitizing process is controlled by two Schmitt triggers, one of which has as its input the probe current channel, and one of which provides a sampling rate pulse generated by an audio-oscillator. The 1/4-cycle delay locates the ion saturation region (most negative current), and the pulses generated a r e counted. When the appropriate number has been reached (2 in this case) the 1/2-cycle delay unit is triggered to provide the necessary signal to the AND gate for starting and stopping data digitization at the rate established by the oscillator. Of course, for maximum spatial resolution, every curve can be digitized. But since a relatively
Curve 1
h r v e 2
i I
Curve 3
1 -100 -50 0 50 100 150
Probe voltage, V
Figure 5.- Computer plot of typical Langmuir probe data and extraction of electron current.
11

large amount of computer time is required for analysis of the data (an average value is 2 sec of IBM 7040-7094 computer time per curve), this system prevents the accumulation of more data than a r e required for a particular condition. It would be expected, f o r exam- ple, that spatial variations in the plasma beam would become less intense farther down- s t ream because of beam spreading, diffusion, and recombination, and hence that fewer tem- perature points would be required to determine the structure of the beam.
The digitized tape from the Adtran is next reprocessed with predetermined calibra- tion constants, and the result is a digital tape containing data in engineering units in a format suitable for retrieval during the actual computing process.
An important feature of the data reduction and analysis program written for the Langley IBM 7040- 7094 DCS computer is the inclusion of computer- generated plots of the initial data and the results of all computing procedures. These plots a r e filmed for a permanent record and allow visual checks for each step of analysis. An example is shown in figure 5. Curve 1 is a plot of the original data points (I-V plot). The negative current corresponds to ion current. The abrupt cutoff of the electron current shows the effect of current-limiting in the probe circuit. The line ABCD is the result of a least-squares straight-line f i t to the ion-current points over the voltage range AB. The number of points included in this f i t is specified as a program input quantity. CD is an extrapolation of the line fitted to the ion current into the region where electron current is being col- lected. Visual examination of the line segment CD is mandatory to assure that it actually represents the slope of the ion current, since a particularly noisy curve occasionally pro- duces a bad f i t . More will be said concerning the f i t to the ion current at the end of this section.
Calculation of Te is accomplished as indicated previously. A set of electron- current points is generated by subtracting a value on the line CD from the corresponding point in the net current array. After several intermediate steps the logarithm of 1, is plotted as a function of voltage. If the electron distribution is Maxwellian, the variation of In Ie with V will be a straight line, and its slope determines Te.
The data points that comprise the electron-current a r ray are plotted in curve 2 of figure 5. To avoid taking the logarithm of small numbers as the electron current goes to zero, data points corresponding to less than 2 mA a r e discarded. The solid line along the data points of curve 2 represents a second-order polynomial f i t to the electron-current array. At this point, the effects of random noise can be reduced by eliminating data points whose residual exceeds by a specified amount (in magnitude) the standard deviation u computed for each curve f i t . In this case, 20 has been used as an arbitrary cutoff criterion, with results as shown in curve 3 of figure 5, which contains the electron-current a r ray minus the points discarded by residual testing. (Four points have been discarded
12
I
0 1/4 cycle Input
trigger 4 delay 4 1-9 cycles d d a y
I(Signa1 shaping)
I I I
Other input
I Oscillator, Schmitt AND
-+ 1850 Hz + trigger gate
w Adtran
(Sample rate) _ - - - - - - - - - - - - (Adtran Read Control)
Digitized tape output
I I I I 1 1 I 1
(a) Adtran control block diagram.
0
diqitized
B n n n I I U I
(b) Voltage waveform at numbered points.
Figure 6.- Block diagram for control of data digitization (set for every second cycle).
in this figure.) The inclusion of a polynomial f i t to the electron current for the purpose of noise reduction is, of course, optional and need not be included if the data a re clean.
Figure 7 shows a plot of the final stage of computing. In this figure, the points represent the logarithm of the electron current and the solid line represents the straight- line f i t to these points. The increase in point density for higher current does not repre- sent, as it might seem, an increase in the noise level, but is due to the current saturation imposed by the probe circuit. The time interval between digitized points is constant, so as the current tends to saturate, the difference between one point and the next becomes smaller. It is the slope of this solid line which determines Te, given as printed output along with corresponding position or time. It is clearly essential to inspect such a fig- ure for each probe curve. The computer program will produce a v7temperaturev7 for an
13
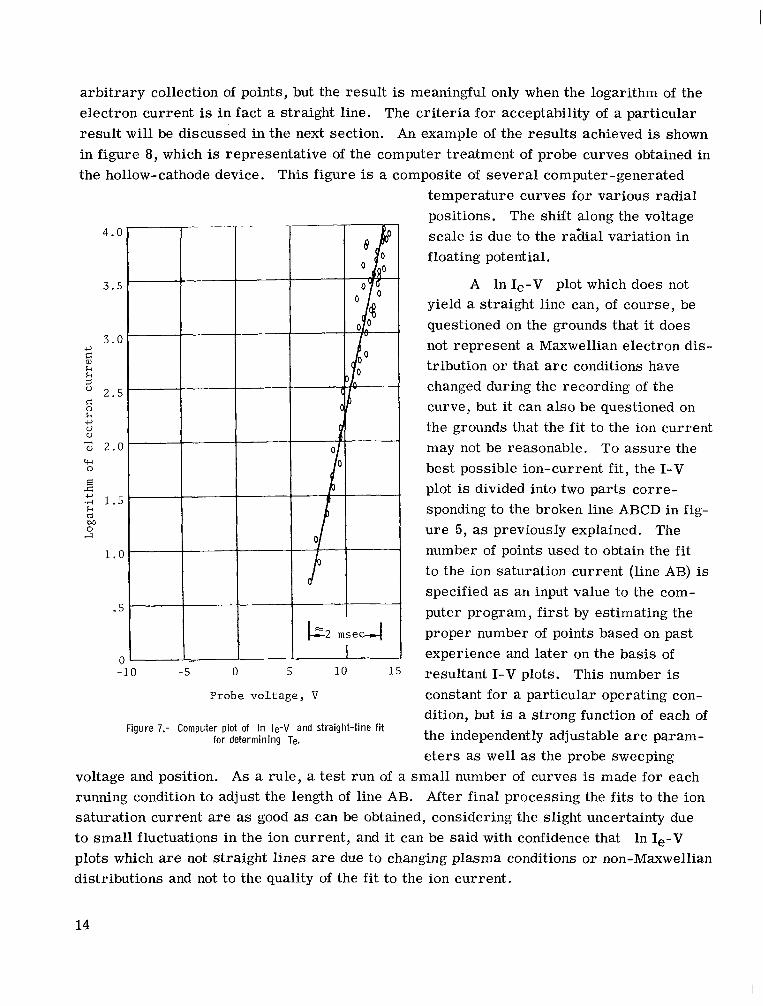
arbitrary collection of points, but the result is meaningful only when the logarithm of the electron current is in fact a straight line. The criteria for acceptability of a particular result will be discussed in the next section. An example of the results achieved is shown in figure 8, which is representative of the computer treatment of probe curves obtained in the hollow-cathode device. This figure is a composite of several computer-generated
-10 -5 0 5 10 1 5
Probe vol tage, V
Figure 7.- Computer plot of In le-V and straight-line fit for determining Te.
temperature curves for various radial positions. The shift along the voltage scale is due to the rahial variation in floating potential.
A In Ie-V plot which does not yield a straight line can, of course, be questioned on the grounds that it does not represent a Maxwellian electron dis- tribution or that arc conditions have changed during the recording of the curve, but it can also be questioned on the grounds that the f i t to the ion current may not be reasonable. To assure the best possible ion-current fit, the I-V plot is divided into two parts corre- sponding to the broken line ABCD in fig- ure 5, as previously explained. The number of points used to obtain the f i t to the ion saturation current (line AB) is specified as an input value to the com- puter program, first by estimating the proper number of points based on past experience and later on the basis of resultant I-V plots. This number is constant for a particular operating con- dition, but is a strong function of each of the independently adjustable a r c param- e te rs as well as the probe sweeping
voltage and position. As a rule, a test run of a small number of curves is made for each running condition to adjust the length of line AB. After final processing the fits to the ion saturation current are as good as can be obtained, considering the slight uncertainty due to small fluctuations in the ion current, and it can be said with confidence that In 1,-V plots which are not straight lines are due to changing plasma conditions or non-Maxwellian distributions and not to the quality of the fit to the ion current.
14

Radial distance from center line, cm
0.104
Te 9 O K 22 100
0.643 2.032
2 7 700 28
3 . 2 2 1 6.198
IO
c,
k k 5 2
-s 4
r: 0 k
a, k 0
s"
3.5
3.0
2.5
2.0
1.5
1.0
.5
0
Probe voltage, V
Figure 8.- Composite of several computer-generated Te plots at various radial positions.
An additional note is in order concerning the method of determining the f i t to the ion saturation current. When there is very little fluctuation in the ion current, as in figure 5, there a r e alternatives to fitting a straight line to a manually preselected number of points. For example, a minimum number could be chosen for a straight-line f i t and points could be added by testing the residual of each point with respect to the straight-line f i t estab- lished by all the preceding points. The advantage of this method is obvious - for smooth data the correct number of points is chosen automatically. However, this method is not reliable when noisy curves must be treated, since one wild point in the ion current may result in too few points being fitted and thereby cause an e r r o r in the extrapolated ion current.
Interpret ation of Experiment a1 Results
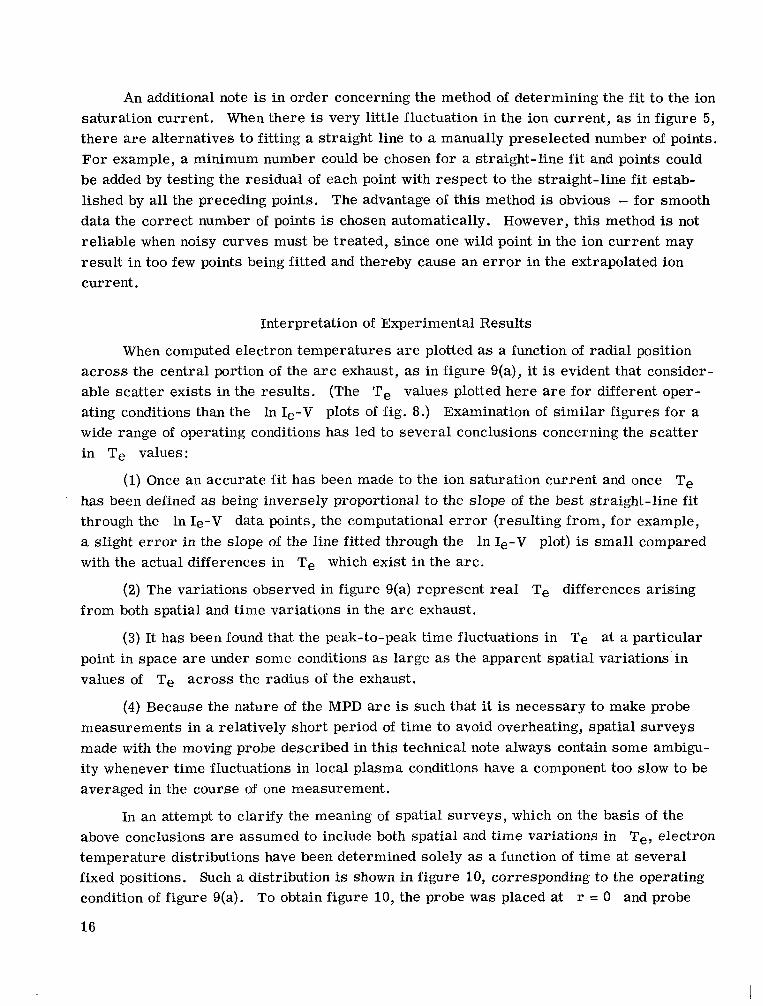
When computed electron temperatures a r e plotted as a function of radial position across the central portion of the a r c exhaust, as in figure 9(a), it is evident that consider- able scatter exists in the results. (The Te values plotted here a r e for different oper- ating conditions than the In 1,-V plots of fig. 8.) Examination of similar figures for a wide range of operating conditions has led to several conclusions concerning the scatter in Te values:
(1) Once an accurate f i t has been made to the ion saturation current and once Te has been defined as being inversely proportional to the slope of the best straight-line f i t through the In Ie-V data points, the computational e r r o r (resulting from, for example, a slight e r r o r in the slope of the line fitted through the In Ie-V plot) is small compared with the actual differences in Te which exist in the arc .
(2) The variations observed in figure 9(a) represent real Te differences arising from both spatial and time variations in the a r c exhaust.
(3) It has been found that the peak-to-peak time fluctuations in Te at a particular point in space a re under some conditions as large as the apparent spatial variations'in values of Te across the radius of the exhaust.
(4) Because the nature of the MPD a r c is such that it is necessary to make probe measurements in a relatively short period of time to avoid overheating, spatial surveys made with the moving probe described in this technical note always contain some ambigu- ity whenever time fluctuations in local plasma conditions have a component too slow to be averaged in the course of one measurement.
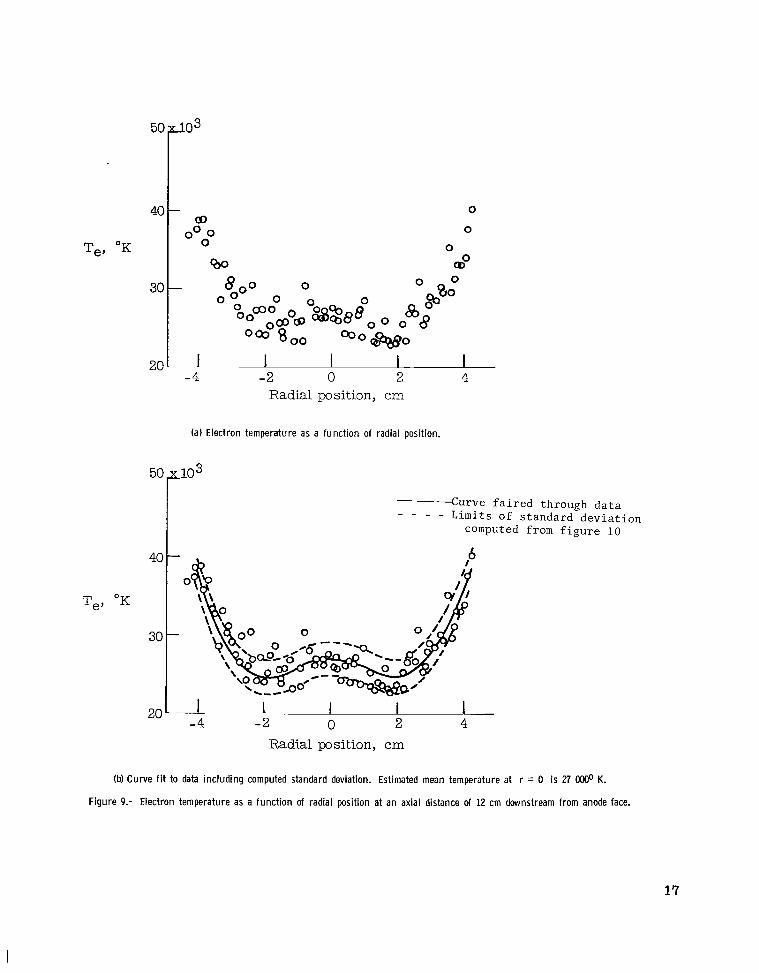
In an attempt to clarify the meaning of spatial surveys, which on the basis of the above conclusions a r e assumed to include both spatial and time variations in Te, electron temperature distributions have been determined solely as a function of time at several fixed positions. Such a distribution is shown in figure 10, corresponding to the operating condition of figure 9(a). To obtain figure 10, the probe was placed at r = 0 and probe
16
0
0
0
mo
I I I I -4 -2 0 2 4
R.adia1 position, cm
(a) Electron temperature as a funct ion of radial position.
40
Te> "K
30
- - - - C u r v e faired through data - - - _ Limits of standard deviation
computed from figure 10
1 I I 1 -4 -2 0 2 4
20
Radial position, cm
(b) Curve f i t to data inc lud ing computed standard deviation. Estimated mean temperature at r = 0 i s 27 oooo K.
Figure 9.- Electron temperature as a funct ion of radial position at an axial distance of 12 cm downstream from anode face.
17
curves were continuously recorded for a real time of about 5 seconds. The axial position, identical for figures 9.(a) and 10, was far enough downstream so that the probe did not heat to emission temperature during the 5-second period. On the basis of such measurements it has been found that Te varies randomly at a relatively low frequency in such a way that the temperature is generally constant during the time required for a measurement, typically 8 msec, but is generally different during the next measurement, which begins
.20
.16
5 .,-I U
w 2 h .12 0 d %! k
a w
8 .08
z 2 E
.04
0 0
0 0
0 0 0
0
0 0 0 - -
I . 1 , l 0 I I 0 16 20 24 28 32 36 x lo3
Figure 10.- Electron temperature distr ibution for the conditions of f igure 9 at r = 0. Sample time, 5 sec; number of samples, 152; mean temperature, 26 50O0 K; standard deviation, 230@ K.
24 msec after the end of the previous measurement. The peak-to-peak temperature vari- ation in figure 10 is 11 000' K and the standard deviation, defined in the usual manner, is 2300° K, o r about 10 percent of the mean Te value. Consequently, the time and space fluctuations in data such as those presented in figure 9(a) can to some extent be separated by fairing a curve through the data points, but the resolution will be limited by the stan- dard deviation for electron temperatures at the same conditions. Such an averaging pro- cedure has been carried out in figure 9(b), where the dashed lines correspond to *cr as obtained from figure 10. Figure 9(b) indicates the way in which T, distributions must
18

be presented: The electron temperature at each point in space is given as an average value with upper and lower limits based on the standard deviation of time fluctuations at the same operating conditions. The average value may be determined either by fairing a curve through the data as in figure 9(b) or by using the results of a plot such as fig- u re 10, repeated for several radial positions. Note the agreement between the two mean Te values for the example of figures 9 and 10: The computed mean value of figure 10 is 26 5000 K, while figure 9(b) has an apparent mean value of about 27 OOOo K at r = 0.
It is apparent that the existence of an erratic low-frequency Te fluctuation as pre- viously described (i.e., roughly constant for 8 msec but different 24 msec later) will sometimes produce In 1,-V curves which appear non-Maxwellian if a rather abrupt change in some plasma parameter occurs during the 2 msec required to sweep the electron-current part of the probe curve (see fig. 7). Such a curve is shown in figure 11. If data such as these are obtained regularly - that is, if the fluctuation frequencies more nearly correspond to the time required to record the electron current - the present sys- tem cannot be used without modification. Ideally, the modification would consist of a faster probe sweep so that Te would again appear constant during the course of a mea- surement for most of the probe curves obtained.
The question of interpreting Langmuir probe curves becomes more complex when the effect of high-frequency noise is considered. curves in this study is limited by filtering to less than 2000 Hz, higher discrete frequen- cies are eliminated. Nonetheless, the coherent oscillations in the 10 kHz range typical of MPD a r c devices (and observed in the present device) can manifest themselves as apparently random scatter in the data, especially when the voltage level of such oscilla- tions is a sizable fraction of the total a r c voltage. In addition, there is an abundance of possible a r c noise sources in the range of 100 to 2000 Hz. Sometimes these may appear coherent, as in the case of power-supply ripple. Otherwise, the noise is apparently ran- dom, arising from incompletely understood electrode or ionization phenomena.
Since the frequency spectrum of the
On probe t races , the source of any noise is, of course, unidentified; it merely pro- duces voltage or current fluctuations on the I-V characteristic. A simultaneous high- frequency variation in plasma potential, local density, and electron temperature would seemingly be the most probable situation. Bear in mind that the Te fluctuations under
= 500 Hz.) However, consideration now would have a frequency much higher than it has been shown by Sugawara and Hatta (ref. 6) that even small high-frequency Te fluctuations result in a distortion of the linearity of the In 1,-V curve. This distortion is prominent around the floating potential, that is, in the high-energy tail of the electrons. Therefore if, as with the large majority of curves obtained in the hollow-cathode device, the scatter on curves seems to fall naturally about a straight, rather than a curved, line, it can be concluded that the scatter on probe curves is not due to high-frequency Te fluctuations.
2 msec (
Potential and density fluctuations do not significantly affect the value of
19
I
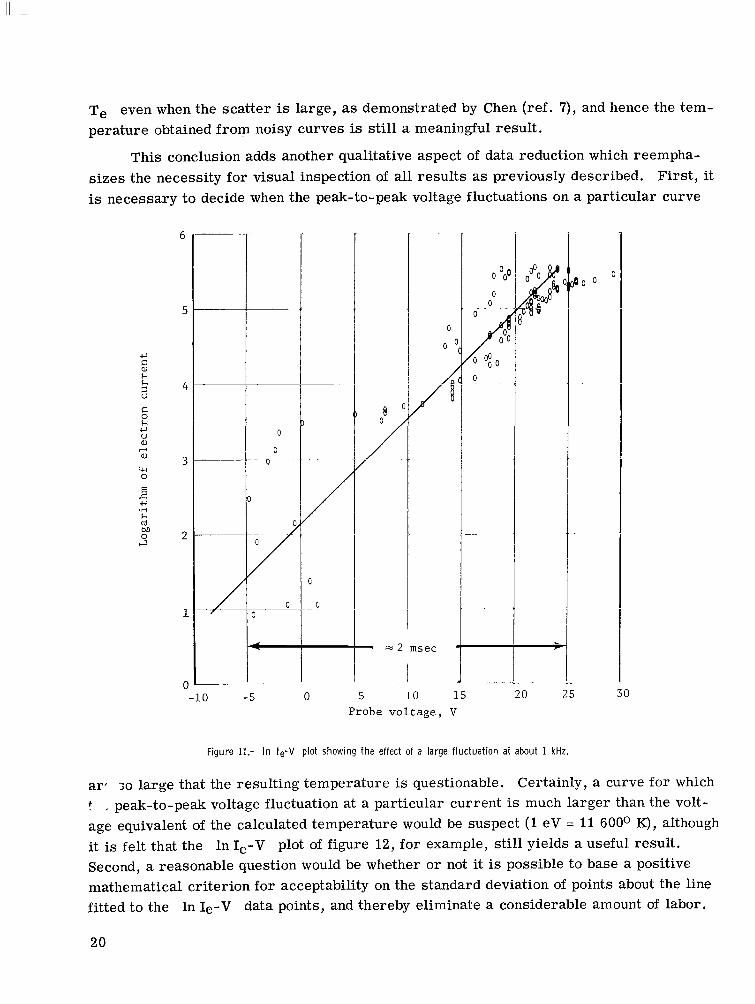
Te even when the scatter is large, as demonstrated by Chen (ref. 7), and hence the tem- perature obtained from noisy curves is still a meaningful result.
This conclusion adds another qualitative aspect of data reduction which reempha- s izes the necessity for visual inspection of all results as previously described. First, it is necessary to decide when the peak-to-peak voltage fluctuations on a particular curve
c,
k k
E
2 c 0 k c, V a e,
w 0
E
7-i
5 .?I k rd M 0
4 2
0
o (
/?i
- = 2 msec '
-10 -5 0 5 10 15 20 25 Probe voltage, V
0 0 0 0
30
Figure 11.- In le-V plot showing the effect of a large fluctuation at about 1 kHz.
art 30 large that the resulting temperature is questionable. Certainly, a curve for which t , peak-to-peak voltage fluctuation at a particular current is much larger than the volt- age equivalent of the calculated temperature would be suspect (1 eV = 11 6000 K), although it is felt that the In 1,-V plot of figure 12, for example, still yields a useful result. Second, a reasonable question would be whether or not it is possible to base a positive mathematical criterion for acceptability on the standard deviation of points about the line fitted to the In Ie-V data points, and thereby eliminate a considerable amount of labor.
20

200
150
100 B 2 2 a J 0 2
n
c, 50 &I w
&I PI
-50
-100
-150 -200 -150
I I
I I
t I
I ,
-100 -50 0 100 150 200
P r o b e voltage, V
(a) I-V plot.
c, E a, k
u c 0 k c, u' Q) 4 a,
Ccl 0
2
2 c, .r( k cd M 0 ;I
0 5 10 15
P r o b e voltage, V
(b) In le-V plot. Te = 25 ZOOo K.
Figure 12.- I-V and In le-V plots showing t h e effect of potential f luctuations on electron current.
Unfortunately, this would be difficult, for a In 1,-V curve with small scatter might be obviously bowed, while a curve with considerable scatter might yield a reasonable straight-line fit.
In the present studies, a flexible attitude has been adopted with regard to the credi- bility of the temperature associated with a particular curve for the following reason: The standard deviation associated with the electron temperature assigned to a particular point in space, being on the order of 5000 to 10 000' K, may be considered large with respect to the e r r o r introduced by accepting a particular calculated value. For example, i f , as in figure 10, a time-averaged temperature value must be given as Te plus or minus approximately 10 percent, it is not unreasonable to accept a particular temperature value such as that for the noisy data of figure 12, which by all available evidence is correct within a few percent.
CONCLUSIONS
1. F M tape recording and digital-computer techniques can be combined to provide an automated data reduction system for large quantities of Langmuir probe data obtained in a high-power magnetoplasmadynamic arc .
21
T
2. Electron-temperature distributions can be obtained over a wide range of operating conditions by using computer techniques that take into account extreme variations in the detailed behavior of the probe data.
3. Because of the random nature and time scale of electron-temperature fluctuations, scatter in spatial surveys can be averaged when data a r e taken in the manner described. The surveys then consist of averaged curves based on the shape of the data, with an e r r o r bar based on the standard deviation for temperature values obtained at the same operating conditions and location as a function of time.
Langley Research Center, National Aeronautics and Space Administration,
Langley Station, Hampton, Va., June 7, 1967, 129-01-05-04-23.
REFERENCES
1. Eggers, G. H.; and Schwirzke, F.: A Method of Using a Computer To Evaluate Langmuir Probe Data for Obtaining the Electron Temperature. Proceedings of the 1965 Symposium on Engineering Problems of Controlled Thermonuclear Research, Contract W-7405-ENG-48, Lawrence Radiation Lab., Univ. of California, May 1965, pp. 96-99.
2 . Chen, Francis F.: Electric Probes. Plasma Diagnostic Techniques, Richard H. Huddlestone and Stanley L. Leonard, eds., Academic Press , 1965, pp. 113-200.
3. Weinstein, Richard H.; and Hoell, James M.: Experiments in a Hollow Cathode Hall Current Accelerator. AIAA Paper No. 65-299, July 1965.
4 . Sugawara, Minoru: Electron Probe Current in a Magnetized Plasma. Phys. Fluids, vol. 9, no. 4, Apr. 1966, pp. 797-800.
5. Sonin, Ain A.: Free-Molecule Langmuir Probe and Its Use in Flowfield Studies. AIAA J., vol. 4 , no. 9, Sept. 1966, pp. 1588-1596.
6. Sugawara, Minoru; and Hatta, Yoshisuke: Langmuir Probe Method for a Plasma Having Small Amplitude Oscillations. Res. Rept. IPPJ-4, Nagoya Univ., Feb. 1963.
7. Chen, Francis F.: Double-Probe Method for Unstable Plasmas. Rev. Sci. Instr., vol. 35, no. 9, Sept. 1964, pp. 1208-1212.
22

“The aeronautical and space activities of the United States shall be conducted so as to contribute . . . to the expansion of human Knowl- edge of phenomena in the atmosphere and space. The Admiifishation shall ptovide for the widest practicable and appropriate dissemination of information concerning its activities and the results thereof
-NATIONAL AERONAUTTCS AND SPACE ACT OF 1958
NASA SCIENTIFIC AND TECHNICAL PUBLICATIONS
TECHNICAL REPORTS: Scientific and technical information considered important, complete, and a lasting contribution to existing knowledge.
TECHNICAL NOTES: Information less broad in scope but nevertheless of importance as a contribution to existing knowledge.
TECHNICAL MEMORANDUMS: Information receiving limited distribu- tion because of preliminary data, security classification, or other reasons.
CONTRACTOR REPORTS: Scientific and technical information generated under a NASA contract or grant and considered an important contribution to existing knowledge. .
TECHNICAL TRANSLATIONS: Information published in a foreign language considered to merit NASA distribution in English.
SPECIAL PUBLICATIONS: Information derived from or of value to NASA activities. Publications include conference proceedings, monographs, data compilations, handbooks, sourcebooks, and special bibliographies.
TECHNOLOGY UTILIZATION PUBLICATIONS: Information on tech- nology used by NASA that may be of particular interest in commercial and other non-aerospace applications. Publications indude Tech Briefs, Technology Utilization Reports and Notes, and Technology Surveys.
Details on the availability of these publications may be obfained from:
SCIENTIFIC AND TECHNICAL INFORMATION DIVISION
NATIONAL AERONAUTICS AND SPACE ADMINISTRATION
Washington, D.C. PO546