a comprehensive modeling in predicting the effect of
TRANSCRIPT

Vol.:(0123456789)1 3
Journal of Petroleum Exploration and Production Technology (2020) 10:859–870 https://doi.org/10.1007/s13202-019-00776-5
ORIGINAL PAPER - PRODUCTION ENGINEERING
A comprehensive modeling in predicting the effect of various nanoparticles on filtration volume of water‑based drilling fluids
Alireza Golsefatan1 · Khalil Shahbazi1
Received: 9 May 2019 / Accepted: 4 September 2019 / Published online: 11 September 2019 © The Author(s) 2019
AbstractFiltration volume of drilling fluid is directly associated with the amount of formation damage in hydrocarbon reservoirs. Many different additives are added to the drilling fluid in order to minimize the filtration volume. Nanoparticles have been utilized recently to improve the filtration properties of drilling fluids. Up to now, no model has yet been presented to investigate the effect of nanoparticles on filtration properties of drilling fluids. The impact of various nanoparticles is investigated in this study. Artificial neural network is used as a powerful tool to develop a novel approach to predict the effect of various nano-particles on filtration volume. Model evaluation is performed by calculating the statistical parameters. The obtained results by the model and the experimental results are in an excellent agreement with average absolute relative error of 2.6636%, correlation coefficient (R2) of 0.9928, and mean square error of 0.4797 for overall data. The statistical results showed that the proposed model is able to predict the amount of filtration volume with high precision. Furthermore, the sensitivity analysis on the input parameters demonstrated that nanoparticle concentration has the highest effect on filtration volume and should be considered by researchers during process optimization.
Keywords Drilling fluid · Filtration volume · Nanoparticles · ANN · Modeling
Introduction
The first stage in the petroleum industry to access a hydro-carbon reservoir is the drilling operation. During drilling operation, drilling fluid is the most crucial and important components, which is usually called drilling mud. Among all types of drilling fluid (water-based, oil-based, and synthetic-based), water-based drilling fluids are the most widely used fluids in the drilling industry in comparison with the other types that is due to their higher cost, environmental issues, disposal problems, and health and safety issues (Mahmoud et al. 2016). Drilling fluids are responsible to carry out many different functions during the drilling process as control-ling the formation hydrostatic pressure, preventing collapse of wellbore surface, transferring cuttings to the surface, suspending cuttings and additives, preventing formation damage by forming good mudcake on the wellbore surface, lubricating and cooling the bit and drilling string, and so on.
Therefore, these fluids should be designed and manufactured well in such a specific characterization in order to handle the above functions. To modify or enhance a specific function or property, some additives are also added to the drilling fluid. The success of a drilling operation is closely related to the design and performance of the drilling fluid (Mahmoud et al. 2016). In order to minimize the encountered problems and to have low-cost drilling, the functions of drilling fluid must be optimized by improving the drilling fluid properties (Salih and Bilgesu 2017). Most of the problems encountered dur-ing the drilling operation such as stuck pipe, high torque and drag, surge and swab pressures, bit balling, shale swelling, and loss circulation are because of improper drilling fluid design (Bourgoyne et al. 1986) that are directly or indirectly related to hydraulic, rheological, and filtration properties of the drilling fluid (Salih and Bilgesu 2017). Therefore, one of the integral and essential tasks is to monitor and control the drilling fluid properties (Vryzas et al. 2018) that should be scheduled in the predefined drilling program. The effect of additives and also human must be added to the usual prob-lems that are encountered during the drilling process that affect the drilling fluid properties.
* Alireza Golsefatan [email protected]
1 Petroleum Department, Petroleum University of Technology, Ahwaz, Iran

860 Journal of Petroleum Exploration and Production Technology (2020) 10:859–870
1 3
Among the mentioned problems, one of the most crucial one is drilling fluid loss into the formation. Mitigating and controlling the fluid loss is essential to reduce both the for-mation damage and the cost of drilling fluid. So many fluid loss agents are added to the drilling fluid as fluid loss addi-tives (Vryzas et al. 2016). The function of these additives is to make a filter cake on the wellbore surface in order to mitigate or prevent fluid loss into the formation, which is usually called mudcake (Barry et al. 2015). For this purpose, fluid loss agents must be optimized to have a homogeneous, thin, and low permeable mudcake. Whether the mudcake is thick or highly permeable, it would increase the probability of pipe sticking or the filtration volume of the drilling fluid, respectively.
By the arrival of nanotechnology, the special characteris-tics of nanoparticles have made them a potential additives in several fields of the sciences in order to mitigate, minimize, or solve the encountered problems, and moreover to improve the characteristic of a material or a process. Over the time, nanoparticles have also got involved in various fields of oil and gas industry. Recently, various nanoparticles are utilized by many researchers to improve the filtration properties of the water-based drilling fluids while maintaining the other drilling fluid properties optimal or to improve them.
The effect of silica (SiO2) (Mahmoud et al. 2016, 2018; Salih and Bilgesu 2017; Parizad et al. 2018; Smith et al. 2018; Salih et al. 2016; Vryzas et al. 2015; Yusof and Hanafi 2015), ferric oxide (Fe2O3) (Mahmoud et al. 2016, 2017, 2018; Vry-zas et al. 2015; Jung et al. 2011; Shakib et al. 2016), aluminum oxide (Al2O3) (Salih and Bilgesu 2017; Smith et al. 2018; Shakib et al. 2016), titanium oxide (TiO2) (Salih and Bilgesu 2017; Shakib et al. 2016), copper oxide (CuO) (Shakib et al. 2016), stannic oxide (SnO2) (Parizad and Shahbazi 2016), fer-rosoferric oxide (Fe3O4) (Vryzas et al. 2016, 2018), and clay minerals (Shakib et al. 2016; Needaa et al. 2016) nanoparticles on filtration properties of water-based drilling fluid is investi-gated. The other types of nanoparticles as multi-walled carbon nanotube (MWCNT) (Ismail et al. 2014, 2016), iron oxide/clay hybrid (ICH) (Barry et al. 2015), aluminosilicate/clay hybrid (ASCH) (Barry et al. 2015), titanium oxide/polyacrylamide nanocomposite (Sadeghalvaad and Sabbaghi 2015), clay/silica nanocomposite (Cheraghian et al. 2018), nano-sized layered magnesium aluminum silicate (MAS) (Wang et al. 2018) are also utilized for this purpose. Also, the effects of nanoparticles along with the polymers, surfactants, and polymer–surfactant are dealt with in some other works (Fakoya and Shah 2018; Srivatsa and Ziaja 2011; Ahmad et al. 2017). The above inves-tigations have showed that the addition of nanoparticles could improve the filtration properties of drilling fluid (Mahmoud et al. 2016, 2017, 2018; Salih and Bilgesu 2017; Vryzas et al. 2015, 2016, 2018; Barry et al. 2015; Parizad et al. 2018; Smith et al. 2018; Salih et al. 2016; Yusof and Hanafi 2015; Jung
et al. 2011; Shakib et al. 2016; Parizad and Shahbazi 2016) and consequently could mitigate the formation damage.
In recent years, by the development of technology, artifi-cial intelligence tools have widely applied in order to model nonlinear problems in various fields of science. Artificial neu-ral network (ANN) is one of the most common tools that are utilized. Predicting the filtration properties of drilling fluids is also investigated in some recent researches in the absence of nanoparticles (Jeirani and Mohebbi 2006); however, no model is presented to see the effect of nanoparticles on filtration prop-erties of drilling fluids yet.
In this study, the influence of various nanoparticles on fil-tration volume is considered by applying an ANN model as a novel method. For this purpose, a total of 1003 data points are gathered from the most recent researches found in the literature. Then, the ANN model is developed for accurate prediction of filtration volume of water-based drilling fluid as a function of effective parameters such as nanoparticle type, nanoparticle concentration, KCl salt concentration, tempera-ture, pressure, round per minute (RPM), and time. The assess-ment of the proposed model is evaluated by statistical analyses. Finally, a sensitivity analysis is performed to determine the most sensitive parameters on the filtration volume.
Preview of artificial neural network
Artificial neural network (ANN) is known as a processing system that is used to obtain a nonlinear regression model between variables benchmarked from human brain. ANN con-structs a nonlinear mapping between inputs and outputs and converts these complex relationships to a series of training patterns which could be useful for wherever the mathematical modeling may be too complicated (Liang and Bose 1996). A network usually consists of at least three layers: input layer, one hidden layer, and output layer. Each layer consists of some neurons in order to connect to each other. A neuron is an indi-vidual processing unit which includes in the modeling process. Neurons are connected to each other through a transfer func-tion which consists of the weights and bias. Input parameters are multiplied by their associated weights and then summed with their associated bias. The performance of an ANN model depends on both the weights and the transfer function (Masoudi et al. 2018). The general mathematical expression of each neuron is given in the following:
where Oi is the output of ith neuron, Yi is the ith input to the function, σ is transfer function, N is the number of neurons in each layer, wji is the weights that connects the ith neuron to the other neurons of the next layer for jth input parameter,
(1)Oi = �
(Yi)= �
(N∑j=1
wjiPj + bi
)
861Journal of Petroleum Exploration and Production Technology (2020) 10:859–870
1 3
Pj is the jth input parameters, and bi is the bias of the ith neuron.
The initial weights are set as random numbers and are corrected during the training process of the network. Three steps are performed in order to develop an ANN model: building the model; model training; and testing procedure (Kassem et al. 2018). The most common training algorithm utilized in the training process is back-propagation (BP). This training process consists of two phases: feed-forward phase, in which the knowledge is processed from the input layer to the output layer, and back-propagation phase, in which the difference between network output values obtained in the first phase and desired output value is compared with previously determined difference tolerance and the error is propagated backward to update the links in the input layer (Kassem et al. 2018). The weights and biases are adjusted through the training process to minimize the error in each step. The adjustment of weights is also done through the training algorithm that the best one is Levenberg–Marquardt training algorithm (TRAINLM). The weight difference for a given neuron is calculated by gradient descent with momen-tum weight and bias learning function (LEARNGDM) as:
where dwjinew is the new weight change for ith neuron and jth input parameter, MC is the momentum constant, dwijprev is the previous weight change for ith neuron and jth input parameter, LR is the learning rate, and gwji is the weight gradient descent.
Among the various types of transfer functions, tangent sigmoid (TANSIG) and pure linear (PURELIN) functions are usually used for the inner and outer, respectively. The mathematical description for tangent sigmoid and pure linear functions is given in Eqs. 3 and 4, respectively:
All parameters of Eqs. 1 to 4 are dimensionless. The gen-eral architecture of an ANN model and a neuron structure is presented in Fig. 1.
Methodology
Data collection
In this study, a data collection is used from the literature that relates the filtration volume of water-based drilling fluid to the effective input parameters. As said before, various nanoparticles are used by researchers in order to improve the drilling fluid properties. The data bank is gathered from
(2)dwjinew = (MC) × dwjiprev + (1 −MC) × LR × gwji
(3)� =2
1 + exp(−2Yi
) − 1
(4)� = Yi
those researches that the effect of nanoparticles on the filtra-tion volume of water-based drilling fluid has been investi-gated. Some of the previous studies have also presented the effect of nanoparticles simultaneously with various polymers and surfactants. Such studies have not contributed in this research in order to model and investigate the effect of nano-particles solely. Moreover, it is necessary to use dependable experimental results to construct a reliable network.
The utilized nanoparticles and their respective studies that are contributed in the data bank are SiO2 (Parizad et al. 2018), Fe2O3 (Vryzas et al. 2015; Mahmoud et al. 2017), CuO (Shakib et al. 2016), Al2O3 (Shakib et al. 2016), SnO2 (Parizad and Shahbazi 2016), and Clay (Shakib et al. 2016). The experimental data in these studies have included the impact of nanoparticle type, nanoparticle concentration (wt%), KCl salt concentration (wt%), temperature (°F), pres-sure (psi), RPM (round/min), and time (s) on filtration vol-ume (ml) of water-based drilling fluid. The input parameter named nanoparticle type is considered as one of the input parameters to see the effect of different nanoparticles. A total number of 1003 data points are used for predicting model, which is described later in this paper. These data points are randomly divided into two categories that are named train-ing data and testing data. In order to check the performance of the model in predicting the target, these two categories must be apart from each other and do not have any points in common. For this purpose, the training data consist of about 80% of the main data points that are 803 data points, and the remaining 20% of the main data points are used as testing data that are 200 data points. The statistical description of the data bank used in this study is given in Table 1.
Model construction
In order to predict the target, a feed-forward back-propaga-tion algorithm is used. As said before, an ANN consists of some layers that are containing some neurons. An optimal network is a network with the optimum amount of layers and neurons, which must be obtained through the train-ing process. TRAINLM and LEARNGDM are set as the training and adaption learning functions, respectively. The transfer functions that are used to connect the neurons are set TANSIG, TANSIG, and PURELIN in first, second, and third layer, respectively. The criterion that specifies the best network among the generated networks is set as MSE. A network has higher accuracy in predicting the target that has lower MSE and higher R2. Trial and error process is done for several times to find the optimal network. The best network is found with 3 layers (2 hidden layers and output layer) that the number of neurons is 21, 9, and 1 in first, second, and third layer, respectively. The workflow of model con-struction, model training, and sensitivity analysis (which is

862 Journal of Petroleum Exploration and Production Technology (2020) 10:859–870
1 3
Fig. 1 a General architecture of an ANN model and b a neuron structure
Table 1 Statistical description of the data bank used in this study
Parameter Minimum Maximum Average SD
Nanoparticle type SiO2, Fe2O3, CuO, Al2O3, SnO2, ClayNanoparticle concentration (wt%) 0 7.5 0.807527 1.281187KCl salt concentration (wt%) 0 6 1.857428 2.6723Temperature (°F) 77 300 166.193 77.85525Pressure (psi) 100 500 314.2572 140.8071RPM (round/min) 0 100 6.979063 25.47938Time (s) 0 1800 683.0076 608.018Filtration volume (ml) 1 65 8.955189 8.168526

863Journal of Petroleum Exploration and Production Technology (2020) 10:859–870
1 3
described later) is represented in Fig. 2. Training parameters of the proposed model are given in Table 2.
Error assessment
After a model has been developed, the robustness of the model in predicting the target must be evaluated to see whether the model has the desired performance and accu-racy. Measuring the data fitness of the model in predicting the target is determined by correlation coefficient (R2). As the criterion that is used in finding the optimal network, mean-squared error (MSE) is calculated as one of the most commonly used parameters. Also some other statistical parameters are calculated including root-mean-squared error (RMSE) that is the root of MSE; average relative error (ARE) that is the average value of RE; average absolute rela-tive error (AARE) that is the absolute value of ARE; relative deviation (RE) that is the relative difference between actual and predicted values; and standard deviation (SD) between the actual and predicted data. Equations 5 to 11 express the definitions of the above parameters:
1. Correlation coefficient (R2):
2. Mean-squared error (MSE):
3. Root-mean-squared error (RMSE):
(5)R2 = 1 −
∑N
i=1
�Ypr
i− Yac
i
�2∑N
i=1
�Yac − Yac
i
�2
(6)MSE =1
N
N∑i=1
(Ypr
i− Yac
i
)2
(7)RMSE =
[1
N
N∑i=1
(Ypr
i− Yac
i
)2]0.5
4. Average relative error (ARE):
5. Average absolute relative error (AARE):
6. Relative deviation (RD):
7. Standard deviation (SD):
(8)ARE(%) =
(1
N
N∑i=1
Ypr
i− Yac
i
Yaci
)× 100
(9)AARE(%) =
(1
N
N∑i=1
|||||Ypr
i− Yac
i
Yaci
|||||
)× 100
(10)RD(%) =Ypr
i− Yac
i
Yaci
× 100
(11)SD =
⎡⎢⎢⎣1
N − 1
N�i=1
�Ypr
i− Yac
i
Yaci
�2⎤⎥⎥⎦
0.5
Fig. 2 Workflow of model construction, model training, and sensitivity analysis
Table 2 Training parameters of the proposed model
Parameter Description
No. of total data 1003No. of training data 803No. of testing data 200Network type Feed-forward
back-propa-gation
Training function TRAINLMAdaption learning function LEARNGDMNo. of total layers 3No. of hidden layers 2Transfer function (hidden layers) TANSIGTransfer function (output layer) PURELINMax. epochs 1000

864 Journal of Petroleum Exploration and Production Technology (2020) 10:859–870
1 3
In the above equations, N is the number of data; Yaci
is the actual data; Ypr
i is the predicted data; and Yac is the average of
the actual data.
Sensitivity analysis
The concepts of sensitivity and uncertainty analysis are one of the essential parts of modeling and statistical studies.
Sensitivity analysis determines the contribution of each input parameter to the output parameters of a model or a data series. In other words, sensitivity analysis quantifies how the input parameters would influence the output parameters. Also, it is defined as the contribution of each input parameter to the uncertainty in model predictions (Hammonds et al. 1994).Uncertainty analysis determines the uncertainty in each input parameter in model predictions (Hammonds et al. 1994).
(a)
(b)
0
10
20
30
40
50
60
70
0 10 20 30 40 50 60 70
Pred
icte
d Fi
ltrat
ion
volu
me
(ml)
Actual Filtration volume (ml)
Training data
y = x line
Regression line
0
10
20
30
40
50
60
70
80
0 10 20 30 40 50 60 70 80
Pred
icte
d Fi
ltrat
ion
volu
me
(ml)
Actual Filtration volume (ml)
Testing datay = x lineRegression line
(c)
0
10
20
30
40
50
60
70
80
0 10 20 30 40 50 60 70 80
Pred
icte
d Fi
ltrat
ion
volu
me
(ml)
Actual Filtration volume (ml)
Overall datay= x lineRegression line
Fig. 3 Predicted versus actual filtration volume for a training data, b testing data, and c overall data
(a)
(b)
0
10
20
30
40
50
60
70
0 100 200 300 400 500 600 700 800 900 1000 1100
Filtr
atio
n vo
lum
e (m
l)
Data index
Training dataModel data
0
10
20
30
40
50
60
70
80
0 100 200 300 400 500 600 700 800 900 1000 1100
Filtr
atio
n vo
lum
e (m
l)
Data index
Testing dataModel data
(c)
0
10
20
30
40
50
60
70
0 100 200 300 400 500 600 700 800 900 1000 1100
Filtr
atio
n vo
lum
e (m
l)
Data index
Overall dataModel data
Fig. 4 Simultaneous representations of model data and actual data of filtration volume for a training data, b testing data, and c overall data

865Journal of Petroleum Exploration and Production Technology (2020) 10:859–870
1 3
Sensitivity analysis methods could be categorized as two points of view. Based on the concept, sensitivity analysis methods are categorized as deterministic and statistic (Zhou 2014). Statistical methods dealt with sensitivity analysis after the uncertainty analysis stage, while deterministic methods dealt with sensitivity analysis first and then go through the uncertainty analysis (Cacuci et al. 2005). Based on the factor space of interest, sensitivity analysis methods are categorized as local and global (Yang 2011). Local meth-ods investigate the model behavior by varying each input parameter at a time (Zhou 2014). Global methods investi-gate the model behavior by varying all parameters over their ranges simultaneously (Zhou 2014).
Among the various approaches for sensitivity analysis, Monte Carlo method is one of the most utilized methods in several fields of engineering. In this method, random sam-ples of the input parameters are generated by various distri-bution sampling types over the ranges of parameters. Then, it repeatedly simulates the model several times that each time a different set of generated parameters of the distribu-tion is utilized. The output of the model is the probability of output results (Bonate 2001). Monte Carlo method pro-vides an effective approach to assess the influence of several interacting parameters that could exhibit a wide range of uncertainties (Santoso et al. 2019). The generated runs by this method may not be representative of the full-physics models, and it requires an excessive number of runs (San-toso et al. 2019). In order to reduce the number of runs and develop an efficient model, design of experiment (DoE) is developed (Santoso et al. 2019).
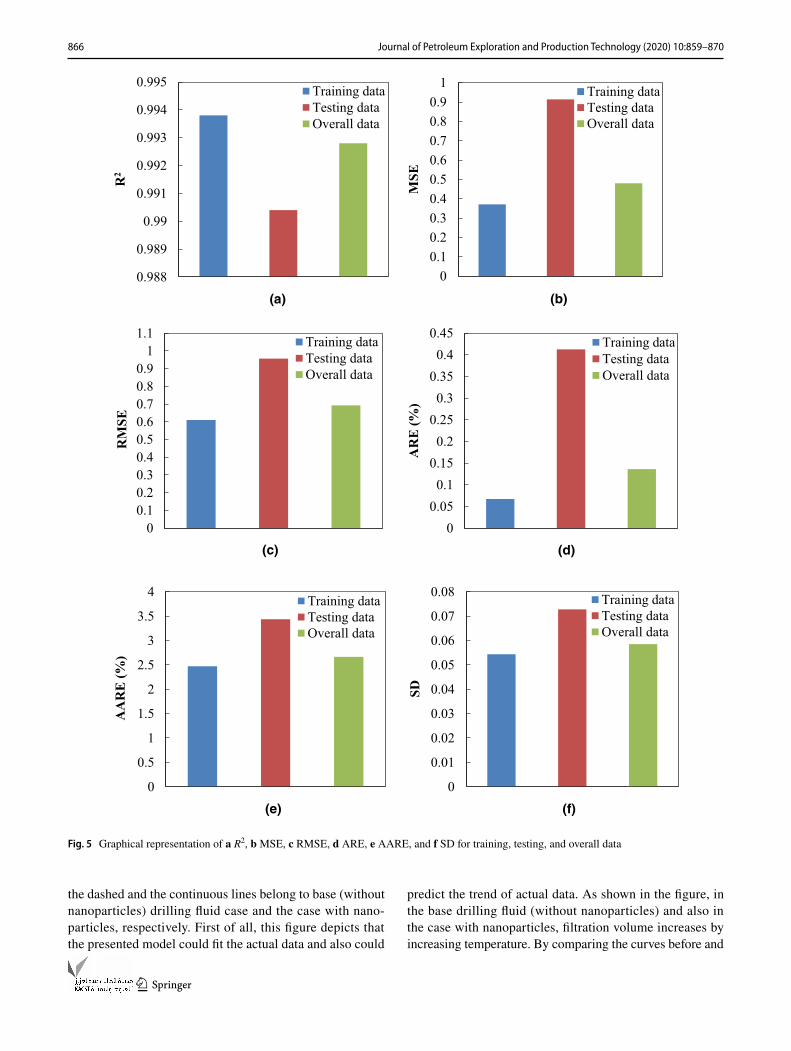
In this study, the sensitivity analysis is performed by rel-evancy factor (RF). Each of the input parameters that have the higher (or lower) relevancy factor has a higher (or lower) impact on the filtration volume, respectively. The relevancy factor definition is given in the following expression:
where Pi is the ith input parameter, Pi,j is the jth value of the ith input parameter, Pi is the average of ith input, Ypr
j is the
jth predicted filtration volume, N is the number of overall data, and Ypr is the average of the predicted filtration volume.
(12)
RF�Pi, Y
pr�=
∑N
j=1
�Pi,j − Pi
��Ypr
j− Ypr
��∑N
j=1
�Pi,j − Pi
�2 ∑N
j=1
�Ypr
j− Ypr
�2
The results of the sensitivity analysis are given in the Results and Discussion section.
Results and discussion
In order to evaluate the proposed model, the predefined sta-tistical parameters are calculated. Also the predicted and actual data are plotted versus each other. Figure 3 repre-sents the crossplot of the model predicted filtration volume versus the actual filtration volume for training, testing, and overall data. The y = x line is plotted in this figure to evalu-ate the precision of the proposed model. The precision of the model is determined via the tight accumulation of data points around the y = x line. The amount of this precision is usually measured by correlation coefficient. The correlation coefficient is calculated by fitting the best line that passes through the data, which has the lowest amount of this coef-ficient between all the other lines that could pass from the data.
To obtain a precise comparison between the proposed model output and the actual output, the obtained data from the model and the actual data are simultaneously plotted versus the index of data points in Fig. 4 for training, testing, and overall data. It could be seen that the predicted values of filtration volume closely fit the actual values.
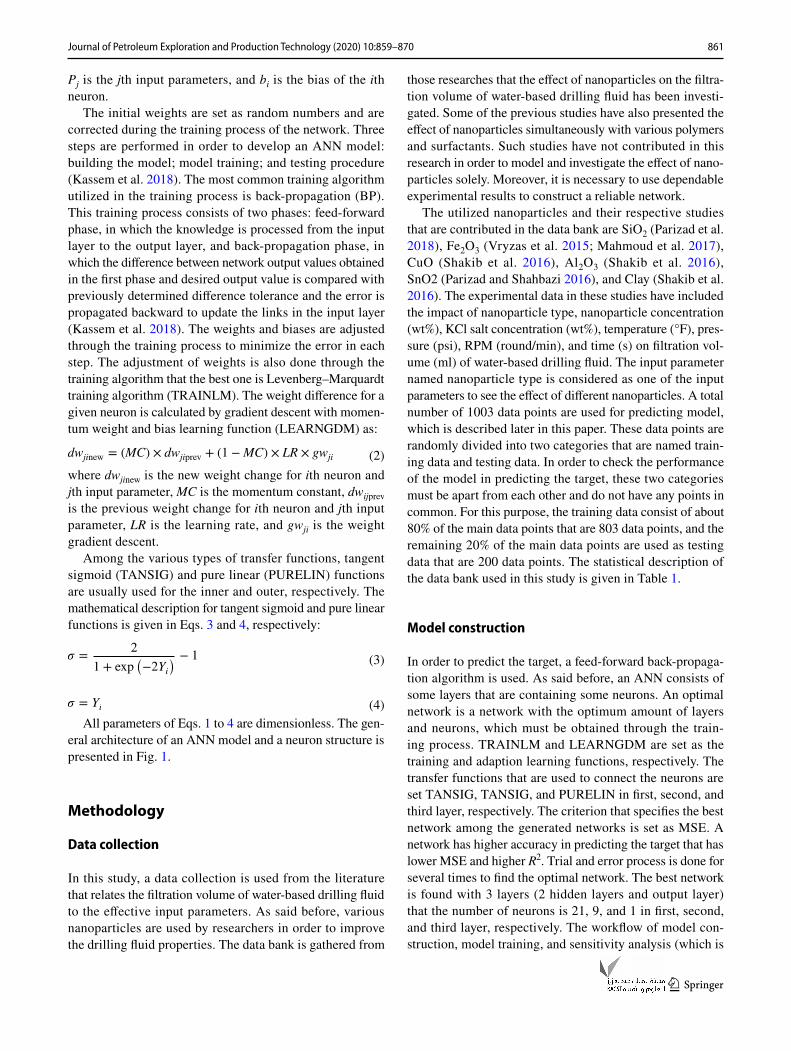
The values of R2 for training, testing, and overall data in this figure are 0.9938, 0.9904, and 0.9928, respectively. These values exhibit the efficiency of the employed ANN model to predict the filtration volume. The other statisti-cal parameters are represented in Table 3. The table shows that the values of MSE, AARE, and SD for overall data are 0.4797, 2.6636, and 0.0585, respectively. It is clear from the table that the proposed model has the high performance and could estimate and predict the filtration volume precisely.
In order to better understanding and comparing the val-ues of each statistical parameter with each other between each dataset, it is better to declare another representation of these parameters. Figure 5 depicts a graphical representation of measured statistical parameters for training, testing, and overall data.
Figure 6 represents a basecase from the databank (Pari-zad et al. 2018) in order to compare the filtration volume before and after adding nanoparticles and also to observe the physics happening to drilling fluid system. In this figure,
Table 3 Statistical parameters of the proposed ANN model
Dataset R2 MSE RMSE ARE (%) AARE (%) SD
Training data 0.9938 0.3715 0.6095 0.0672 2.4713 0.0544Testing data 0.9904 0.9140 0.9560 0.4126 3.4356 0.0728Overall data 0.9928 0.4797 0.6926 0.1361 2.6636 0.0585
866 Journal of Petroleum Exploration and Production Technology (2020) 10:859–870
1 3
the dashed and the continuous lines belong to base (without nanoparticles) drilling fluid case and the case with nano-particles, respectively. First of all, this figure depicts that the presented model could fit the actual data and also could
predict the trend of actual data. As shown in the figure, in the base drilling fluid (without nanoparticles) and also in the case with nanoparticles, filtration volume increases by increasing temperature. By comparing the curves before and
(a) (b)
(c) (d)
(e) (f)
0.988
0.989
0.99
0.991
0.992
0.993
0.994
0.995
R2
Training dataTesting dataOverall data
00.10.20.30.40.50.60.70.80.9
1
MSE
Training dataTesting dataOverall data
00.10.20.30.40.50.60.70.80.9
11.1
RM
SE
Training dataTesting dataOverall data
00.050.1
0.150.2
0.250.3
0.350.4
0.45
AR
E (%
)
Training dataTesting dataOverall data
0
0.5
1
1.5
2
2.5
3
3.5
4
AA
RE
(%)
Training dataTesting dataOverall data
0
0.01
0.02
0.03
0.04
0.05
0.06
0.07
0.08
SD
Training dataTesting dataOverall data
Fig. 5 Graphical representation of a R2, b MSE, c RMSE, d ARE, e AARE, and f SD for training, testing, and overall data

867Journal of Petroleum Exploration and Production Technology (2020) 10:859–870
1 3
after adding nanoparticles, it could be seen that the filtration volume decreases by increasing nanoparticles. There is also a range that nanoparticles could do their best in lowering the filtration volume that is stated in the literature (Mahmoud et al. 2017).
The relative deviation that measures the difference between predicted and actual data gives an illustrative view about the adjacency of actual and model target. The range of relative deviation values for training, testing, and overall data is [− 3.9797, 7.1553], [− 2.8577, 3.4762], and [− 3.9797, 7.1553], respectively. Such a low value of relative deviation illustrates the consistency between the actual and predicted filtration volume as presented in Fig. 7 for training, testing, and overall data. The statistical values of relative deviation are given in Table 4.
The distribution plots explore the distribution of a spe-cific parameter across the whole data points that are consid-ered in the study. Distribution of relative deviation is shown in Fig. 8 for training, testing, and overall data. The curve that is plotted on the overall data bars is the normal distribution curve. As it can be seen from the figure, the distribution of the relative deviation is located in the vicinity of zero that represents the uniform consistency between the actual and predicted data across the whole data points.
A specific parameter that is measured in all parts of the science is affected by some other independent parameters
that must be considered during the measurement. It is obvi-ous that all the effective parameters do not have the same effect on that specific parameter. Some of these parameters impact the specific parameter more and some less. As said before, sensitivity analysis is a method for the assessment of the effect of independent parameters on a specific parameter. Then, to specify the effect of each effective parameter on the filtration volume, a sensitivity analysis is done. Various methods are available to present the sensitivity analysis. In this work, relevancy factor is used (which is discussed in the Sensitivity Analysis section). Figure 9 represents the results of the sensitivity analysis of all input parameters on the fil-tration volume. It is obvious from this figure that in mod-eling the filtration volume, the most sensitive parameter is nanoparticle concentration and the least sensitive parameter is RPM. This result should be considered by the researchers for further researches.
Conclusions
In this study, an ANN model is developed to predict the effect of nanoparticles on filtration volume of water-based drilling fluids. For this purpose, 1003 data points are gath-ered from the most recent researches. Influencing param-eters including in this data bank are nanoparticle type,
Fig. 6 Simultaneous actual and model filtration volume at various temperatures: before adding nanoparticles (base drilling fluid) and after adding nanoparticles
0
5
10
15
20
25
30
0 300 600 900 1200 1500 1800
)lm(
emulov
noitartliF
Time (s)
77 °F with NP
109.4 °F with NP
149 °F with NP
199.4 °F with NP
model 77 °F with NP
model 109.4 °F with NP
model 149 °F with NP
model 199.4 °F with NP
77 °F base
109.4 °F base
149 °F base
199.4 °F base
model 77 °F base
model 109.4 °F base
model 149 °F base
model 199.4 °F base

868 Journal of Petroleum Exploration and Production Technology (2020) 10:859–870
1 3
nanoparticle concentration, KCl salt concentration, tem-perature, pressure, RPM, and time. Nanoparticles that are engaged are SiO2, Fe2O3, CuO, Al2O3, SnO2, and clay. The superiority of the model confirms by evaluating the statisti-cal analyses with AARE, R2, and MSE values of 2.6636%, 0.9928, and 0.4797, respectively, for total data. Moreo-ver, sensitivity analysis showed filtration volume is more sensitive to nanoparticle concentration and this parameter should be considered by researchers during process optimi-zation. The proposed ANN model is capable and efficient and comprehensive in predicting the influence of various
(a)
(b)
-1-0.8-0.6-0.4-0.2
00.20.40.60.8
1
0 10 20 30 40 50 60 70
Rel
ativ
e D
evia
tion
(%)
Actual Filtration volume (ml)
Training datay = 0 line
-1-0.8-0.6-0.4-0.2
00.20.40.60.8
1
0 10 20 30 40 50 60 70
Rel
ativ
e D
evia
tion
(%)
Actual Filtration volume (ml)
Testing datay = 0 line
(c)
-1-0.8-0.6-0.4-0.2
00.20.40.60.8
1
0 10 20 30 40 50 60 70
Rel
ativ
e D
evia
tion
(%)
Actual Filtration volume (ml)
Overall datay = 0 line
Fig. 7 Relative deviation versus actual filtration volume for a training data, b testing data, and c overall data
Table 4 Statistical values of RD (%)
Dataset Minimum Maximum Average
Training data − 0.9401 0.2150 − 6.7248e−04Testing data − 0.5444 0.3582 − 0.0041Overall data − 0.9401 0.3582 − 0.0014
(a)
(b)
0
50
100
150
200
250
300
350
400
[-0.
95,-0
.9]
[-0.
9,-0
.85]
[-0.
85,-0
.8]
[-0.
8,-0
.75]
[-0.
75,-0
.7]
[-0.
7,-0
.65]
[-0.
65,-0
.6]
[-0.
6,-0
.55]
[-0.
55,-0
.5]
[-0.
5,-0
.45]
[-0.
45,-0
.4]
[-0.
4,-0
.35]
[-0.
35,-0
.3]
[-0.
3,-0
.25]
[-0.
25,-0
.2]
[-0.
2,-0
.15]
[-0.
15,-0
.1]
[-0.
1,-0
.05]
[-0.
05,0
][0
,0.0
5][0
.05,
0.1]
[0.1
,0.1
5][0
.15,
0.2]
[0.2
,0.2
5]
Dis
trib
utio
n
Relative deviation (%)
Training dataNormal distribution
0102030405060708090
100
[-1,
-0.9
5][-
0.95
,-0.9
][-
0.9,
-0.8
5][-
0.85
,-0.8
][-
0.8,
-0.7
5][-
0.75
,-0.7
][-
0.7,
-0.6
5][-
0.65
,-0.6
][-
0.6,
-0.5
5][-
0.55
,-0.5
][-
0.5,
-0.4
5][-
0.45
,-0.4
][-
0.4,
-0.3
5][-
0.35
,-0.3
][-
0.3,
-0.2
5][-
0.25
,-0.2
][-
0.2,
-0.1
5][-
0.15
,-0.1
][-
0.1,
-0.0
5][-
0.05
,0]
[0,0
.05]
[0.0
5,0.
1][0
.1,0
.15]
[0.1
5,0.
2][0
.2,0
.25]
[0.2
5,0.
3][0
.3,0
.35]
[0.3
5,0.
4]
Dis
trib
utio
n
Relative deviation (%)
Testing dataNormal distribution
(c)
050
100150200250300350400450
[-1,
-0.9
5][-
0.95
,-0.9
][-
0.9,
-0.8
5][-
0.85
,-0.8
][-
0.8,
-0.7
5][-
0.75
,-0.7
][-
0.7,
-0.6
5][-
0.65
,-0.6
][-
0.6,
-0.5
5][-
0.55
,-0.5
][-
0.5,
-0.4
5][-
0.45
,-0.4
][-
0.4,
-0.3
5][-
0.35
,-0.3
][-
0.3,
-0.2
5][-
0.25
,-0.2
][-
0.2,
-0.1
5][-
0.15
,-0.1
][-
0.1,
-0.0
5][-
0.05
,0]
[0,0
.05]
[0.0
5,0.
1][0
.1,0
.15]
[0.1
5,0.
2][0
.2,0
.25]
[0.2
5,0.
3][0
.3,0
.35]
[0.3
5,0.
4]
Dis
trib
utio
n
Relative Deviation (%)
Overall data
Normal distribution
Fig. 8 Distribution of relative deviation for a training data, b testing data, and c overall data
869Journal of Petroleum Exploration and Production Technology (2020) 10:859–870
1 3
nanoparticles on filtration volume of water-based drilling fluids.
Open Access This article is distributed under the terms of the Crea-tive Commons Attribution 4.0 International License (http://creat iveco mmons .org/licen ses/by/4.0/), which permits unrestricted use, distribu-tion, and reproduction in any medium, provided you give appropriate credit to the original author(s) and the source, provide a link to the Creative Commons license, and indicate if changes were made.
References
Ahmad HM, Kamal MS, Murtaza M, Al-Harthi MA (2017) Improving the drilling fluid properties using nanoparticles and water-soluble polymers. In: SPE Kingdom of Saudi Arabia annual technical symposium and exhibition
Barry MM, Jung Y, Lee JK, Phuoc TX, Chyu MK (2015) Fluid fil-tration and rheological properties of nanoparticle additive and intercalated clay hybrid bentonite drilling fluids. J Petrol Sci Eng 127:338–346
Bonate PL (2001) A brief introduction to Monte Carlo simulation. Clin Pharmacokinet 40(1):15–22
Bourgoyne AT, Millheim KK, Chenevert ME, Young FS (1986) Applied drilling engineering. Richardson, TX
Cacuci DG, Ionescu-Bujor M, Navon IM (2005) Sensitivity and uncer-tainty analysis, vol. II: applications to large-scale systems. Chap-man & Hall/CRC Press, Boca Raton
Cheraghian G, Wu Q, Mostofi M, Li MC, Afrand M, Sangwai JS (2018) Effect of a novel clay/silica nanocomposite on water-based frilling fluids: improvements in rheological and filtration proper-ties. Colloids Surf A 555:339–350
Fakoya MF, Shah SN (2018) Effect of silica nanoparticles on the rheo-logical properties and filtration performance of surfactant-based and polymeric fracturing fluids and their blends. SPE Drill Com-plet 33(02):100–114
Hammonds JS, Hoffman FO, Bartell SM (1994) An introductory guide to uncertainty analysis in environmental and health risk assess-ment. US Department of Energy, Technical Report No. ES/ER/TM-35, 1
Ismail AR, Rashid NM, Jaafar MZ, Sulaiman WRW, Buang NA (2014) Effect of nanomaterial on the rheology of drilling fluids. J Appl Sci 14(11):1192
Ismail AR, Sulaiman W, Rosli W, Jaafar MZ, Ismail I, Sabu Hera E (2016) Nanoparticles performance as fluid loss additives in water
based drilling fluids. In: Materials science forum, 864. Trans Tech Publications, pp 189–193
Jeirani Z, Mohebbi A (2006) Artificial neural networks approach for estimating filtration properties of drilling fluids. J Jpn Petrol Inst 49(2):65–70
Jung Y, Barry M, Lee JK, Tran P, Soong Y, Martello D, Chyu M (2011) Effect of nanoparticle-additives on the rheological properties of clay-based fluids at high temperature and high pressure. In: AADE national technical conference and exhibition
Kassem Y, Çamur H, Bennur KE (2018) Adaptive neuro-fuzzy infer-ence system (ANFIS) and artificial neural network (ANN) for pre-dicting the kinematic viscosity and density of biodiesel-petroleum diesel blends. Am J Comput Sci Technol 1(1):8–18
Liang P, Bose NK (1996) Neural network fundamentals with graphs, algorithms, and applications. McGraw-Hill, New York
Mahmoud O, Nasr-El-Din HA, Vryzas Z, Kelessidis VC (2016) Nano-particle-based drilling fluids for minimizing formation damage in HP/HT applications. In: SPE international conference and exhibi-tion on formation damage control
Mahmoud O, Nasr-El-Din HA, Vryzas Z, Kelessidis VC (2017) Char-acterization of filter cake generated by nanoparticle-based drilling fluid for HP/HT applications. In: SPE international conference on oilfield chemistry
Mahmoud O, Nasr-El-Din HA, Vryzas Z, Kelessidis VC (2018) Using ferric oxide and silica nanoparticles to develop modified calcium bentonite drilling fluids. SPE Drill Complet 33(01):12–26
Masoudi S, Sima M, Tolouei-Rad M (2018) Comparative study of ANN and ANFIS models for predicting temperature in machining. J Eng Sci Technol 13(1):211–225
Needaa AM, Pourafshary P, Hamoud AH, Jamil ABDO (2016) Con-trolling bentonite-based drilling mud properties using sepiolite nanoparticles. Pet Explor Dev 43(4):717–723
Parizad A, Shahbazi K (2016) Experimental investigation of the effects of SnO2 nanoparticles and KCl salt on a water base drilling fluid properties. Can J Chem Eng 94(10):1924–1938
Parizad A, Shahbazi K, Tanha AA (2018) SiO2 nanoparticle and KCl salt effects on filtration and thixotropical behavior of polymeric water based drilling fluid: with zeta potential and size analysis. Results Phys 9:1656–1665
Sadeghalvaad M, Sabbaghi S (2015) The effect of the TiO2/polyacryla-mide nanocomposite on water-based drilling fluid properties. Powder Technol 272:113–119
Salih AH, Bilgesu H (2017) Investigation of rheological and filtration properties of water-based drilling fluids using various anionic nanoparticles. In: SPE Western regional meeting
Salih AH, Elshehabi TA, Bilgesu HI (2016) Impact of nanomaterials on the rheological and filtration properties of water-based drilling fluids. In: SPE Eastern regional meeting
Santoso R, Hoteit H, Vahrenkamp V (2019) Optimization of energy recovery from geothermal reservoirs undergoing re-injection: con-ceptual application in Saudi Arabia. In: SPE middle east oil and gas show and conference
Shakib JT, Kanani V, Pourafshary P (2016) Nano-clays as additives for controlling filtration properties of water-bentonite suspensions. J Petrol Sci Eng 138:257–264
Smith SR, Rafati R, Haddad AS, Cooper A, Hamidi H (2018) Appli-cation of aluminium oxide nanoparticles to enhance rheological and filtration properties of water based muds at HPHT conditions. Colloids Surf A 537:361–371
Srivatsa JT, Ziaja MB (2011) An experimental investigation on use of nanoparticles as fluid loss additives in a surfactant-polymer based drilling fluids. In: International petroleum technology conference
Vryzas Z, Mahmoud O, Nasr-El-Din HA, Kelessidis VC (2015) Devel-opment and testing of novel drilling fluids using Fe2O3 and SiO2 nanoparticles for enhanced drilling operations. In: International petroleum technology conference
-0.3 -0.2 -0.1 0 0.1 0.2 0.3 0.4
Nanoparticle Type Nanoparticle ConcentrationKCl Concentration TempraturePressure RPMTime
Fig. 9 Sensitivity analysis of filtration volume

870 Journal of Petroleum Exploration and Production Technology (2020) 10:859–870
1 3
Vryzas Z, Mahmoud O, Nasr-El-Din H, Zaspalis V, Kelessidis VC (2016) Incorporation of Fe3O4 nanoparticles as drilling fluid addi-tives for improved drilling operations. In: ASME 35th interna-tional conference on ocean, offshore and arctic engineering
Vryzas Z, Zaspalis V, Nalbandian L, Terzidou A, Kelessidis VC (2018) Rheological and HP/HT fluid loss behavior of nano-based drilling fluids utilizing Fe3O4 nanoparticles. Mater Today: Proc 5(14):27387–27396
Wang K, Jiang G, Liu F, Yang L, Ni X, Wang J (2018) Magnesium aluminum silicate nanoparticles as a high-performance rheo-logical modifier in water-based drilling fluids. Appl Clay Sci 161:427–435
Yang J (2011) Convergence and uncertainty analyses in Monte-Carlo based sensitivity analysis. Environ Model Softw 26:444–457
Yusof MAM, Hanafi NH (2015) Vital roles of nano silica in synthetic based mud for high temperature drilling operation. AIP Conf Proc 1669(1):020029
Zhou X (2014) Sensitivity analysis and uncertainty analysis in a large scale agent-based simulation model of infectious diseases. Doc-toral dissertation, University of Pittsburgh
Publisher’s Note Springer Nature remains neutral with regard to jurisdictional claims in published maps and institutional affiliations.