theoretical modeling for predicting material removal rate
TRANSCRIPT

Theoretical Modeling for Predicting MaterialRemoval Rate through Interelectrode GapDeepak Kumar
Indian Institute of Technology (Indian School of Mines)Vivek Bajpai
Indian Institute of Technology (Indian School of Mines)Nirmal Kumar Singh ( [email protected] )
Indian Institute of Technology (Indian School of Mines): Indian Institute of Technologyhttps://orcid.org/0000-0002-2773-4261
Research Article
Keywords: Gap modeling, Single discharge, Energy distribution, V-I curve, Plasma resistance, MRR
Posted Date: June 3rd, 2021
DOI: https://doi.org/10.21203/rs.3.rs-366228/v1
License: This work is licensed under a Creative Commons Attribution 4.0 International License. Read Full License
1
Theoretical Modeling for Predicting Material Removal Rate through Interelectrode Gap
Deepak Kumar [0000-0001-5358-3252], Vivek Bajpai [0000-0003-4811-6611], Nirmal Kumar
Singh *[0000-0002-2773-4261]
Department of Mechanical Engineering
Indian Institute of Technology (Indian School of Mines)
Dhanbad- 826004, India.
*Email of the corresponding author: [email protected]
Abstract
In EDM, the thermal energy of the discharge causing material erosion which is supplied by the
power source unit as electrical input. The discharge energy may be recognized by the current and
voltage pulses on time transient discharge characteristic curve (V-I curve) during machining.
However, the plasma resistance is very short for a smaller interelectrode gap in micro-EDM
compared to the impedance of the circuit. Hence, direct probe-based measurement of current and
voltage pulses may include the voltage drop across the stray impedance which causes variation in
its exact value. Here, a modeling-based approach may help to analyze the energy interaction with
the interelectrode gap. This article presents a theoretical modeling approach to predict the
interelectrode gap based on gap voltage, gap current, and plasma characteristics. Initially, a
simplified two-dimensional heat conduction equation (cylindrical form) was studied to
understand the asymmetry of heat flow in Gaussian distribution. A numerical analysis of a single
discharge pulse was considered by applying some basic assumptions. A numerical model has
been developed to predict gap distance and MRR considering gap voltage, gap current, and
plasma properties. The predicted model was validated against previously reported data from the

2
literature. Later on, the impact of gap voltage on gap distance, plasma resistance, and material
erosion rate was analyzed and discussed briefly.
Keywords: Gap modeling, Single discharge, Energy distribution, V-I curve, Plasma resistance,
MRR
1. Introduction
With rapid development in technology, the necessity of micro-features parts and devices
has increased in the field of aerospace, biomedical, automobile, energy, and electronics
industries [1–4]. To meet these requirements, electrical discharge machining is appropriate
machining technology to fabricate the 3D complex geometry on any electrically conductive
materials. The processing mechanism of material erosion is independent of the material physical
properties. Although, the thermal impact of electric discharge playing a significant role in
material erosion within the small interelectrode gap. Nevertheless, fundamental understanding
behind the energy interaction, heat flow, plasma growth, crater formation, debris removal, and
interconnection between process variables are still ambiguous which limits its application.
Researchers are involved in formulating the process variables models using a theoretical and
empirical approach to understand the fundamentals behind the material erosion and crater
geometry prediction.
The discharge phenomenon in EDM comprises various theories such as thermodynamics,
electrodynamics, fluid dynamics, electromagnetic and other subjects hence, understanding the
theory behind the discharge and process mechanism is quite challenging [5]. Lots of electro-
thermal models [6–10] were developed by assuming heat as a point source [11], disk type source
[12], uniform plane type source [13] to replicate the erosion mechanism of EDM. In all these
modeling approaches, the Gaussian type of heat flux distribution is most common where the

3
plasma channel radius was expressed in terms of discharge time and peak current. Erden et al.
[14] proposed a mathematical model to calculate MRR considering single discharge crater
formation however, this model did not show much more appreciable result while surface
integrity of the work material was concerned. The current surface integrity models are generally
considering the metallurgical characterization of the EDMed surface via optical microscope,
SEM and X-ray diffraction techniques [15]. Somashekhar et al. [16] applied the finite element
modeling approach to understand the thermal impact of multiple discharges in the EDM process
and show the temperature distribution over the machined surface. Li et al. [17] investigated the
effect of plasma arc movement on crater morphology for a single discharge. They reported
discharge current and narrow gap distance as substantial factors for predicting crater morphology
and plasma arc movement. Izquierdo et al. [1] applied the multiple discharge modeling approach
to studied MRR, SR, discharge radius in EDM. Similarly, Joshi et al. [18] applied the nonlinear
transient thermo-physical approach to determine the crater volume and MRR by considering a
single discharge pulse in die sink EDM. The developed model was made more realistic by
assuming the Gaussian type of heat distribution, latent heat of work materials, plasma radius as a
function of discharge time and gap current, etc. Further, the predicted model was validated
experimentally. DiBitonto et al. [11] proposed a cathode erosion based modeling by considering
discharge power as an important factor at the boundary of the plasma interface. It was observed
that the amount of heat received by the workpiece defines the shape of plasma while the plasma
radius is the function of time. An anode crater formation numerical model was proposed to
determine the MRR in two consecutive stages i.e. plasma built-up stage and bubble collapsing
stage by Tao et al. [19]. The crater volume and debris geometry were used to replicate the
erosion mechanism for MRR. The single discharge plasma is characterized by Singh [20] based

4
on shape, size, and plasma growth channel. The thermal model was developed by assuming the
fraction of heat transfer to the work part at varying EDM parameters. The model was further
optimized and validated to improve the outputs of the process. Later on, Chu et al. [5]
investigated the time-varying plasma channel growth model in the pre-ignition and expansion
phase of micro EDM. Jithin et al. [21] used the finite element modeling approach to predict the
crater geometry in a single discharge. They identified pulse on time and pulse current as
significant factors for crater geometry prediction with error percentage of 9.1 to 13.4% in crater
aspect ratio.
As the literature suggests, there is an inadequate mathematical model reported in free
literature that can predict the inter-electrode gap via gap current, gap voltage, and plasma
resistance. Moreover, the interaction of the discharge energy within the small interelectrode has
not been investigated. Hence, the present article shows the discharge energy interaction for the
small interelectrode gap in theoretical way. A mathematical model has been developed to predict
the inter-electrode gap by considering all the above factors in a single discharge system. The
asymmetry of heat flux distribution, governing equations, plasma radius, and energy transferred
for single discharge was studied initially. Additionally, a theoretical relation has been developed
for determining MRR, based on the inter-electrode gap, discharge current, and material removal
constant along with plasma properties. The predicted model was validated against experimental
results reported in previously published papers. Moreover, the impact of gap voltage on gap
distance, plasma resistance, and MRR was analyzed and discussed. As gap distance increases,
the gap voltage also increases which results to increase in discharge energy level within the small
gap. This increase in discharge energy level causes more material erosion for specified gap.
2. Thermo-physical model
5
From literature survey, a nonlinear transient model of single discharge was studied
initially to form the crater on the workpiece. The formation of the crater is mainly due to the
thermal impact of the multiple discharges. Here, the heat generated by plasma followed the two
modes i.e. conduction and convection. The conduction mode of heat transfer is based on specific
heat as well as latent heat while convection mode is due to dielectric flow. Most of the reported
literature neglects the heat transferred by convection and radiation for making ease of simplicity
in the calculation.
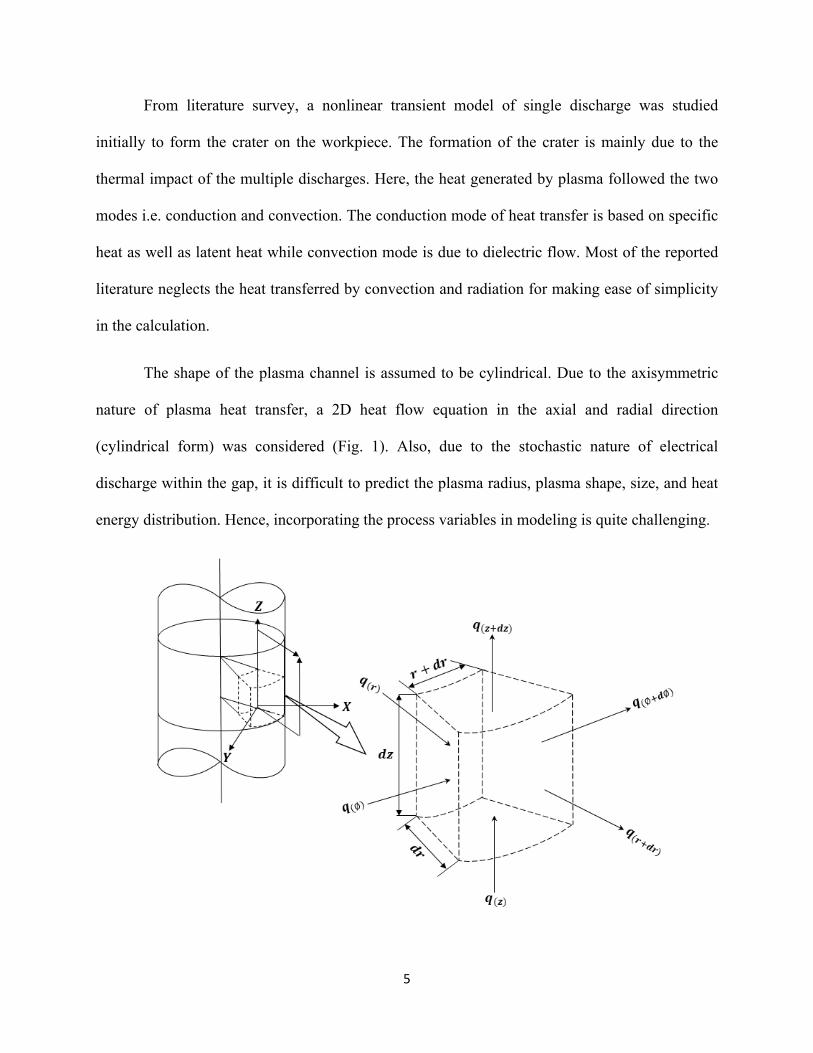
The shape of the plasma channel is assumed to be cylindrical. Due to the axisymmetric
nature of plasma heat transfer, a 2D heat flow equation in the axial and radial direction
(cylindrical form) was considered (Fig. 1). Also, due to the stochastic nature of electrical
discharge within the gap, it is difficult to predict the plasma radius, plasma shape, size, and heat
energy distribution. Hence, incorporating the process variables in modeling is quite challenging.
6
Fig. 1 Heat flow model in an axial and radial direction for a cylindrical coordinate system.
2.1 Assumptions
The stochastic nature of electrical discharge showed the randomness in the machining process
hence, it is necessary to follow some basic assumptions to make the model solvable.
1. The tool and workpiece material are homogeneous, isotropic, and poses no internal stress
before machining.
2. The heat flow is axisymmetric type along the r-z plane.
3. Heat flux distribution is Gaussian type to make the model more realistic during an
effective pulse on time.
4. The internal heat generated by the system is totally ignored ( 0gq = ).
5. The part of total discharge energy is attributed as heat flux input to the work material and
the heat flow through convection and radiation mode is neglected.
6. There is no change in thermo-physical characteristics of work material for a specific
range of temperatures.
7. A single discharge pulse is assumed to predict MRR by expressing gap distance as a
function of gap voltage and average gap current.
8. The volumetric material erosion rate is directly proportional to the energy consumed by
the anode i.e. workpiece.
9. The value of material removal constant was taken as 1 i.e. (ƞ=1) which is defined as the
ratio of material removal rate per unit discharge energy.
10. Discharge channel length in plasma area is almost equals the inter-electrode gap during
machining.

7
11. There is no deposition of molten material as the recast layer i.e. flushing efficiency is
100%.
2.2 Governing equation and applied boundary condition
The heating of work material is due to the energy of single discharge and the flow of heat
is axisymmetric type. The governing equation for this type of heat flow in a cylindrical
coordinate system is given by the Fourier law of heat conduction with no heat generation
(Equation 1) [22].
1w p t t
T T TC k r k
t r r r z zρ ∂ ∂ ∂ ∂ ∂ = + ∂ ∂ ∂ ∂ ∂
(1)
Where, ρw (work material density), Cp (specific heat capacity of the workpiece), T (atmospheric
temperature), t (time), kt (thermal conductivity of material), r, and z are the coordinates axis in
the r-z plane.
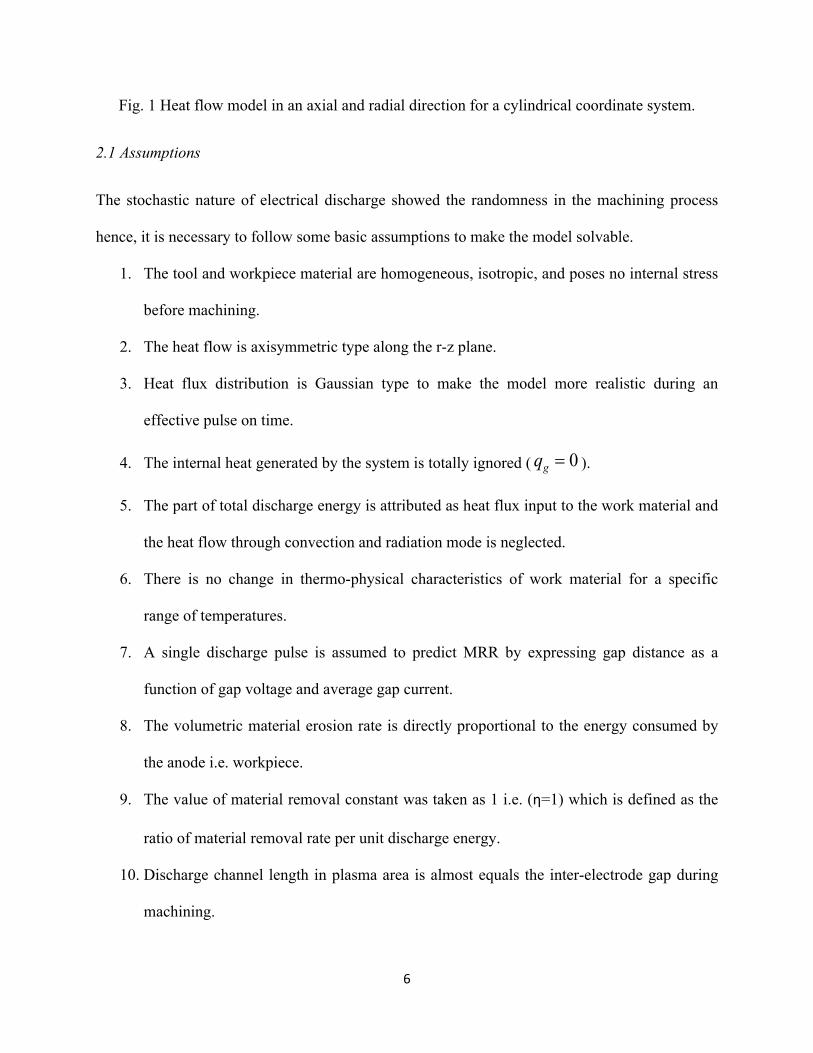
A small piece of a cylindrical part in work material around the discharge was considered
for the heat flow analysis. The boundary condition for the heat transferred in this type of system
is illustrated in Fig. 2. Only the upper part of the work material was considered for the spark
energy distribution within the plasma radius (𝑟𝑟𝑝𝑝). No heat transferred is considered for the
boundary BC-2 and BC-3 due to the far distance from the discharge radius. For boundary, BC-4,
the heat flux distribution is considered to be zero due to the line of symmetry [22].
( / )
(T T ) if (neglected)
0 pulse interval time
pa w p
t c o p
r r
Tk h r r
z
q ≤ ∂ = − > ∂
(2)
0 for BC- 2, BC- 3
T
t
∂=
∂(Far distance from discharge radius) (3)
8
0 for BC- 4
T
t
∂=
∂(Along the line of symmetry) (4)
Fig. 2 Thermal model of heat in terms of Gaussian heat distribution with applied boundary
conditions.
2.3 Single discharge heat input
Most of the published papers consider the uniform heat distribution for a single discharge
within the plasma radius. However, this fact is far away from reality due to the stochastic nature
of the discharge in short duration of the pulse. The evidence can be easily visualized by
spectroscopy techniques and crater geometry formation.
The present model shows the Gaussian type of heat flux distribution. The probability density
function for this type of distribution for a random variable (r) [23] is expressed as,
2
221
( )2
r
P r e σ
σ π
−= (5)

9
Here, σ: standard deviation for Gaussian distribution of heat flux where 99.7 % value resides
inside the 3σ i.e. (±3σ = rp).
Now, replacing by 3
prσ and considering random variable (r) is nothing but the crater radius (rc)
then,
Now assuming, P(r) = Q(r) and 𝑄𝑄𝑚𝑚𝑚𝑚𝑚𝑚=3
2pr π (6)
Therefore,
2
24.5( )
max(r) p
r
rP Q e
−
= (7) 𝑄𝑄𝑚𝑚𝑚𝑚𝑚𝑚 : Maximum heat intensity at the center point of the work material
rp: Plasma radius
rc: Work material radius or crater radius
Total energy received on the work surface =0
( ) ( )2pr
Q r dA Q r rdrπ=∫ ∫ (8)
2
24.5( )
max0
2p
p
rr r
Q e rdrπ−
= ∫ (9)
2
22 4.5( )
max
0
4.5
p
p
rr
rprQ e
π − = −
(10)
2
max0.2191 pQ rπ= (11)
The heat flux received by the workpiece surface equals to discharge power [10], hence
2
max0.2191f pP VI Q rπ=
(12)
We have,
max 2 2
. . 4.567 . .
0.219
f f
p p
P V I P V IQ
r rπ π= = at the center of plasma (i.e. 0pr = ) (13)

10
2
2
4.567( ) exp 4.5
f c
p p
P VI rQ r
r rπ
= −
(14)
Q(r): heat entered into the work material, Pf: portion of heat received by the workpiece, I: gap
current (A), V: gap voltage (V), rp: spark or plasma radius, rc: crater radius.
2.4 Spark radius or plasma radius
In ultra-short pulse duration, measuring a spark radius is a challenging task. Also, the
plasma radius is not constant and continuously growing/varying with respect to time. It mainly
depends on the material type, electrode shape, polarity, and types of the dielectric. However,
some researchers evaluated the relation of plasma radius as a function of discharge power and
machining time for the rectangular type of discharge pulses which is given as follows [24].
( ) (P ) ( )m n
p dr t Z t=
(15)
Where rp (t): time function of plasma radius, Pd: discharge power, t: machining time, Z, m, n:
empirical constant which can be evaluated through experiments.
The value of Z can be calculated in terms of discharge length (l) is given by
( 0.5 )
LZ
lm N=
+
(16)
The empirical constant L, m, n can be evaluated by experimentally which follow the relation as,
0.5m M N= + , and n N= (17)
Various researchers have applied various concepts to estimate the shape and size and
growing plasma radius. However, the most accepted concept is that the plasma radius can be

11
expressed in terms of peak current and discharge time. The following fact was found valid for
the spark energy limited 670 mJ [25]. Further, the above fact was utilized for the calculation of
MRR for the predicted model.
3 0.43 0.44( ) (2.04 ) Ip p onr t e T−=
(18)
2.5 Energy sharing in the discharge phase
The major portion of the supplied energy is consumed by the plasma channel during the
built-up, expansion phase, and consequently material erosion phase. The literature clearly shows
that the percentage may vary from 14% to 50% of total discharge energy [3]. Hence, estimating
the discharge energy allocation during the erosion phase may help to develop a more precise
thermo-physical model to estimate MRR and various EDM related characteristic parameters
[26]. Additionally, the energy absorbed by the work material significantly depends on peak
current and effective discharge time which may vary from 6.5% to 17.7% at varying energy
levels [22].
3. Mathematical formulation for inter-electrode gap prediction
The gap voltage (Vg) and gap current (Ig) that exist in the inter-electrode gap will exhibit
an equivalent resistance for plasma channel which is given as
g
plasma
g
VR
I=
g pI I (During short-circuiting) (19)
The resistance of the plasma channel in terms of electrical resistivity can also be expressed as
plasma
lR
Aρ= (20)
12
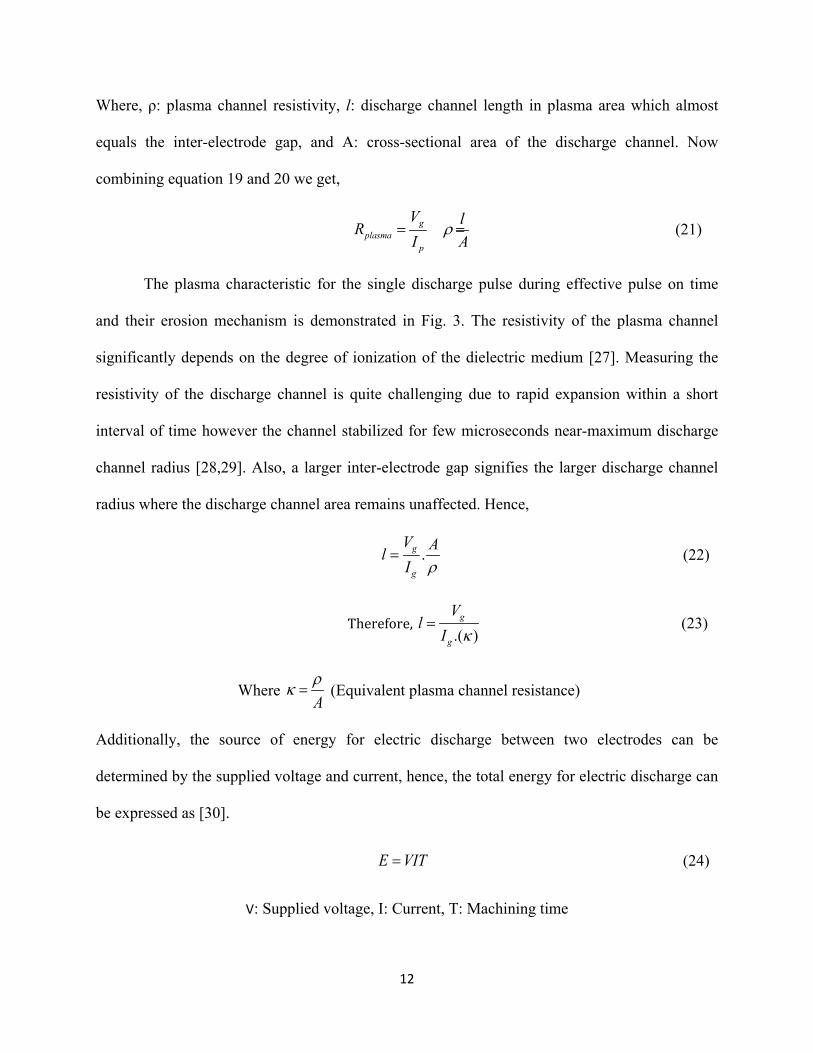
Where, ρ: plasma channel resistivity, l: discharge channel length in plasma area which almost
equals the inter-electrode gap, and A: cross-sectional area of the discharge channel. Now
combining equation 19 and 20 we get,
g
plasma
p
V lR
I Aρ= = (21)
The plasma characteristic for the single discharge pulse during effective pulse on time
and their erosion mechanism is demonstrated in Fig. 3. The resistivity of the plasma channel
significantly depends on the degree of ionization of the dielectric medium [27]. Measuring the
resistivity of the discharge channel is quite challenging due to rapid expansion within a short
interval of time however the channel stabilized for few microseconds near-maximum discharge
channel radius [28,29]. Also, a larger inter-electrode gap signifies the larger discharge channel
radius where the discharge channel area remains unaffected. Hence,
.g
g
V Al
I ρ= (22)
Therefore, .( )
g
g
Vl
I κ= (23)
Where A
ρκ = (Equivalent plasma channel resistance)
Additionally, the source of energy for electric discharge between two electrodes can be
determined by the supplied voltage and current, hence, the total energy for electric discharge can
be expressed as [30].
E VIT= (24)
V: Supplied voltage, I: Current, T: Machining time
13
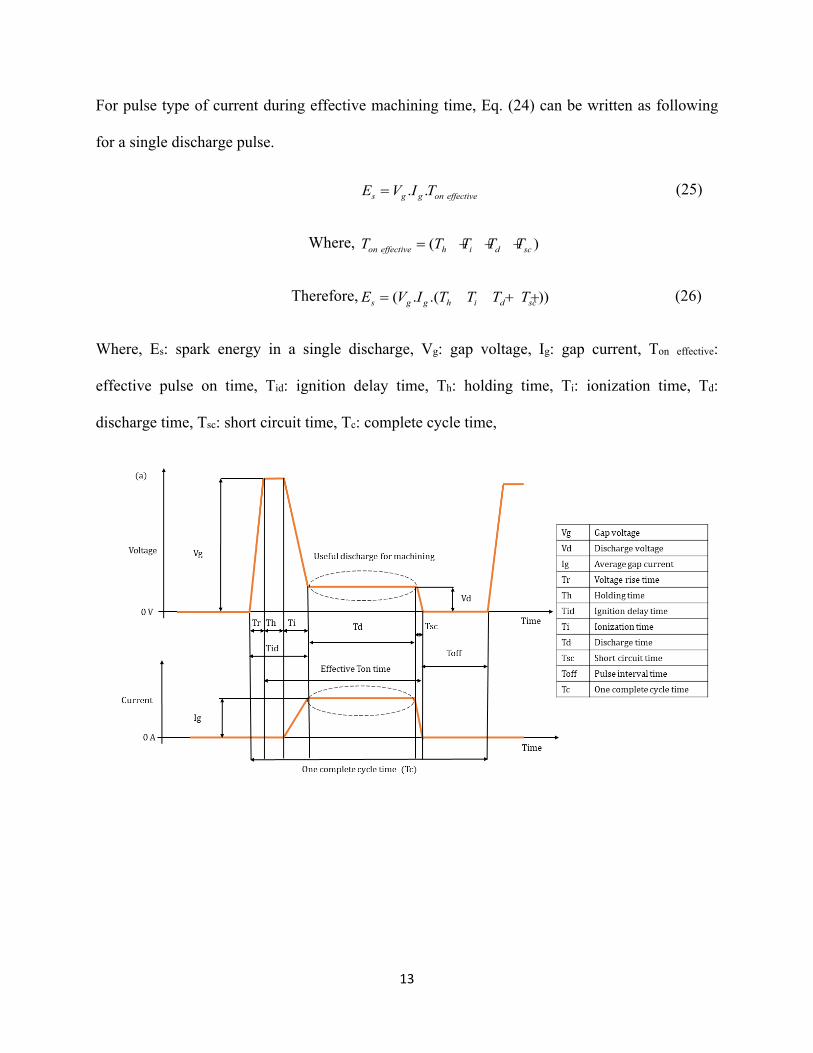
For pulse type of current during effective machining time, Eq. (24) can be written as following
for a single discharge pulse.
. .s g g on effectiveE V I T= (25)
Where, ( )on effective h i d scT T T T T= + + +
Therefore, ( . .( ))s g g h i d scE V I T T T T= + + +
(26)
Where, Es: spark energy in a single discharge, Vg: gap voltage, Ig: gap current, Ton effective:
effective pulse on time, Tid: ignition delay time, Th: holding time, Ti: ionization time, Td:
discharge time, Tsc: short circuit time, Tc: complete cycle time,
14
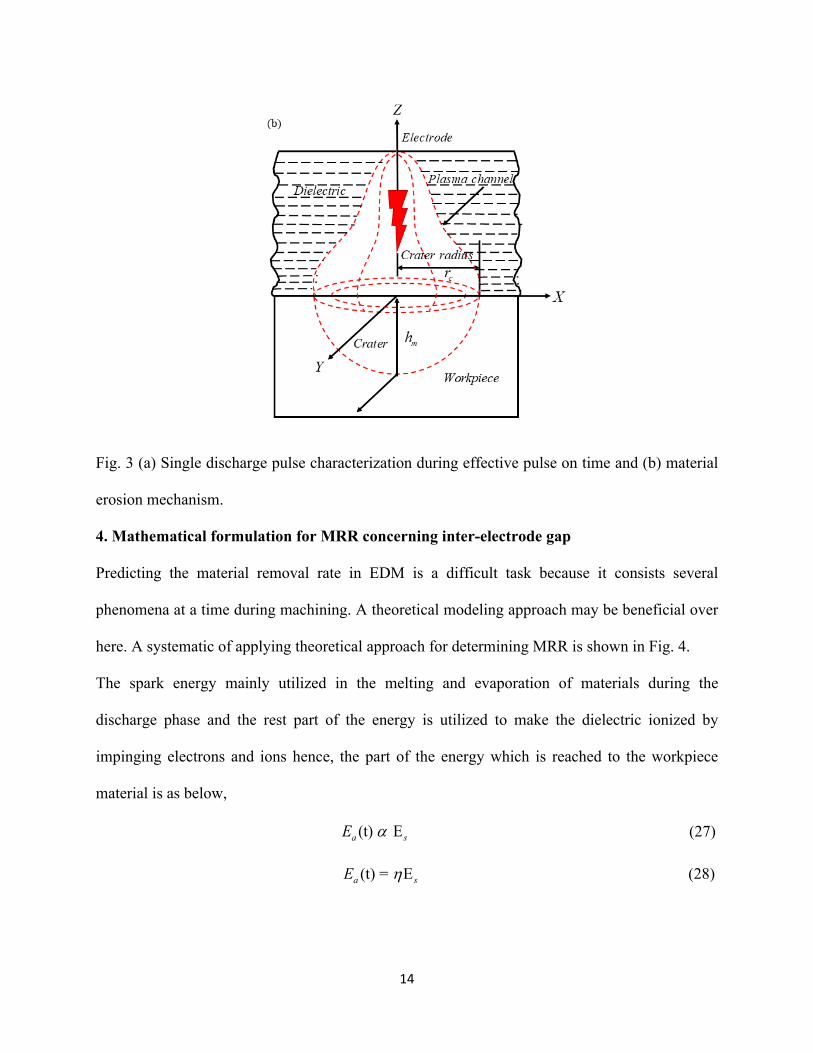
Fig. 3 (a) Single discharge pulse characterization during effective pulse on time and (b) material
erosion mechanism.
4. Mathematical formulation for MRR concerning inter-electrode gap
Predicting the material removal rate in EDM is a difficult task because it consists several
phenomena at a time during machining. A theoretical modeling approach may be beneficial over
here. A systematic of applying theoretical approach for determining MRR is shown in Fig. 4.
The spark energy mainly utilized in the melting and evaporation of materials during the
discharge phase and the rest part of the energy is utilized to make the dielectric ionized by
impinging electrons and ions hence, the part of the energy which is reached to the workpiece
material is as below,
(t) Ea sE α
(27)
(t) = Ea sE η (28)

15
Fig. 4 Theoretical approach to determine material removal rate concerning gap distance
Son et al. [30] reported that the material removed for a single discharge pulse is directly
proportional to the spark energy and they expressed it as following,
1MRR = .E . . .s g g on effective
on effective off
V I TT T
η η
= + (29)
Now, neglecting pulse off time and discharge frequency because material is removed only during
effective pulse on time and discharge frequency may not as influential as other parameters while
material removal rate is concerned, hence
MRR = .( . . )g g on effectiveV I Tη (30)
MRR = .( . .( ))g g h i d scV I T T T Tη + + + (31)
MRR = .( . . .( ))g plasma g h i d scI R I T T T Tη + + + (32)
2MRR = .( . .( ))g plasma h i d scI R T T T Tη + + +
(33)
2MRR = .( . .( ))g h i d sc
lI T T T T
Aη ρ + + + (34)
2MRR = . . .( )g h i d scI l T T T Tη κ + + + , We have,A
ρκ =
(35)

16
η: material removal constant i.e. volumetric material removal per unit discharge energy. Where
Ig: average gap current, l : gap distance, A: cross-sectional area of the arc discharge, Ton effective:
effective pulse on time for machining, andA
ρκ = (Equivalent plasma channel resistance)
The developed model for MRR showing the linear relationship with the discharge current and
inter-electrode gap-but in real practice, it may vary. Also, the volume removed in a single
discharge defines the roughness of the finished workpiece. In real practice, there is material
deposition as a recast layer; taper cut, overcut, and debris attachment are some major issues that
define the product quality.
5. Experimental validation for inter-electrode gap and MRR
5.1 Model validation through previously reported data
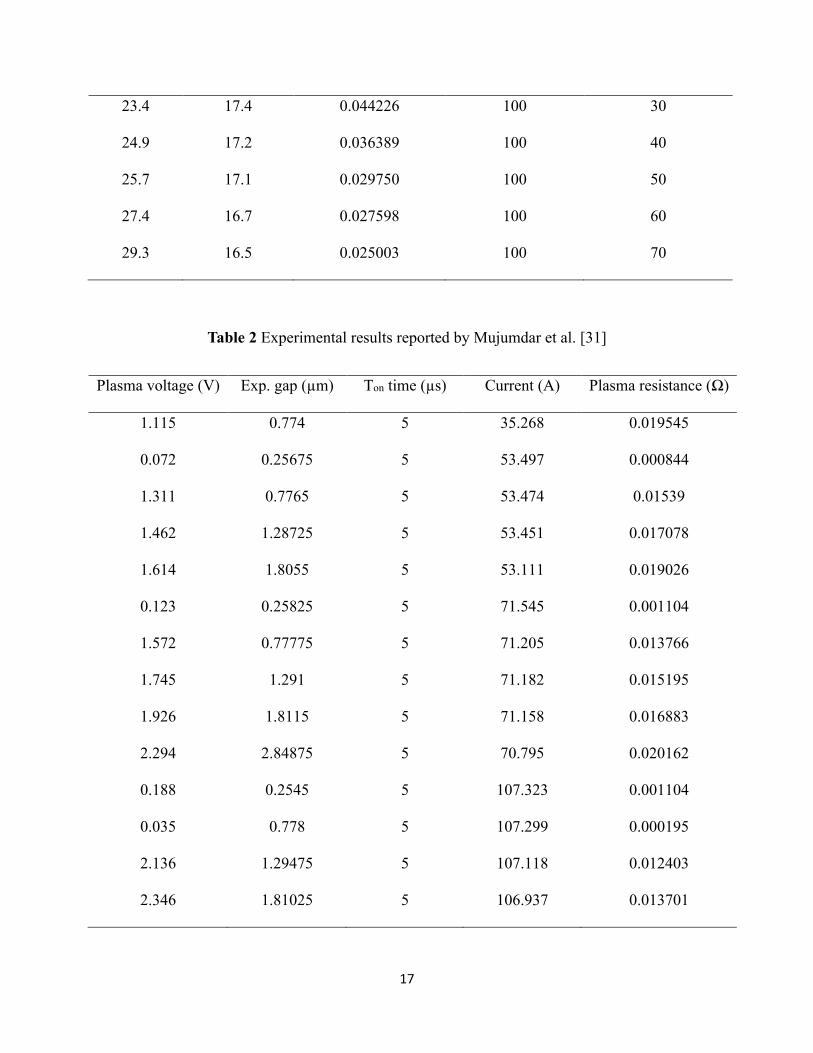
The proposed model for predicting the interelectrode gap and MRR is validated against
previously published experimental data reported by Xin et al. [27] and Mujumdar et al. [31]. The
experimental results reported in each paper is presented in Table 1 and Table 2. The term η is the
material removal constant which is defined as volumetric eroded material per unit discharge
energy. Here, η =1 is considered for experimental and numerical validation.
Table 1 Experimental input parameters reported by Xin et al. [27]
Gap voltage
(V)
Gap current
(A)
Avg. equivalent
resistance
(Ω-µm-1)
Effective pulse on
time (μs)
Exp. interelectrode
gap (μm)
19.5 18.2 0.109227 100 10
21.5 17.7 0.061174 100 20
17
23.4 17.4 0.044226 100 30
24.9 17.2 0.036389 100 40
25.7 17.1 0.029750 100 50
27.4 16.7 0.027598 100 60
29.3 16.5 0.025003 100 70
Table 2 Experimental results reported by Mujumdar et al. [31]
Plasma voltage (V) Exp. gap (µm) Ton time (µs) Current (A) Plasma resistance (Ω)
1.115 0.774 5 35.268 0.019545
0.072 0.25675 5 53.497 0.000844
1.311 0.7765 5 53.474 0.01539
1.462 1.28725 5 53.451 0.017078
1.614 1.8055 5 53.111 0.019026
0.123 0.25825 5 71.545 0.001104
1.572 0.77775 5 71.205 0.013766
1.745 1.291 5 71.182 0.015195
1.926 1.8115 5 71.158 0.016883
2.294 2.84875 5 70.795 0.020162
0.188 0.2545 5 107.323 0.001104
0.035 0.778 5 107.299 0.000195
2.136 1.29475 5 107.118 0.012403
2.346 1.81025 5 106.937 0.013701
18
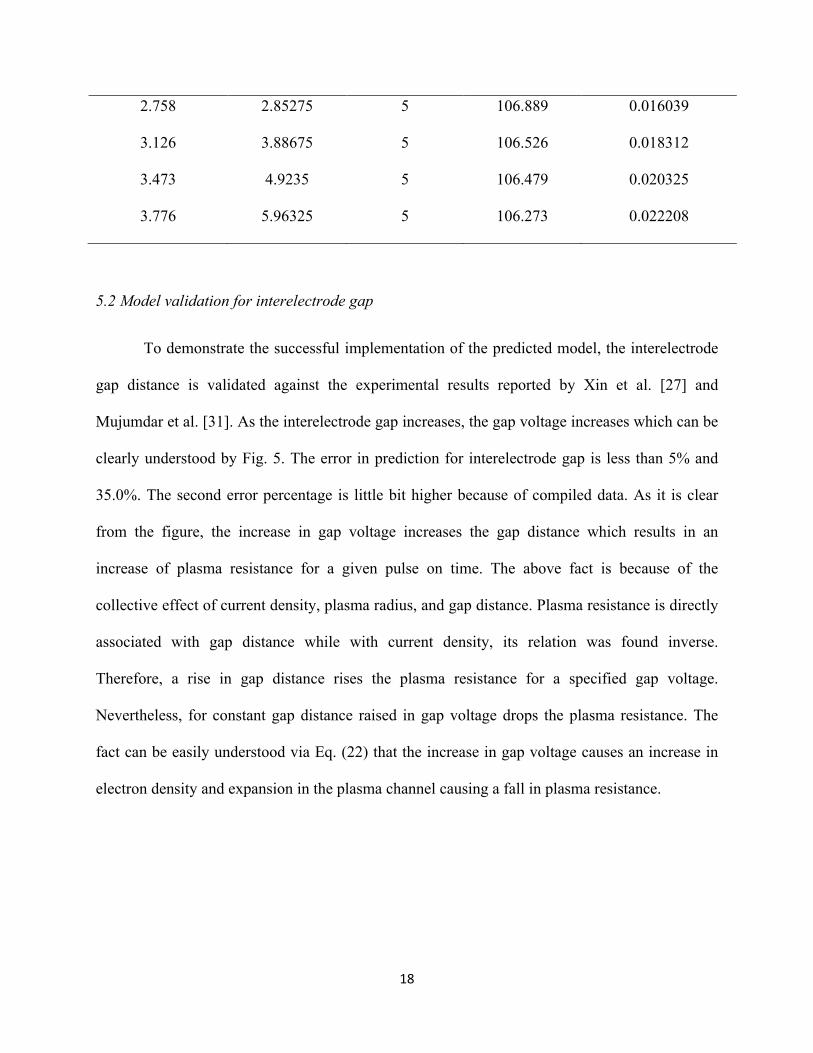
2.758 2.85275 5 106.889 0.016039
3.126 3.88675 5 106.526 0.018312
3.473 4.9235 5 106.479 0.020325
3.776 5.96325 5 106.273 0.022208
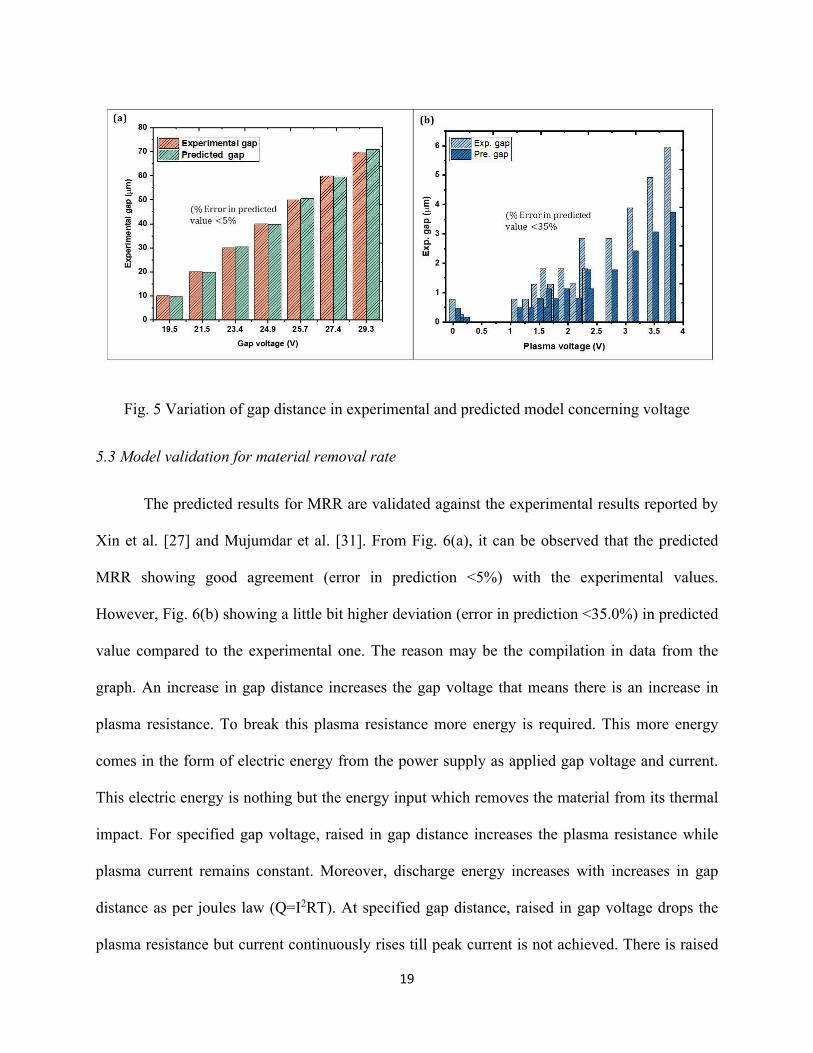
5.2 Model validation for interelectrode gap
To demonstrate the successful implementation of the predicted model, the interelectrode
gap distance is validated against the experimental results reported by Xin et al. [27] and
Mujumdar et al. [31]. As the interelectrode gap increases, the gap voltage increases which can be
clearly understood by Fig. 5. The error in prediction for interelectrode gap is less than 5% and
35.0%. The second error percentage is little bit higher because of compiled data. As it is clear
from the figure, the increase in gap voltage increases the gap distance which results in an
increase of plasma resistance for a given pulse on time. The above fact is because of the
collective effect of current density, plasma radius, and gap distance. Plasma resistance is directly
associated with gap distance while with current density, its relation was found inverse.
Therefore, a rise in gap distance rises the plasma resistance for a specified gap voltage.
Nevertheless, for constant gap distance raised in gap voltage drops the plasma resistance. The
fact can be easily understood via Eq. (22) that the increase in gap voltage causes an increase in
electron density and expansion in the plasma channel causing a fall in plasma resistance.
19
Fig. 5 Variation of gap distance in experimental and predicted model concerning voltage
5.3 Model validation for material removal rate
The predicted results for MRR are validated against the experimental results reported by
Xin et al. [27] and Mujumdar et al. [31]. From Fig. 6(a), it can be observed that the predicted
MRR showing good agreement (error in prediction <5%) with the experimental values.
However, Fig. 6(b) showing a little bit higher deviation (error in prediction <35.0%) in predicted
value compared to the experimental one. The reason may be the compilation in data from the
graph. An increase in gap distance increases the gap voltage that means there is an increase in
plasma resistance. To break this plasma resistance more energy is required. This more energy
comes in the form of electric energy from the power supply as applied gap voltage and current.
This electric energy is nothing but the energy input which removes the material from its thermal
impact. For specified gap voltage, raised in gap distance increases the plasma resistance while
plasma current remains constant. Moreover, discharge energy increases with increases in gap
distance as per joules law (Q=I2RT). At specified gap distance, raised in gap voltage drops the
plasma resistance but current continuously rises till peak current is not achieved. There is raised

20
in discharge energy level as gap voltage rose for constant gap distance. This rose in discharge
energy level increases the material erosion because of the high thermal impact of electric
discharge.
Fig. 6 Variation of MRR in experimental and predicted model concerning gap distance.
6. Conclusions
The proposed mathematical modeling approach predicted the interelectrode gap and MRR
for a single discharge pulse. Below points showing the major conclusion from the above studied.
• The validation against the experimental results showing the correctness of the predicted
model. The error in predicted model was found less than 5 % and 35% for interelectrode
as well as for MRR.
• The interelectrode gap is directly associated with gap voltage, peak current, and
equivalent plasma resistance. There is a rise in plasma resistance as gap distance
increases and hence, more energy is required in terms of gap voltage to break that
resistance.
21
• At the constant interelectrode gap, raised in gap voltage drops the plasma resistance
within the gap. This drops in plasma resistance offers low resistance path to flow the high
discharge current which removes the material as debris.
• Material removal constant, gap current, effective pulse on time, inter-electrode gap, and
equivalent plasma resistance are the important factors that define the MRR in EDM.
• The proposed numerical model may be the time-saving alternative where machining
performance is concerned prior to the actual machining.
Declarations
Authors’ contributions: Deepak Kumar: Conceptualization, Methodology, Validation, Formal
analysis, Writing - Original Draft, Vivek Bajpai: Conceptualization, Review & Editing,
Supervision, Nirmal Kumar Singh: Writing - Review & Editing, Supervision.
Funding: Open access funding provided by Indian Institute of Technology (Indian School of
Mines), Dhanbad.
Availability of data and material: The authors confirm that material supporting the findings of
this work is available within the article. The collected data of this work are available within the
article.
Compliance with ethical standards
Competing interest: The authors declare that they have no known competing financial interests
or personal relationships that could have appeared to influence the work reported in this paper.
Ethical approval: The article follows the guidelines of the Committee on Publication Ethics
(COPE) and involves no studies on human or animal subjects.

22
Consent to participate: Not applicable. The article involves no studies on humans.
Consent to publish: Not applicable. The article involves no studies on humans.
References
[1] B. Izquierdo, J.A. Sánchez, S. Plaza, I. Pombo, N. Ortega, A numerical model of the EDM
process considering the effect of multiple discharges, Int. J. Mach. Tools Manuf. (2009).
https://doi.org/10.1016/j.ijmachtools.2008.11.003.
[2] C.P. Mohanty, J. Sahu, S.S. Mahapatra, Thermal-structural analysis of electrical discharge
machining process, in: Procedia Eng., 2013. https://doi.org/10.1016/j.proeng.2013.01.072.
[3] S. Hinduja, M. Kunieda, Modelling of ECM and EDM processes, CIRP Ann. - Manuf.
Technol. (2013). https://doi.org/10.1016/j.cirp.2013.05.011.
[4] D. Kumar, S. Kumar, D. Kumar, N.K. Singh, Effect of Two Different Dielectrics on the
Machining Performance and Their Parametric Optimization Through Response Surface
Methodology, in: Lect. Notes Mech. Eng., 2020. https://doi.org/10.1007/978-981-15-
1307-7_4.
[5] X. Chu, K. Zhu, C. Wang, Z. Hu, Y. Zhang, A Study on Plasma Channel Expansion in
Micro-EDM, Mater. Manuf. Process. 31 (2016) 381–390.
https://doi.org/10.1080/10426914.2015.1059445.
[6] M. Gostimirovic, P. Kovac, M. Sekulic, B. Skoric, Influence of discharge energy on
machining characteristics in EDM, J. Mech. Sci. Technol. 26 (2012) 173–179.
https://doi.org/10.1007/s12206-011-0922-x.
[7] A. Razeghiyadaki, C. Molardi, D. Talamona, A. Perveen, Modeling of material removal

23
rate and surface roughness generated during electro-discharge machining, Machines.
(2019). https://doi.org/10.3390/machines7020047.
[8] S. Jithin, U. V. Bhandarkar, S.S. Joshi, Multi-spark model for predicting surface
roughness of electrical discharge textured surfaces, Int. J. Adv. Manuf. Technol. (2020).
https://doi.org/10.1007/s00170-019-04841-5.
[9] I. Bhiradi, L. Raju, S.S. Hiremath, Finite Element Modeling of Single Spark Material
Removal and Heat Flux Distribution in Micro-Electro Discharge Machining Process, in:
Lect. Notes Mech. Eng., 2019. https://doi.org/10.1007/978-981-13-6374-0_35.
[10] S. Assarzadeh, M. Ghoreishi, Electro-thermal-based finite element simulation and
experimental validation of material removal in static gap singlespark die-sinking electro-
discharge machining process, Proc. Inst. Mech. Eng. Part B J. Eng. Manuf. (2017).
https://doi.org/10.1177/0954405415572661.
[11] D.D. DiBitonto, P.T. Eubank, M.R. Patel, M.A. Barrufet, Theoretical models of the
electrical discharge machining process. I. A simple cathode erosion model, J. Appl. Phys.
(1989). https://doi.org/10.1063/1.343994.
[12] Y. Zhang, Y. Liu, Y. Shen, Z. Li, R. Ji, F. Wang, A new method of investigation the
characteristic of the heat flux of EDM plasma, in: Procedia CIRP, 2013.
https://doi.org/10.1016/j.procir.2013.03.086.
[13] F.S. Van Dijck, W.L. Dutré, Heat conduction model for the calculation of the volume of
molten metal in electric discharges, J. Phys. D. Appl. Phys. (1974).
https://doi.org/10.1088/0022-3727/7/6/316.

24
[14] A. Erden, F. Arinc, M. Kogmen, Comparison of mathematical models for electric
discharge machining, J. Mater. Process. Manuf. Sci. (1995).
[15] K.P. Rajurkar, S.M. Pandit, Quantitative expressions for some aspects of surface integrity
of electro discharge machined components, J. Manuf. Sci. Eng. Trans. ASME. (1984).
https://doi.org/10.1115/1.3185929.
[16] K.P. Somashekhar, S. Panda, J. Mathew, N. Ramachandran, Numerical simulation of
micro-EDM model with multi-spark, Int. J. Adv. Manuf. Technol. 76 (2013) 83–90.
https://doi.org/10.1007/s00170-013-5319-9.
[17] Q. Li, X. Yang, Study on arc plasma movement and its effect on crater morphology during
single-pulse discharge in EDM, Int. J. Adv. Manuf. Technol. (2020).
https://doi.org/10.1007/s00170-020-04964-0.
[18] S.N. Joshi, S.S. Pande, Thermo-physical modeling of die-sinking EDM process, J. Manuf.
Process. (2010). https://doi.org/10.1016/j.jmapro.2010.02.001.
[19] J. Tao, J. Ni, A.J. Shih, Modeling of the anode crater formation in electrical discharge
machining, J. Manuf. Sci. Eng. Trans. ASME. (2012). https://doi.org/10.1115/1.4005303.
[20] H. Singh, Experimental study of distribution of energy during EDM process for utilization
in thermal models, Int. J. Heat Mass Transf. (2012).
https://doi.org/10.1016/j.ijheatmasstransfer.2012.05.004.
[21] S. Jithin, A. Raut, U. V. Bhandarkar, S.S. Joshi, FE Modeling for Single Spark in EDM
Considering Plasma Flushing Efficiency, in: Procedia Manuf., 2018.
https://doi.org/10.1016/j.promfg.2018.07.072.

25
[22] S. Assarzadeh, M. Ghoreishi, Prediction of root mean square surface roughness in low
discharge energy die-sinking EDM process considering the effects of successive
discharges and plasma flushing efficiency, J. Manuf. Process. (2017).
https://doi.org/10.1016/j.jmapro.2017.10.012.
[23] D.. . Montgomery, Introduction To Statical Quality Control, 2009.
https://doi.org/10.1002/1521-3773(20010316)40:6<9823::AID-ANIE9823>3.3.CO;2-C.
[24] A. Erden, Effect of materials on the mechanism of electric discharge machining (E.D.M.),
J. Eng. Mater. Technol. Trans. ASME. (1983). https://doi.org/10.1115/1.3225627.
[25] T. Ikai, I. Fujita, K. Hashiguchi, Heat Input Radius for Crater Formation in the Electric
Discharge Machining, IEEJ Trans. Ind. Appl. (1992).
https://doi.org/10.1541/ieejias.112.943.
[26] S.H. Yeo, W. Kurnia, P.C. Tan, Critical assessment and numerical comparison of electro-
thermal models in EDM, J. Mater. Process. Technol. (2008).
https://doi.org/10.1016/j.jmatprotec.2007.10.026.
[27] B. Xin, M. Gao, S. Li, B. Feng, Modeling of Interelectrode Gap in Electric Discharge
Machining and Minimum Variance Self-Tuning Control of Interelectrode Gap, Math.
Probl. Eng. 2020 (2020) 20. https://doi.org/10.1155/2020/5652197.
[28] A. Kojima, W. Natsu, M. Kunieda, Spectroscopic measurement of arc plasma diameter in
EDM, CIRP Ann. - Manuf. Technol. (2008). https://doi.org/10.1016/j.cirp.2008.03.097.
[29] W. Chang, Y. Chen, J. Zhang, B. Xu, M. Fang, Single pulse discharge channel expansion
laws of EDM, Jixie Gongcheng Xuebao/Journal Mech. Eng. (2016).

26
https://doi.org/10.3901/JME.2016.09.208.
[30] S.M. Son, H.S. Lim, A.S. Kumar, M. Rahman, Influences of pulsed power condition on
the machining properties in micro EDM, J. Mater. Process. Technol. (2007).
https://doi.org/10.1016/j.jmatprotec.2007.03.108.
[31] S.S. Mujumdar, D. Curreli, S.G. Kapoor, D. Ruzic, Model-based prediction of plasma
resistance, and discharge voltage and current waveforms in micro-electrodischarge
machining, J. Micro Nano-Manufacturing. (2016). https://doi.org/10.1115/1.4031773.

Supplementary Files
This is a list of supplementary les associated with this preprint. Click to download.
AbbeviationandSymbolsv2.docx
highlights.docx