a comparison of underwriting decision making … 7_1_2.pdf · a comparison of underwriting decision...
TRANSCRIPT

Advances in Management & Applied Economics, vol. 7, no. 1, 2017, 17-30
ISSN: 1792-7544 (print version), 1792-7552(online)
Scienpress Ltd, 2017
A Comparison of Underwriting Decision Making
Between Telematics-Enabled UBI and Traditional
Auto Insurance
Chiang Ku Fan1 and Wei-Yuan Wang
2
Abstract
Because of telematics-enabled UBI (usage-based insurance), real driving
information can be collected and provided to underwriters. It promises more
efficient pricing of risks, with widespread benefits expected to accrue to insurers,
consumers and society. From the perspective of auto insurance underwriters,
compare to the driving data collected by a traditional auto insurance application
form , the underwriting data collected from a telematics devices more effective or
not is a question and to answer. By employing prior literature reviewing and grey
relational analysis, this study found most of driving behavior data collected from
telematics devices is very helpful for auto insurance underwriting, some
traditional data collected by an application form is still necessary for underwriters
to make a well underwriting decision. The implication is, in order to improve the
effective of an underwriting decision making, insurance companies need to take
advantage of IoT(Internet of Things) tech to collect more helpful underwriting
data as well as adjust their underwriting policy accordingly.
JEL classification numbers: O32
Keywords: usage-based insurance, auto insurance, telematics, Underwriting
1 Introduction
Because of telematics-enabled UBI (usage-based insurance), real driving
1 Dept. of Risk Management and Insurance, Shih Chien University,Taiwan.
2 Dept. of Business Administration, Shih Chien University, Taiwan.
Article Info: Received: October 14, 2016. Revised: November 7, 2016.
Published online: January 5, 2017

18 Chiang Ku Fan and Wei-Yuan Wang
information can be collected and provided to underwriters. It therefore promises
more efficient pricing of risks, with widespread benefits expected to accrue to
insurers, consumers and society. As the population becomes more accepting of
technology and as the generation that has grown up surrounded by technology in
its everyday life ages, it is likely that the percentage of policyholders prepared to
adopt telematics-enabled UBI will increase dramatically (Karapiperis et al.,
2015).Telematics-enabled UBI, otherwise known as telematics-supported or
-based UBI, is rapidly becoming a global phenomenon.
The auto insurance market is Taiwan’s largest insurance market segment. The
premium income of automobile insurance from 2011 to 2015 accounted for
approximately 50% of total property and casualty premiums. Automobile
insurance claims were usually more than 60% of total property and casualty
claims (Marsh & McLennan Companies, 2014). It is said that property and
casualty insurance companies have suffered a deficit in their balance of payments
with respect to auto insurance. Thus, the auto insurance market in Taiwan is
fiercely competitive as insurers strive to attract more profitable, low-risk drivers.
In other words, stagnant growth in a competitive market makes the attraction,
retention and accurate rating of policyholders increasingly important. Any tools
that can help achieve these goals are immensely valuable.
Although the use of telematics has accelerated globally in recent years, one
important barrier for insurers attempting to adopt or expand a telematics-enabled
UBI program is the need to build predictive loss cost models that can identify
behaviors indicative of unsafe vehicle operation (Harbage, 2015).
From the perspective of auto insurance underwriters, compare to the driving
data collected by a traditional auto insurance application form , the data collected
from a telematics devices more effective or not is a question and to answer.
Because there has been little objective scientific research focused on
telematics-enabled UBI in Taiwan, insurers have limited information to judge if
the driving behaviors data collected from telematics devices can totally replace the
data collected by a traditional auto insurance application form or not. Therefore,
the purposes of this study are to explore:
1. Can the Telematics-enabled UBI totally replace the traditional auto
insurance?
2. Is the importance level of the underwriting data collected from
Telematics-enabled UBI higher than that collected by a traditional auto
insurance application form?
2 Literature Review
2.1 Factors That Affect Auto Insurance Rates
The first automobile liability insurance was sold in the U.S. 116 years ago, and
the same underwriting model has been used for decades. Rejda (2011) claimed
that the major rating factors for determining private passenger auto premiums are

A Comparison of Underwriting Decision Making Between … 19
territory, age, gender, marital status, use of the auto, driver education, number and
types of cars, individual driving record, and insurance score. In practice, there are
a number of key factors most insurance companies use to calculate how much
drivers will end up paying for their auto insurance. The key factors include what
drivers drive, coverage and deductibles, territory, driving record, insurance score,
age, gender, and marital status (State Farm, 2012).
Generally speaking, the traditional auto insurance assessing risk based on broad
demographic characteristics such as a driver’s age, gender, or credit
score(SIERRA WIRELESS, 2015; Karapiperis et al., 2015). Automobile
premiums were generally determined at the point of sale in the absence of true
causal data by using a variety of group-behavior-based demographic proxy factors
that affect loss costs (Reifel, et al., 2010). For this reason, insurers used detailed
and long-standing actuarial statistics both to identify and to quantify potential
risks.
2.2 A Fundamental Change
UBI has been in development since the1990s. Initially, driving-behavior data
were collected from telematics devices professionally installed in automobiles
either by a technician (for aftermarket devices) or in the factory. After a certain
period of monitoring the vehicle’s operation, the insured is provided with a
justified price that considers his or her driving behaviors as a part of the rating
algorithm. In other words, UBI represents a fundamental change in how
automobile insurance is underwritten: it moves away from proxy-based ratings
models and historical patterns to real-time driver behavior analysis (INSLY, 2015;
NAIC, 2015).
Driving-behavior data gathered through telematics programs introduces more
detailed information than conventional methodologies of assessing policyholder
and portfolio risk, and it has the potential to dramatically change the insurance
business. Insurers are often slow to modify legacy ways of doing business, as was
the case with credit-based insurance scoring, which was the last significant
disruption in underwriting.
Increasingly, observers of the auto insurance market are noting that telematics
will not be a passing fad. Instead, it will fundamentally and materially change how
auto insurance is underwritten. As insurers gather more data and begin to act on
insights from it, they will be able to move from a method of using corollary data
to slot drivers into various risk tiers to eventually being able to price insurance
based on actual driving-behavior data. Early adopters capable of innovating stand
to gain more than late entrants that risk losing customers as the use of telematics
data becomes an increasingly common means for insurers to evaluate policyholder
risk.
2.3 Rating Factors Collected From Telematics
The first UBI program began to surface in the U.S. approximately ten years ago,
when Progressive Insurance Company and General Motors Assurance Company

20 Chiang Ku Fan and Wei-Yuan Wang
(GMSC) began to offer mileage-linked discounts enabled by GPS technology.
Recent accelerations in technology have improved the effectiveness of telematics,
enabling insurers to capture not only how many miles people drive but also how
and when they drive (NAIC, 2015).
Telematics has shown the potential to turn the traditional model on its head. By
installing or embedding telematics into cars to transmit real-time driving data such
as driving habits and driving environments, insurers can measure and price
premiums more accurately (Reifel, et al, 2010).
In general, telematics devices measure numerous factors that are of interest to
underwriters (NAIC, 2015): miles driven; time of day; where the vehicle is driven;
rapid acceleration; hard braking; hard cornering; and air bag deployment.
However, according to the websites reviewed, America’s four largest auto
insurers—State Farm, Progressive, Geico and Farmers—use mileage as the
second-most-important factor (after driving record)in setting premiums (Cohen,
2015). This prompted the Consumer Federation of America to assert that insurance
companies were discriminating against the poor and senior citizens by not using
mileage as the most important factor (Cohen, 2015).
Similar to the study results of NAUC, Cohen (2015) claims that some insurance
companies use in-vehicle technology to track drivers and provide discounts only
based on actual behavior, including mileage, when people drive, speeding and
hard braking. A study by Boston-based insurance consultant Strategy Meets
Action (SMA) is in agreement, claiming that telematics devices can measure miles
driven; time of day; where the vehicle is driven (GPS); rapid acceleration; hard
braking; hard cornering; air bag deployment and other behaviors of interest to
underwriters. In other words, premiums set by UBI more closely reflect actual
driving behavior than premiums set by traditional pricing methods. Moreover,
Deloitte Consulting and Agnik Analytics provide insurers with UBI scoring
models. This scoring model captures risk events—i.e., acceleration, braking,
cornering, and fast lane changes—and enrich them with contextual data—the
weather, traffic information at any given moment, and so on, to see whether
conditions matched those reported by the driver or instead whether driver behavior
increased or decreased the risk of external conditions (Voelker, 2014).
2.4 The Differences between UBI and Traditional Insurance
Telematics-enabled UBI, which is a type of automobile insurance that puts
power into drivers’ hands by using telematics technology to track their driving
habits and determine how much they can save on their premiums (Allstate, 2015),
differs from traditional insurance, which attempts to differentiate and reward
"safe" drivers, giving them lower premiums and/or a no-claims bonus. However,
conventional differentiation is a reflection of history, not current behavioral
patterns (INSLY, 2015). By summarizing a driver’s strengths, weaknesses,
opportunities and threats (SWOT), the differences between telematics-based UBI
and traditional insurance can be easily understood (see Table 1).

A Comparison of Underwriting Decision Making Between … 21
Table 1: SWOT Analysis of Traditional and Telematics-enabled UBI
Source: PTOLEMUS- Global UBI Study, 2016. www.ptolemus.com
This study refers to the practice of the traditional auto insurance market and
experience of markets that have implemented telematics-enabled UBI and
conclude different kinds of data collected by Telematics-enabled UBI or
traditional auto insurance (view table 2).
Table 2: Data Collected from Telematics Device and Insurance Application Form Data Collected from Collected Data for Underwriting
1 Telematics Device Fast Lane Change
2 Miles Driven
3 Daily Number of Drives
4 Rapid Acceleration
5 Hard Braking
6 Hard Cornering
7 Air Bag Deployment
8 When of Usually Driving
9 Where the Vehicle Is Driven
10 The Weather
11 Traffic Information
12 Insurance Application Form Territory
13 Age
14 Gender
15 Marital Status
16 Use of the Auto
17 Driver Education
18 Number and Types of Cars
19 Individual driving Record
20 Insurance Score

22 Chiang Ku Fan and Wei-Yuan Wang
3 Methodology
This study’s purposes are to explore (1) if the data collected from
Telematics-enabled UBI can totally replace the data collected by traditional auto
insurance; (2) is the importance level of the underwriting data collected form
Telematics-enabled UBI higher than that collected by a traditional auto insurance
application form. To satisfy the purposes of this research, this study first reviews
prior studies to identify the underwriting data considered by telematics-based UBI
or traditional auto insurance. Then, this study employs the grey relational analysis
(GRA) to identify the weight of each considered underwriting data (figure 1). To
compare the weight of each underwriting data, this study identifies if the
importance level of the underwriting data collected form Telematics-enabled UBI
higher than that collected by a traditional auto insurance application form.
Figure 1. Research Procedure
The grey system method, as developed by Deng (1989), has been extensively
applied in various fields, including decision science. The GRA is calculated as
follows:
Let X0 be the referential series with k entities (or criteria) of X1, X2, …, Xi, …,
XN (or N measurement criteria). Then

A Comparison of Underwriting Decision Making Between … 23
0 0 0 0 0(1), (2), ..., ( ), ..., ( )X x x x j x k ,
1 1 1 1 1(1), (2), ..., ( ), ..., ( )X x x x j x k ,
(1), (2), ..., ( ), ..., ( )i i i i iX x x x j x k ,
(1), (2), ..., ( ), ..., ( )N N N N NX x x x j x k .
The grey relational coefficient between the compared series iX and the
referential series of 0X at the j-th entity is defined as
0
0
min maxγ ( )
( ) maxi
j
jj
, (1)
where 0 ( )j j denotes the absolute value of difference between X0 and Xi at
the j-th entity, that is
0 0( ) ( ) ( )j ij x j x j , and 0max max max ( )ji j
j ,
0min min min ( )ji j
j .
The grey relational grade (GRG) for a series of Xi can be expressed as
0 0
1
Γ γ ( )K
i j i
j
w j
, (2)
Where wj represents the weight of j-th entity. If the weight does not need to be
applied, take K
j
1 for averaging.
Before calculating the grey relation coefficients, the data series can be treated
based on the following three kinds of situation and the linearity of data
normalization to avoid distorting the normalized data. They are:
3.1 Upper-bound effectiveness measuring (i.e., larger-the-better)
*( ) min ( )
( )max ( ) min ( )
i ij
i
i ijj
x j x jx j
x j x j
, (3)
where max ( )ij
x j is the maximum value of entity j and min ( )jj
x j is the
minimum value of entity j.
3.2 Lower-bound effectiveness measuring (i.e., smaller-the-better)
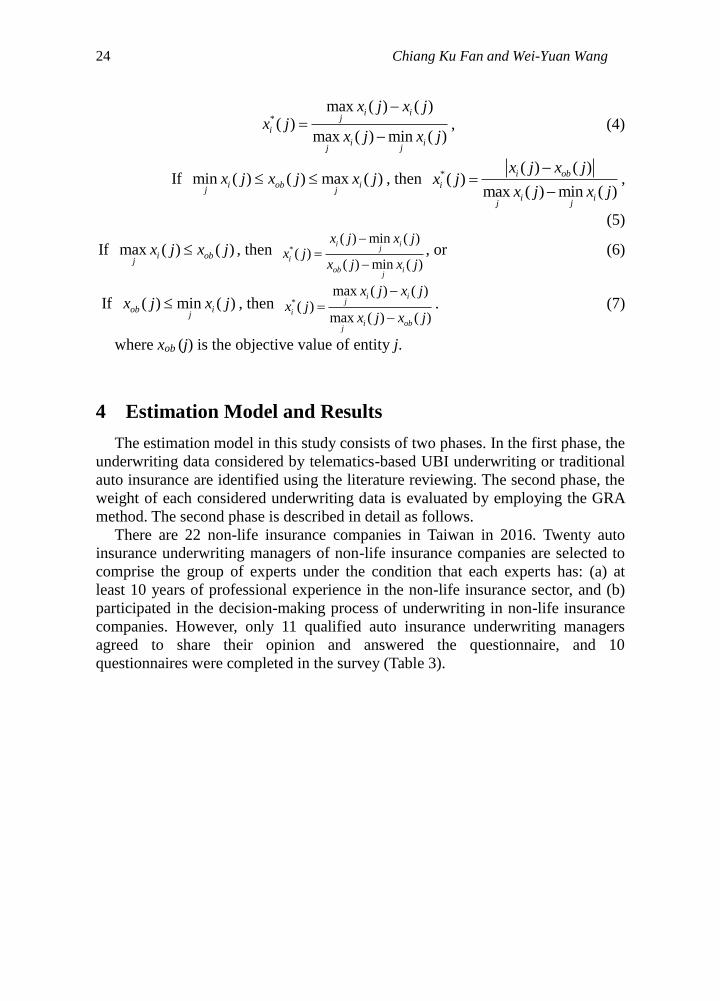
24 Chiang Ku Fan and Wei-Yuan Wang
*max ( ) ( )
( )max ( ) min ( )
i ij
i
i ijj
x j x jx j
x j x j
, (4)
If min ( ) ( ) max ( )i ob ij j
x j x j x j , then *( ) ( )
( )max ( ) min ( )
i ob
i
i ijj
x j x jx j
x j x j
,
(5)
If max ( ) ( )i obj
x j x j , then *( ) min ( )
( )( ) min ( )
i ij
i
ob ij
x j x jx j
x j x j
, or (6)
If ( ) min ( )ob ij
x j x j , then *max ( ) ( )
( )max ( ) ( )
i ij
i
i obj
x j x jx j
x j x j
. (7)
where xob (j) is the objective value of entity j.
4 Estimation Model and Results
The estimation model in this study consists of two phases. In the first phase, the
underwriting data considered by telematics-based UBI underwriting or traditional
auto insurance are identified using the literature reviewing. The second phase, the
weight of each considered underwriting data is evaluated by employing the GRA
method. The second phase is described in detail as follows.
There are 22 non-life insurance companies in Taiwan in 2016. Twenty auto
insurance underwriting managers of non-life insurance companies are selected to
comprise the group of experts under the condition that each experts has: (a) at
least 10 years of professional experience in the non-life insurance sector, and (b)
participated in the decision-making process of underwriting in non-life insurance
companies. However, only 11 qualified auto insurance underwriting managers
agreed to share their opinion and answered the questionnaire, and 10
questionnaires were completed in the survey (Table 3).

A Comparison of Underwriting Decision Making Between … 25
Table 3: Descriptive Statistics of Expert Attitude toward underwriting data
Underwriting Factors SA A UD D SD N Mean Std. Deviation
Fast Lane Change 5 5 0 0 0 10 4.5 0.52705
Miles Driven 3 7 0 0 0 10 4.3 0.48305
Daily Number of Drives 8 2 0 0 0 10 4.8 0.42164
Rapid Acceleration 9 1 0 0 0 10 4.9 0.31623
Hard Braking 6 4 0 0 0 10 4.6 0.51640
Hard Cornering 4 6 0 0 0 10 4.4 0.51640
Air Bag Deployment 0 0 3 7 0 10 2.3 0.48305
When of Usually Driving 7 3 0 0 0 10 4.7 0.48305
Where the Vehicle Is
Driven 0 0 9 1 0
10 2.9 0.31623
The Weather 3 5 2 0 0 10 4.1 0.73786
Traffic Information 0 0 8 2 0 10 2.8 0.42164
Territory 0 6 4 0 0 10 3.6 0.51640
Age 0 0 6 4 0 10 2.6 0.51640
Gender 0 4 6 0 0 10 3.4 0.51640
Marital Status 0 1 9 0 0 10 3.1 0.31623
Use of the Auto 2 5 3 0 0 10 3.9 0.73786
Driver Education 0 0 0 7 3 10 1.7 0.48305
Number and Types of Cars 0 0 2 7 1 10 2.1 0.56765
Individual driving Record 0 0 5 5 0 10 2.5 0.52705
Insurance Score 0 0 1 4 5 10 1.6 0.69921
Note: strongly agree (SA) = 5, agree (A) = 4, undecided (UD) = 3, disagree (D) = 2, and strongly
disagree (SD) = 1.
The numerical illustration follows the procedure previously discussed.
1. Sample 10 attitude tendency toward underwriting data are graded based upon
10 experts’ opinions (see Table 4).
Table 4: 10 Attitude Tendency toward underwriting data
EP
T1
EP
T2
EP
T3
EP
T4
EP
T5
EP
T6
EP
T7
EP
T8
EP
T9
EP
T10
Fast Lane Change 5 4 4 4 4 5 5 4 5 5
Miles Driven 4 4 4 4 4 4 5 4 5 5
Daily Number of Drives 5 4 5 5 5 5 5 4 5 5
Rapid Acceleration 5 5 5 5 5 5 5 5 5 4
Hard Braking 5 5 5 4 4 5 5 5 4 4
Hard Cornering 4 4 4 4 5 4 5 5 5 4
Air Bag Deployment 2 2 2 2 3 3 3 2 2 2
When of Usually Driving 5 5 5 4 4 5 5 4 5 5
Where the Vehicle Is Driven 3 3 3 3 3 3 2 3 3 3
The Weather 4 4 4 3 4 4 5 3 5 5
Traffic Information 3 3 3 3 3 3 3 2 3 3
Territory 3 4 4 4 3 4 3 3 4 4
Age 2 3 2 3 3 3 3 2 2 3
Gender 4 3 3 3 3 4 3 3 4 4
Marital Status 3 3 3 3 3 3 3 3 4 3
Use of the Auto 3 4 4 3 4 4 4 3 5 5

26 Chiang Ku Fan and Wei-Yuan Wang
Driver Education 2 1 1 2 2 1 2 2 2 2
Number and Types of Cars 2 2 2 2 1 2 3 2 2 3
Individual driving Record 3 2 2 3 3 2 3 2 2 3
Insurance Score 1 1 1 2 2 1 1 2 3 2
Note: EPT=Expert
2. According to literature reviewing, 20 underwriting data are important
equally. Moreover, the underwriting data are nominal-the-best response.
Therefore, the referential series can be X0 =
(5,5,5,5,5,5,5,5,5,5,5,5,5,5,5,5,5,5,5,5) and the underwriting data of
compared series are X1, X2, X3, X4, X5, X6, X7, X8 X9, X10, X11, X12, X13, X14,
X15, X16, X17, X18, X19, X20.
3. Data normalization are obtained by using Eq. (3). The results are tabulated in
Table 5.
Table 5: Summary of Data Normalization
EPT
1
EPT
2
EPT
3
EPT
4
EPT
5
EPT
6
EPT
7
EPT
8
EPT
9
EPT
10
Fast Lane Change 1.00 0.75 0.75 0.67 0.75 1.00 1.00 0.67 1.00 1.00
Miles Driven 0.75 0.75 0.75 0.67 0.75 0.75 1.00 0.67 1.00 1.00
Daily Number of Drives 1.00 0.75 1.00 1.00 1.00 1.00 1.00 0.67 1.00 1.00
Rapid Acceleration 1.00 1.00 1.00 1.00 1.00 1.00 1.00 1.00 1.00 0.67
Hard Braking 1.00 1.00 1.00 0.67 0.75 1.00 1.00 1.00 0.67 0.67
Hard Cornering 0.75 0.75 0.75 0.67 1.00 0.75 1.00 1.00 1.00 0.67
Air Bag Deployment 0.25 0.25 0.25 0.00 0.50 0.50 0.50 0.00 0.00 0.00
When of Usually Driving 1.00 1.00 1.00 0.67 0.75 1.00 1.00 0.67 1.00 1.00
Where the Vehicle Is Driven 0.50 0.50 0.50 0.33 1.00 0.50 0.25 0.33 0.33 0.33
The Weather .075 0.75 0.75 0.33 0.75 0.75 1.00 0.33 1.00 1.00
Traffic Information 0.50 0.50 0.50 0.33 0.50 0.50 0.50 0.00 0.33 0.33
Territory 0.50 0.75 0.75 0.67 0.50 0.75 0.50 0.33 0.67 0.67
Age 0.25 0.50 0.25 0.33 0.50 0.50 0.50 0.00 0.00 0.33
Gender 0.75 0.50 0.50 0.33 0.50 0.75 0.50 0.33 0.67 0.67
Marital Status 0.50 0.50 0.50 0.33 0.50 0.50 0.50 0.33 0.67 0.33
Use of the Auto 0.50 0.75 0.75 0.33 0.75 0.75 0.75 0.33 1.00 1.00
Driver Education 0.25 0.00 0.00 0.00 0.25 0.00 0.25 0.00 0.00 0.00
Number and Types of Cars 0.25 0.25 0.25 0.00 0.00 0.25 0.50 0.00 0.00 0.33
Individual driving Record 0.50 0.25 0.25 0.33 0.50 0.25 0.50 0.00 0.00 0.33
Insurance Score 0.00 0.00 0.00 0.00 0.25 0.00 0.00 0.00 0.33 0.00
Compute Δ0i (j). The results are tabulated in Table 6.

A Comparison of Underwriting Decision Making Between … 27
Table 6: The result ofΔ0i (j)
EPT1 EPT2 EPT3 EPT4 EPT5 EPT6 EPT7 EPT8 EPT9 EPT10
Fast Lane Change Δ 01= 0.00 1.00 1.00 1.00 1.00 0.00 0.00 1.00 0.00 0.00
Miles Driven Δ 02= 1.00 1.00 1.00 1.00 1.00 1.00 0.00 1.00 0.00 0.00
Daily Number of Drives Δ 03= 0.00 1.00 0.00 0.00 0.00 0.00 0.00 1.00 0.00 0.00
Rapid Acceleration Δ 04= 0.00 0.00 0.00 0.00 0.00 0.00 0.00 0.00 0.00 1.00
Hard Braking Δ 05= 0.00 0.00 0.00 1.00 1.00 0.00 0.00 0.00 1.00 1.00
Hard Cornering Δ 06= 1.00 1.00 1.00 1.00 0.00 1.00 0.00 0.00 0.00 1.00
Air Bag Deployment Δ 07= 3.00 3.00 3.00 3.00 2.00 2.00 2.00 3.00 3.00 3.00
When of Usually Driving Δ 08= 0.00 0.00 0.00 1.00 1.00 0.00 0.00 1.00 0.00 0.00
Where the Vehicle Is Driven Δ 09= 2.00 2.00 2.00 2.00 2.00 2.00 3.00 2.00 2.00 2.00
The Weather Δ 010= 1.00 1.00 1.00 2.00 1.00 1.00 0.00 2.00 0.00 0.00
Traffic Information Δ 011= 3.00 3.00 3.00 3.00 3.00 3.00 3.00 2.00 3.00 3.00
Territory Δ 012= 3.00 3.00 3.00 3.00 2.00 4.00 3.00 2.00 4.00 4.00
Age Δ 013= 1.00 2.00 1.00 2.00 2.00 2.00 3.00 1.00 2.00 3.00
Gender Δ 014= 4.00 2.00 3.00 3.00 3.00 4.00 3.00 2.00 4.00 4.00
Marital Status Δ 015= 3.00 3.00 3.00 3.00 3.00 3.00 3.00 3.00 4.00 2.00
Use of the Auto Δ 016= 3.00 4.00 4.00 2.00 3.00 4.00 4.00 3.00 4.00 4.00
Driver Education Δ 017= 1.00 0.00 0.00 1.00 2.00 0.00 2.00 2.00 2.00 1.00
Number and Types of Cars Δ 018= 1.00 1.00 1.00 1.00 1.00 0.00 1.00 1.00 1.00 0.00
Individual driving Record Δ 019= 3.00 2.00 2.00 2.00 2.00 2.00 3.00 1.00 2.00 3.00
Insurance Score Δ 020= 1.00 1.00 1.00 0.00 0.00 1.00 2.00 0.00 1.00 0.00
4. Compute the relational coefficient, γ0i (j) of compared series by using Eq. (1)
and the results are tabulated in Table 7.
Table 7. The result of Relational Coefficient γ0i (j)
EPT1 EPT2 EPT3 EPT4 EPT5 EPT6 EPT7 EPT8 EPT9 EPT10
Fast Lane Change γ01= 1.00 0.67 0.67 0.67 0.67 1.00 1.00 0.67 1.00 1.00
Miles Driven γ02= 0.67 0.67 0.67 0.67 0.67 0.67 1.00 0.67 1.00 1.00
Daily Number of Drives γ03= 1.00 0.67 1.00 1.00 1.00 1.00 1.00 0.67 1.00 1.00
Rapid Acceleration γ04= 1.00 1.00 1.00 1.00 1.00 1.00 1.00 1.00 1.00 0.67
Hard Braking γ05= 1.00 1.00 1.00 0.67 0.67 1.00 1.00 1.00 0.67 0.67
Hard Cornering γ06= 0.67 0.67 0.67 0.67 1.00 0.67 1.00 1.00 1.00 0.67
Air Bag Deployment γ07= 0.40 0.40 0.40 0.40 0.50 0.50 0.50 0.40 0.40 0.40
When of Usually Driving γ08= 1.00 1.00 1.00 0.67 0.67 1.00 1.00 0.67 1.00 1.00
Where the Vehicle Is Driven γ09= 0.50 0.50 0.50 0.50 0.50 0.50 0.40 0.50 0.50 0.50
The Weather γ010= 0.67 0.67 0.67 0.50 0.67 0.67 1.00 0.50 1.00 1.00
Traffic Information γ011= 0.40 0.40 0.40 0.40 0.40 0.40 0.40 0.50 0.40 0.40
Territory γ012= 0.40 0.40 0.40 0.40 0.50 0.33 0.40 0.50 0.33 0.33
Age γ013= 0.67 0.50 0.67 0.50 0.50 0.50 0.40 0.67 0.50 0.40
Gender γ014= 0.33 0.50 0.40 0.40 0.40 0.33 0.40 0.50 0.33 0.33
Marital Status γ015= 0.40 0.40 0.40 0.40 0.40 0.40 0.40 0.40 0.33 0.50
Use of the Auto γ016= 0.40 0.33 0.33 0.50 0.40 0.33 0.33 0.40 0.33 0.33
Driver Education γ017= 0.67 1.00 1.00 0.67 0.50 1.00 0.50 0.50 0.50 0.67

28 Chiang Ku Fan and Wei-Yuan Wang
Number and Types of Cars γ018= 0.67 0.67 0.67 0.67 0.67 1.00 0.67 0.67 0.67 1.00
Individual driving Record γ019= 0.40 0.50 0.50 0.50 0.50 0.50 0.40 0.67 0.50 0.40
Insurance Score γ020= 0.67 0.67 0.67 1.00 1.00 0.67 0.50 1.00 0.67 1.00
5. Compute the related grade, Γ0i, by using Eq. (2) to determine the attitude
tendency grade. The result reported in Table 8
Table 8 Summary of the GRG Γ0i. NO. Underwriting Data Γ0i Rank
1 Fast Lane Change 0.4167 5
2 Miles Driven 0.3833 8
3 Daily Number of Drives 0.4833 2
4 Rapid Acceleration 0.4833 1
5 Hard Braking 0.4337 4
6 Hard Cornering 0.4000 6
7 Air Bag Deployment 0.2150 15
8 When of Usually Driving 0.4500 3
9 Where the Vehicle Is Driven 0.2450 13
10 The Weather 0.3667 9
11 Traffic Information 0.2050 16
12 Territory 0.2000 18
13 Age 0.2650 12
14 Gender 0.1967 19
15 Marital Status 0.2017 17
16 Use of the Auto 0.1850 20
17 Driver Education 0.3500 11
18 Number and Types of Cars 0.3667 10
19 Individual driving Record 0.2433 14
20 Insurance Score 0.3917 7
From Table 8 this study decided the grey relation analysis was following:
Γ04(0.4833)>Γ03(0.4833)>Γ08(0.4500)>Γ05(0.4337)>Γ01(0.4167)>Γ06(0.4000)>Γ
020(0.4000)>Γ02(0.3833)>Γ010(0.3667)>Γ018(0.3667)>Γ017(0.3500)>Γ013(0.2650)
>Γ09(0.2450)>Γ019(0.2433)>Γ07(0.2150)>Γ011(0.2050)>Γ015(0.2017)>Γ012(0.200
0)>Γ014(0.1967)>Γ016(0.1850).
In other words, after conducting the GRA, this research showed the experts’
attitude tendency toward the 20 underwriting data from the most important to the
least important as followings:(1) Rapid Acceleration, (2) Rapid Acceleration, (3)
When of Usually Driving, (4) Hard Braking, (5) Fast Lane Change, (6) Hard
Cornering, (7) Insurance Score, (8) Miles Driven, (9) The Weather, (10) Number
and Types of Cars, (11) Driver Education, (12) Age, (13) Where the Vehicle Is
Driven, (14) Individual driving Record, (15) Air Bag Deployment, (16) Traffic
Information, (17) Marital Status, (18) Territory, (19) Gender, and (20) Use of the
Auto.

A Comparison of Underwriting Decision Making Between … 29
5 Conclusion
Based on the research results, this study arrives at the following conclusions
and makes the following suggestions:
1. There are 20 kinds of collected underwriting data totally put in the grey
relation analysis. Eleven kinds of underwriting data collected from
telematics devices. The rest underwriting data collected by a traditional auto
insurance application form. According to the results of the grey relation
analysis, not all the underwriting data collected from telematics devices are
before the 10th
rank. In other words, there are two kinds of underwriting data,
such as Insurance Score as well as Number and Types of Cars, are the 7th
rank.
General speaking, from a perspective of an auto insurance underwriter,
although most of driving behavior data collected from telematics devices is
very helpful for auto insurance underwriting, some traditional data collected
by an application form is still necessary for underwriters to make a well
underwriting decision.
2. The important level of each underwriting data, no matter where they are
collected, are different. The most six important underwriting data, including
Rapid Acceleration, Daily Number of Driven, When of usually Driving,
Hard Braking, Fast Lane Change, and Hard Corning, are collected from
telematics devices. The least three important data, including Use of the Auto,
Gender, and Territory, are collected by a traditional auto insurance
application form. The implication is, in order to improve the effective of an
underwriting decision making, insurance companies in Taiwan need to take
advantage of Iot (Internet of Things) tech to collect more helpful
underwriting data as well as adjust their underwriting policy accordingly.
References
[1] D. Karapiperis, B. Birnbaum, A. Brandenburg, R. Harbage, A. Obersteadt,
“Usage-based Insurance and Vehicle Telematics Insurance Market and
Regulatory Implications,” The Center for Insurance Policy and Research,
2015.
https://zh.scribd.com/doc/310430063/Cipr-Study-150324-Usage-Based-Insur
ance-and-Vehicle-Telematics-Study-Series
[2] Marsh & McLennan Companies, Asia Insurance Market Report 2014,
Insurance Market Report, Marsh & McLennan Companies, 2015.
[3] R. Harbage, “Telematics UBI Modeling and Analytics,” The Center for
Insurance Policy and Research, March, Cipr 150324, 2015, p.p. 15-17.
[4] G.E. Rejda, Principles of Risk Management and Insurance, Pearson
Education, Inc. Prentice Hall: New Jersey, 2011.

30 Chiang Ku Fan and Wei-Yuan Wang
[5] State Farm, Seven Factors Affecting Your Car Insurance Premiums, Auto
Learning Center, 2012.
https://learningcenter.statefarm.com/auto/7-factors-affecting-your-auto-insur
ance-premiums/
[6] SIERRA WIRELESS, Capturing the Usage-Based Insurance Opportunity,
2015 .
http://www.gsma.com/membership/wp-content/uploads/2015/10/Whitepaper-
UBI_FINAL_3.pdf.
[7] J. Reifel, M. Hales, G. Ku, S. Lala, Telematics: The Game changer-
Reinventing Auto Insurance, A. T. Kearney, Inc: Chicago, Illiois, 2010.
[8] INSLY, Innovation Key to Ideal Usage Based Insurance Solutions, 2015.
https://www.insly.com/en/blog/innovation-key-to-ideal-usage-based-insuranc
e-solutions
[9] NAIC, “Usage-Based Insurance and Telematics,” The Center for Insurance
Policy and Research, 2015.
http://www.naic.org/cipr_topics/topic_ysage_based_insurnce.htm
[10] A. Cohen, “Mileage Unfairly Excluded From Car Insurance Quotes,”
Consumer Group Says, Vehicle Insurance, May 21, 2015.
http://www.Nerdwallet.com/blog/insurance/2015/05/21/insurers-excluding-m
ileage-from-car-insurance-quotes/
[11] M. Voelker, “Telematics: Carriers expanding tools beyond usage- based
insurance,” National Underwriter Property & Casualty, August 2014.
http://www.propertycasualty360.com/2014/08/12/telematics-carriers-expandi
ng-tools-beyond-usage-b
[12] Allstate, “Canadians Skeptical About the Benefits of Usage-Based
Insurance,” Allstate Insurance Company of Canada, 2015.
http://www.allstate.ca/webpages/about/newsroom-auto.aspx?article=usage-ba
sed
[13] J. L. Deng, Introduction to grey system. Journal of Grey System, 1(1): 1-24,
1989.