a comparative study on the batch performance of … · membrane filtration (ndiaye et al., 2005),...
TRANSCRIPT

INTERNATIONAL JOURNAL OF ENVIRONMENTAL SCIENCES Volume 2, No 3, 2012
© Copyright 2010 All rights reserved Integrated Publishing Association
Research article ISSN 0976 – 4402
Received on December 2011 Published on February 2012 1643
A comparative study on the batch performance of fluoride adsorption by
activated silica gel and activated rice husk ash Naba Kr Mondal
1, Ria Bhaumik
2, Arnab Banerjee
2, Jayanta Kr Datta
2, Tanmoy Baur
2
1- Astt. Professor, Department of Environmental Science, The University of Burdwan
2- Department of Environmental Science, The University of Burdwan,
doi:10.6088/ijes.00202030049
ABSTRACT
A comparative study was done for removal of fluoride by activated silica gel (ASiG) and
activated rice husk ash (ARHA) through batch techniques. The fluoride removal performance
of both adsorbents such as ASiG and ARHA was evaluated as a function of the initial
concentration, adsorbent dose, contact time and pH. The adsorbent dose characterized as
having high selectivity for fluoride and larger adsorption capacity. Characterization of ASiG
and ARHA before and after fluoride adsorption was studied by SEM and FTIR study was
done to get a better insight into the mechanism of adsorption. The rate of adsorption was
rapid and followed pseudo-second-order kinetics for both adsorbents. The system followed
the Langmuir isotherm model for both ASiG and ARHA with adsorption capacity 0.244 mg
g-1
and 0.402 mg g-1
respectively.
Keywords: ASiG, ARHA, SEM, isotherm, kinetics.
1. Introduction
High concentrations of fluoride occurring naturally in ground water have caused widespread
fluorosis (both dental and skeletal) throughout many parts of the world. The excessive
fluoride intake leads to the loss of calcium from the tooth matrix aggravating cavity
formation throughout life (Sujana and Anand, 2010). Severe chronic and cumulative over
expose can cause the incurable cripping of skeletal fluorosis (UNICEF 2004). The dental or
skeletal fluorosis is irreversible and no treatment exists (Sujana and Anand 2010). The
removal of fluoride from water is one of the most important issues due to the effect on human
health and environment (Ma et al., 2007). The optimum fluoride level in drinking water for
general good health set by WHO (1993) is considered to be less than 1.5 mg/L). But many
epidemiological studies have shown possible adverse effects of the longterm ingestion of
fluoride, even in the places where people are consuming water with fluoride content of 1.5
mg/L (Sujana and Anand, 2010). Membrane filtration (Ndiaye et al., 2005), precipitation
(Parthasarathy et al., 1986), nanofiltration (Simons et al., 1993), ion-exchange (Ruixia et al.,
2002), electrocoagualation flotation (Hu et al., 2005) and adsorption (Mohapatro et al., 2004)
have been used for fluoride removal. Among these methods, adsorption techniques is the
most effective and widely used methods, because its universal has a low maintenance cost,
and is applicable for the removal of fluoride even at low concentration (Chen et al., 2010). In
recent years, to find out cost effective alternative for removing high fluoride content from
waters many geomaterials have been tested (Wang and Reardon 2001; Mohapatro et al.,
2004; Hiemstra et al., 2000; and Sujana et al., 2009). In the present study we tried to explore
the fluoride removal efficiency of activated rice husk ash (ARHA) and its potentiality
compare study with activated silica gel (ASiG).
A comparative study on the batch performance of fluoride adsorption by activated silica gel and activated rice
husk ash
Naba Kr Mondal et al., International Journal of Environmental Sciences Volume 2 No.3, 2012
1644
Nomenclature
Cae equilibrium fluoride concentration on the adsorbent (mgL−1
)
Ce equilibrium fluoride concentration in solution (mgL−1
)
Ci Initial fluoride concentration (mgL−1
)
Ct Equilibrium fluoride concentration at time t
Da particle mean diameter (cm)
d density of the adsorbent (g/cm)
e porosity of the adsorbent
Es mean free energy (kJ mol−1
)
h initial adsorption rate (mgg−1
min−1
)
Kf Freundlich constants relating multilayer adsorption capacity
(mgg−1
) (Lg−1
)1/n
b Langmuir constant (Lmg−1
)
RL Dimensionless equilibrium parameter
KT Tempkin constant related to equilibrium binding constant
(Lmg-1
)
B1 Tempkin constant related to the heat of adsorption
k rate constant
Kid intraparticle diffusion rate constant (mg g−1
min−0.5
)
K1 pseudo-first-order rate constant (min−1
)
K2 pseudo-second-order rate constant (g mg−1
min−1
)
m weight of adsorbent (g)
n Freundlich adsorption isotherm constant relating adsorption
intensity
qe equilibrium dye concentration on adsorbent (mgg−1
)
Q0 maximum adsorption capacity (mgg−1
)
qt amount of dye adsorbed at time t (mgg−1
)
R universal gas constant (8.314 J mol−1
K−1
)
R2
correlation coefficient
∆S° entropy of reaction (J mol−1
K−1
)
Ss outer surface of adsorbent per unit volume of particle free
solution (cm-1
)
T temperature (K)
t time
V volume of the solution (L)
Greek alphabets
K D–R isotherm constant (mmol2J
−2)
polanyi potential (J mmol−1
) = RT ln(1 + 1/Ce)
βL mass transfer coefficient (l/g)
2. Materials and methods
2.1 Materials
The black-gray rice husk ash was collected from the nearest rice mill. Then it washed with
double distilled water and dried at 1000C for 8 hours in an electric oven. After that it was
crushed ground and sieved to obtain 250 µm size and stored it in a desicator with plastic

A comparative study on the batch performance of fluoride adsorption by activated silica gel and activated rice
husk ash
Naba Kr Mondal et al., International Journal of Environmental Sciences Volume 2 No.3, 2012
1645
container for further use. Another adsorbent activated silica gel (ASiG) supplied by local
authorized dealer (MERCK Pvt. Ltd.). In this study activated silica gel (ASiG) is a synthetic
adsorbent, hence the characterizations of ASiG are not provided. The physical characteristics
and composition of rice husk ash on dry basis are given in Table 1.
Table 1: Composition of Rice Husk ash on dry basis
Physical properties/Chemical composition Values
Average particle size 150.47 µm
Bulk density 104.9 kg/m3
Heating value 9.86 MJ/kg
BET surface area 34.44 m2/g
Average pore diameter by BET 42.603 0A
pHZPC 6.0
Silica(SiO2) 80-90%
Alumina 1-2.5 %
Ferric oxide 0.5 %
Titanium dioxide Nil
Calcium oxide 1-2 %
Magnesium oxide 0.5-2.0 %
Sodium 0.2-0.5 %
Potash 0.2 %
Loss on ignition 10-20 %
2.2 Instrument
The SEM image of rice husk ash was taken by SEM analyzer (HITACHI, S-530, Scanning
Electron Microscope and ELKO Engineering, B.U., BURDWAN). For FTIR spectroscopic
studies (PERKIN-ELMER, FTIR, Model-RX1 Spectrometer, USA) spectrometer was used.
The pH of the solutions at the beginning and end of the experiments were measured and the
average values are reported. All the pH measurements were carried out by digital pH meter
(Model no. Systronic-335). Analysis of fluoride was carried out by following SPANDS
methods (APHA AWWA 1998 and Deshmukh et al., 2009) and Systronic UV-visible
spectrophotometer ((Systronics, Vis double beam Spectro 1203) was used for colometric
analysis.
2.3 Chemical used
Stock solution of fluoride was prepared by dissolving 0.221g sodium fluoride in 1L double
distilled water. The measuring cylinder, volumetric flask and conical flask used were of PVC.
The sodium fluoride used was of analytical grade (MERCK, Germany). The required
concentration of fluoride solution was prepared by serial dilution of 1000 mg/L fluoride
solution.
2.4 Batch equilibrium adsorption experiments
Data for sorption isotherm were generated by contacting 0.5g ARHA and 2.0g of ASiG with
fluoride containing aqueous solution at pH 2.0. Samples of 100 ml fluoride solution at
concentration range 1.5 to 15 mg/L were pipette into 100 ml plastic container and container
were placed in a magnetic stirrer at fixed temperature 300 C. The shaking speed was set at
100 rpm. At the end of the experiment, samples were withdrawn from test container and filter

A comparative study on the batch performance of fluoride adsorption by activated silica gel and activated rice
husk ash
Naba Kr Mondal et al., International Journal of Environmental Sciences Volume 2 No.3, 2012
1646
through 0.22 µm vacuum dried filter and residual fluoride concentration was measured by
SPANDS method. The equilibrium sorption capacity was determined from the equation
qe = V(C0-Ce) / m (1)
2.5 Effect of equilibrium pH
Experiments were carried out by varying initial solution pH values within the range of 2-10,
adjust with 0.1 (M) NaOH or 0.1 (M) HCl. Accordingly, adsorption was done by adding
different amount of adsorbent.
3. Results and discussion
3.1 Effect of pH
The effect of pH on the adsorption of fluoride by using ASiG and ARHA is shown in the
Table 2 and Figure 1. The results show that adsorption was maximum for both ASiG and
ARHA at pH 2.0 and the removal was also not favour at pH above 2.0. This can be attributed
to the distribution of fluoride and HF which are controlled by pH of the aqueous solution (Tor
et al., 2009). As can be calculated from equation (1) (Calace et al., 2002). F- ion is dominated
species when pH of the solution is higher than pKa (3.16) of HF (Tor et al., 2009).
Table 2: Effect of pH on the adsorption of fluoride by ARHA and ASiG (initial fluoride
concentration 5.0 mg/L; adsorbent 0.5g (ARHA) and 2.0 g (ASiG); contact time 60 minutes;
volume of the solution 100 ml; agitation speed 250 rpm and temperature 303K)
ARHA ASiG
pH % of removal qe pH % of
removal
qe
2 62.29 0.613 2 88.88 0.226
4 57.56 0.595 4 79.59 0.199
6 58.48 0.584 6 75.22 0.188
8 55.94 0.575 8 74.48 0.186
10 55.76 0.557 10 74.48 0.186
2 4 6 8 1 0
5 5
6 0
6 5
7 0
7 5
8 0
8 5
9 0
% o
f ad
sorp
tion
pH
A R H A
A S iG
Figure 1: Effect of pH on the adsorption of fluoride at an adsorbent dose 0.5 g/100ml; initial
concentration 5.0 mg/L; contact time 60 minutes; temperature 303K
It is also seen in Table 2 when pH of the solution exceeded 2.0 there is steady decrease of
adsorption. This may be explained by considering the pH ZPC for the activated rice husk
ash(ARHA). The surface charge of the ARHA is assessed by the zero point charge (pH ZPC =
6.0). At pH< p
H ZPC, the surface charge is positive, at pH = p
H ZPC, the surface is neutral and at
pH
> pH ZPC, the surface charge is negative. As fluoride is negative charge, so it preferentially

A comparative study on the batch performance of fluoride adsorption by activated silica gel and activated rice
husk ash
Naba Kr Mondal et al., International Journal of Environmental Sciences Volume 2 No.3, 2012
1647
attacks the adsorbent surface when the surface is positive in charge. At a pH, below pH ZPC,
more of the surface sites are positively changed and F- will be adsorbed to a greater extent
due to the attractive force between F- ions and positive change of rice husk ash. At pH 2.0,
the specific adsorption of fluoride on ARHA and ASiG (Figure 1) is due to electrostatic
interaction between positively charged adsorbent surface and negatively charged fluoride ions
and can be modeled as follows (Cengeloglu et al., 2002; Tor, 2006).
Ξ MOH + H+ ↔ MOH2
+ (2)
Ξ MOH2+
+ F- ↔ MF + H2O (3)
Overall reaction can be written as
Ξ MOH + H+
+ F- ↔ MF + H2O (4)
Where M represents the activated rice husk ash (ARHA) or activated silica gel (ASiG).
3.2 Effect of adsorbent dosage
The effect of the dosage of adsorbent on the adsorption of fluoride with initial concentration
5 mg/L was studied and the results shown in Figure 2. It can be seen that the percentage of
removal increased with increasing dosage of adsorbent. The largest percentage removal was
exhibited at 2.4g and 8.0g for ARHA and ASiG respectively. In Table 3, it can be seen that
the adsorption loading of fluoride decreases with increasing dosage of adsorbent. The
influence of dosage of adsorbent is mainly related to its surface area (Lv et al., 2006).
0.0 0.5 1.0 1.5 2.0 2.5
55
60
65
70
75
% o
f ad
sorp
tion
Adsorbent dose (g/100ml)
ARHA
0 2 4 6 8 10
50
60
70
80
90
100
% o
f A
dso
rpit
on
Adsorbent dose (gm/100ml)
ASiG
Figure 2: Effect of adsorbent dose (g/100ml) on the adsorption of fluoride at pH 2.0; initial
concentration 5.0 mg/L; contact time 60 minutes; temperature 303K
Table 3: Effect of adsorbent dosage (g/100ml) on the adsorption of fluoride by ARHA and
ASiG (initial fluoride concentration 5.0 mg/L; pH 2.0;contact time 60 minutes; volume of the
solution 100 ml; agitation speed 250 rpm and temperature 303K)
ARHA ASiG
Adsorbent
dosage
(g/100ml)
% of removal qe Adsorbent
dosage
(g/100ml)
% of
removal
qe
0.2 55.74 1.393 1.0 53.91 0.265
0.5 62.29 0.623 2.0 88.88 0.222
0.8 67.56 0.422 4.0 94.31 0.118
1.2 70.12 0.292 6.0 93.6 0.078
A comparative study on the batch performance of fluoride adsorption by activated silica gel and activated rice
husk ash
Naba Kr Mondal et al., International Journal of Environmental Sciences Volume 2 No.3, 2012
1648
1.6 70.30 0.219 8.0 93.1 0.582
2.0 71.94 0.179 10.0 93.1 0.465
2.4 73.94 0.154
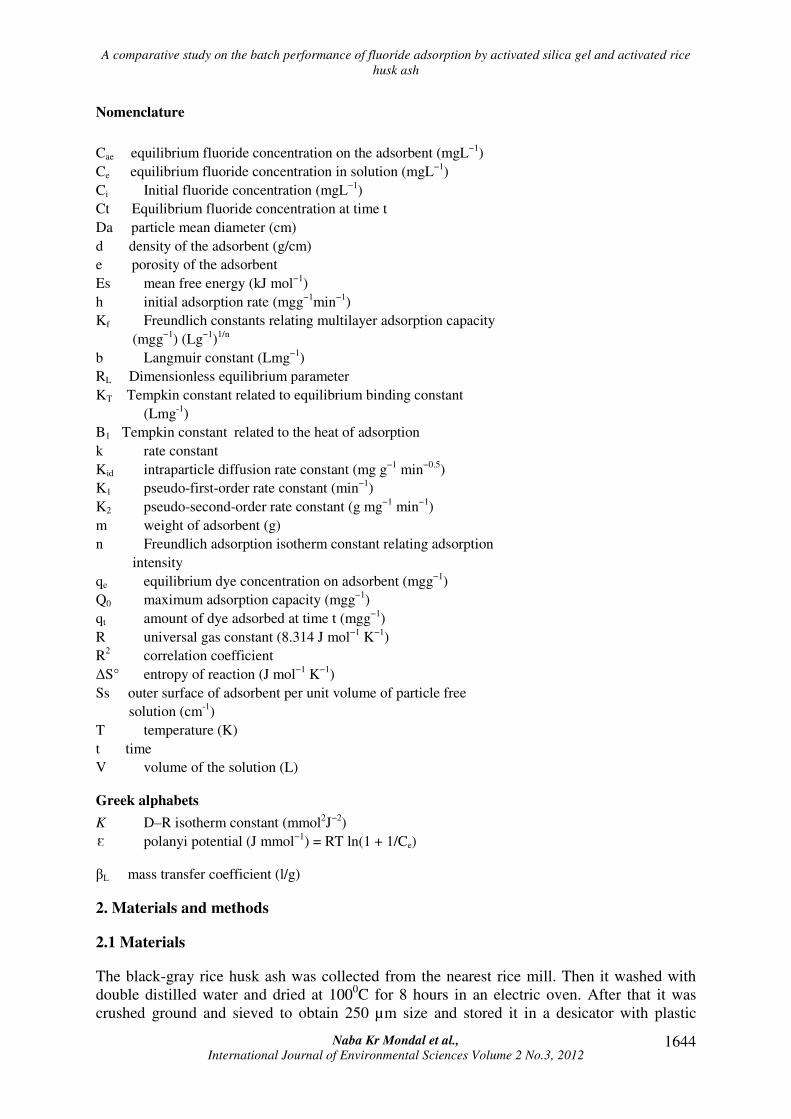
3.3 Effect of contact time and adsorption kinetics
The removal of fluoride as a function of contact time is shown in Figure 3. It was observed
that with fixed amount of adsorbent (both ARHA and ASiG) the removal of fluoride
increased with time and then attained equilibrium after 100 min. After reaching maximum
point of removal the adsorbent reached in saturated condition (see Figure 3). This
experimental adsorption data was analyzed by application of the pseudo-first-order and
pseudo-second-order kinetic models.
2 0 4 0 6 0 8 0 1 0 0 1 2 0
5 0
5 5
6 0
6 5
7 0
7 5
8 0
8 5
9 0
9 5
1 0 0
% o
f ad
sorp
iton
C o n t a c t t i m e ( m i n u t e )
A R H A
A S i G
Figure 3: Effect of contact time (minute) on the adsorption of fluoride at an adsorbent dose
2.4 g/100ml (ARHA) and 4.0 g/100ml (ASiG); pH 2.0; initial concentration 5.0 mg/L;
temperature 303K
Table 4: Effect of contact time (minute) on the adsorption of fluoride by ARHA and ASiG
(initial fluoride concentration 5.0 mg/L; pH 2.0; adsorbent dose 2.4 g/100ml (ARHA) and 4.0
g/100ml (ASiG); volume of the solution 100 ml; agitation speed 250 rpm and temperature
303K)
ARHA ASiG
Contact time
(min)
% of removal qe Contact time
(min)
% of
removal
qe
20 59.94 0.125 20 51.54 0.064
40 60.84 0.127 40 61.20 0.076
60 73.94 0.154 60 94.31 0.117
80 78.48 0.163 890 95.82 0.119
100 88.30 0.184 100 96.7 0.121
120 88.30 0.184 120 96.7 0.121
3.3.1 Pseudo first-order equation
The sorption kinetics may be described by a pseudo first-order equation. The linearized form
of pseudo-first-order rate equation is given as (Lagergren and Svenska, 1898).
log (qe − qt ) = log(qe) − (K1 / 2.303) t (5)
From the studied initial concentrations, the rate constant (K1) and theoretical equilibrium
sorption capacities (qe), calculated from the slope and intercept of the linear plots of the
A comparative study on the batch performance of fluoride adsorption by activated silica gel and activated rice
husk ash
Naba Kr Mondal et al., International Journal of Environmental Sciences Volume 2 No.3, 2012
1649
pseudo-first-order kinetic model are given in table 5. The coefficients of determination (R2)
for the linear plots are between 0.333 to 0.5672 (Table 5). In addition, qe (calculated) and qe
(experimental) values are not in agreement with each other. Therefore, it could be suggested
that the adsorption of fluoride by ARHA and ASiG was not a first-order reaction.
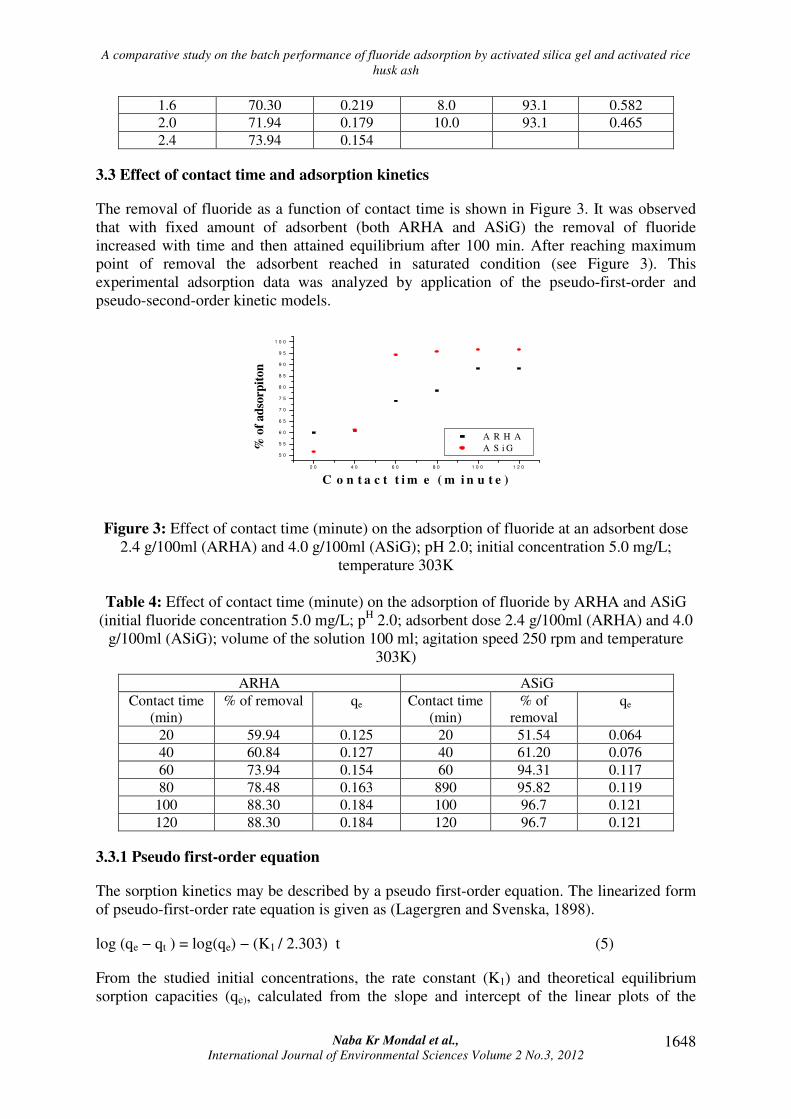
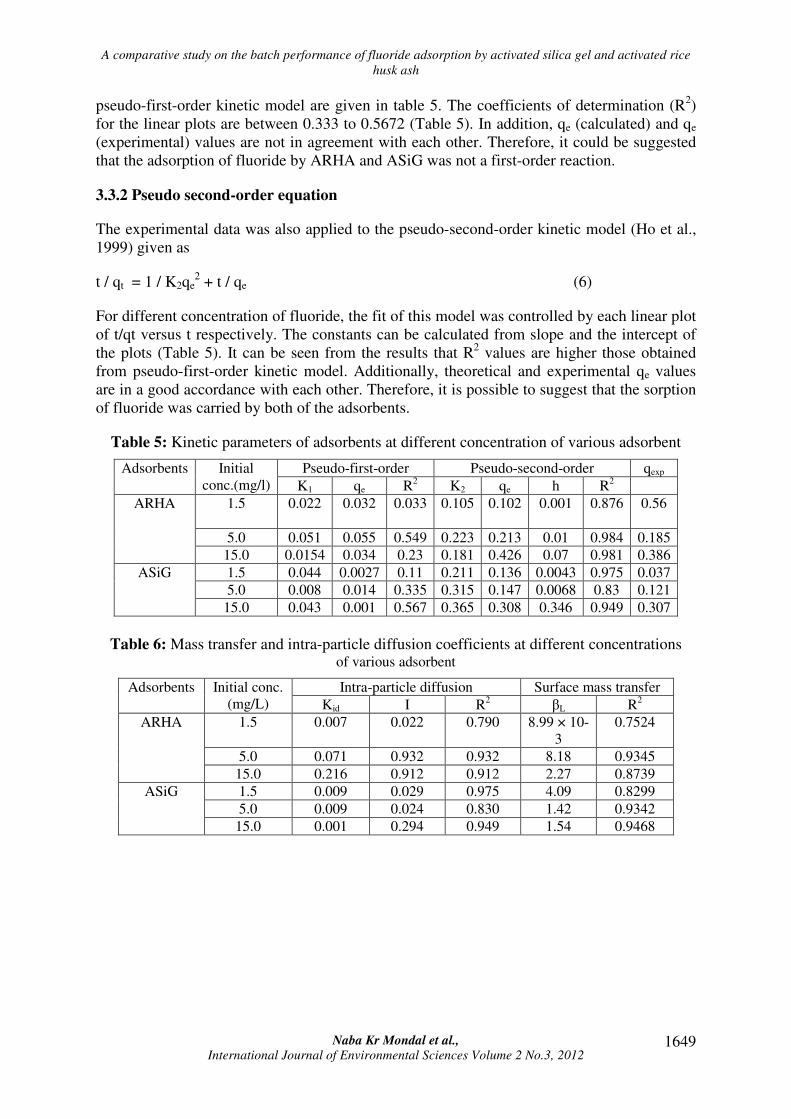
3.3.2 Pseudo second-order equation
The experimental data was also applied to the pseudo-second-order kinetic model (Ho et al.,
1999) given as
t / qt = 1 / K2qe2 + t / qe (6)
For different concentration of fluoride, the fit of this model was controlled by each linear plot
of t/qt versus t respectively. The constants can be calculated from slope and the intercept of
the plots (Table 5). It can be seen from the results that R2 values are higher those obtained
from pseudo-first-order kinetic model. Additionally, theoretical and experimental qe values
are in a good accordance with each other. Therefore, it is possible to suggest that the sorption
of fluoride was carried by both of the adsorbents.
Table 5: Kinetic parameters of adsorbents at different concentration of various adsorbent
Pseudo-first-order Pseudo-second-order qexp Adsorbents Initial
conc.(mg/l) K1 qe R2 K2 qe h R
2
1.5
0.022 0.032 0.033 0.105 0.102 0.001 0.876 0.56
5.0 0.051 0.055 0.549 0.223 0.213 0.01 0.984 0.185
ARHA
15.0 0.0154 0.034 0.23 0.181 0.426 0.07 0.981 0.386
1.5 0.044 0.0027 0.11 0.211 0.136 0.0043 0.975 0.037
5.0 0.008 0.014 0.335 0.315 0.147 0.0068 0.83 0.121
ASiG
15.0 0.043 0.001 0.567 0.365 0.308 0.346 0.949 0.307
Table 6: Mass transfer and intra-particle diffusion coefficients at different concentrations of various adsorbent
Intra-particle diffusion Surface mass transfer Adsorbents Initial conc.
(mg/L) Kid I R2 βL R
2
1.5 0.007 0.022 0.790 8.99 × 10-
3
0.7524
5.0 0.071 0.932 0.932 8.18 0.9345
ARHA
15.0 0.216 0.912 0.912 2.27 0.8739
1.5 0.009 0.029 0.975 4.09 0.8299
5.0 0.009 0.024 0.830 1.42 0.9342
ASiG
15.0 0.001 0.294 0.949 1.54 0.9468
A comparative study on the batch performance of fluoride adsorption by activated silica gel and activated rice
husk ash
Naba Kr Mondal et al., International Journal of Environmental Sciences Volume 2 No.3, 2012
1650
Figure 4: Pseudo-second order kinetic plots for adsorption of fluoride onto ARHA at
different concentrations
Figure 5: Pseudo-second order kinetic plots for adsorption of fluoride onto ASiG at different
concentrations
3.3.3 Surface mass transfer coefficient
The external mass transfer diffusion model and intraparticle diffusion model can be applied
to investigate the effects of the boundary layer and intraparticle diffusion on the fluoride
removal process. The external mass transfer diffusion model, as an application of Fick’s laws,
expresses the evolution of the concentration of the solute in the solution. The intra-particle
mass transfer diffusion model has been extensively applied in adsorbate-adsorbent systems.
In this work the model chosen refer to the theories developed by Weber and Morris (1963).
A comparative study on the batch performance of fluoride adsorption by activated silica gel and activated rice
husk ash
Naba Kr Mondal et al., International Journal of Environmental Sciences Volume 2 No.3, 2012
1651
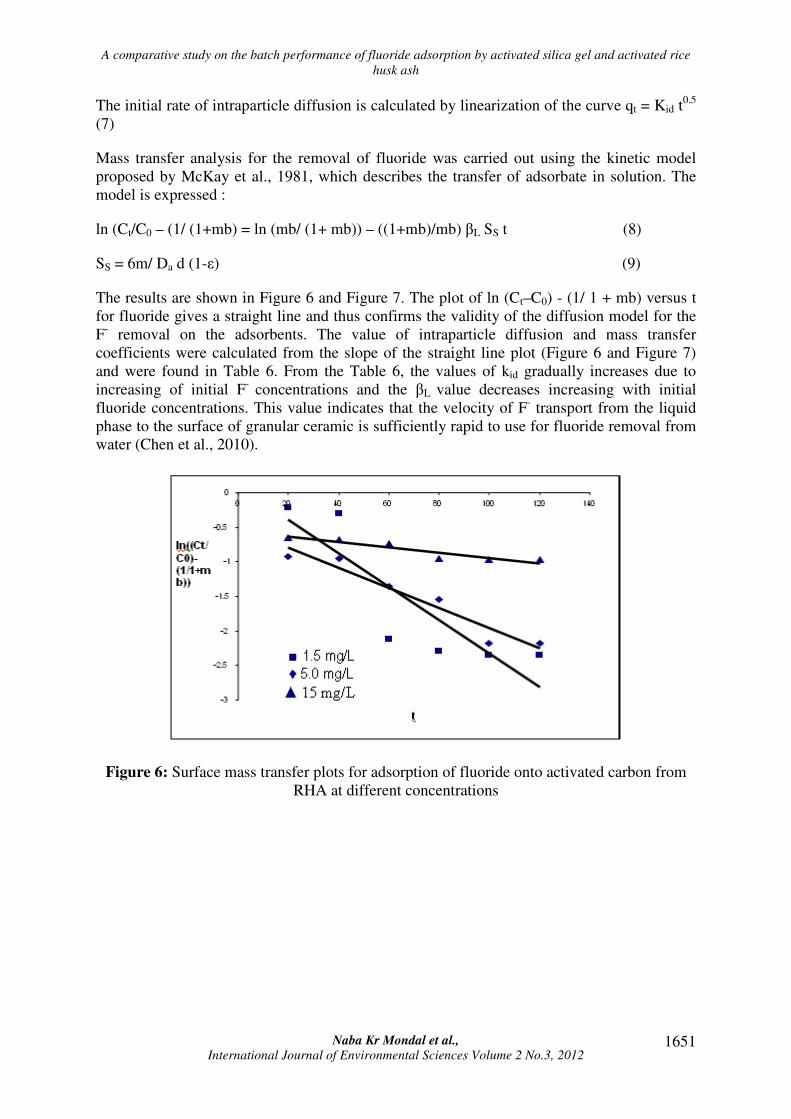
The initial rate of intraparticle diffusion is calculated by linearization of the curve qt = Kid t0.5
(7)
Mass transfer analysis for the removal of fluoride was carried out using the kinetic model
proposed by McKay et al., 1981, which describes the transfer of adsorbate in solution. The
model is expressed :
ln (Ct/C0 – (1/ (1+mb) = ln (mb/ (1+ mb)) – ((1+mb)/mb) βL SS t (8)
SS = 6m/ Da d (1-ε) (9)
The results are shown in Figure 6 and Figure 7. The plot of ln (Ct–C0) - (1/ 1 + mb) versus t
for fluoride gives a straight line and thus confirms the validity of the diffusion model for the
F- removal on the adsorbents. The value of intraparticle diffusion and mass transfer
coefficients were calculated from the slope of the straight line plot (Figure 6 and Figure 7)
and were found in Table 6. From the Table 6, the values of kid gradually increases due to
increasing of initial F-
concentrations and the βL value decreases increasing with initial
fluoride concentrations. This value indicates that the velocity of F- transport from the liquid
phase to the surface of granular ceramic is sufficiently rapid to use for fluoride removal from
water (Chen et al., 2010).
Figure 6: Surface mass transfer plots for adsorption of fluoride onto activated carbon from
RHA at different concentrations

A comparative study on the batch performance of fluoride adsorption by activated silica gel and activated rice
husk ash
Naba Kr Mondal et al., International Journal of Environmental Sciences Volume 2 No.3, 2012
1652
Figure 7: Surface mass transfer plots for adsorption of fluoride onto ASiG at different
concentrations
Figure 6 and Figure 7 show the variation of the adsorption loading and dimensionless
concentration ln (Ct/C0)-(1/1+mb) versus time (t). For all the concentration employed there is
a monotonic inverse in the adsorption loading with time. It is interesting that at low initial
concentration, fluoride ion is removed maximum from the solution. Thus, the overall
adsorption process is not influenced by external mass transfer diffusion (Lv et al., 2006).
3.4 Effect of initial concentration of fluoride
The effect of varying the initial fluoride concentration on process of adsorption for the ASiG
(4.0g) and ARHA (2.4g) was studied and is shown in Figure 8. It can be seen that in both the
case the percentage of removal of fluoride increased with decreasing initial fluoride
concentration. The minimum residual concentration of fluoride obtained is 0.585 mg/L and
0.147 mg/L with an initial concentration 5 mg/L for activated silica gel and activated rice
husk ash respectively. When the initial concentration of fluoride is 1.5 mg/L, the adsorption
loading of fluoride is the highest 0.149 mg/L for ARHA and 0.033 mg/L for ASiG (Table 7).
0 2 4 6 8 1 0 1 2 1 4 1 6
6 0
6 5
7 0
7 5
8 0
8 5
9 0
9 5
1 0 0
% o
f A
dsro
ption
I n i t ia l c o n c e n t r a t io n ( m g / L ) A R H A
A S iG
Figure 8: Effect of initial concentration (mg/L) on the adsorption of fluoride at an adsorbent
dose 2.4 g/100ml (ARHA) and 4.0 g/100ml (ASiG); pH 2.0; contact time 100 minutes;
temperature 303K

A comparative study on the batch performance of fluoride adsorption by activated silica gel and activated rice
husk ash
Naba Kr Mondal et al., International Journal of Environmental Sciences Volume 2 No.3, 2012
1653
Table 7: Effect of initial concentration (mg/L) on the adsorption of fluoride by ARHA and
ASiG (pH 2.0; adsorbent dose 2.4 g/100ml (ARHA) and 4.0 g/100ml (ASiG);contact time 100
minutes; volume of the solution 100 ml; agitation speed 250 rpm and temperature 303K)
ARHA ASiG
Initial
concentration
(mg/L)
% of removal qe Initial
concentration
(mg/L)
% of
removal
qe
1.5 90.03 0.056 1.5 97.8 0.037
3.0 90.81 0.115 3.0 97.1 0.073
5.0 88.30 0.184 5.0 96.7 0.121
7.0 76.14 0.222 7.0 88.4 0.155
10.0 70.78 0.235 10.0 86.2 0.215
15.0 61.67 0.386 15.0 81.8 0.307
3.5 Adsorption isotherms
Analysis of isotherm is very important for designing the sorption process. The experimental
data were fitted with Langmuir, Freundlich Tempkin and Dubinin-Radishkevich isotherm.
Langmuir sorption isotherm models the monolayer coverage of the sorption surfaces and
assumes that sorption take places on a structurally homogeneous surface of the adsorbent
(Tor et al., 2009).
Langmuir
This isotherm is given as (Langmuir, 1916):
qe = (Q0 b Ce) / (1 + bCe) (10)
The Langmuir parameters were obtained by fitting the experimental data to the linearized
equation derived (Salim et al., 2009) from Eq. (10):
1/qe = (1/b Q0) 1/Ce + 1/Q0 (11)
The essential features of a Langmuir isotherm can be expressed in terms of a dimensionless
constant separation factor or equilibrium parameter, RL which is defined by Hall and
Vermeylem (1966) as
RL = 1 / (1+bC0) (12)
The values of RL indicate the type of isotherm to be irreversible (RL = 0), favorable (0 < RL <
1), linear ( RL = 1) or unfavorable ( RL > 1) (Ouazene et al., 2010).
Freundlich
Freundlich equation is derived to model, the multilayer adsorption for the sorption on
heterogeneous surfaces. The Freundlich model is formulated as (Freundlich 1906):
qe = Kf (Ce)1/n
(13)
The Freundlich parameters were obtained by fitting the experimental data to the linearized
equation derived from Eq. (13)

A comparative study on the batch performance of fluoride adsorption by activated silica gel and activated rice
husk ash
Naba Kr Mondal et al., International Journal of Environmental Sciences Volume 2 No.3, 2012
1654
log qe = log Kf + 1/n log Ce (14)
The above equation is linearized and a plot of log qe versus log Ce will give a straight line of
slope 1/n and intercept Kf.
Tempkin
The Tempkin isotherm (Wasewar et al., 2009) contains a factor that explicitly takes in
account adsorbing species- adsorbate interactions. This isotherm assumes that (i) the heat of
adsorption of all molecules in the layer decreases with coverage due to adsorbate-adsorbent
interaction, and (ii) adsorption is characterized by a uniform distribution of binding energies,
up to some maximum binding energy. The Tempkin isotherm is represented by the following
equation:
qe = RT ln (KT Ce) / b (15)
Equation (15) can be linearized as in equation (16).
qe = B1 ln KT + B1 ln Ce (16)
Where, B1 = RT / b
Regression of qe versus ln C
e enables the determination of isotherm constants K
T and B
1.
Dubinin-Radushkevich
The Dubinin–Radushkevich (D–R) isotherm is more general than the Langmuir isotherm,
because it does not assume a homogeneous surface or constant sorption potential (Oguz,
2005), it is used usually investigate about the heterogeneity of the surface energies and has
the following formulation:
qe = qm exp(−Kε2) (17)
ε is equal to RT ln(1 + (1/Ce) (Kalavathya et al., 2010). The saturation limit qm may represent
the total specific microspores volume of the adsorbent (Erdem et al., 2004). The D-R
constants qm (mg/g) and K (mol2/J
2) can be determined from the intercept and slope of the
plot between ln qe versus ε2. Figure 9 and 10 show the Langmuir, Freundlich, D-R and
Tempkin the experimental data. The isotherm constants and R2 values for each model are
given in Table 8.
In this investigation, the Freundlich, the Langmuir, Tempkin and the Dubinin-Radishkevich
(D-R) isotherm model were used to describe the equilibrium data. The Langmuir isotherm
constants b and Q0 were calculated from the slope and intercept of the plot between qe and Ce.
The isotherm showed good fit to the experimental data with high correlation coefficients in
case of ARHA over ASiG (Figure 9 and Figure 10). Freundlich constants Kf and 1/n were
calculated from the intercept and slope of the straight line of the plot log qe versus log Ce.
From Table 8, it is seen that the sorption capacity (Kf) higher in case of ASiG. The magnitude
of n gives a measured of favorability of adsorption. The values of n between 1 and 10 (i.e. 1/n
less than 1) represents a favorable sorption. For the present study the value of n also
represented the same trend in both the adsorbent but 1/n value a little less in case of silica
representing a beneficial sorption. In order to distinguish between physical and chemical bio-
A comparative study on the batch performance of fluoride adsorption by activated silica gel and activated rice
husk ash
Naba Kr Mondal et al., International Journal of Environmental Sciences Volume 2 No.3, 2012
1655
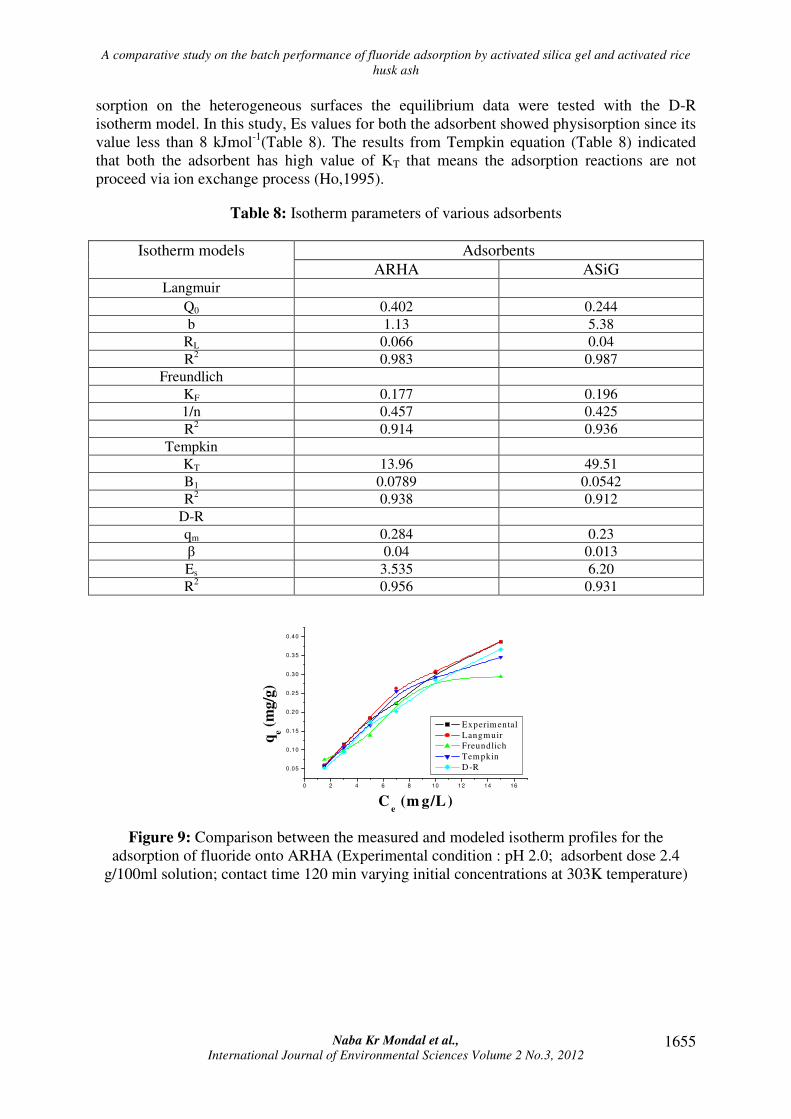
sorption on the heterogeneous surfaces the equilibrium data were tested with the D-R
isotherm model. In this study, Es values for both the adsorbent showed physisorption since its
value less than 8 kJmol-1
(Table 8). The results from Tempkin equation (Table 8) indicated
that both the adsorbent has high value of KT that means the adsorption reactions are not
proceed via ion exchange process (Ho,1995).
Table 8: Isotherm parameters of various adsorbents
Adsorbents Isotherm models
ARHA ASiG Langmuir
Q0 0.402 0.244
b 1.13 5.38 RL 0.066 0.04 R
2 0.983 0.987
Freundlich
KF 0.177 0.196
1/n 0.457 0.425
R2 0.914 0.936
Tempkin
KT 13.96 49.51
B1 0.0789 0.0542
R2 0.938 0.912
D-R
qm 0.284 0.23
β 0.04 0.013
Es 3.535 6.20
R2 0.956 0.931
0 2 4 6 8 10 12 14 16
0.05
0.10
0.15
0.20
0.25
0.30
0.35
0.40
qe (
mg/g
)
Ce (m g/L)
Experimental
Langmuir
Freundlich
Tempkin
D-R
Figure 9: Comparison between the measured and modeled isotherm profiles for the
adsorption of fluoride onto ARHA (Experimental condition : pH 2.0; adsorbent dose 2.4
g/100ml solution; contact time 120 min varying initial concentrations at 303K temperature)

A comparative study on the batch performance of fluoride adsorption by activated silica gel and activated rice
husk ash
Naba Kr Mondal et al., International Journal of Environmental Sciences Volume 2 No.3, 2012
1656
0 2 4 6 8 1 0 1 2 1 4 1 6
0 .0 0
0 .0 5
0 .1 0
0 .1 5
0 .2 0
0 .2 5
0 .3 0
0 .3 5
qe (
mg/L
)
Ce ( m g /L )
E x p e r im e n ta l
L a n g m u i r
F re u n d l ic h
T e m p k in
D - R
Figure 10: Comparison between the measured and modeled isotherm profiles for the
adsorption of fluoride onto ASiG (Experimental condition : pH 2.0; adsorbent dose 2.4
g/100ml solution; contact time 120 min varying initial concentrations at 303K temperature
3.6 Instrumental analysis of adsorbent
3.6.1 Fourier Transform Infrared Analysis (FTIR)
The FTIR spectrum of RHA was recorded to obtain the information regarding the stretching
and bending vibrations of the functional groups which are involved in the adsorption of the
adsorbate molecules. The FTIR spectra of ARHA before adsorption of fluoride and after
fluoride adsorption are shown in Figure 11 (a, b). The FTIR spectral analysis of ARHA
shows distinct peaks at 3434, 2924, 2851, 1637, 1102 and 793 cm-1
. The broad and strong
band at 3434 cm-1
indicates the presence of –OH stretching. The –CH2 stretching vibration
could be ascribed to the band that appeared at 2850 cm-1
. The strong peak at 1637 cm-1
shows
the presence of carbonate group. Absorption at 793 cm-1
is due to carbon-halide stretching
vibration. Hence, FTIR spectral analysis demonstrates the existence of functional groups like
–CH2, -OH, -CO3 and –X on the surface of ARHA. After fluoride adsorption the intensity of
hydroxyl carbonate and halide bands of the adsorbent are little than those of the adsorbent
before adsorption of fluoride. Strong adsorption band of 3434 cm-1
(indicative of –OH
stretching vibrations) shifted to 3424 cm-1
after fluoride adsorption. The results suggest that
fluoride interact with –OH, -CO3 and carbonate functional group present in ARHA.
Figure 11: FTIR spectra of unloaded (b) and fluoride loaded (a) ARHA
3.6.2 SEM imaging

A comparative study on the batch performance of fluoride adsorption by activated silica gel and activated rice
husk ash
Naba Kr Mondal et al., International Journal of Environmental Sciences Volume 2 No.3, 2012
1657
SEM analysis is another useful tool for the analysis of the surface morphology of an
adsorbent. The porous and irregular surface structure of the adsorbent can be clearly observed
in the SEM image shown in Figure (12-15). The SEM structure of ARHA before and after
adsorption of fluoride showed little variation of surface structure. The heterogeneous pores
and cavities provided a large exposed surface area for the adsorption of fluoride. The size of
pores is clear indicative of the expected adsorption of fluoride onto the surface of the ARHA.
The BET surface area, average pore diameter and average particle size of the adsorbent were
36.44 m2/g, 42.603
0A and 150.47 µm respectively.
Figure 12: Photograph for ARHA before passing fluoride solution.(1000 magnification)
Figure 13: Photograph for ARHA before passing fluoride solution.(2000 magnification)

A comparative study on the batch performance of fluoride adsorption by activated silica gel and activated rice
husk ash
Naba Kr Mondal et al., International Journal of Environmental Sciences Volume 2 No.3, 2012
1658
Figure 14: Photograph for ARHA after passing fluoride solution.(1000 magnification)
Figure 15: Photograph for ARHA after passing fluoride solution.(2000 magnification)
4. Conclusion
In this study the ability of ARHA and ASiG to remove fluoride from aqueous solution was
investigated. The operational parameters such as pH, initial fluoride concentration, adsorbent
dose and contact time were found to have an effect on the adsorption efficiency of ARHA
and ASiG. The maximum adsorption of fluoride was found at pH 2.0 for both the adsorbent.
According to Langmuir model the maximum adsorption capacity was found in case of ARHA
and ASiG were 0.402 mg/g and 0.244 mgg
-1 respectively. The equilibrium was attained at
100 minutes for both the adsorbents, but percentage of removal was 88.30 and 96.7 for
ARHA and ASiG respectively. Further the adsorbent ARHA was characterized by Fourier
Transform Infrared Spectroscopy (FTIR) and Scanning Electron Microscopy (SEM)
techniques. The kinetic studies revealed that the adsorption process best fit the pseudo-second
order kinetic model for both the adsorbents. Intraparticle diffusion was not the sole rate-
controlling step. The study on equilibrium sorption revealed that Langmuir isotherm model
give best fit to experimental data. The nature of adsorption of fluoride on ARHA and ASiG
was physical adsorption as inferred from the Dubinin-Radishkevich (D-R) isotherm model.
Therefore, the present study showed that both ARHA and silica gel could be used as an
adsorbent for fluoride removal but ARHA showed little better performance over ASiG.
Acknowledgement
A comparative study on the batch performance of fluoride adsorption by activated silica gel and activated rice
husk ash
Naba Kr Mondal et al., International Journal of Environmental Sciences Volume 2 No.3, 2012
1659
The authors are grateful to Dr. Aloke Ghosh, Reader, Department of Chemistry, Burdwan
University, Burdwan, West Bengal, India for recording FTIR data and they also extend their
gratitude to Dr. Srikanta Chakraborty, Incharge of SEM, USIC, University of Burdwan,
West Bengal, India for SEM study.
5. References
1. Sujana, M.G. and Anand S., (2010), Fluoride removal studies from contaminated
ground water by using bauxite. Desalination, 267(2-3), pp 222-227.
2. UNICEF Statement on fluoride in water: (2004), HYPERLINK "http://
www.fluoride.org.uk /" � http://www.fluoride.org.uk/ statements/000000_unicef.htm.
3. Ma, W., Ya, F., Han, M. and Wang, R., (2007), Characteristics of equilibrium,
kinetics studies for adsorption of fluoride on magnetic-Chitosan particle. Journal of
Hazardous Materials, 143, pp 296–302.
4. World Health Organization (WHO 1993), Guidelines for DrinkingWater Quality,
World Health Organization, Geneva, 1, pp 45-46.
5. Ndiaye, P.I., Moulin, L., Domingwez, L., Millet, Z.C. and Charbit, F., (2005),
Removal of fluoride from electronic industrial effluent by RO membrane separation.
Desalination, 173, pp 25-32.
6. Parthasarathy , N., Buffle , J. and Haerdi , W., (1986), Combined use of calcium salts
and polymeric aluminum hydroxide for defluoridation of wastewaters. Water
Research, 20, pp 443-448.
7. Simons, R., (1993), Trace element removal from ash dam waters by nanofiltration and
diffusion dialysis. Desalination, 89, pp 325-341.
8. Ruixia, L., Jinlong, G. and Hongxiao, T., (2002), Adsorption of fluoride, phosphate,
and arsenate ions on a new type of ion exchange fiber. Journal of Colloids Interface
Science, 248, pp 268–274.
9. Hu, C.Y., Lo, S.L., Kuanb, W.H. and Lee, Y.D., (2005), Removal of fluoride from
semiconductor wastewater by electrocoagulation–flotation. Water Research, 39, pp
895-901.
10. Mohapatra, D., Mishra, D., Mishra, S.P., Roychudhury, G. and Das, R.P., (2004), Use
of oxide minerals to abate fluoride from water. Journal of Colloids Interface Science,
275, pp 355-359.
11. Chen, N., Zhang, Z., Feng, C., Sugiura, N., Li, M. and Chen, R., (2010), Fluoride
removal from water by granular ceramic adsorption. Journal of Colloids Interface
Science, 348, pp 579-584.
12. Wang Y. and Reardon E.J., (2001), Activation and regeneration of soil sorbent for
defluoridation of drinking water. Applied Geochemistry, 16, pp 531-539.
A comparative study on the batch performance of fluoride adsorption by activated silica gel and activated rice
husk ash
Naba Kr Mondal et al., International Journal of Environmental Sciences Volume 2 No.3, 2012
1660
13. Hiemstra, T. and Riemsdijk, W.H., (2000), Fluoride adsorption on goethite in relation
to different types of surface sites. Journal of Colloids Interface Science, 225, pp 94-
104.
14. Sujana, M.G., Pradhan, H.K. and Anand, S., (2009), Studies on sorption of some
geomaterials for fluoride removal form aqueous solution. Journal of Hazardous
Materials, 161, pp 120-125.
15. APHA AWWA (1998), Standard Methods for the Examination of water and
wastewater, 20th
Edition, Washington, DC.
16. Deshmukh, W.S., Attar, S.J. and Waghmareh, M.D., (2009), Investigation on sorption
of fluoride in water using rice husk as an adsorbent. Nature and Environmental
Pollution Technology, 8(2), pp 217-223.
17. Tor, A., Danaoglu, N., Arslan, G. and Cengeloglu, Y., (2009), Removal of fluoride
from water by using granular red mud: Batch and column studies. Journal of
Hazardous Materials, 164, pp 271-278.
18. Calace, N., Nardi, E. and Petronio, B.M., (2002), Adsorption of phenols by pepermill
sludges, Journal of Environmental Pollution, 118, pp 315-319.
19. Cengeloglu, Y., Kir, E. and Ersoz, M., (2002), Removal of fluoride from aqueous
solution by using red mud. Separation and Purification Technology, pp 81–86.
20. Tor, A., (2006), Removal of fluoride from an aquous solution by using
montmorillonite. Desalination, 201, pp 267-276.
21. Lv, L., He, Jing., Wei, Min., Evans, D.G. and Duan, X., (2006), Factors influencing
the removal of fluoride from aqueous solution by calcined Mg–Al–CO3 layered
double hydroxides. Journal of Hazardous Materials, 133(B), pp 119-128.
22. Lagergren, S. and Svenska, K., (1898), About the theory of so called adsorption of
soluble substances. K. Sven. Vetenskapsad. Handl, 24(4), pp 1-39.
23. Ho, Y.S. and McKay, G., (1999), Pseudo-second order model for sorption processes.
Process Biochemistry, 34 pp 451
24. Weber, W.J. Jr. and Morris, J.C., (1963), Kinetics of adsorption on carbon from
solution. Journal Sanitary Engineering Division Proceedings: American Society of
Civil Engineers, 89, pp 31-59.
25. McKay, G., Otterburn, M.S. and Sweeney, A.G., (1981), Surface Mass Transfer
Processes during colour removal from effluent using silica. Water Resarch, 115, pp
327-331.
26. Langmuir, I., (1916), The constitution and fundamental properties of solids and liquid.
Journal of American Chemical Society, 38, pp 2221-2295.
27. Salim.M., (2009), Lead removal from aquoues solution using Silica Ceramic:
Adsorption Kinetics and Equilibrium Studies. International journal of Chemistry, 1(1),
pp 23-30.

A comparative study on the batch performance of fluoride adsorption by activated silica gel and activated rice
husk ash
Naba Kr Mondal et al., International Journal of Environmental Sciences Volume 2 No.3, 2012
1661
28. Hall, K.R. and Vermeylem, T., (1966), Pore-and solid- diffusion kinetics in fixed bed
adsorption under constant-pattern condition. Industrial and Engineering Chemistry
Fundamentals, 5(2), pp 212-223.
29. Ouazene, N. and Sahmoune, M.N., (2010), Equilibrium and Kinetic Modelling of
Astrazon Yellow Adsorption by Sawdust: Effect of Important Parameters.
International Journal of Chemical Reactor Engineering, 8: Article A151.
30. Freundlich, H.M.F., (1906), Umber die adsorption in losungen. Zeitschrift fur
Physikalische Chemie. 57A, pp 385-470.
31. Wasewar K. L., Kumar S. and
Prasad, B., (2009), Adsorption of Tin Using Granular
Activated Carbon. Journal of Environmental Protection Science, 3, pp 41-52.
32. Oguz, E., (2005), Thermodynamic and kinetic investigations of PO4 3− adsorption on
blast furnace slag. Journal of Colloids Interface Sciince, 281, p 62.
33. Kalavathy, H., Karthik, B. and Miranda, L.R., (2010), Removal and recovery of Ni
and Zn from aqueous solution using activated carbon from Hevea brasiliensis: Batch
and column studies. Colloids Surface B: Biointerfaces, 78, pp 291-302.
34. Erdem, E., Karapinar, N. and Donat, R., (2004), The removal of heavy metal cations
by natural zeolites. Journal of Colloids Interface Science, 280, pp 309–314.
35. Ho, Y.S., (1995), Adsorption of heavy metals from waste streams by peat. Ph. D.
thesis, University of Birmingham, UK.